COSMOS-Web: The Role of Galaxy Interactions and Disk Instabilities
in Producing Starbursts at
Abstract
We study of the role of galaxy-galaxy interactions and disk instabilities in producing starburst activity in galaxies out to . For this, we use a sample of 387 galaxies with robust total star formation rate measurements from Herschel, gas masses from ALMA, stellar masses and redshifts from multi-band photometry, and JWST/NIRCam rest-frame optical imaging. Using mass-controlled samples, we find an increased fraction of interacting galaxies in the starburst regime at all redshifts out to . This increase correlates with star formation efficiency (SFE), but not with gas fraction. However, the correlation is weak (and only significant out to ), which could be explained by the short duration of SFE increase during interaction. In addition, we find that isolated disk galaxies make up a significant fraction of the starburst population. The fraction of such galaxies with star-forming clumps (“clumpy disks”) is significantly increased compared to the main-sequence disk population. Furthermore, this fraction directly correlates with SFE. This is direct observational evidence for a long-term increase of SFE maintained due to disk instabilities, contributing to the majority of starburst galaxies in our sample and hence to substantial mass growth in these systems. This result could also be of importance for explaining the growth of the most massive galaxies at .
1 Introduction
For most of their lives, star-forming galaxies follow the main-sequence (e.g., Noeske et al., 2007; Daddi et al., 2007; Elbaz et al., 2007), a tight relation between stellar mass and star formation rate (SFR) set by an equilibrium state between gas consumption, outflow, and inflow (Davé et al., 2012; Lilly et al., 2013; Feldmann, 2015). The scatter of this relation () is set by oscillations around that equilibrium, driven by constant adjustment of the galaxies’ SFR to the available cold gas and replenishing gas inflows. Stronger oscillations are observed mostly in low-mass galaxies at low and local redshifts, while at higher redshifts galaxies across all masses seem to show such a behavior (e.g., Weisz et al., 2012; Emami et al., 2019; Faisst et al., 2019). In addition to these oscillations, galaxies experience significant bursts of star formation, elevating their SFRs by factors of and more above the main sequence (Sanders & Mirabel, 1996). The fraction of starburst galaxies to the total population increases with redshift from at (Bergvall et al., 2016) to at (Bisigello et al., 2018; Rodighiero et al., 2011) and higher fractions at higher redshifts depending on stellar mass (Sargent et al., 2012; Caputi et al., 2017; Bisigello et al., 2018). Interactions between gas-rich galaxies lead to the inflow and compression of gas and are, therefore, usually the prerequisites for starbursts (e.g., Sanders & Mirabel, 1996; Cox et al., 2008; Genzel et al., 2010; Kartaltepe et al., 2012; Hung et al., 2013; Hopkins et al., 2018; Cibinel et al., 2019; Moreno et al., 2021; Shah et al., 2022). However, some simulations and observations suggest that starbursts and galaxy major mergers do not have to be necessarily causally connected (e.g., Rodighiero et al., 2011; Kaviraj et al., 2013; Sparre & Springel, 2016; Fensch et al., 2017; Wilkinson et al., 2022; Li et al., 2023a; Liu et al., 2023). In addition to starbursts, disk instabilities in gas-rich galaxies (Toomre, 1964; Bournaud et al., 2007) could increase the rate of star formation without external interactions, hence contributing to the starburst population (e.g., Wang & Silk, 1994; Immeli et al., 2004; Tadaki et al., 2018; Dekel et al., 2009) and the build-up of bulge-dominated galaxies later on (e.g., Bouwens et al., 1999). The above shows that the origin of starbursts is, therefore, complex, and the definitive link between galaxy interactions, disk structure, increased star formation efficiency (SFE), and gas fraction out to high redshift has yet to be studied with robust measurements and comprehensive samples.
The works by Liu et al. (2019) and Scoville et al. (2023) are likely the most comprehensive sub-mm dust-based studies (in terms of sample size and redshift coverage) on the relation between gas and star formation properties of main-sequence and starburst galaxies to date. They combine robust SFRs from Herschel, gas fraction and SFE measurements from ALMA, and other parameters (such as stellar masses) from comprehensive multi-band photometry for galaxies out to . Specifically, Scoville et al. (2023) found that starbursts at a given redshift and stellar mass are primarily triggered due to enhanced SFE rather than a high gas fraction. Similar results have been found in independent studies by Silverman et al. (2015) and Tacconi et al. (2018) using large-sample CO data (for a review see Tacconi et al., 2020). On the other hand, an increase in the gas fraction is likely responsible for the maintained high specific SFRs at high redshift (e.g., Tacconi et al., 2010; Genzel et al., 2015; Tacconi et al., 2018; Freundlich et al., 2019; Liu et al., 2019; Gowardhan et al., 2019; Dessauges-Zavadsky et al., 2020).
In this work, we explore the population of starburst galaxies out to in terms of their interactions, disk structure, SFE, and gas fractions. Specifically, we aim to study the role of galaxy-galaxy interactions and disk instabilities in producing starburst activity. To this end, we combine the Scoville et al. (2023) sample with high-resolution rest-frame optical imaging from the COSMOS-Web JWST/NIRCam imaging (Casey et al., 2023a).
After summarizing the data (Section 2), we detail the morphological classification in Section 3. In Section 4, we present the results and we conclude in Section 5. Throughout this work, we assume a CDM cosmology with , , and and magnitudes are given in the AB system (Oke, 1974). We use a Chabrier (2003) initial mass function (IMF) for stellar masses and SFRs.
2 Sample and Basic Measurements
For this work, we use a sample of 387 galaxies out to . This sample is a sub-sample of the galaxies from Scoville et al. (2023) (see more details in earlier works; Scoville et al. 2014, 2016, 2017) requiring existing JWST imaging. The selected galaxy sample is best for carrying out this study as it includes
-
1.
robust measurements of total SFR from UVfar-IR Herschel and ALMA measurements;
-
2.
measured molecular gas masses from far-IR dust continuum observations with ALMA;
-
3.
measured stellar masses and accurate photometric redshifts from multi-band photometry; and
-
4.
deep sub-kpc resolution JWST rest-frame optical and near-IR imaging data.
The galaxies reside in the COSMOS field (Scoville et al., 2007; Koekemoer et al., 2007), which provides a wealth of ancillary data including X-ray and radio measurements, Hubble rest-frame UV and optical imaging, as well as spectroscopic redshifts for more than half of the sample. In the following, we summarize the different data products, basic measurements, and sample properties.
2.1 Photometry and Imaging
UV and Optical Photometry
All photometric redshifts, UV-based SFRs, and stellar masses are based on the multi-band COSMOS2020 catalog photometry (Weaver et al., 2022). Obvious AGNs are removed from the sample by a combination of SED fitting with AGN template and selection in X-ray and radio emission. The dust-unobscured star formation is measured from the emission constrained by the best-fit SED. Stellar masses are derived using LePhare (Arnouts et al., 1999; Ilbert et al., 2006), assuming a variety of templates, ages, metallicities, and dust attenuations. Uncertainties in SFRs and stellar masses are generally less than a factor of two (Weaver et al., 2022). Spectroscopic redshifts are available for 58% of the galaxies in our sample from various surveys (e.g., Le Fèvre et al. 2015; Hasinger et al. 2018; Khostovan et al. in prep.) and suggest a photometric redshift accuracy better than . Note that refitting stellar masses and other properties with redshifts fixed to would not significantly change the conclusions of this work.

JWST Imaging (for morphology)
JWST provides rest-frame optical/NIR imaging at resolution from two cycle 1 GO programs: COSMOS-Web (PID 1727; PIs: Kartaltepe & Casey; Casey et al., 2023a) covering of the COSMOS field and PRIMER-COSMOS (PID 1837; PI: Dunlop) covering the CANDELS-COSMOS field. In this work we make use of the full COSMOS-Web dataset including the NIRCam F115W, F150W, F277W, and F444W filters over the full area. PRIMER-COSMOS uses F090W, F150W, F200W, F277W, F356W, F410M, and F444W. MIRI imaging is not used here due to the small area coverage and shallow depth. See Franco et al. (2023) for the details of the JWST data reduction. These rest-frame optical/NIR JWST observations are crucial to trace the bulk of stellar mass, as rest-frame UV imaging would be biased to unobscured star-forming regions in the galaxies and therefore could mislead the identification of merging system (see Cibinel et al., 2019). (However, we note that rest-frame UV imaging is used to identify galaxies with star-forming clumps.)
Herschel Photometry and Measurements
Infrared photometry is derived from various data available for the COSMOS field: at by Spitzer (Sanders et al., 2007); at and by Herschel-PACS (Poglitsch et al., 2010) as part of the PACS Evolutionary Probe program (PEP; Lutz et al., 2011); at , , and by Herschel-SPIRE (Griffin et al., 2010) as part of the Herschel Multi-tiered Extragalactic Survey (HerMES; Oliver et al., 2012). For the flux extraction a linear inversion technique of cross-identification (“XID”, Roseboom et al., 2010, 2012) is used based on positional priors from the Spitzer catalog and VLA data (Le Floc’h et al., 2009; Schinnerer et al., 2010). All sources are detected at in at least two of the five Herschel bands. For detailed information on de-blending algorithms we refer to appendix C2 in Scoville et al. (2023) as well as Lee et al. (2013). The infrared SFRs are measured from the total infrared luminosity via . This assumes that all stellar light is dust obscured in the first (and none thereafter). The derived infrared SFRs would increase by for dust-enshrouded time scales of (Scoville & Murchikova, 2013). The infrared luminosity is measured by integrating over a modified black body (Casey, 2012) fit to the infrared photometry (see Scoville et al. 2023 for more details). The infrared SFRs are combined with the UV SFRs to obtain the total star formation rates.
ALMA Continuum Measurements
The molecular ISM gas masses are derived from the Rayleigh-Jeans (RJ) dust continuum (rest-frame ) as described in Scoville et al. (2014). The ratio was calibrated over a range of galaxy types (main-sequence, starburst, luminous infrared galaxies) out to . The RJ continuum is derived from archival ALMA bands and observations (at significance) as of June 2021. Only data with uv coverage resolving a source extend of is used for robust flux measurements. The fluxes and their uncertainties are derived from least-squares fitting. Some sources may be extended more than . Hence, we measure both the peak and integrated flux (corrected for the fraction of the synthesized beam falling outside of the aperture) and use the maximum of both as the final flux measurements (see appendix C3 in Scoville et al. 2023).

2.2 Definitions and Sample Properties
We define the molecular gas fraction as and the star-formation efficiency based on the total UVIR SFR as in units of . The depletion time () is the inverse of the SFE. To calculate (the logarithmic offset from the star-forming main-sequence at a given stellar mass), we assume the main-sequence parameterization from Lee et al. (2015), which is based on Herschel measurements of individual galaxies and stacked samples on the COSMOS field. We emphasize that Herschel observations are crucial for deriving robust of starburst galaxies, often dominated by dust-obscured star formation. The use of other parameterizations (e.g., Speagle et al., 2014; Schreiber et al., 2015) lead to similar and have a minimal impact on the final results of this work.
Figure 1 shows the dependence of SFE and on stellar mass and for our selected 387 galaxies in different redshift bins. The underlying hex bins show the full sample from Scoville et al. (2023). This shows that our selected sub-sample traces the full sample properties closely. In addition, note that correlates well with SFE and less with , as it has been found in various works including that of Silverman et al. (2015) and Scoville et al. (2014).
There are mainly two selection biases to be noted. These are due to the requirement of Herschel and ALMA detections for the computation of accurate far-IR SFRs and gas masses. First, the high-redshift sample is biased towards high . Second, low stellar masses are biased towards high . While the first bias is not of a large concern (our analysis will be done in separate redshift bins), the second bias may introduce unphysical relations with stellar mass. We therefore mitigate that bias by introducing mass-controlled samples for the following analysis by adopting two mass bins for each redshift range. We found that two stellar mass bins are sufficient to mitigate the bias and more mass bins would reduce the sample and decrease the statistical robustness. However, due to the small sample at , we only adopt a single mass bin for the highest redshifts. We define the mass cuts in each of the redshift bins based on Figure 1 to remove any significant dependence between stellar mass and within the mass-binned sub-samples. The adopted mass bins (in ) are [10.1,10.8] and [10.8,11.7] for , [10.4,11.1] and [11.1,11.8] for , [10.7,11.1] and [11.1,11.7] for , and [10.7,11.2] for (all redshift bins with ). Changing these mass bins in a reasonable range () does not affect the final conclusions of this work.
3 Structural Analysis
3.1 Visual classification
We perform a visual classification of the 387 galaxies using all of the COSMOS-Web JWST NIRCam filters. This way we are able to minimize the effects of color-dependent morphology and robustly identify bluer star-forming regions inside the galaxies. RGB color images are also used to identify companions (mergers) and reject background/foreground galaxies. In the following, we define four morphological groups:
-
Non-Interacting. Isolated galaxies of various kinds, such as disk or compact galaxies, that are not in an interacting state.
-
Disk Galaxies. These are extended galaxies (to be distinguished from compact galaxies), preferentially with a semi-minor to semi-major axis ratio of less than and a disk structure. The disk can either be face-on or edge-on.
-
Clumpy Disks. This is a subset of the Disk Galaxies category, showing more than one star-forming clump. The clumps are pronounced in the bluer bands but visible throughout redder wavelengths. Due to limitations in resolution and confusion with interacting systems, we have not classified clumpy disks at redshifts in this work.
-
Interacting. Interacting or irregular galaxy systems are identified by multiple nuclei, irregular structures, or tidal features. This category should include mainly galaxy systems in pre-merger and post-merger phases.
We caution that without kinematic information from spectroscopy, it is nearly impossible to identify close-pair mergers. The Interacting group therefore mostly focuses on the pre- and post-merger phases. In the following, we denote the fraction of interacting galaxies in our sample with . The fraction of clumpy disk galaxies compared to the total disk galaxy population in a given selection bin is denoted as . We derive the uncertainties on these fractions using the formalism of binomial statistics presented in Cameron (2011).
Figure 2 shows examples of our classification scheme in four redshift bins. The redshifts and galaxy types are indicated on each cutout, as well as and SFE. Note the clear distinction of disk galaxies with and without clumps.
4 Results
4.1 The Impact of Galaxy-Galaxy Interactions on Starburst Activity
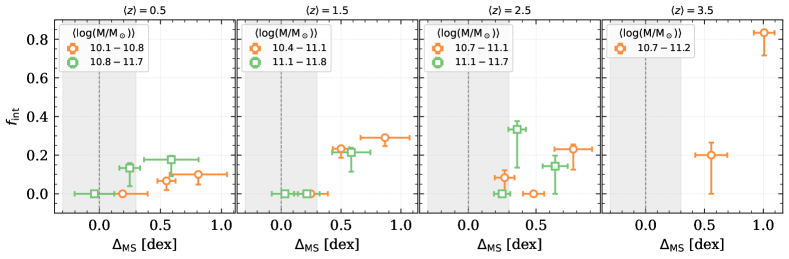
We first compare the fraction of interacting systems to the offset from the main sequence, the gas fraction, and the star formation efficiency.
The top panel in Figure 3 shows the fraction of interacting galaxies as a function of in two different mass bins per redshift. The fraction clearly increases off the main sequence (indicated by the gray area) towards higher and reaches at and at . Note that here we focus on the relative fractions, which are more reliable than the absolute values of , which depend on a given selection and therefore should be taken with a grain of salt. The two mass bins show very similar behaviors. Keeping this in mind, an increase of the fraction of interacting systems towards higher redshifts is found, which is in agreement with a global increase in the merger fraction studied in other works (e.g., Tasca et al., 2014; Romano et al., 2021). Overall, this is consistent with the theory of galaxy-galaxy interactions playing some role in inducing starburst activity. Here we show that this may be the case out to . We also note that this is in line with and directly related to the increased fraction of interacting galaxies found at higher infrared luminosities (cf. study at by Hung et al., 2013).
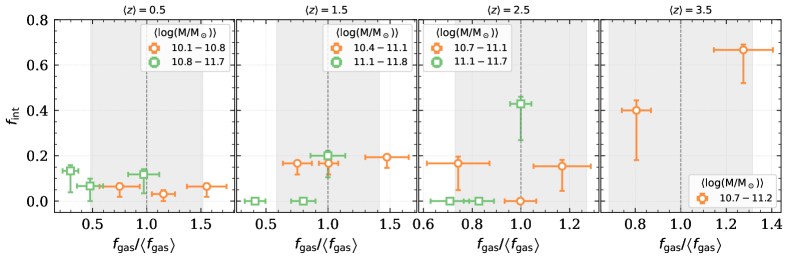
It is suggested that gas fraction is weakly correlated to starburst activity (e.g., Scoville et al., 2023) and we therefore would not expect a significant correlation between and . The middle panels of Figure 3 show that this is indeed the case by displaying as a function gas fraction of galaxies relative to the population mean (i.e. for a given stellar mass and redshift). No significant correlation between those quantities is seen in either stellar mass bins.
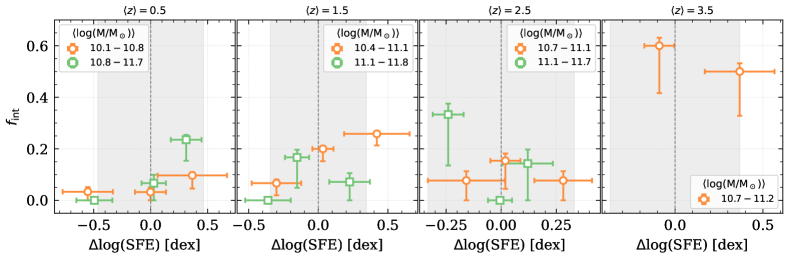
Finally, the lower panels in Figure 3 show as a function of SFE (relative to the mean of the population at a given redshift and stellar mass). Up to , we find a clear trend of galaxies with a higher-than-average SFE residing more frequently in interacting systems, specifically in the lower mass bin. At higher redshifts, this trend is diluted. We argue below that the different time scales between a SFE increase and visually identified merger stages may be responsible for washing out a clear correlation between these quantities.
Overall, we found that the fraction of interacting galaxies is increased in the starburst regime out to and correlates with SFE but not gas fraction (at least out to ). Galaxy-galaxy interactions therefore represent a veritable way to push galaxies into the starburst region at redshifts beyond cosmic noon. However, our analysis also shows that interacting galaxies only make up at most of starburst galaxies in our sample. This implies that non-interacting systems contribute significantly to the starburst population. The increase of star formation (efficiency) through disk instabilities could provide another avenue for galaxies to reach to starburst regime (see Section 1). In this case, we would expect a higher fraction of disk galaxies with pronounced star-forming clumps in the starburst regime. This is studied in the next section.
4.2 The Impact of Disk Instabilities on Starburst Activity
A significant fraction () of galaxies in the starburst regime in our sample are non-interacting (i.e. isolated) disk galaxies. These may have been interacting in the past, however, taking the current morphological evidence at face value shows that they are currently not in a merging state. A possible way to reach the starburst regime is through an increased SFE due to the instability in gas-rich disks. The idea (see, for example, Dekel et al., 2009) here is that gas-rich streams increase the gas density of the disk, which then becomes unstable and starts to fragment into clumps (Toomre instability; Toomre, 1964). These clumps can contribute to several percent of the total disk’s mass and star formation is maintained in dense sub-clumps over timescales of . Steady inbound gas streams on the disk maintain the instability of the disk and replenish gas over several Gyrs. Eventually, the clumps might migrate towards the center due to dynamical friction and may form spheroid-dominated galaxies later on.
The occurrence of UV-bright star forming clumps in galaxies is ubiquitous at high redshifts (about of galaxies contain bright UV clumps; Cowie et al., 1995; Conselice et al., 2004; Elmegreen et al., 2013; Guo et al., 2015; Soto et al., 2017; Zanella et al., 2019). Several studies support the formation of these clumps through in situ physical processes – based on differences in the evolution of the clump fraction and minor/major mergers, the disk-nature of their host galaxies and similarly the kinematic properties of ordered disks rotation with high velocity dispersion, the distribution of clumps within a scale height, and their stellar mass function being similar to local star clusters and H II regions (see Shibuya et al., 2016; Elmegreen et al., 2017; Dessauges-Zavadsky & Adamo, 2018; Girard et al., 2020). A recent study of a lensed clumpy galaxy at (Dessauges-Zavadsky et al., 2023) corroborates the picture in which clumps are formed in situ through disk instabilities.
Along these lines, Wang & Silk (1994) presents a simple recipe to link star formation to disk instability. In this simple theoretical model, the SFE (as defined here as SFE/Mgas) is proportional to:
| (1) |
where is the Toomre disk instability parameter, with the epicyclic frequency, the radial cloud velocity dispersion, the gas surface density, and the gravitational constant. A similar expression can be derived from the analytical model presented in Dekel et al. (2009, see their equation 47). Equation 1 is valid for an unstable disk, i.e. . According to this model, the more unstable the disk, the more stars per surface are formed. Consequently, SFE rises as as (see Equation 1). We emphasize the simplicity of this model as stars can also be formed if , however, may be a condition of exceptional star formation. Note, that by simply applying empirical correlations we get
| (2) |
where we have used that (Tacconi et al., 2018) and with (e.g., Yang et al., 2021). We therefore would expect only a weak stellar mass dependence. If disk instabilities are at work to push disk galaxies into the starburst regime, we would expect an increase of galaxies with a number of dense star-forming clumps embedded in their disks for higher . That fraction would not significantly depend on stellar mass.
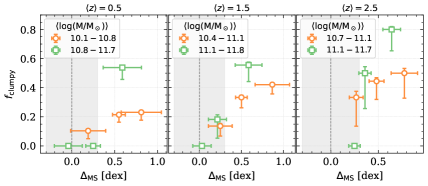
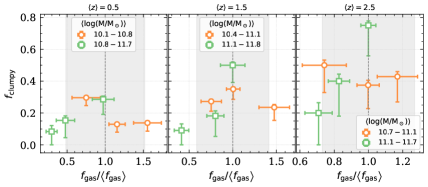
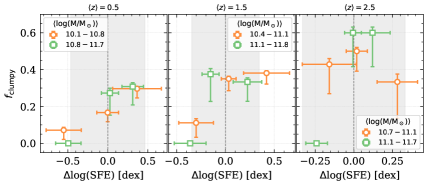
The top panel of Figure 4 shows the fraction of clumpy disk galaxies (with respect to the isolated disk galaxy population) as a function of for the same stellar mass bins as in Figure 3 and three redshift bins. We observe indeed an increase in the clumpy disk fraction towards the starburst regime. In the center and lower panels of Figure 4, we provide a comparison of with gas fraction and SFE normalized to the population mean per bin. We find that the fraction of clumpy disks increases with both and SFE, however, the correlation with the latter is more pronounced. As expected, we do not find significant differences in that behavior for the different stellar mass bins.
Figure 5 shows the above results more quantitatively by indicating how much and SFE differs (expressed in values) between disk galaxies on the main sequence and in the starburst regime (defined as above main sequence). Averaged over redshifts up to , the difference between of main-sequence and starburst galaxies is , while they differ by in SFE. This suggests that disk galaxies appear in the starburst population mainly due to an increased SFE (achieved through disk instabilities) and not an increase in the gas fraction. An increase in may contribute at higher redshifts as the difference in SFE and becomes comparable between two types of galaxy populations.

5 Discussion & Conclusions
In this work, we have collected a sample of galaxies to investigate the properties of starbursts out to in terms of their morphology, gas fraction, and star formation efficiencies. Our sample is well fit for this investigation, as all galaxies have robust total (UVfar-IR) star formation rates, gas mass measurements, and high-resolution optical to near-IR imaging from JWST. In summary, these are our two main findings:
-
•
We find a significant enhancement of the fraction of interacting galaxies in the starburst regime out to . This fraction correlates with SFE (but less with ) out to , but no significant correlation is found between .
-
•
A large fraction of starburst galaxies in our sample are non-interacting disks ( depending on redshift). We find that the fraction of clumpy disk galaxies with respect to the disk population is enhanced in the starburst regime. This increase correlates more significantly with SFE than .
The former of these findings suggests that galaxy-galaxy interactions are a way to push galaxies into the starburst regime by increasing the efficiency of star formation in the galaxies. This has been observed at lower redshifts and is suggested by simulations (Sanders & Mirabel, 1996; Genzel et al., 2010; Kartaltepe et al., 2012; Hung et al., 2013; Hopkins et al., 2018; Cibinel et al., 2019; Renaud et al., 2019; Moreno et al., 2021; Wilkinson et al., 2022; He et al., 2023; Shah et al., 2022). Specifically, we showed that the fraction of interacting galaxies increases with increasing out to . However, we also find that the interacting fraction does correlate with SFE only out to , while the correlation becomes weaker in the earlier universe. This is also indicated by some simulation results (e.g., Fensch et al., 2017; Patton et al., 2020), and could suggest a weaker correlation between interaction and SFE increase, or that such a correlation occurs on a shorter timescale, before the cosmic noon. It also suggests that galaxy-galaxy interactions may not be the prime avenue to cause starbursts at – instead (as shown in Section 4.2), disk instabilities could be a more common path as clearly correlates with out to at least .
We note that even in the case of a strong 1-to-1 correlation between and SFE, this signal could be diluted leading to no significant correlation between these two quantities. The main reason for this is the different time scales probed here. Specifically, we would expect an increase in star formation (and hence SFE assuming little changes in the gas mass) triggered through the compression of gas upon close interaction within a few (Lotz et al., 2008; Teyssier et al., 2010; Cenci et al., 2023). Star formation traced by optical emission line indicators (e.g., H) may provide the closest link between SFE increase and close interactions. In fact, simulations show that infrared SFR tracers can lag behind as far-IR light is emitted mostly after coalescence when sufficient amounts of metals and dust have been produced (e.g., Lotz et al., 2008). Therefore, while a strong increase in SFE can be observed in close mergers, the late and early-stage mergers (averaging over many ) selected in our classification may not directly trace a SFE increase (see also Teyssier et al., 2010; Shah et al., 2022). Thus averaged over the whole sample of interacting galaxies, the correlation between and SFE can be significantly diluted due to the mismatch in time scales and the short time-span of increased SFE (or likewise SFR) during interactions.
The significant fraction of non-interacting disk galaxies in our sample defined as starbursts indicates another avenue other than galaxy-galaxy interactions at work to offset galaxies from the main sequence (cf. starburst rotators found at , e.g., Förster Schreiber et al., 2011). Other studies (e.g., Wilkinson et al., 2022) have found similar fractions, and in this work we have studied the properties of these galaxies. As shown by Equation 1 and also by recent simulation work (Cenci et al., 2023), disk instabilities can cause an increase in SFE, which can push galaxies above the main sequence. We expect that this effect may be largely independent of stellar mass (Equation 2). The enhanced fraction of clumpy disk galaxies in the starburst population of isolated disk galaxies in our sample and the coupling between and SFE are direct observational indications of disk instabilities in action.
It is interesting that while the fraction of clumpy disks shows a significant correlation with SFE, the fraction of interacting galaxies does not. This could suggest that the SFE increase due to disk instabilities is maintained over longer timescales (compared to merger-driven enhancement as discussed above), thus it is statistically more easily to observe a correlation. The factor of higher fraction of galaxies with clumps at high compared to interacting galaxies is an additional indication of a longer sustained increase of SFE through disk instabilities.
More detailed analyses, including kinematic measurements with JWST or ALMA, are necessary to study the effect of interactions on starburst galaxies in more detail. Specifically, H observations would provide an important constraint on the more instantaneous SFE. At higher redshifts, a statistical study of star forming clumps in starburst disk galaxies would reveal their properties, specifically their ages and star formation densities, similarly to what has been achieved at by multiple IFU programs (e.g., Förster Schreiber & Wuyts, 2020).
Further characterization of star-forming clumps in larger galaxy samples will additionally become important in understanding the role of disk instabilities in growing the most massive galaxies at the highest redshifts. A possible model to explain the high star formation efficiencies needed to produce the most massive galaxies during the Epoch of Reionization (e.g., Harikane et al., 2023; Xiao et al., 2023; Casey et al., 2023b) are localized regions of essentially feedback-free star formation (e.g., Dekel et al., 2023; Li et al., 2023b). This model specifically works in low-metallicity regions that are self-shielded from significant external stellar winds. In such a regime, stars are efficiently formed before the feedback introduced by supernovae starts (for more details see Dekel et al., 2023). A way to form these dense pockets of star formation could be through violent disk instabilities in gas-rich galaxies fed by pristine low-metallicity gas. Interestingly, such a scenario may have been recently observed in a lensed galaxy hosting star-forming clumps (Fujimoto et al., 2024). The high gas surface density of the clumps () suggests an overall star formation efficiency (assuming star formation takes place in the clumps) that is higher (Fukushima & Yajima, 2021) than for typical main-sequence galaxies with densities , assuming star formation takes place in their extended disks (e.g., Dessauges-Zavadsky et al., 2020; Tacconi et al., 2018). The contribution of the clumps to the integrated star formation is expected to be significant () in this case, in contrast of other studies finding contributions in the low tens of per-cent in galaxies after the cosmic noon (Elbaz et al., 2018; Cibinel et al., 2017; Hodge et al., 2016). The integrated of that galaxy is , thus not significantly higher than main-sequence galaxies at a similar redshift (, Dessauges-Zavadsky et al., 2020). If disk instabilities play an important role in increasing the star formation efficiency (as shown by our work and recently by Fujimoto et al. 2024), the most massive galaxies in the early universe (although they look compact) may show similar structures on resolved to scales of (unless other formation channels are present such as monolithic collapse, e.g., Eggen et al., 1962). Such scales can currently only be probed by gravitational lensing, however, later this may be possible with diffraction limited observations using the next generation of large telescopes such as the Thirty Meter Telescope (TMT) or the European Extremely Large Telescope (ELT).
References
- Arnouts et al. (1999) Arnouts, S., Cristiani, S., Moscardini, L., et al. 1999, MNRAS, 310, 540, doi: 10.1046/j.1365-8711.1999.02978.x
- Astropy Collaboration et al. (2013) Astropy Collaboration, Robitaille, T. P., Tollerud, E. J., et al. 2013, A&A, 558, A33, doi: 10.1051/0004-6361/201322068
- Astropy Collaboration et al. (2018) Astropy Collaboration, Price-Whelan, A. M., Sipőcz, B. M., et al. 2018, AJ, 156, 123, doi: 10.3847/1538-3881/aabc4f
- Bergvall et al. (2016) Bergvall, N., Marquart, T., Way, M. J., et al. 2016, A&A, 587, A72, doi: 10.1051/0004-6361/201525692
- Bisigello et al. (2018) Bisigello, L., Caputi, K. I., Grogin, N., & Koekemoer, A. 2018, A&A, 609, A82, doi: 10.1051/0004-6361/201731399
- Bournaud et al. (2007) Bournaud, F., Elmegreen, B. G., & Elmegreen, D. M. 2007, ApJ, 670, 237, doi: 10.1086/522077
- Bouwens et al. (1999) Bouwens, R., Cayón, L., & Silk, J. 1999, ApJ, 516, 77, doi: 10.1086/307096
- Cameron (2011) Cameron, E. 2011, PASA, 28, 128, doi: 10.1071/AS10046
- Caputi et al. (2017) Caputi, K. I., Deshmukh, S., Ashby, M. L. N., et al. 2017, ApJ, 849, 45, doi: 10.3847/1538-4357/aa901e
- Casey (2012) Casey, C. M. 2012, MNRAS, 425, 3094, doi: 10.1111/j.1365-2966.2012.21455.x
- Casey et al. (2023a) Casey, C. M., Kartaltepe, J. S., Drakos, N. E., et al. 2023a, ApJ, 954, 31, doi: 10.3847/1538-4357/acc2bc
- Casey et al. (2023b) Casey, C. M., Akins, H. B., Shuntov, M., et al. 2023b, arXiv e-prints, arXiv:2308.10932, doi: 10.48550/arXiv.2308.10932
- Cenci et al. (2023) Cenci, E., Feldmann, R., Gensior, J., et al. 2023, arXiv e-prints, arXiv:2309.09046, doi: 10.48550/arXiv.2309.09046
- Chabrier (2003) Chabrier, G. 2003, PASP, 115, 763, doi: 10.1086/376392
- Cibinel et al. (2017) Cibinel, A., Daddi, E., Bournaud, F., et al. 2017, MNRAS, 469, 4683, doi: 10.1093/mnras/stx1112
- Cibinel et al. (2019) Cibinel, A., Daddi, E., Sargent, M. T., et al. 2019, MNRAS, 485, 5631, doi: 10.1093/mnras/stz690
- Conselice et al. (2004) Conselice, C. J., Grogin, N. A., Jogee, S., et al. 2004, ApJ, 600, L139, doi: 10.1086/378556
- Cowie et al. (1995) Cowie, L. L., Hu, E. M., & Songaila, A. 1995, AJ, 110, 1576, doi: 10.1086/117631
- Cox et al. (2008) Cox, T. J., Jonsson, P., Somerville, R. S., Primack, J. R., & Dekel, A. 2008, MNRAS, 384, 386, doi: 10.1111/j.1365-2966.2007.12730.x
- Daddi et al. (2007) Daddi, E., Dickinson, M., Morrison, G., et al. 2007, ApJ, 670, 156, doi: 10.1086/521818
- Davé et al. (2012) Davé, R., Finlator, K., & Oppenheimer, B. D. 2012, MNRAS, 421, 98, doi: 10.1111/j.1365-2966.2011.20148.x
- Dekel et al. (2009) Dekel, A., Sari, R., & Ceverino, D. 2009, ApJ, 703, 785, doi: 10.1088/0004-637X/703/1/785
- Dekel et al. (2023) Dekel, A., Sarkar, K. C., Birnboim, Y., Mandelker, N., & Li, Z. 2023, MNRAS, 523, 3201, doi: 10.1093/mnras/stad1557
- Dessauges-Zavadsky & Adamo (2018) Dessauges-Zavadsky, M., & Adamo, A. 2018, MNRAS, 479, L118, doi: 10.1093/mnrasl/sly112
- Dessauges-Zavadsky et al. (2020) Dessauges-Zavadsky, M., Ginolfi, M., Pozzi, F., et al. 2020, A&A, 643, A5, doi: 10.1051/0004-6361/202038231
- Dessauges-Zavadsky et al. (2023) Dessauges-Zavadsky, M., Richard, J., Combes, F., et al. 2023, MNRAS, 519, 6222, doi: 10.1093/mnras/stad113
- Eggen et al. (1962) Eggen, O. J., Lynden-Bell, D., & Sandage, A. R. 1962, ApJ, 136, 748, doi: 10.1086/147433
- Elbaz et al. (2007) Elbaz, D., Daddi, E., Le Borgne, D., et al. 2007, A&A, 468, 33, doi: 10.1051/0004-6361:20077525
- Elbaz et al. (2018) Elbaz, D., Leiton, R., Nagar, N., et al. 2018, A&A, 616, A110, doi: 10.1051/0004-6361/201732370
- Elmegreen et al. (2013) Elmegreen, B. G., Elmegreen, D. M., Sánchez Almeida, J., et al. 2013, ApJ, 774, 86, doi: 10.1088/0004-637X/774/1/86
- Elmegreen et al. (2017) Elmegreen, B. G., Elmegreen, D. M., Tompkins, B., & Jenks, L. G. 2017, ApJ, 847, 14, doi: 10.3847/1538-4357/aa88d4
- Emami et al. (2019) Emami, N., Siana, B., Weisz, D. R., et al. 2019, ApJ, 881, 71, doi: 10.3847/1538-4357/ab211a
- Faisst et al. (2019) Faisst, A. L., Capak, P. L., Emami, N., Tacchella, S., & Larson, K. L. 2019, ApJ, 884, 133, doi: 10.3847/1538-4357/ab425b
- Feldmann (2015) Feldmann, R. 2015, MNRAS, 449, 3274, doi: 10.1093/mnras/stv552
- Fensch et al. (2017) Fensch, J., Renaud, F., Bournaud, F., et al. 2017, MNRAS, 465, 1934, doi: 10.1093/mnras/stw2920
- Förster Schreiber et al. (2011) Förster Schreiber, N. M., Shapley, A. E., Erb, D. K., et al. 2011, ApJ, 731, 65, doi: 10.1088/0004-637X/731/1/65
- Förster Schreiber & Wuyts (2020) Förster Schreiber, N. M., & Wuyts, S. 2020, ARA&A, 58, 661, doi: 10.1146/annurev-astro-032620-021910
- Franco et al. (2023) Franco, M., Akins, H. B., Casey, C. M., et al. 2023, arXiv e-prints, arXiv:2308.00751, doi: 10.48550/arXiv.2308.00751
- Freundlich et al. (2019) Freundlich, J., Combes, F., Tacconi, L. J., et al. 2019, A&A, 622, A105, doi: 10.1051/0004-6361/201732223
- Fujimoto et al. (2024) Fujimoto, S., Ouchi, M., Kohno, K., et al. 2024, arXiv e-prints, arXiv:2402.18543, doi: 10.48550/arXiv.2402.18543
- Fukushima & Yajima (2021) Fukushima, H., & Yajima, H. 2021, MNRAS, 506, 5512, doi: 10.1093/mnras/stab2099
- Genzel et al. (2010) Genzel, R., Tacconi, L. J., Gracia-Carpio, J., et al. 2010, MNRAS, 407, 2091, doi: 10.1111/j.1365-2966.2010.16969.x
- Genzel et al. (2015) Genzel, R., Tacconi, L. J., Lutz, D., et al. 2015, ApJ, 800, 20, doi: 10.1088/0004-637X/800/1/20
- Girard et al. (2020) Girard, M., Mason, C. A., Fontana, A., et al. 2020, MNRAS, 497, 173, doi: 10.1093/mnras/staa1907
- Gowardhan et al. (2019) Gowardhan, A., Riechers, D., Pavesi, R., et al. 2019, ApJ, 875, 6, doi: 10.3847/1538-4357/ab0b3c
- Griffin et al. (2010) Griffin, M. J., Abergel, A., Abreu, A., et al. 2010, A&A, 518, L3, doi: 10.1051/0004-6361/201014519
- Guo et al. (2015) Guo, Y., Ferguson, H. C., Bell, E. F., et al. 2015, ApJ, 800, 39, doi: 10.1088/0004-637X/800/1/39
- Harikane et al. (2023) Harikane, Y., Ouchi, M., Oguri, M., et al. 2023, ApJS, 265, 5, doi: 10.3847/1538-4365/acaaa9
- Hasinger et al. (2018) Hasinger, G., Capak, P., Salvato, M., et al. 2018, ApJ, 858, 77, doi: 10.3847/1538-4357/aabacf
- He et al. (2023) He, H., Bottrell, C., Wilson, C., et al. 2023, ApJ, 950, 56, doi: 10.3847/1538-4357/acca76
- Hodge et al. (2016) Hodge, J. A., Swinbank, A. M., Simpson, J. M., et al. 2016, ApJ, 833, 103, doi: 10.3847/1538-4357/833/1/103
- Hopkins et al. (2018) Hopkins, P. F., Wetzel, A., Kereš, D., et al. 2018, MNRAS, 480, 800, doi: 10.1093/mnras/sty1690
- Hung et al. (2013) Hung, C.-L., Sanders, D. B., Casey, C. M., et al. 2013, ApJ, 778, 129, doi: 10.1088/0004-637X/778/2/129
- Ilbert et al. (2006) Ilbert, O., Arnouts, S., McCracken, H. J., et al. 2006, A&A, 457, 841, doi: 10.1051/0004-6361:20065138
- Immeli et al. (2004) Immeli, A., Samland, M., Gerhard, O., & Westera, P. 2004, A&A, 413, 547, doi: 10.1051/0004-6361:20034282
- Kartaltepe et al. (2012) Kartaltepe, J. S., Dickinson, M., Alexander, D. M., et al. 2012, ApJ, 757, 23, doi: 10.1088/0004-637X/757/1/23
- Kaviraj et al. (2013) Kaviraj, S., Cohen, S., Windhorst, R. A., et al. 2013, MNRAS, 429, L40, doi: 10.1093/mnrasl/sls019
- Koekemoer et al. (2007) Koekemoer, A. M., Aussel, H., Calzetti, D., et al. 2007, ApJS, 172, 196, doi: 10.1086/520086
- Le Fèvre et al. (2015) Le Fèvre, O., Tasca, L. A. M., Cassata, P., et al. 2015, A&A, 576, A79, doi: 10.1051/0004-6361/201423829
- Le Floc’h et al. (2009) Le Floc’h, E., Aussel, H., Ilbert, O., et al. 2009, ApJ, 703, 222, doi: 10.1088/0004-637X/703/1/222
- Lee et al. (2013) Lee, N., Sanders, D. B., Casey, C. M., et al. 2013, ApJ, 778, 131, doi: 10.1088/0004-637X/778/2/131
- Lee et al. (2015) —. 2015, ApJ, 801, 80, doi: 10.1088/0004-637X/801/2/80
- Li et al. (2023a) Li, Y. A., Ho, L. C., & Shangguan, J. 2023a, ApJ, 953, 91, doi: 10.3847/1538-4357/acdddb
- Li et al. (2023b) Li, Z., Dekel, A., Sarkar, K. C., et al. 2023b, arXiv e-prints, arXiv:2311.14662, doi: 10.48550/arXiv.2311.14662
- Lilly et al. (2013) Lilly, S. J., Carollo, C. M., Pipino, A., Renzini, A., & Peng, Y. 2013, ApJ, 772, 119, doi: 10.1088/0004-637X/772/2/119
- Liu et al. (2019) Liu, D., Schinnerer, E., Groves, B., et al. 2019, ApJ, 887, 235, doi: 10.3847/1538-4357/ab578d
- Liu et al. (2023) Liu, Z., Silverman, J. D., Daddi, E., et al. 2023, arXiv e-prints, arXiv:2311.14809, doi: 10.48550/arXiv.2311.14809
- Lotz et al. (2008) Lotz, J. M., Jonsson, P., Cox, T. J., & Primack, J. R. 2008, MNRAS, 391, 1137, doi: 10.1111/j.1365-2966.2008.14004.x
- Lutz et al. (2011) Lutz, D., Poglitsch, A., Altieri, B., et al. 2011, A&A, 532, A90, doi: 10.1051/0004-6361/201117107
- Moreno et al. (2021) Moreno, J., Torrey, P., Ellison, S. L., et al. 2021, MNRAS, 503, 3113, doi: 10.1093/mnras/staa2952
- Noeske et al. (2007) Noeske, K. G., Weiner, B. J., Faber, S. M., et al. 2007, ApJ, 660, L43, doi: 10.1086/517926
- Oke (1974) Oke, J. B. 1974, ApJS, 27, 21, doi: 10.1086/190287
- Oliver et al. (2012) Oliver, S. J., Bock, J., Altieri, B., et al. 2012, MNRAS, 424, 1614, doi: 10.1111/j.1365-2966.2012.20912.x
- Patton et al. (2020) Patton, D. R., Wilson, K. D., Metrow, C. J., et al. 2020, MNRAS, 494, 4969, doi: 10.1093/mnras/staa913
- Poglitsch et al. (2010) Poglitsch, A., Waelkens, C., Geis, N., et al. 2010, A&A, 518, L2, doi: 10.1051/0004-6361/201014535
- Renaud et al. (2019) Renaud, F., Bournaud, F., Agertz, O., et al. 2019, A&A, 625, A65, doi: 10.1051/0004-6361/201935222
- Rodighiero et al. (2011) Rodighiero, G., Daddi, E., Baronchelli, I., et al. 2011, ApJ, 739, L40, doi: 10.1088/2041-8205/739/2/L40
- Rodriguez-Gomez et al. (2019) Rodriguez-Gomez, V., Snyder, G. F., Lotz, J. M., et al. 2019, MNRAS, 483, 4140, doi: 10.1093/mnras/sty3345
- Romano et al. (2021) Romano, M., Cassata, P., Morselli, L., et al. 2021, A&A, 653, A111, doi: 10.1051/0004-6361/202141306
- Roseboom et al. (2010) Roseboom, I. G., Oliver, S. J., Kunz, M., et al. 2010, MNRAS, 409, 48, doi: 10.1111/j.1365-2966.2010.17634.x
- Roseboom et al. (2012) Roseboom, I. G., Ivison, R. J., Greve, T. R., et al. 2012, MNRAS, 419, 2758, doi: 10.1111/j.1365-2966.2011.19827.x
- Sanders & Mirabel (1996) Sanders, D. B., & Mirabel, I. F. 1996, ARA&A, 34, 749, doi: 10.1146/annurev.astro.34.1.749
- Sanders et al. (2007) Sanders, D. B., Salvato, M., Aussel, H., et al. 2007, ApJS, 172, 86, doi: 10.1086/517885
- Sargent et al. (2012) Sargent, M. T., Béthermin, M., Daddi, E., & Elbaz, D. 2012, ApJ, 747, L31, doi: 10.1088/2041-8205/747/2/L31
- Schinnerer et al. (2010) Schinnerer, E., Sargent, M. T., Bondi, M., et al. 2010, ApJS, 188, 384, doi: 10.1088/0067-0049/188/2/384
- Schreiber et al. (2015) Schreiber, C., Pannella, M., Elbaz, D., et al. 2015, A&A, 575, A74, doi: 10.1051/0004-6361/201425017
- Scoville & Murchikova (2013) Scoville, N., & Murchikova, L. 2013, ApJ, 779, 75, doi: 10.1088/0004-637X/779/1/75
- Scoville et al. (2007) Scoville, N., Aussel, H., Brusa, M., et al. 2007, ApJS, 172, 1, doi: 10.1086/516585
- Scoville et al. (2014) Scoville, N., Aussel, H., Sheth, K., et al. 2014, ApJ, 783, 84, doi: 10.1088/0004-637X/783/2/84
- Scoville et al. (2016) Scoville, N., Sheth, K., Aussel, H., et al. 2016, ApJ, 820, 83, doi: 10.3847/0004-637X/820/2/83
- Scoville et al. (2017) Scoville, N., Lee, N., Vanden Bout, P., et al. 2017, ApJ, 837, 150, doi: 10.3847/1538-4357/aa61a0
- Scoville et al. (2023) Scoville, N., Faisst, A., Weaver, J., et al. 2023, ApJ, 943, 82, doi: 10.3847/1538-4357/aca1bc
- Shah et al. (2022) Shah, E. A., Kartaltepe, J. S., Magagnoli, C. T., et al. 2022, ApJ, 940, 4, doi: 10.3847/1538-4357/ac96eb
- Shibuya et al. (2016) Shibuya, T., Ouchi, M., Kubo, M., & Harikane, Y. 2016, ApJ, 821, 72, doi: 10.3847/0004-637X/821/2/72
- Silverman et al. (2015) Silverman, J. D., Daddi, E., Rodighiero, G., et al. 2015, ApJ, 812, L23, doi: 10.1088/2041-8205/812/2/L23
- Soto et al. (2017) Soto, E., de Mello, D. F., Rafelski, M., et al. 2017, ApJ, 837, 6, doi: 10.3847/1538-4357/aa5da3
- Sparre & Springel (2016) Sparre, M., & Springel, V. 2016, MNRAS, 462, 2418, doi: 10.1093/mnras/stw1793
- Speagle et al. (2014) Speagle, J. S., Steinhardt, C. L., Capak, P. L., & Silverman, J. D. 2014, ApJS, 214, 15, doi: 10.1088/0067-0049/214/2/15
- Tacconi et al. (2020) Tacconi, L. J., Genzel, R., & Sternberg, A. 2020, ARA&A, 58, 157, doi: 10.1146/annurev-astro-082812-141034
- Tacconi et al. (2010) Tacconi, L. J., Genzel, R., Neri, R., et al. 2010, Nature, 463, 781, doi: 10.1038/nature08773
- Tacconi et al. (2018) Tacconi, L. J., Genzel, R., Saintonge, A., et al. 2018, ApJ, 853, 179, doi: 10.3847/1538-4357/aaa4b4
- Tadaki et al. (2018) Tadaki, K., Iono, D., Yun, M. S., et al. 2018, Nature, 560, 613, doi: 10.1038/s41586-018-0443-1
- Tasca et al. (2014) Tasca, L. A. M., Le Fèvre, O., López-Sanjuan, C., et al. 2014, A&A, 565, A10, doi: 10.1051/0004-6361/201321507
- Teyssier et al. (2010) Teyssier, R., Chapon, D., & Bournaud, F. 2010, ApJ, 720, L149, doi: 10.1088/2041-8205/720/2/L149
- Toomre (1964) Toomre, A. 1964, ApJ, 139, 1217, doi: 10.1086/147861
- Wang & Silk (1994) Wang, B., & Silk, J. 1994, ApJ, 427, 759, doi: 10.1086/174182
- Weaver et al. (2022) Weaver, J. R., Kauffmann, O. B., Ilbert, O., et al. 2022, ApJS, 258, 11, doi: 10.3847/1538-4365/ac3078
- Weisz et al. (2012) Weisz, D. R., Johnson, B. D., Johnson, L. C., et al. 2012, ApJ, 744, 44, doi: 10.1088/0004-637X/744/1/44
- Wilkinson et al. (2022) Wilkinson, S., Ellison, S. L., Bottrell, C., et al. 2022, MNRAS, 516, 4354, doi: 10.1093/mnras/stac1962
- Xiao et al. (2023) Xiao, M., Oesch, P., Elbaz, D., et al. 2023, arXiv e-prints, arXiv:2309.02492, doi: 10.48550/arXiv.2309.02492
- Yang et al. (2021) Yang, L., Roberts-Borsani, G., Treu, T., et al. 2021, MNRAS, 501, 1028, doi: 10.1093/mnras/staa3713
- Zanella et al. (2019) Zanella, A., Le Floc’h, E., Harrison, C. M., et al. 2019, MNRAS, 489, 2792, doi: 10.1093/mnras/stz2099