Thermodynamic Signatures and Phase Transitions in High-Energy Au-Au Collisions
Murad Badshah1,***murad_phy@awkum.edu.pk, Muhammad Waqas2,†††Corresponding author: 20220073@huat.edu.cn, Muhammad Ajaz1,‡‡‡Corresponding author: ajaz@awkum.edu.pk, Wolfgang Bietenholz3§§§Corresponding author: wolbi@nucleares.unam.mx Haifa I. Alrebdi4,,¶¶¶Corresponding author: hialrebdi@pnu.edu.sa Mohamed Ben Ammar5,,
1 Department of Physics, Abdul Wali Khan University Mardan, Mardan 23200, Pakistan
2 School of Mathematics, Physics and Optoelectronic Engineering, Hubei University of Automotive Technology 442002, Shiyan, People’s Republic of China
3 Instituto de Ciencias Nucleares - Universidad Nacional Autónoma de México, Apartado Postal 70-543, CdMx 04510, Mexico
4 Department of Physics, College of Science, Princess Nourah bint Abdulrahman University, P.O. Box 84428, Riyadh 11671, Saudi Arabia
5 Faculty of Computing and Information Technology, Northern Border University, Rafha, Saudi Arabia
Abstract
In this study, we systematically investigate the dynamics of various hadrons namely , , , , , , , , and produced in central Au-Au collisions. We analyze data of AGS and RHIC, which span a broad range of collision energies, ranging from = 1.9 to 200 GeV. To analyze the transverse momentum () and transverse mass () distributions, we employ a two-component standard distribution function, achieving a very good representation of the experimental data across these energy regimes. We extract key thermodynamic parameters, including the effective temperature , the mean transverse momentum , and the initial temperature , and analyze their dependence on the values of collision energy and particle mass. Our findings reveal a distinct transition behaviour around GeV. Below GeV, the values of , , and increase monotonically for all hadrons due to higher energy transfer into the system. Above this energy threshold, these extracted parameters plateau, suggesting that the additional energy is utilized as latent heat for phase transition rather than increasing the system’s temperature. These observations delineate two distinct regions: a hadron-dominated region at lower energies and a parton-dominated region at higher energies, each potentially indicative of different phases of matter, with the latter possibly signalling the onset of a Quark-Gluon Plasma (QGP). The study thus provides critical insights into the complex interplay of thermodynamics, phase transitions, and particle interactions in high-energy Au-Au collisions.
Keywords: Identified particles; standard distribution; phase transition; freezeout parameters; RHIC beam energy scan; latent heat.
1 Introduction
While it is hard to directly probe conditions that existed 13.8 billion years ago at the dawn of our universe, contemporary physics has developed ingenious methods to recreate similar environments. One such avenue is the formation of a Quark-Gluon Plasma (QGP), a high-temperature, high-density state of matter achieved by colliding heavy ions at facilities like the Large Hadron Collider (LHC) and the Relativistic Heavy Ion Collider (RHIC) [1, 2, 3]. Upon collision, the nucleons within the interacting nuclei disintegrate, resulting in a fireball of quarks and gluons. This phenomenon signifies the phase transition from hadronic matter to a state of QGP. Interestingly, during this phase transition, the temperature of the Quantum Chromodynamics (QCD) matter exhibits unique behaviour. Despite increases in collision energy or centrality, the temperature remains remarkably stable above a certain energy threshold, typically a few GeV [4, 5]. This stability is attributed to the system’s absorption of excess energy as latent heat, akin to how the temperature of water remains constant at its boiling point while absorbing additional heat to break molecular bonds. The Alternating Gradient Synchrotron (AGS) and RHIC have conducted experiments over a diverse energy spectrum, ranging from approximately 2A GeV (2 GeV per nucleon) to 200 GeV, specifically in Au-Au collisions at varying levels of centrality. This research undertakes a rigorous analysis of data from AGS and RHIC to identify the collision energies that are most likely to induce a phase transition to a deconfined state of QCD matter.
Following the formation of QGP, the system undergoes a rapid expansion due to the substantial pressure gradients present in the collision zone. This expansion leads to cooling and, ultimately, hadronization. The process from collision initiation to hadronization involves several key stages, each characterized by specific temperatures. Initially, when the nuclei commence collision and the QGP starts to form, the relevant temperature is the initial temperature (). Subsequently, the system reaches the chemical freeze-out stage, where inelastic scattering ceases. The temperature at this juncture is known as the chemical freeze-out temperature () [6, 7, 8]. Finally, the system arrives at the thermal or kinetic freeze-out stage, characterized by the thermal or kinetic freeze-out temperature () [9, 10]. At this point, the particles become sufficiently dispersed, rendering even elastic interactions among them negligible. In addition to these temperatures, the concept of an effective temperature () is introduced, which encompasses both thermal and flow effects () in the system. It is expressed as [4], where is the mass of the observed hadron. Consistent with the system’s evolutionary stages, the hierarchy of these temperatures in the literature is [11, 12]. Understanding these phase transitions in the QGP is often mapped onto a phase diagram, akin to how the three phases of water are explained using pressure and temperature conditions. However, the QCD phase diagram, which outlines the transitions between QGP and hadronic matter, is substantially more complex and to a large extent still a matter of speculations. It is assumed to include crossover regions and second-order phase transition boundaries, adding layers of intricacy not found in simpler systems. Despite significant progress, further research is needed to fully comprehend the QCD phase diagram. In this work, our discussion will focus primarily on first-order phase transitions.
The distributions of hadrons produced in collisions serve as invaluable probes for extracting details about the collision dynamics up to the kinetic freeze-out stage. These distributions shed light on the properties of QCD matter, hadronic matter, and the phase transitions between them. To extract key parameters like , , , mean (), and the transverse flow velocity (), various statistical, hydrodynamic, and hybrid models are employed. These models include, but are not limited to, the Blast Wave Model with Boltzmann-Gibbs Statistics (BGBW model) [13, 14], Blast Wave Model with Tsallis Statistics (TBW model) [15, 16], Tsallis-Pareto type function [4], Hagedorn Model with embedded radial flow velocity [17], Hagedorn thermal model [18, 11], and the Standard Distribution function [11]. Each model relies on its own set of free parameters and has a specific domain of applicability.
The manuscript is organized as follows: Section 2 elaborates on the formalism of the two-component standard distribution function that we employ in this study. Section 3 is devoted to discussing our results and the trends in the extracted parameters. The final section offers the conclusion and summarizes the key findings of the analysis.
2 The method and formalism
The standard distribution function is rooted in classical and quantum statistics, incorporating Boltzmann-Gibbs, Bose-Einstein, and Fermi-Dirac statistics. The probability density function of the standard distribution, dependent on , is expressed as [11]
| (1) |
Or
| (2) |
Here is the rapidity, denotes the mass of the produced hadron, is the effective temperature, is the index of the standard distribution ( for fermions and for bosons), is the normalization constant. Eq. (2) represents the specific form of the standard distribution which is consistent with the ideal gas model [19]. represents the baryon chemical potential [20]. The chemical potential for a particular particle species is given by [21, 22]
| (3) |
Where is the chemical freeze-out temperature, refers to the ratio of negative to positive hadrons and in the subscript represents the particle type. The chemical freeze-out temperature is determined by [23, 24]
| (4) |
Here, represents the limiting or saturation temperature, often considered to be 0.158 GeV [25], while is the collision energy per nucleon pair in units of GeV in the centre of mass frame.
The single-component standard distribution does not cover the high region, typically 1.5 GeV/c, therefore, two, three or even multi-component standard distribution, given below, is used [11, 26]
| (5) |
Here is the contribution fraction of the one component to the other component, while the subscript represents the number of component of the model.
From = 1.9 – 62.4 GeV we take into account the finite values of in our model but beyond = 62.4 GeV, due to the almost balanced production of the particles and their anti-particles, the very small value of is neglected, and Eq. (5) can be written as,
| (6) |
In this work, we used a two-component standard distribution (Eq. (5) or Eq. (6)). The first component contributes a large fraction to the resonance decays in the very low region, while the second component has the contribution from hard scattering. It should be noted that even if the hard scattering is involved, the main contributor to the particle production is still the soft excitation process.
In order to superimpose the two components, the superposition principle has been used which is given by Eq. (7) [26, 27, 28]. To formulate Eq. 7 we use the weighted average approach. The first component of the standard distribution function can only satisfy the spectra 1.5 GeV/c, while the second component of the same function satisfies the spectra 1.5 GeV/c. The first component is characterized by and the second one is by . To get the resultant temperature () of the whole range, a weighting factor is introduced such that, 0 1 representing the fraction of in . As the maximum contribution fraction is 1 and the first component contributes , therefore, it’s natural that the contribution fraction of is and hence one can deduce the following equation for
| (7) |
This equation represents a linear interpolation between and , where acts as the interpolation parameter.
Regardless of the form of particle momentum distribution, the dependent probability density function is given as follows,
| (8) |
Which is naturally normalized to unity.
| (9) |
The mean transverse momentum, , can be obtained directly from the fit function by using the probability density function in the following form,
| (10) |
Incorporating Eq. (9) we get,
| (11) |
Similarly, the root mean square is given as,
| (12) |
The temperature of the emission sources can be calculated by using the String Percolation model [29]
| (13) |
where = is the root mean square value of .
3 Results and discussion
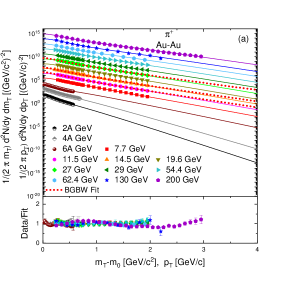
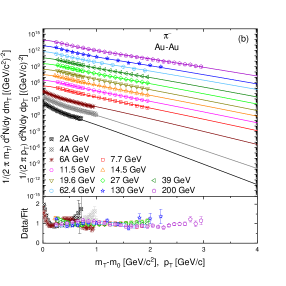
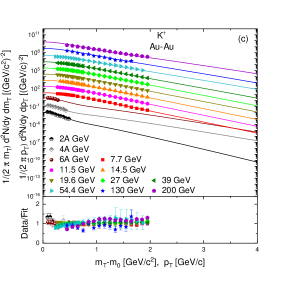
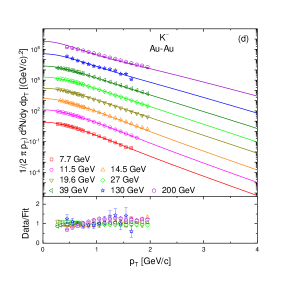
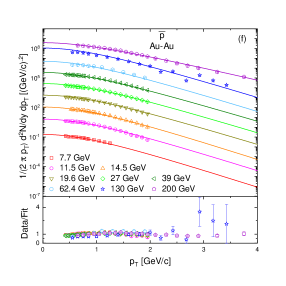
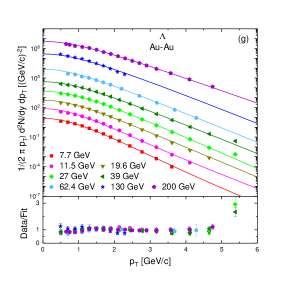
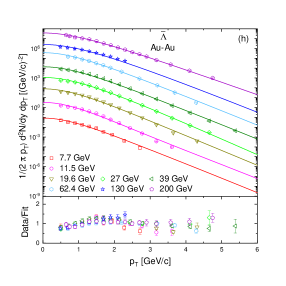
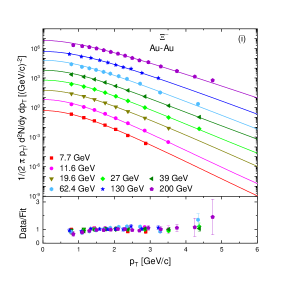
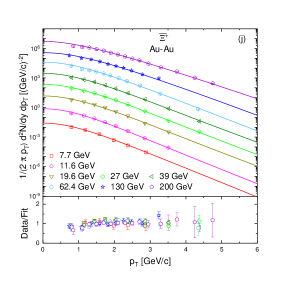
The double-differential and distributions of various produced particles in central Au-Au collisions, spanning a collision energy range of GeV, are depicted in Fig. 1(a) through Fig. 1(j). The experimental data for identified particles (, , , , and ) have been obtained from [30, 31, 32, 5, 33, 34, 35, 36] and for strange particles (, , and ) from [37, 38, 39, 40]. In these figures, distinct colours and geometric shapes are employed to represent different collision energies. Filled shapes signify particles, while hollow shapes denote anti-particles. Solid lines represent the individual fits to the data, obtained using Eq. (5) or (6). Each plot also features a Data/Fit ratio panel at the bottom to indicate the quality of the individual fit. The model yields good agreement with the experimental data. To enhance readability and distinguish between data points and fit lines for varying energies, scaling factors are applied. These factors, along with other extracted parameters and the values, are compiled in Table 1, in the Appendix. It is noteworthy that is the normalization constant which equalizes the integral of Eq. 1 to unity, i.e., it arises from . It is different from the normalization constant that appeared in Table 1 in the Appendix which is equivalent to the multiplicity parameter. is the normalization constant that arises from the fitting procedure where it is used to compare the model with the experimental data. Although is different from , the earlier is absorbable in the latter. Both and are used to have a precise description of the formalism and results.
In Fig. 1 (a) and (b) 0.05 for = 1.9 to 3.4 GeV, for 7.7 to 54.4 GeV 0.1, for 62.4 GeV 0.5 and for 130 and 200 GeV 0.35, where represents the pseudorapidity. In Fig. 1(c) 0.25 for = 1.9 to 3.4 GeV while in Fig. 1(c) and (d) at = 7.7 to 54.4 GeV, 0.1 and for = 130 and 200 GeV, = 0.35. In Fig. 1(e) 0.05 at = 1.9 to 3.4 GeV, in Fig. 1(e) and (f) for = 7.7 to 54.4 GeV 0.1, while at = 62.4 GeV 0.5 and for 130 and 200 GeV 0.35. In Fig. 1(g), (h), (i) and (j) 0.5 for = 7.7 to 39 GeV and 1 at = 62.4 GeV. In Fig. 1(g), (h), (i) and (j) 0.05 at = 130 GeV. 1 for = 200 GeV in Fig. 1(g) and (h), while in Fig. 1(i) and (j), 0.75 at = 200 GeV.
Although our model, as described by Eq. (6), is -dependent, i.e., , it can also be adapted to be -dependent, i.e., , for analyzing spectra. This adaptability arises because the and spectra are nearly identical and can be used interchangeably.

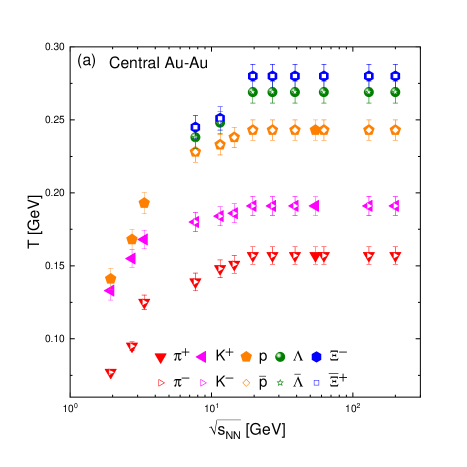
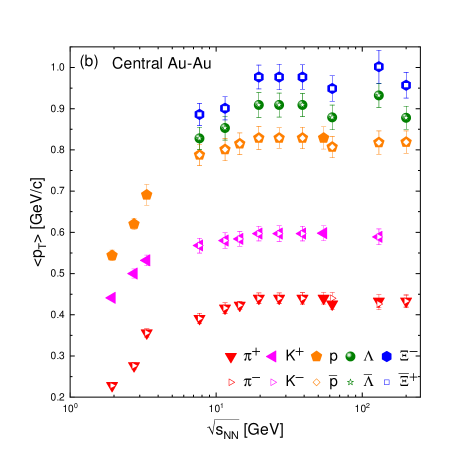
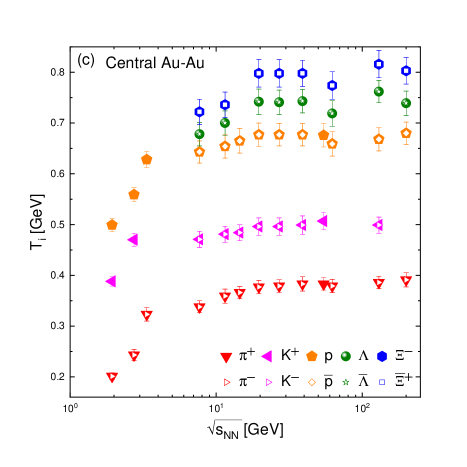
Now we explore the variations in extracted parameters as functions of both collision energy and particle mass. Fig. 2(a) depicts in relation to the collision energy and particle mass. Different symbols and colors are employed to distinguish between particle species, with filled and hollow symbols representing particles and anti-particles, respectively. Due to the symmetry in the extracted parameters for hadrons and their corresponding anti-hadrons, the data points for the hadrons are often obscured by those for the anti-hadrons. To mitigate this, we have enlarged the point sizes for the hadrons relative to the anti-hadrons. Fig. 2(b) and 2(c) follow the same conventions as Fig. 2(a) but display and , respectively. It is evident that , , and exhibit similar trends as functions of both energy and particle mass.
In Fig. 2(a), we observe that sharply increases from lower energies up to GeV, and gives a plateau thereafter up to the maximum energy of 200 GeV. This behaviour can be explained by considering two distinct energy regimes. In the first regime ( GeV), the system is baryon-dominated and lacks the energy required for a phase transition. As the collision energy increases, the system transitions from being baryon-dominated to parton-dominated, indicative of a phase transition. Specifically, rises from lower energies up to 19.6 GeV due to increased energy deposition in the system and hence the system attains a higher degree of excitation. remains constant beyond 19.6 GeV, and this plateau suggests that additional energy serves as latent heat because any energy supplied to the system beyond 19.6 GeV is totally used to melt the bonds among partons within hadrons. It is not used to rise , and and hence facilitating the phase transition to QGP from hadronic matter. The system begins its phase transition in a portion of the volume at 19.6 GeV, and as a result of the phase transition in progressively larger volumes between 19.6 and 200 GeV, it shifts from being hadron-dominated to parton-dominated. The partial phase transition begins at 19.6 GeV, and the full phase transition begins at 200 GeV. The 19.6–200 GeV energy range is the critical energy range.
It is important to note that the values of may appear larger which may be due to the model used. The employed functions are regarded as thermometric scales. Since different functions employ various thermometric scales, their values—whether high or low—are comparatively different from one another. We need a way to bring disparate thermometric scales in subatomic physics together, similar to the thermometric scale used in thermal and statistical physics. However, structuring the approach is outside the scope of the present work.
Different studies using various models have reported conflicting results concerning the onset of phase transitions, making it an open question in the community. For instance, some works report phase transition at energies as low as 7.7 GeV or as high as 14.5 GeV [41, 5, 42]. Additionally, there is an ongoing debate about the behaviour of at energies beyond 39 GeV. Our current study aims to resolve some of these discrepancies by analyzing a diverse set of particle species—identified particles, strange particles and multi-strange particles. We find that is symmetric across all particles and their corresponding anti-particles, in contrast to our previous work where light nuclei showed a separate freeze-out [42, 43]. Moreover, appears to be mass-dependent: heavier particles exhibit a higher compared to lighter particles. This finding confirms the multiple-freeze-out scenario and aligns with our earlier research [44, 45]. This finding suggests that all particles have different freezeout mechanisms and thermalization processes.
By weighting the yields of various particles, one can determine the global (simultaneous) fit from the average of the parameters. Although individual fitting to transverse momentum spectra is frequently used, there is indeed no particle dependence when performing global fitting. However, by performing individual fits, researchers can extract specific information about the properties and ascertain the features of the underlying particle production mechanisms. This fitting method makes it possible to comprehend the physics of collision processes and the characteristics of the particles that are created. Additionally, individual fitting permits researchers to independently examine different aspects of the collision, such as distinct particle species or collision centrality classes. This degree of detail can help in separating the different contributions to the observed spectra and offer a more comprehensive understanding of the physics at play. It is also worth mentioning that, although the actual values of would change by performing the global fit, however, the trend of the parameters with the centre of mass energy and centrality does not change, as reported in our previous work [42]. Moreover, in the present study, we analyze a vast variety of particle species, therefore, the fit quality in simultaneous fit may be poor.
Figs. 2(b) and 2(c) display trends for and , respectively, that closely mirror the behavior observed for . increases with the collision energy which shows that large momentum has been transferred to the system which results in further multiple scatterings. Above 19.6 GeV, remains constant like indicating the phase transition. Similarly, increases from lower energies up to 19.6 GeV which shows that the initial energy density increases from lower energies up to 19.6 GeV, however, it renders the phase transition at 19.6 GeV. The similar behavior of , and shows that and are the reflections of and it agrees with the system evolution process. It should be noted that like , and are observed to be mass dependent, and they are larger for massive particles. However, the situation is different from our previous work [46], where and are mass dependent while is dependent on the cross-section interaction of the particle.
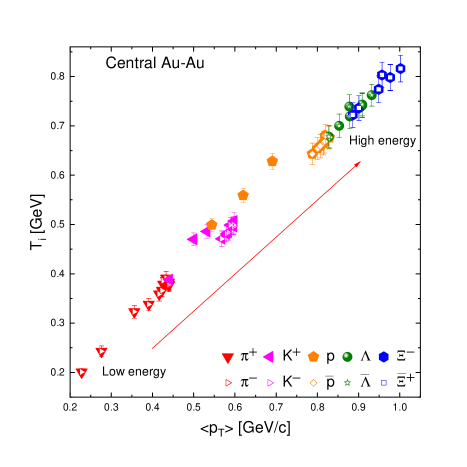
In Fig. 3, the positive correlation between and is evident, with plotted on the y-axis and on the x-axis. This trend is corroborated by the data in Table 1, which also demonstrates a positive correlation between , , and . Interestingly, Fig. 3 reveals a noteworthy phenomenon concerning particle freezeout times. Specifically, lighter particles at high energies exhibit thermodynamic behaviour akin to that of heavier particles at lower energies. For instance, pions at higher energies align with kaons at lower energies, and similarly, at high energies aligns with at low energies. This suggests a form of thermodynamic equivalence between particle types under varying energy conditions.
represents the effective temperature throughout the manuscript, as it contains both thermal and flow effects and is generally given as [4, 47]
| (14) |
Where is the kinetic freeze-out temperature, is the rest mass of the particle and is the transverse flow velocity of the expanding source. In the literature [4, 48] it has been found that both and remain constant as phase transition starts from hadronic to QCD matter. This implies that also remains invariant during such a phase transition in agreement with Eq. (14). To verify Eq. (14), we use the conventional Blast Wave model [13] to the spectra of at three different collision energies. At = 11.5 GeV, we obtain = 0.066 GeV, and = 0.590. Inserting these values of and in Eq. (14), the value of turns out to be 0.145 GeV, that is exactly what we obtained for by Eq. (5). At = 14.5 GeV, = 0.068 GeV, and = 0.595. Using these values of and in Eq. (14), the value of turns out to be 0.151 GeV which is exactly the value of we have extracted from Eq. (5). Similarly, at = 27 GeV the extracted values of and are 0.073 GeV and 0.596, respectively. Using again these values in Eq. (14) we obtain = 0.157, the same as the one we have extracted from Eq. (5).
Unlike temperature, the volume of the system is subjected to changes during the phase transition. For example, during the phase change of water (liquid) into steam (gas) the temperature of water at its boiling point (100 degrees Celsius at standard conditions of pressure) remains invariant but due to the conversion of water into steam, its volume abruptly increases. If the changes in volume are continuous or gradual the transition is a cross-over phase transition but if the changes are discontinuous or abrupt the phase transition is a first-order phase transition. The normalization constant or multiplicity parameter, , is directly related to the volume, V, of the produced system by the equation [17], , where is the degeneracy factor which is 1 for pion and kaon and 2 for proton. The discontinuous changes in during the phase transition suggest the phase transition to be discontinuous and more likely of the first order. Note that one can apply the derivative analysis to the data set of multiplicity parameters to check its discontinuity.
Believing the phase transition to be a cross-over above the collision energies of 10A GeV is just a theoretical prediction with several serious implications. For instance, in the cross-over region (a region where two states of matter gradually convert into each other by continuous changes in the physical properties like temperature etc.) both hadron gas and free quarks can co-exist. This means that we can have full quark confinement (only hadrons with no free quarks) only at absolute zero temperature, might not be achievable, and at any temperature above absolute zero [49], no matter how small is that there will be liberated quarks along with hadrons. If this is the case, why so far a free quark has not been experimentally observed at ordinary temperature? This being the case, we believe that, in the physical world, the transition from the confined to the deconfined phase is a discontinuous phase transition, most likely of first order. That is why we believe that the constancy of temperature and other parameters with collision energy is one of the possible signs of the first-order phase transition.
We would like to emphasize that while the model, when used independently, may not be sufficient to yield information about the deconfinement phase transition from hadronic matter to QGP, the excitation function of the extracted parameter is anticipated to exhibit specific tendencies. These tendencies encompass but are not confined to, peak and valley structures, rapid and gradual variations, positive and negative changes, and constancy in variations, among others. These patterns are intricately linked to the equation of state (EOS) of the considered matter. The alteration in EOS signifies a potential shift in the interaction mechanism, transitioning from a hadron-dominated to a parton-dominated state. It is inherent that these explanations extend beyond a singular dataset. The current model intends to outline a methodology for fitting and elucidating the data.
The presence of a plateau structure in the excitation function of and other parameters is anticipated to have a connection with the phase transition, although this correlation currently lacks clarity. Additional research about this matter is necessary for drawing a strong conclusion. Stating the onset of deconfinement solely based on the quality of certain fits is a tentative interpretation. A more comprehensive understanding necessitates further investigations and a comparison with other discoveries. However, the significance of the results obtained in this work can’t be denied and plays a relevant role, along with other results, in drawing a strong conclusion about the onset of phase transition.
4 Conclusions
In this comprehensive study, we analyze the () spectra of various particles produced in central Au-Au collisions. The data spans a broad spectrum of collision energies, ranging from GeV up to 200 GeV. Utilizing a two-component standard distribution function, we find a good fit to the experimental data covering these different energy regimes. We extracted thermodynamic parameters, namely , , and and scrutinized for their dependence on both the collision energy and the mass of the particles involved.
A striking result is the distinct behaviour of these parameters around a collision energy of GeV. Beyond this energy threshold, the parameters appear to plateau. This plateau suggests that additional energy in the system is being utilized as latent heat for a phase transition, rather than contributing to an increase in them. This behaviour delineates two separate regimes of collision energy: at 19.6 GeV, the system is hadron-dominated, while as the energy increases the system becomes parton-dominated. The system starts phase transition in part of the volume at 19.6 GeV, and in the whole volume at 200 GeV, which indicates that the critical energy lies between 19.6 and 200 GeV.
The reported values of (directly linked with the volume of the produced system) after the critical point of collision energy i.e., after = 19.6 GeV show the discontinuous nature suggesting the discontinuous phase transition more likely of the first order.
In addition to the energy-dependent behaviour of , , and , we also observe a distinct mass-dependent trend in these parameters. Heavier particles exhibit higher , potentially indicating that they undergo decoupling from the system at an earlier stage when the system is still hot. On the other hand, lighter particles exhibit lower , indicating that they decouple later from the system when the system is less thermalized comparatively. This observation could imply the existence of a multiple freeze-out scenario in central Au-Au collisions, adding another layer of complexity to our understanding of high-energy collision dynamics. Moreover, a single freeze-out has been reported for particles and their corresponding anti-particles in this study.
Additionally, we observe a positive correlation between the extracted parameters , , and , which highlights the complex interplay between thermodynamics and particle interactions in high-energy collisions. Our findings provide critical insights into the thermodynamics and phase transitions occurring in these systems and address some of the existing controversies and open questions in the field. Specifically, our analysis benefits from the inclusion of a diverse array of particle species, lending further credibility to our results. Overall, this study contributes to our broader understanding of the behaviour of matter under extreme conditions. We observed similar thermodynamic properties of the lighter particles at higher energies to that of the heavier particles at lower energies.
Data availability
The data supporting the findings of this study are fully integrated within the article and are appropriately cited as references within the text at relevant points.
Compliance with Ethical Standards
The authors hereby declare that they have adhered to all ethical standards and guidelines in the preparation and presentation of the content contained in this paper.
Acknowledgments
The authors gratefully acknowledge the institutional support provided by Hubei University of Automotive Technology, China, Abdul Wali Khan University Mardan (AWKUM), Pakistan, and Princess Nourah bint Abdulrahman University Researchers Supporting Project number (PNURSP2024R106), Princess Nourah bint Abdulrahman University, Riyadh, Saudi Arabia. We also extend our appreciation to the Deanship of Scientific Research at Northern Border University, Rafha, KSA, for funding this research work through the project number”NBU-FFR-2024-2439-01”.
References
- [1] Bass, S. A., Gyulassy, M., Stoecker, H., Greiner, W. (1999). Signatures of quark-gluon plasma formation in high energy heavy-ion collisions: a critical review. Journal of Physics G: Nuclear and Particle Physics, 25(3), R1.
- [2] Matsui, T., Satz, H. (1986). J/ suppression by quark-gluon plasma formation. Physics Letters B, 178(4), 416-422.
- [3] Bialas, A., Hwa, R. C. (1991). Intermittency parameters as a possible signal for quark-gluon plasma formation. Physics Letters B, 253(3-4), 436-438.
- [4] Badshah, M., Haj Ismail, A., Waqas, M., Ajaz, M., Mian, M.U., Dawi, E.A., Adil Khan, M., AbdelKader, A. Excitation Function of Freeze-Out Parameters in Symmetric Nucleus–Nucleus and Proton–Proton Collisions at the Same Collision Energy. Symmetry 2023, 15, 1554. https://doi.org/10.3390/sym15081554
- [5] Adamczyk, L., Adkins, J.K., Agakishiev, G., Aggarwal, M.M., Ahammed, Z., Ajitanand, N.N., Alekseev, I., Anderson, D.M., Aoyama, R., Aparin, A. and Arkhipkin, D. (2017). Bulk properties of the medium produced in relativistic heavy-ion collisions from the beam energy scan program. Physical Review C, 96(4), 044904.
- [6] Braun-Munzinger, P. (2000). Chemical equilibration and the hadron-QGP phase transition. arXiv preprint nucl-ex/0007021.
- [7] Hirano, T., Tsuda, K. (2002). Collective flow and two-pion correlations from a relativistic hydrodynamic model with early chemical freeze-out. Physical Review C, 66(5), 054905.
- [8] Heinz, U., Kestin, G. (2006). Universal chemical freeze-out as a phase transition signature. arXiv preprint nucl-th/0612105.
- [9] Waqas, M., Peng, G. X., Liu, F. H., Ajaz, M., Haj Ismail, A. A. K. (2022). Investigation of the freeze-out parameters in B–B, O–O, Ca–Ca and Au–Au collisions at 39 GeV. The European Physical Journal Plus, 137(9), 1-12.
- [10] Bass, S. A., Dumitru, A. (2000). Dynamics of hot bulk QCD matter: From the quark-gluon plasma to hadronic freeze-out. Physical Review C, 61(6), 064909.
- [11] Waqas, M., Liu, F. H. (2020). Initial, effective, and kinetic freeze-out temperatures from transverse momentum spectra in high-energy proton (deuteron)–nucleus and nucleus–nucleus collisions. The European Physical Journal Plus, 135(2), 147.
- [12] Heinz, U. (1999). Strange messages: chemical and thermal freeze-out in nuclear collisions. Journal of Physics G: Nuclear and Particle Physics, 25(2), 263.
- [13] Schnedermann, E., Sollfrank, J., Heinz, U. (1993). Thermal phenomenology of hadrons from 200A GeV S+ S collisions. Physical Review C, 48(5), 2462.
- [14] Abelev, B.I., Aggarwal, M.M., Ahammed, Z., Anderson, B.D., Arkhipkin, D., Averichev, G.S., Bai, Y., Balewski, J., Barannikova, O., Barnby, L.S. and Baudot, J. (2009). Systematic measurements of identified particle spectra in pp, d+ Au, and Au+ Au collisions at the STAR detector. Physical Review C, 79(3), 034909.
- [15] Tang, Z., Xu, Y., Ruan, L., van Buren, G., Wang, F., Xu, Z. (2009). Spectra and radial flow in relativistic heavy ion collisions with Tsallis statistics in a blast-wave description. Physical Review C, 79(5), 051901.
- [16] Lao, H. L., Liu, F. H., Lacey, R. A. (2017). Extracting kinetic freeze-out temperature and radial flow velocity from an improved Tsallis distribution. The European Physical Journal A, 53(3), 44.
- [17] Olimov, K.K., Kanokova, S.Z., Olimov, A.K., Umarov, K.I., Tukhtaev, B.J., Gulamov, K.G., Yuldashev, B.S., Lutpullaev, S.L., Saidkhanov, N.S., Olimov, K. and Sadykov, T.K. (2020). Combined analysis of midrapidity transverse momentum spectra of the charged pions and kaons, protons and antiprotons in p+ p and Pb+ Pb collisions at = 2.76 and 5.02 TeV at the LHC. Modern Physics Letters A, 35(29), 2050237.
- [18] Hagedorn, R. (1983). Multiplicities, distributions and the expected hadron quark-gluon phase transition. Nuovo Cimento, Riv., 6(CERN-TH-3684), 1-50.
- [19] Wang, Q., Yang, P. P., & Liu, F. H. (2019). Comparing a few distributions of transverse momenta in high energy collisions. Results in Physics, 12, 259-267.
- [20] Karsch, F. (2006, July). Lattice QCD at high temperature and the QGP. In AIP Conference Proceedings (Vol. 842, No. 1, pp. 20-28). American Institute of Physics.
- [21] Koch, P., Rafelski, J., Greiner, W. (1983). Strange hadrons in hot nuclear matter. Physics Letters B, 123(3-4), 151-154.
- [22] Braun-Munzinger, P., Magestro, D., Redlich, K., Stachel, J. (2001). Hadron production in Au–Au collisions at RHIC. Physics Letters B, 518(1-2), 41-46.
- [23] A. Andronic, P. Braun-Munzinger, and J. Stachel, Thermal hadron production in relativistic nuclear collisions, Acta Physica Polonica B 40 (2009), 1005–1012
- [24] Andronic, A., Braun-Munzinger, P., Stachel, J. (2009). The horn, the hadron mass spectrum and the QCD phase diagram-the statistical model of hadron production in central nucleus-nucleus collisions. arXiv preprint arXiv:0911.4931.
- [25] Andronic, A., Braun-Munzinger, P., Redlich, K., Stachel, J. (2018). Decoding the phase structure of QCD via particle production at high energy. Nature, 561(7723), 321-330.
- [26] Ajaz, M., Haj Ismail, A.A.K., Ullah Mian, M., Khan, R., Shehzadi, R., Adil Khan, M., AbdelKader, A., Waqas, M., Dawi, E.A. and Tabassam, U.(2023). Charged Particles Transverse Momentum and Pseudorapidity Distribution in Hadronic Collisions at LHC Energies. Entropy, 25(3), 452.
- [27] Li, L. L., Liu, F. H., & Olimov, K. K. (2021). Excitation functions of Tsallis-like parameters in high-energy nucleus–nucleus collisions. Entropy, 23(4), 478.
- [28] Li, L. L., & Liu, F. H. (2018). Energy dependent kinetic freeze-out temperature and transverse flow velocity in high energy collisions. The European Physical Journal A, 54, 1-16.
- [29] Sahoo, P., De, S., Tiwari, S. K., Sahoo, R. (2018). Energy and centrality dependent study of deconfinement phase transition in a color string percolation approach at RHIC energies. The European Physical Journal A, 54, 1-6.
- [30] Klay, J.L., Ajitanand, N.N., Alexander, J.M., Anderson, M.G., Best, D., Brady, F.P., Case, T., Caskey, W., Cebra, D., Chance, J.L. and Chung, P. E895 Collaboration. (2003). Charged pion production in 2 A to 8 A GeV central Au+ Au Collisions. Physical Review C, 68(5), 054905.
- [31] Ahle, L., Akiba, Y., Ashktorab, K., Baker, M.D., Beavis, D., Budick, B., Chang, J., Chasman, C., Chen, Z., Chu, Y.Y. and Chujo, T. E917 Collaboration. (2000). Excitation function of and production in Au+ Au reactions at 2–10 AGeV. Physics Letters B, 476(1-2), 1-8.
- [32] Klay, J.L., Ajitanand, N.N., Alexander, J.M., Anderson, M.G., Best, D., Brady, F.P., Case, T., Caskey, W., Cebra, D., Chance, J.L. and Chung, P. E895 Collaboration. (2002). Longitudinal flow of protons from (2–8) A GeV central Au+ Au collisions. Physical review letters, 88(10), 102301.
- [33] Gopal, K. (2023). Production of pions, kaons, and (anti) protons in Au+ Au collisions at = 54.4 GeV at RHIC. In EPJ Web of Conferences (Vol. 276, p. 03009). EDP Sciences.
- [34] Abelev, B. I. et al., (2007). Energy dependence of , p and transverse momentum spectra for Au+ Au collisions at = 62.4 and 200 GeV. Physics Letters B, 655(3-4), 104-113.
- [35] Adcox, K., Adler, S. S., Ajitanand, N. N. Centrality dependence of , , p, and production from = 130 GeV Au+ Au collisions at RHIC. Physical Review Letters, 88.
- [36] Adler, S.S., Afanasiev, S., Aidala, C., Ajitanand, N.N., Akiba, Y., Alexander, J., Amirikas, R., Aphecetche, L., Aronson, S.H., Averbeck, R. and Awes, T.C. (2004). Identified charged particle spectra and yields in Au+ Au collisions at = 200 GeV. Physical Review C, 69(3), 034909.
- [37] Adam, J., Adamczyk, L., Adams, J.R., Adkins, J.K., Agakishiev, G., Aggarwal, M.M., Ahammed, Z., Alekseev, I., Anderson, D.M., Aoyama, R. and Aparin, A. (2020). Strange hadron production in Au+ Au collisions at = 7.7, 11.5, 19.6, 27, and 39 GeV. Physical Review C, 102(3), 034909.
- [38] Aggarwal, M.M., Ahammed, Z., Alakhverdyants, A.V., Alekseev, I., Alford, J., Anderson, B.D., Anson, C.D., Arkhipkin, D., Averichev, G.S., Balewski, J. and Beavis, D.R. (2011). Strange and multistrange particle production in Au+ Au collisions at = 62.4 GeV. Physical Review C, 83(2), 024901.
- [39] Uddin, S., Bhat, R. A., Bashir, I. U. (2014). Study of centrality dependence of transverse momentum spectra of hadrons and the freeze-out parameters at of 62.4 GeV, 130 GeV and 200 GeV. arXiv preprint arXiv:1412.2663.
- [40] Adams, J., Aggarwal, M.M., Ahammed, Z., Amonett, J., Anderson, B.D., Anderson, M., Arkhipkin, D., Averichev, G.S., Bai, Y., Balewski, J. and Barannikova, O. (2007). Scaling properties of hyperon production in Au+ Au collisions at = 200 GeV. Physical review letters, 98(6), 062301. Waqas, M., Liu, F. H. (2020). Initial, effective, and kinetic freeze-out temperatures from transverse momentum spectra in high-energy proton (deuteron)–nucleus and nucleus–nucleus collisions. The European Physical Journal Plus, 135(2), 147.
- [41] Ayala, A., Bietenholz, W., Cuautle, E., Formentí, R. G., & Guzmán, R. (2023). Searching for the Baryon-to-Meson Transition Region with the MPD at NICA. Physics of Atomic Nuclei, 86(5), 901-907.
- [42] Waqas, M., Peng, G. X., Wang, R. Q., Ajaz, M., Haj Ismail, A. A. K. (2021). Freezeout properties of different light nuclei at the RHIC beam energy scan. The European Physical Journal Plus, 136, 1-22.
- [43] Waqas, M., Peng, G. X., Liu, F. H., Wazir, Z. (2021). Effects of coalescence and isospin symmetry on the freezeout of light nuclei and their anti-particles. Scientific Reports, 11(1), 20252.
- [44] Waqas, M., Liu, F. H., Fakhraddin, S., Rahim, M. A. (2019). Possible scenarios for single, double, or multiple kinetic freeze-out in high-energy collisions. Indian Journal of Physics, 93, 1329-1343.
- [45] Waqas, M., Liu, F. H. (2022). Centrality dependence of kinetic freeze-out temperature and transverse flow velocity in high energy nuclear collisions. Indian Journal of Physics, 1-19.
- [46] Waqas, M., Peng, G. X., Ajaz, M., Wazir, Z. (2022). Decoupling of non-strange, strange and multi-strange particles from the system in Cu–Cu, Au–Au and Pb–Pb collisions at high energies. Chinese Journal of Physics, 77, 1713-1722.
- [47] Wei, H. R., Liu, F. H., & Lacey, R. A. (2016). Disentangling random thermal motion of particles and collective expansion of source from transverse momentum spectra in high energy collisions. Journal of Physics G: Nuclear and Particle Physics, 43(12), 125102.
- [48] Waqas, M., Liu, F. H., Wang, R. Q., & Siddique, I. (2020). Energy scan/dependence of kinetic freeze-out scenarios of multi-strange and other identified particles in central nucleus–nucleus collisions. The European Physical Journal A, 56, 1-12.
- [49] Letessier, J., & Rafelski, J. (2002). Hadrons and quark–gluon plasma (p. 397). Cambridge University Press. DOI 10.1017/9781009290753 Chapter 3: The vacuum as a physical medium.
Appendix
Table 1. The values of different parameters, extracted from the two-component standard distribution, along with the values of /NDF. and S.F in the table are used for collision centrality percent and scaling factor, respectively.
| Collision | Particle | C | Energy [GeV] | S.F | [GeV] | [GeV] | K | [GeV] | /NDF | ||
| 0-5% | 1.9 | 0.05 | 1 | 0.111±0.002 | 0.048±0.002 | 0.454±0.021 | 0.077±0.001 | 530±21.34 | 6.0279/21 | ||
| 0-5% | 2.7 | 0.05 | 10 | 0.124±0.003 | 0.05±0.003 | 0.604±0.022 | 0.095±0.003 | 1320±50.43 | 9.7103/26 | ||
| 0-5% | 3.4 | 0.05 | 0.171±0.005 | 0.054±0.004 | 0.604±0.021 | 0.125±0.004 | 2090±80.35 | 17.0664/21 | |||
| 0-5% | 7.7 | 0.1 | 0.194±0.004 | 0.108±0.003 | 0.356±0.017 | 0.139±0.003 | 9260±333.36 | 11.1691/24 | |||
| 0-5% | 11.5 | 0.1 | 0.204±0.004 | 0.117±0.004 | 0.356±0.017 | 0.148±0.004 | 11260±405.36 | 4.2825/24 | |||
| Fig. 1 (a) | 0-5% | 14.5 | 0.1 | 0.209±0.005 | 0.119±0.005 | 0.354±0.016 | 0.151±0.003 | 12961±466.596 | 2.5307/26 | ||
| Au-Au | 0-5% | 19.6 | 0.1 | 0.209±0.003 | 0.129±0.004 | 0.354±0.017 | 0.157±0.002 | 14060±506.16 | 19.5100/24 | ||
| 0-5% | 27 | 0.1 | 0.214±0.005 | 0.127±0.004 | 0.354±0.017 | 0.157±0.003 | 15639±563.004 | 12.1858/24 | |||
| 0-5% | 39 | 0.1 | 0.223±0.005 | 0.122±0.003 | 0.354±0.015 | 0.157±0.003 | 16960±610.56 | 3.4854/24 | |||
| 0-5% | 54.4 | 0.1 | 0.223±0.005 | 0.122±0.004 | 0.354±0.017 | 0.157±0.003 | 21650±779.4 | 3.6874/21 | |||
| 0-10% | 62.4 | 0.5 | 0.24±0.005 | 0.112±0.004 | 0.354±0.017 | 0.157±0.004 | 23750±855 | 6.7174/11 | |||
| 0-5% | 130 | 0.35 | 0.24±0.006 | 0.112±0.005 | 0.354±0.018 | 0.157±0.005 | 25450±865 | 59.3027/12 | |||
| 0-5% | 200 | 0.35 | 0.253±0.006 | 0.11±0.004 | 0.334±0.016 | 0.157±0.003 | 29250±1053 | 35.2011/26 | |||
| 0-5% | 1.9 | 0.05 | 1 | 0.111±0.002 | 0.048±0.002 | 0.454±0.021 | 0.077±0.001 | 750±31.34 | 85.0912/27 | ||
| 0-5% | 2.7 | 0.05 | 10 | 0.124±0.003 | 0.05±0.003 | 0.604±0.022 | 0.095±0.003 | 1680±60.73 | 92.2532/38 | ||
| 0-5% | 3.4 | 0.05 | 0.171±0.005 | 0.054±0.004 | 0.604±0.021 | 0.125±0.004 | 2300±130.35 | 65.6832/36 | |||
| 0-5% | 7.7 | 0.1 | 0.194±0.004 | 0.108±0.003 | 0.356±0.017 | 0.139±0.002 | 9260±333.36 | 15.5684/24 | |||
| 0-5% | 11.5 | 0.1 | 0.204±0.004 | 0.117±0.004 | 0.356±0.017 | 0.148±0.003 | 11360±408.96 | 16.5712/24 | |||
| Fig. 1 (b) | 0-5 | 14.5 | 0.1 | 0.209±0.005 | 0.119±0.004 | 0.354±0.017 | 0.151±0.003 | 12861±462.996 | 14.9154/26 | ||
| Au-Au | 0-5% | 19.6 | 0.1 | 0.209±0.005 | 0.129±0.004 | 0.354±0.016 | 0.157±0.002 | 14060±506.16 | 30.7145/24 | ||
| 0-5% | 27 | 0.1 | 0.214±0.004 | 0.127±0.005 | 0.354±0.017 | 0.157±0.003 | 15639±563.004 | 21.4635/24 | |||
| 0-5% | 39 | 0.1 | 0.223±0.005 | 0.122±0.004 | 0.354±0.017 | 0.157±0.003 | 16960±610.56 | 6.4209/24 | |||
| 0-10% | 62.4 | 0.5 | 0.24±0.005 | 0.112±0.004 | 0.354±0.018 | 0.157±0.004 | 23750±855 | 6.7172/11 | |||
| 0-5% | 130 | 0.35 | 0.24±0.006 | 0.112±0.005 | 0.354±0.015 | 0.157±0.003 | 24150±859 | 106.8680/12 | |||
| 0-5% | 200 | 0.35 | 0.253±0.006 | 0.11±0.004 | 0.334±0.016 | 0.157±0.003 | 29250±1053 | 50.7548/26 | |||
| 0-5% | 1.9 | 0.25 | 0.191±0.003 | 0.06±0.003 | 0.554±0.026 | 0.113±0.004 | 7.7E-4±0.00002 | 8.6280/7 | |||
| 0-5% | 2.7 | 0.25 | 0.270±0.004 | 0.060±0.003 | 0.454±0.022 | 0.155±0.005 | 0.063±0.007 | 1.9971/6 | |||
| 0-5% | 3.4 | 0.25 | 0.174±0.003 | 0.078±0.004 | 0.454±0.021 | 0.168±0.006 | 1.51±0.07 | 2.3082/3 | |||
| 0-5% | 7.7 | 0.1 | 1 | 0.219±0.005 | 0.158±0.005 | 0.356±0.017 | 0.18±0.004 | 2060±74.16 | 7.6773/21 | ||
| 0-5% | 11.5 | 0.1 | 10 | 0.221±0.005 | 0.164±0.006 | 0.356±0.018 | 0.184±0.004 | 2490±89.64 | 2.3743/23 | ||
| Fig. 1 (c) | 0-5% | 14.5 | 0.1 | 0.225±0.004 | 0.164±0.005 | 0.356±0.017 | 0.186±0.003 | 2699±97.164 | 4.8246/24 | ||
| Au-Au | 0-5% | 19.6 | 0.1 | 0.234±0.005 | 0.167±0.005 | 0.356±0.017 | 0.191±0.004 | 2900±104.4 | 4.8785/24 | ||
| 0-5% | 27 | 0.1 | 0.234±0.006 | 0.167±0.005 | 0.356±0.016 | 0.191±0.004 | 3090±111.24 | 13.7093/24 | |||
| 0-5% | 39 | 0.1 | 0.245±0.005 | 0.161±0.004 | 0.356±0.017 | 0.191±0.005 | 3250±117 | 20.4385/24 | |||
| 0-5% | 54.4 | 0.1 | 0.265±0.006 | 0.15±0.005 | 0.356±0.017 | 0.191±0.004 | 3660±131.76 | 17.4267/21 | |||
| 0-5% | 130 | 0.35 | 0.265±0.006 | 0.15±0.005 | 0.356±0.017 | 0.191±0.004 | 5250±160.23 | 33.4002/11 | |||
| 0-5% | 200 | 0.35 | 0.294±0.006 | 0.134±0.004 | 0.356±0.017 | 0.191±0.004 | 5760±207.36 | 39.1350/14 | |||
| 0-5% | 7.7 | 0.1 | 1 | 0.219±0.005 | 0.158±0.005 | 0.356±0.017 | 0.18±0.004 | 762±27.432 | 8.2908/21 | ||
| 0-5% | 11.5 | 0.1 | 10 | 0.221±0.006 | 0.164±0.005 | 0.356±0.016 | 0.184±0.005 | 1260±45.36 | 7.6467/21 | ||
| 0-5% | 14.5 | 0.1 | 0.225±0.005 | 0.164±0.006 | 0.356±0.017 | 0.186±0.004 | 1580±56.88 | 26.9784/24 | |||
| Fig. 1 (d) | 0-5% | 19.6 | 0.1 | 0.234±0.005 | 0.167±0.005 | 0.356±0.017 | 0.191±0.004 | 1810±65.16 | 19.2545/24 | ||
| Au-Au | 0-5% | 27 | 0.1 | 0.234±0.004 | 0.167±0.004 | 0.356±0.018 | 0.191±0.003 | 2190±78.84 | 16.2157/23 | ||
| 0-5% | 39 | 0.1 | 0.245±0.005 | 0.161±0.005 | 0.356±0.017 | 0.191±0.004 | 2560±92.16 | 16.3818/24 | |||
| 0-5% | 130 | 0.35 | 0.265±0.006 | 0.15±0.005 | 0.356±0.017 | 0.191±0.004 | 3650±98.23 | 9.9600/11 | |||
| 0-5% | 200 | 0.35 | 0.294±0.006 | 0.134±0.004 | 0.356±0.017 | 0.191±0.004 | 5360±192.96 | 54.8569/14 |
Table 1 (to be continued…)
| Collision | Particle | C | Energy [GeV] | S.F | [GeV] | [GeV] | K | [GeV] | /NDF | ||
| 1.9 | 0.05 | 1 | 0.251±0.003 | 0.049±0.002 | 0.454±0.022 | 0.141±0.003 | 1670±59.54 | 44.1985/37 | |||
| 2.7 | 0.05 | 10 | 0.262±0.004 | 0.051±0.003 | 0.554±0.021 | 0.168±0.003 | 1650±50.76 | 78.2564/38 | |||
| 3.4 | 0.05 | 0.302±0.003 | 0.058±0.004 | 0.554±0.022 | 0.193±0.004 | 1550±45.32 | 66.0963/38 | ||||
| 7.7 | 0.1 | 0.241±0.005 | 0.221±0.007 | 0.356±0.017 | 0.228±0.005 | 5560±200.16 | 13.2445/27 | ||||
| 11.5 | 0.1 | 0.246±0.005 | 0.226±0.006 | 0.356±0.017 | 0.233±0.004 | 4560±164.16 | 24.0438/26 | ||||
| Fig. 1 (e) | 14.5 | 0.1 | 0.251±0.006 | 0.231±0.007 | 0.356±0.018 | 0.238±0.005 | 3960±142.56 | 6.2376/23 | |||
| Au-Au | 19.6 | 0.1 | 0.254±0.006 | 0.237±0.008 | 0.356±0.017 | 0.243±0.005 | 3550±127.8 | 9.5897/27 | |||
| 27 | 0.1 | 0.254±0.007 | 0.237±0.008 | 0.356±0.017 | 0.243±0.006 | 3150±113.4 | 6.3034/21 | ||||
| 39 | 0.1 | 0.262±0.006 | 0.233±0.007 | 0.356±0.016 | 0.243±0.004 | 2801±100.836 | 24.3442/20 | ||||
| 54.4 | 0.1 | 0.247±0.005 | 0.241±0.006 | 0.356±0.017 | 0.243±0.005 | 2901±104.436 | 26.6443/19 | ||||
| 62.4 | 0.5 | 0.247±0.005 | 0.241±0.008 | 0.356±0.017 | 0.243±0.005 | 2761±99.396 | 73.2623/8 | ||||
| 130 | 0.35 | 0.247±0.004 | 0.241±0.009 | 0.356±0.016 | 0.243±0.005 | 3250±100.25 | 30.1149/15 | ||||
| 200 | 0.35 | 0.321±0.007 | 0.201±0.006 | 0.348±0.017 | 0.243±0.005 | 1690±60.84 | 87.0351/20 | ||||
| 7.7 | 0.1 | 1 | 0.241±0.005 | 0.221±0.007 | 0.356±0.017 | 0.228±0.005 | 40±1.44 | 12.8654/13 | |||
| 11.5 | 0.1 | 10 | 0.246±0.005 | 0.226±0.007 | 0.356±0.017 | 0.233±0.005 | 147±5.292 | 44.2003/21 | |||
| 14.5 | 0.1 | 0.251±0.006 | 0.231±0.007 | 0.356±0.016 | 0.238±0.006 | 250±9 | 16.8523/23 | ||||
| 19.6 | 0.1 | 0.254±0.006 | 0.237±0.008 | 0.356±0.017 | 0.243±0.004 | 430±15.48 | 15.8289/20 | ||||
| Fig. 1 (f) | 27 | 0.1 | 0.254±0.006 | 0.237±0.008 | 0.356±0.017 | 0.243±0.005 | 650±23.4 | 24.5698/20 | |||
| Au-Au | 39 | 0.1 | 0.262±0.006 | 0.233±0.007 | 0.356±0.018 | 0.243±0.005 | 871±31.356 | 43.4597/21 | |||
| 62.4 | 0.5 | 0.247±0.005 | 0.241±0.008 | 0.356±0.017 | 0.243±0.005 | 1161±41.796 | 64.8123/8 | ||||
| 130 | 0.35 | 0.247±0.005 | 0.241±0.008 | 0.356±0.017 | 0.243±0.005 | 2250±70.74 | 49.8594/14 | ||||
| 200 | 0.35 | 0.321±0.007 | 0.201±0.006 | 0.348±0.017 | 0.243±0.005 | 1260±45.36 | 120.9282/20 | ||||
| 7.7 | 0.5 | 1 | 0.282±0.006 | 0.214±0.007 | 0.348±0.017 | 0.238±0.005 | 1700±61.2 | 45.5463/11 | |||
| 11.5 | 0.5 | 10 | 0.292±0.005 | 0.214±0.007 | 0.428±0.021 | 0.248±0.005 | 1660±59.76 | 93.1509/12 | |||
| 19.6 | 0.5 | 0.277±0.007 | 0.225±0.006 | 0.848±0.042 | 0.269±0.006 | 1380±49.68 | 138.4923/13 | ||||
| Fig. 1 (g) | 27 | 0.5 | 0.274±0.006 | 0.255±0.008 | 0.718±0.035 | 0.269±0.005 | 1210±43.56 | 68.6768/14 | |||
| Au-Au | 39 | 0.5 | 0.284±0.006 | 0.229±0.007 | 0.721±0.034 | 0.269±0.005 | 1170±42.12 | 32.8943/14 | |||
| 62.4 | 1 | 0.284±0.006 | 0.229±0.007 | 0.721±0.035 | 0.269±0.004 | 2060±74.16 | 9.4215/10 | ||||
| 130 | 0.05 | 0.284±0.006 | 0.229±0.007 | 0.721±0.035 | 0.269±0.004 | 8350±90.45 | 13.8818/8 | ||||
| 200 | 1 | 0.326±0.007 | 0.129±0.004 | 0.711±0.035 | 0.269±0.005 | 1810±65.16 | 17.4503/15 | ||||
| 7.7 | 0.5 | 1 | 0.282±0.006 | 0.214±0.007 | 0.348±0.017 | 0.238±0.005 | 21±0.756 | 21.9432/8 | |||
| 11.5 | 0.5 | 10 | 0.292±0.006 | 0.214±0.007 | 0.428±0.022 | 0.248±0.005 | 75±2.7 | 80.8076/11 | |||
| 19.6 | 0.5 | 0.277±0.005 | 0.225±0.007 | 0.848±0.042 | 0.269±0.006 | 200±7.2 | 131.4524/12 | ||||
| Fig. 1 (h) | 27 | 0.5 | 0.274±0.007 | 0.255±0.008 | 0.718±0.035 | 0.269±0.005 | 310±11.16 | 98.3465/13 | |||
| Au-Au | 39 | 0.5 | 0.284±0.006 | 0.229±0.007 | 0.721±0.035 | 0.269±0.005 | 381±13.716 | 45.5753/14 | |||
| 62.4 | 1 | 0.284±0.006 | 0.229±0.007 | 0.721±0.034 | 0.269±0.004 | 1020±36.72 | 69.1245/10 | ||||
| 130 | 0.05 | 0.284±0.006 | 0.229±0.007 | 0.721±0.035 | 0.269±0.004 | 840±36.68 | 37.7712/8 | ||||
| 200 | 1 | 0.326±0.007 | 0.129±0.004 | 0.711±0.035 | 0.269±0.005 | 1310±47.16 | 16.9300/15 | ||||
| 7.7 | 0.5 | 1 | 0.281±0.006 | 0.225±0.007 | 0.348±0.016 | 0.245±0.005 | 124±4.464 | 4.6373/5 | |||
| 11.5 | 0.5 | 10 | 0.289±0.006 | 0.225±0.007 | 0.398±0.02 | 0.251±0.005 | 163±5.868 | 20.6342/6 | |||
| 19.6 | 0.5 | 0.318±0.007 | 0.255±0.008 | 0.398±0.02 | 0.28±0.006 | 168±6.048 | 2.7458/6 | ||||
| Fig. 1 (i) | 27 | 0.5 | 0.318±0.008 | 0.255±0.008 | 0.398±0.02 | 0.28±0.005 | 184±6.624 | 16.4476/7 | |||
| Au-Au | 39 | 0.5 | 0.318±0.007 | 0.255±0.008 | 0.398±0.01 | 0.28±0.006 | 190±6.84 | 8.9434/7 | |||
| 62.4 | 1 | 0.3±0.007 | 0.266±0.009 | 0.418±0.02 | 0.28±0.006 | 199±7.164 | 52.2694/9 | ||||
| 130 | 0.05 | 0.3±0.006 | 0.266±0.007 | 0.418±0.02 | 0.28±0.005 | 189±6.123 | 6.2038/8 | ||||
| 200 | 0.75 | 0.339±0.007 | 0.141±0.005 | 0.701±0.034 | 0.28±0.005 | 257±9.252 | 11.0395/13 |
Table 1 (to be continued…)
| Collision | Particle | C | Energy [GeV] | S.F | [GeV] | [GeV] | K | [GeV] | /NDF | ||
|---|---|---|---|---|---|---|---|---|---|---|---|
| 7.7 | 0.5 | 1 | 0.281±0.006 | 0.225±0.007 | 0.348±0.017 | 0.245±0.005 | 7.2±0.259 | 1.7453/4 | |||
| 11.5 | 0.5 | 10 | 0.289±0.006 | 0.225±0.007 | 0.398±0.02 | 0.251±0.005 | 20±0.72 | 15.1094/6 | |||
| 19.6 | 0.5 | 0.318±0.007 | 0.255±0.008 | 0.398±0.03 | 0.28±0.006 | 46±1.656 | 27.4925/6 | ||||
| Fig. 1 (j) | 27 | 0.5 | 0.318±0.008 | 0.255±0.008 | 0.398±0.01 | 0.28±0.005 | 69±2.484 | 35.0656/7 | |||
| Au-Au | 39 | 0.5 | 0.318±0.007 | 0.255±0.008 | 0.398±0.02 | 0.28±0.006 | 92±3.312 | 11.3337/7 | |||
| 62.4 | 1 | 0.3±0.007 | 0.266±0.009 | 0.418±0.02 | 0.28±0.006 | 130±4.68 | 32.0486/9 | ||||
| 130 | 0.05 | 0.3±0.006 | 0.266±0.008 | 0.418±0.02 | 0.28±0.005 | 143±6.76 | 11.1093/8 | ||||
| 200 | 0.75 | 0.339±0.007 | 0.141±0.005 | 0.701±0.033 | 0.28±0.005 | 209±7.524 | 6.4563/13 |
Table 2. The values of calculated from the probability density function i.e., calculated from Eq. (11) and calculated from the string Percolation model given in Eq. (13).
| Collision | Particle | C | Energy [GeV] | [GeV/c] | [GeV] | |
| 0-5% | 1.9 | 0.05 | 0.228±0.005 | 0.201±0.007 | ||
| 0-5% | 2.7 | 0.05 | 0.276±0.008 | 0.243±0.011 | ||
| 0-5% | 3.4 | 0.05 | 0.356±0.010 | 0.323±0.013 | ||
| 0-5% | 7.7 | 0.1 | 0.391±0.013 | 0.338±0.012 | ||
| 0-5% | 11.5 | 0.1 | 0.416±0.013 | 0.359±0.012 | ||
| Au-Au | 0-5% | 14.5 | 0.1 | 0.423±0.014 | 0.366±0.011 | |
| 0-5% | 19.6 | 0.1 | 0.44±0.014 | 0.377±0.013 | ||
| 0-5% | 27 | 0.1 | 0.44±0.015 | 0.379±0.013 | ||
| 0-5% | 39 | 0.1 | 0.44±0.014 | 0.383±0.013 | ||
| 0-5% | 54.4 | 0.1 | 0.44±0.014 | 0.383±0.014 | ||
| 0-10% | 62.4 | 0.5 | 0.426±0.014 | 0.379±0.013 | ||
| 0-5% | 130 | 0.35 | 0.433±0.016 | 0.386±0.015 | ||
| 0-5% | 200 | 0.35 | 0.433±0.014 | 0.391±0.013 | ||
| 0-5% | 1.9 | 0.05 | 0.228±0.005 | 0.201±0.007 | ||
| 0-5% | 2.7 | 0.05 | 0.276±0.008 | 0.243±0.011 | ||
| 0-5% | 3.4 | 0.05 | 0.356±0.010 | 0.323±0.013 | ||
| 0-5% | 7.7 | 0.1 | 0.391±0.013 | 0.338±0.012 | ||
| 0-5% | 11.5 | 0.1 | 0.416±0.013 | 0.359±0.011 | ||
| Au-Au | 0-5 | 14.5 | 0.1 | 0.423±0.014 | 0.366±0.012 | |
| 0-5% | 19.6 | 0.1 | 0.44±0.014 | 0.377±0.013 | ||
| 0-5% | 27 | 0.1 | 0.44±0.013 | 0.379±0.013 | ||
| 0-5% | 39 | 0.1 | 0.44±0.014 | 0.383±0.014 | ||
| 0-10% | 62.4 | 0.5 | 0.426±0.015 | 0.379±0.013 | ||
| 0-5% | 130 | 0.35 | 0.433±0.016 | 0.386±0.015 | ||
| 0-5% | 200 | 0.35 | 0.433±0.014 | 0.391±0.013 | ||
| 0-5% | 1.9 | 0.25 | 0.441±0.006 | 0.388±0.009 | ||
| 0-5% | 2.7 | 0.25 | 0.500±0.011 | 0.470±0.013 | ||
| 0-5% | 3.4 | 0.25 | 0.532±0.013 | 0.486±0.014 | ||
| 0-5% | 7.7 | 0.1 | 0.568±0.018 | 0.471±0.016 | ||
| 0-5% | 11.5 | 0.1 | 0.58±0.019 | 0.481±0.016 | ||
| Au-Au | 0-5% | 14.5 | 0.1 | 0.584±0.018 | 0.484±0.016 | |
| 0-5% | 19.6 | 0.1 | 0.597±0.019 | 0.496±0.017 | ||
| 0-5% | 27 | 0.1 | 0.597±0.019 | 0.496±0.017 | ||
| 0-5% | 39 | 0.1 | 0.597±0.020 | 0.499±0.018 | ||
| 0-5% | 54.4 | 0.1 | 0.598±0.019 | 0.507±0.017 | ||
| 0-5% | 130 | 0.35 | 0.589±0.018 | 0.499±0.016 | ||
| 0-5% | 200 | 0.35 | 0.512±0.016 | 0.589±0.02 | ||
| 0-5% | 7.7 | 0.1 | 0.568±0.018 | 0.471±0.016 | ||
| 0-5% | 11.5 | 0.1 | 0.58±0.019 | 0.481±0.015 | ||
| 0-5% | 14.5 | 0.1 | 0.584±0.019 | 0.484±0.016 | ||
| Au-Au | 0-5% | 19.6 | 0.1 | 0.597±0.020 | 0.496±0.017 | |
| 0-5% | 27 | 0.1 | 0.597±0.019 | 0.496±0.018 | ||
| 0-5% | 39 | 0.1 | 0.597±0.019 | 0.499±0.017 | ||
| 0-5% | 130 | 0.35 | 0.589±0.018 | 0.499±0.016 | ||
| 0-5% | 200 | 0.35 | 0.512±0.016 | 0.589±0.02 | ||
| 1.9 | 0.05 | 0.544±0.012 | 0.499±0.013 | |||
| 2.7 | 0.05 | 0.620±0.013 | 0.559±0.014 | |||
| 3.4 | 0.05 | 0.691±0.014 | 0.628±0.016 | |||
| 7.7 | 0.1 | 0.788±0.025 | 0.643±0.022 | |||
| 11.5 | 0.1 | 0.801±0.026 | 0.654±0.022 | |||
| Au-Au | 14.5 | 0.1 | 0.815±0.026 | 0.665±0.023 | ||
| 19.6 | 0.1 | 0.829±0.027 | 0.677±0.024 | |||
| 27 | 0.1 | 0.829±0.027 | 0.677±0.022 | |||
| 39 | 0.1 | 0.829±0.028 | 0.677±0.023 | |||
| 54.4 | 0.1 | 0.829±0.027 | 0.676±0.023 | |||
| 62.4 | 0.5 | 0.807±0.026 | 0.659±0.022 | |||
| 130 | 0.35 | 0.818±0.028 | 0.668±0.024 | |||
| 200 | 0.35 | 0.819±0.026 | 0.68±0.023 | |||
| 7.7 | 0.1 | 0.788±0.025 | 0.643±0.022 | |||
| 11.5 | 0.1 | 0.801±0.026 | 0.654±0.022 | |||
| 14.5 | 0.1 | 0.815±0.026 | 0.665±0.023 | |||
| 19.6 | 0.1 | 0.829±0.027 | 0.677±0.023 | |||
| Au-Au | 27 | 0.1 | 0.829±0.027 | 0.677±0.022 | ||
| 39 | 0.1 | 0.829±0.027 | 0.677±0.024 | |||
| 62.4 | 0.5 | 0.807±0.026 | 0.659±0.023 | |||
| 130 | 0.35 | 0.818±0.028 | 0.668±0.024 | |||
| 200 | 0.35 | 0.819±0.026 | 0.68±0.023 |
Table 2 (to be continued…)
| Collision | Particle | C | Energy [GeV] | [GeV/c] | [GeV] | |
|---|---|---|---|---|---|---|
| 7.7 | 0.5 | 0.828±0.026 | 0.678±0.023 | |||
| 11.5 | 0.5 | 0.853±0.027 | 0.7±0.024 | |||
| 19.6 | 0.5 | 0.909±0.029 | 0.742±0.025 | |||
| Au-Au | 27 | 0.5 | 0.909±0.030 | 0.741±0.024 | ||
| 39 | 0.5 | 0.909±0.029 | 0.743±0.025 | |||
| 62.4 | 1 | 0.879±0.028 | 0.719±0.024 | |||
| 130 | 0.05 | 0.932±0.030 | 0.762±0.026 | |||
| 200 | 1 | 0.878±0.028 | 0.739±0.025 | |||
| 7.7 | 0.5 | 0.828±0.026 | 0.678±0.023 | |||
| 11.5 | 0.5 | 0.853±0.027 | 0.7±0.024 | |||
| 19.6 | 0.5 | 0.909±0.029 | 0.742±0.025 | |||
| Au-Au | 27 | 0.5 | 0.909±0.028 | 0.741±0.025 | ||
| 39 | 0.5 | 0.909±0.029 | 0.743±0.025 | |||
| 62.4 | 1 | 0.879±0.028 | 0.719±0.024 | |||
| 130 | 0.05 | 0.932±0.030 | 0.762±0.026 | |||
| 200 | 1 | 0.878±0.027 | 0.739±0.025 | |||
| 7.7 | 0.5 | 0.886±0.028 | 0.722±0.025 | |||
| 11.5 | 0.5 | 0.901±0.029 | 0.736±0.025 | |||
| 19.6 | 0.5 | 0.977±0.031 | 0.798±0.027 | |||
| Au-Au | 27 | 0.5 | 0.977±0.030 | 0.798±0.027 | ||
| 39 | 0.5 | 0.977±0.031 | 0.798±0.027 | |||
| 62.4 | 1 | 0.949±0.03 | 0.774±0.026 | |||
| 130 | 0.05 | 1.002±0.04 | 0.816±0.030 | |||
| 200 | 0.75 | 0.957±0.031 | 0.803±0.027 | |||
| 7.7 | 0.5 | 0.886±0.028 | 0.722±0.025 | |||
| 11.5 | 0.5 | 0.901±0.029 | 0.736±0.025 | |||
| 19.6 | 0.5 | 0.977±0.031 | 0.798±0.027 | |||
| Au-Au | 27 | 0.5 | 0.977±0.032 | 0.798±0.027 | ||
| 39 | 0.5 | 0.977±0.031 | 0.798±0.027 | |||
| 62.4 | 1 | 0.949±0.03 | 0.774±0.026 | |||
| 130 | 0.05 | 1.002±0.04 | 0.816±0.030 | |||
| 200 | 0.75 | 0.957±0.031 | 0.803±0.027 |