Evaluating LLMs at Evaluating Temporal Generalization
wangbenyou@cuhk.edu.cn
Abstract
The rapid advancement of Large Language Models (LLMs) highlights the urgent need for evolving evaluation methodologies that keep pace with improvements in language comprehension and information processing. However, traditional benchmarks, which are often static, fail to capture the continually changing information landscape, leading to a disparity between the perceived and actual effectiveness of LLMs in ever-changing real-world scenarios. Furthermore, these benchmarks do not adequately measure the models’ capabilities over a broader temporal range or their adaptability over time. We examine current LLMs in terms of temporal generalization and bias, revealing that various temporal biases emerge in both language likelihood and prognostic prediction. This serves as a caution for LLM practitioners to pay closer attention to mitigating temporal biases. Also, we propose an evaluation framework Freshbench for dynamically generating benchmarks from the most recent real-world prognostication prediction. Our code is available at https://github.com/FreedomIntelligence/FreshBench. The dataset will be released soon.
1 Introduction
Proprietary large language models (LLMs) such as GPT-4 (OpenAI, 2023), Bard (GoogleAI, 2023), Claude (Anthropic, 2023), and PaLM (Anil et al., 2023) has been paralleled by efforts in the open-source community to democratize LLMs. Meanwhile, the rapid push for LLM democratization (Touvron et al., 2023) emphasizes the necessity for dynamic and robust benchmarks that accurately reflecting their evolving capabilities. Traditional benchmarks, broadly classified into knowledge-based assessments and open-dialogue evaluations, each present unique challenges. Knowledge-based assessments, exemplified by MMLU (Hendrycks et al., 2020) and C-Eval (Huang et al., 2023), are prone to data manipulation, raising concerns about their real-world applicability and the risk of data leakage. Open-dialogue evaluations like MT-Bench (Zheng et al., 2023) and Alpaca-Eval (Li et al., 2023), rely on subjective human or model-based judgments, making their outcomes susceptible to the influence of dialogue structure, and thereby, potentially compromising assessment validity.
We argue that the assessment of LLMs should be conducted in scenarios that are resistant to hacking manipulation, with results that are objective and free from evaluator biases (Chen et al., 2024). Additionally, time as a dynamic dimension, can also ensure robust and relevant evaluations. This paper explores an alternative way to evaluate large language models, i.e., on temporal generalization where time is considered as an important aspect. By doing so, the inaccessibility of future content would largely reduce the data contamination issue. Moreover, a retrospective perspective on time could beneficial for temporal bias analysis for LLMs.
To achieve this objective, we explore two specific scenarios designed to measure model capabilities without data leakage and to assess model performance on tasks relevant to both past and future contexts. The first scenario involved generating text from recent sources, such as arxiv papers, news articles, or new books, and Wikipedia. We expected the models to generalize to these diverse, newly generated texts with high language likelihood, thereby supporting the concept of ”intelligence as compression” in a manner free from data leakage. The second scenario focused on predicting future events, suggesting that a superior model should be able to understand the present context, incorporate world knowledge, and generalize to future scenarios. In summary, the evaluation at temporal generalization offers two main benefits: it eliminates the possibility of data leakage through temporal boundaries, and its results can be objectively assessed without reliance on subjective interpretations.
Our analysis indicates that using validation loss of new text to evaluate models is mostly effective. However, we observe that while performance on language likelihood is a strong indicator of a model’s linguistic capabilities, it does not always align with specific abilities measured by existing benchmarks, which may represent discrete knowledge or other capacities that are important but not directly related to language modeling.
Our contributions are as follows:
-
•
We thoroughly define and quantify temporal generalization and bias, establishing a basis for understanding and assessing the capabilities of LLMs over time.
-
•
Through targeted experimental research, we assess the performance of existing large language models (LLMs) across various timeframes. We evaluate how these models handle tasks from different periods, providing insights into their historical and ongoing performance stability and adaptability.
-
•
We proposed an evaluation framework Freshbench to test the capabilities of LLMs in predicting future events. This framework is dynamically updated to reflect the latest data, ensuring that our evaluations remain relevant and accurate in the face of rapidly evolving data environments.
2 Conceptualization of Temporal Generalization
In this section, we will conceptualize Temporal Generalization in Sec. 2.1 and further measures it in 2.2. From a retrospective perspective in the Temporal Generalization, we also conceptualize Temporal Biases in Sec. 2.3 and quantify them in 2.4.
2.1 Temporal Generalization
LLMs face the ongoing challenge of remaining applicability as new text evolves. Consequently, it is crucial for these models to not only understand and generate text based on past and present data but also to anticipate and adapt to future linguistic trends. This leads us to an important concept below.
Definition 2.1.
Temporal Generalization refers to the LLMs’ ability to accurately understand, predict, and generate text relevant to past, present, and future contexts.
This requires the models to integrate and apply knowledge from historical and current data to adapt to the evolution of language and emerging trends. Temporal generalization highlights the challenge of designing models that remain effective and accurate over time, without the need for frequent re-training as new data is introduced. LLMs must maintain a delicate balance between leveraging historical data to understand long-standing language patterns and adapting to new expressions, terminology, and topics as they emerge.
2.2 Assessing Temporal Generalization
Having defined temporal generalization, we now turn to a dual-case study to illustrate the dynamic capabilities and limitations of LLMs while adapting to time-evolving linguistic and predictive challenges.
2.2.1 Case I: Language Likelihood
Predicting the likelihood of a sequence of words is a foundational aspect of natural language processing involved in language modeling. Perplexity, a measure of how uncertain a language model is about its predictions, has been critically evaluated in various studies. Saunshi et al. (2021) demonstrates how perplexity can significantly enhance zero-shot inference capabilities, highlighting the importance of these models in understanding and generating language. Wettig et al. (2023) and Tay et al. (2022) have scrutinized the direct correlation between low perplexity during pre-training and improved fine-tuning outcomes, while Liang et al. (2023) discusses the potential issues of data contamination when relying solely on historical text data.
Language Likelihood
In the assessment of language models, metrics such as perplexity (PPL) and bits per character (BPC) offer insights into model performance. Perplexity measures the model’s ability to predict a sequence of words by calculating the exponential of the negative average log likelihood. However, we refine our focus to BPC for a more normalized comparison.
Unlike traditional BPC which is specific to character-level language models, our adapted Bits Per Character (BPC) metric offers a comparison between models by normalizing the log likelihood based on character count, irrespective of the tokenization method, allowing for a more equitable assessment of model performance across different languages and tokenization schemes, the BPC is calculated as follows:
| (1) |
Here, represents the text being analyzed, is the number of tokens in (which may vary depending on the tokenizer), and is the length of when encoded in UTF-8, measured in characters. The tokens correspond to segments of text which may vary depending on the tokenizer used. This variance is due to different tokenization methods splitting the text into tokens at different granularities, ranging from subword units to characters.
2.2.2 Case II: Prognostication Prediction
Predictive modeling in the realm of LLMs is increasingly becoming a focal point of research due to its implications for understanding and forecasting dynamic real-world events. Bonde (2022) employed GPT-3 in a few-shot setting to tackle binary questions from the Metaculus platform, demonstrating the capabilities of LLMs in deriving informed predictions. Further, Zou et al. (2022) enriched the discourse by introducing a comprehensive dataset that includes forecasting questions alongside a news corpus. This approach enhances model training by incorporating varied and relevant data contexts. Moreover, Halawi et al. (2024) showcased how integrating news content can significantly improve the accuracy of predictions in real-time scenarios.
Building on this foundation, our research seeks to explore the temporal generalization capabilities of LLMs—how well they adapt and remain accurate as new data emerges and contexts evolve. We aim to deepen the understanding of how these models integrate and apply learned knowledge from past data to predict future events effectively through the case below.
Prognostication Prediction
As an example of using LLMs to predict political outcomes, we gather new factual data about future events, such as "What will President Biden’s approval rating be as of 7 June 2024, according to FiveThirtyEight?". To ensure objectivity in our predictions, answers are typically formatted as ranges within a prediction market scenario. For instance, President Biden’s approval rating might be categorized into intervals such as lower than 34%, at least 34.0%, but less than 36.0%, at least 36.0%, but less than 38.0%, up to 46.0% or higher.
However, since it is impossible to collect actual future data, we adopt a retrospective study approach. We use data available after the event’s question was initially posed and before the prediction market’s closure, treating this as ”future” data for model evaluation. This evaluation is an ongoing, online process, allowing to evaluate the model’s predictive capability in an objective and structured manner. Given the assessment’s nature, we define the accuracy of predictions, denoted by , as follows:
| (2) |
where represents the number of correct predictions and is the total number of predictions made. This metric evaluates the effectiveness of LLMs in predicting future events, serving as a straightforward measure of their performance in real-world scenarios.
This approach allows us to continuously evaluate the model with the latest data, ensuring that the assessment is reflective of the model’s current capabilities and the evolving nature of the information landscape. By evaluating the generalization capabilities of LLMs across those scenarios, we seek to better understand how these models incorporate and reflect perceived world knowledge when confronted with dynamic, real-world conditions.
2.3 Temporal Bias
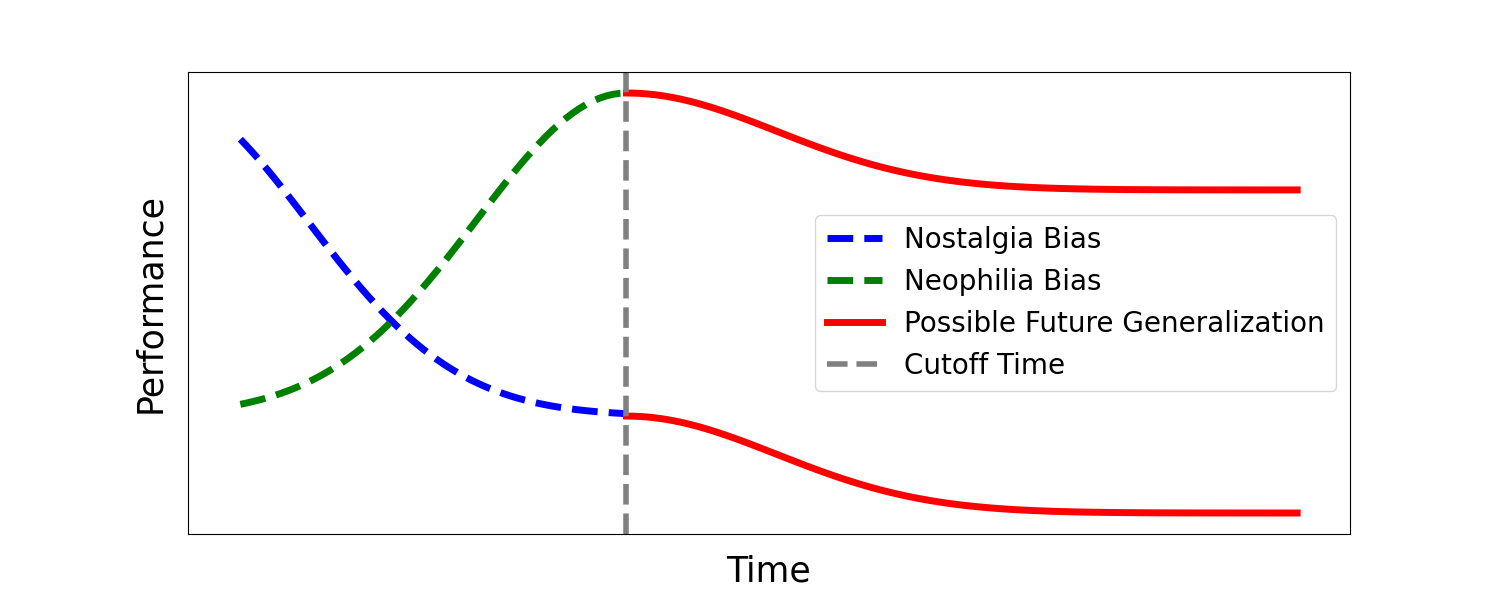
In the context of LLMs, there exists two biases, namely Nostalgia Bias (see Definition 2.2) and Neophilia Bias (see Definition 2.3), which reflect two contrasting tendencies in how these models might predict or generate text about the past, present, or future. Understanding the two biases is crucial for interpreting the models’ outputs, especially when attempting to predict future text. A visual representation of these biases is provided in Figure 1, where the trends associated with nostalgia and neophilia biases are plotted over time.
Definition 2.2.
Nostalgia Bias Nostalgia Bias in LLMs refers to a tendency to over-rely on or give undue preference to historical data or past events in generating text. This means that when predicting text about the past or the present, the model might disproportionately reflect the perspectives, styles, or information prevalent in its training data, which stops at a certain point in the past. This bias can lead to outputs that are more reflective of past conditions and less attuned to recent developments or changes that have occurred since the model’s last training data update. In essence, Nostalgia Bias can make a model seem ‘stuck in the past’, limiting its ability to accurately represent the present or predict the future.
Definition 2.3.
Neophilia Bias Neophilia Bias, on the other hand, would imply a model’s overemphasis on novelty, future trends, or speculative ideas, potentially at the expense of well-established information from the past or present. This bias could manifest in a model’s predictions or text generation leaning towards overly optimistic or speculative futures without sufficient grounding in historical data or current realities. While less likely in practice due to the nature of LLM training on historical datasets, a perceived Neophilia Bias could arise from the way prompts are structured or the interpretation of the model’s outputs, especially if they seem to prioritize futuristic concepts over historical accuracy.
In a word, Nostalgia bias refers to the model’s tendency to reflect knowledge from earlier periods before the training cutoff, whereas neophilia bias indicates a model’s inclination towards the most recent information near the cutoff time.
Challenges in Temporal Generalization Predicting future text with LLMs while navigating Nostalgia Bias and Neophilia Bias presents distinct challenges. On one hand, Nostalgia Bias can cause models to generate predictions that might not fully account for recent trends or emerging phenomena, making the predictions potentially outdated or irrelevant. On the other hand, an overcorrection towards Neophilia Bias (or an attempt to counteract Nostalgia Bias) could lead to predictions that are too speculative or disconnected from past (especially long-term) trajectories. The challenge lies in balancing these biases to leverage the historical and contemporary data effectively, ensuring that predictions about the future are both informed by past patterns and open to new possibilities. Achieving this balance requires careful selection and adjustment of the model’s training data, and possibly the integration of up-to-date information alongside the model’s outputs.
2.4 Qualitative Measurement of Temporal Bias
We aim to assess temporal bias qualitatively by introducing the Temporal Bias Index (TBI).
Definition 2.4.
Temporal Bias Index (TBI) qualitatively determines whether the model’s performance is biased towards past or future dates. It could be calculated by analyzing the slope of the performance over time, which indicates changes in model performance. A negative slope suggests a decline in performance, indicating a bias towards historical data, whereas a positive slope indicates an improvement, suggesting a bias towards more recent data.
The methodology for calculating TBI varies based on the metric used to measure model performance. Specifically, when performance is measured by language likelihood, we calculate the slope of BPC over time directly: This slope indicates whether BPC is increasing (a positive slope, suggesting degradation) or decreasing (a negative slope, indicating improvement).
Conversely, when performance is measured by the correctness of answers to questions, we define several key symbols: represents the total number of attempts at questions within the month, is the observed frequency of correct answers, is the expected frequency of correct answers under random guessing calculated based on the average number of options, and is the cumulative distribution function (CDF) of the standard normal distribution.
Using these symbols, the performance evaluation formula TBI is presented as follows:
| (3) |
Equation 3 normalizes the deviation between the observed frequency of correct answers and the expected frequency under random guessing, producing a performance score between 0 and 1. A higher score indicates better performance relative to the expected level of a standard normal distribution, effectively adjusting for the biases introduced by random guessing and the variability in the number of options.
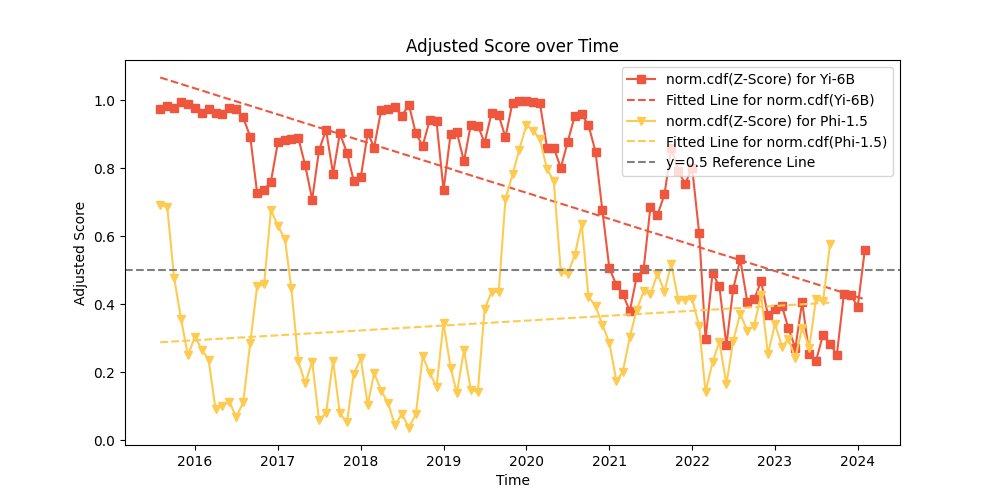
In our case study of temporal bias, as depicted in Figure 2, we demonstrate the validity of our defined measurement of temporal bias. The bias metric effectively gauges whether the model’s performance exhibits a tendency to favor either past or future dates.
3 Temporal Generalization in terms of Language Likelihood
Temporal generalization in language models evaluates their ability to maintain performance over time, even as data evolves. This section discusses how various models handle data from different periods, showcasing their performance stability or volatility.
3.1 Experimental Settings
Our system aggregates data from various platforms, including Yahoo for financial news, BBC for political insights, Reddit for discussions, Wattpad for literature, Wikipedia for encyclopedic updates, arXiv for academic research, GitHub for software trends, and Quora for diverse questions and answers. Utilizing a Python-based crawling framework, detailed in our public repository, it’s designed for adaptability and efficient data collection, with Playwright addressing navigation and specific site challenges. We also did some basic data pre-processing, see details in Appendix A. An overview of the data volume and the average entry length from a single crawl is provided in Appendix B.
Data sources of Fresh Corpora We selected a set of models due to their diversity and significance in advancing the capabilities of NLP systems. They are not only benchmarks of their respective sizes, ranging from 3 billion to 13 billion parameters, but also exemplify the rapid progression in NLP technology. The models originate from diverse sources, showcasing the collaborative and competitive spirit driving innovation in the industry.
To further delve into the model’s performance dynamics over varying text lengths, we truncate the input text to the first 5000 characters and compute the sum of loss. The loss values are then accumulated to derive their sum, providing insight into the model’s efficiency at different stages of text comprehension.
Additionally, we calculate the average loss over token length milestones—specifically at 10, 50, 100, 500, 1000, 1500, and 2000 tokens. This step allows us to observe the impact of length on the model’s understanding and predictive capabilities, highlighting how performance metrics vary with increasing input size.
3.2 Temporal Bias
The slope is obtained by performing a linear regression analysis where the independent variable is the month and the dependent variable is the model’s performance score, here is BPC, the lower the better, a negative slope indicates the presence of Neophilia Bias. Conversely, a positive slope would suggest that the model’s performance is decreasing, which shows Nostalgia Bias.
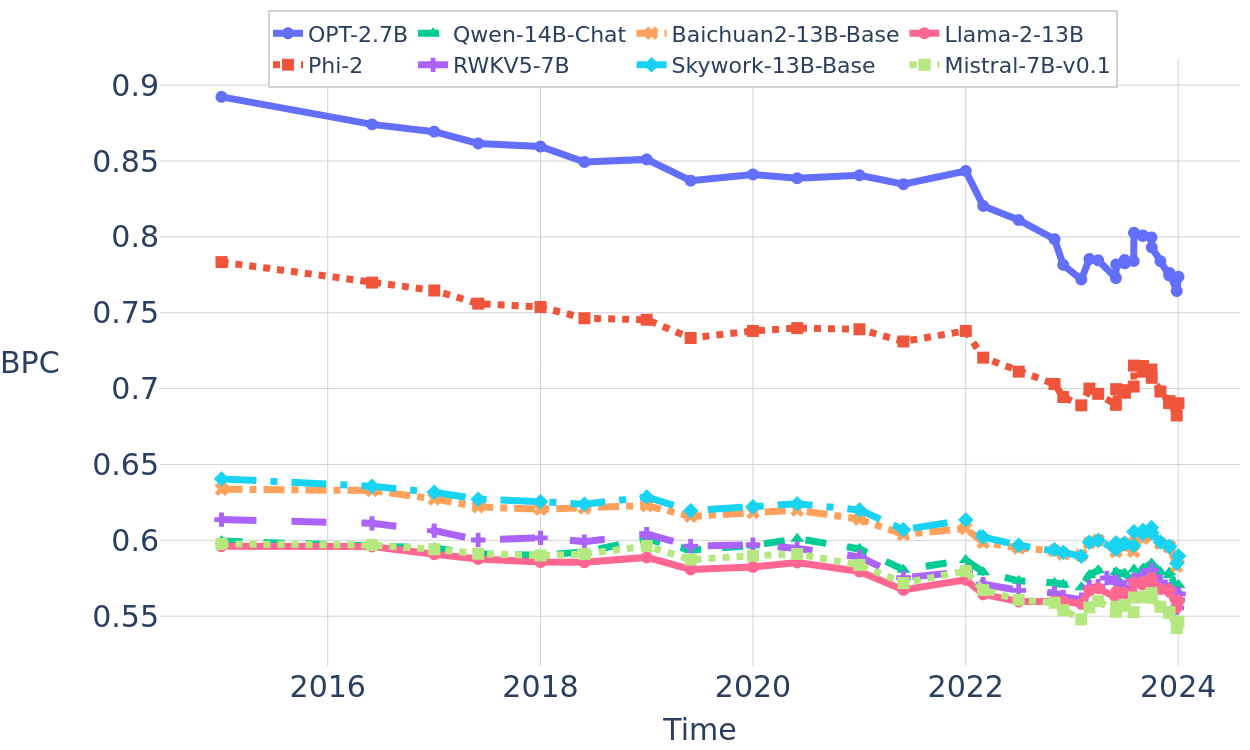
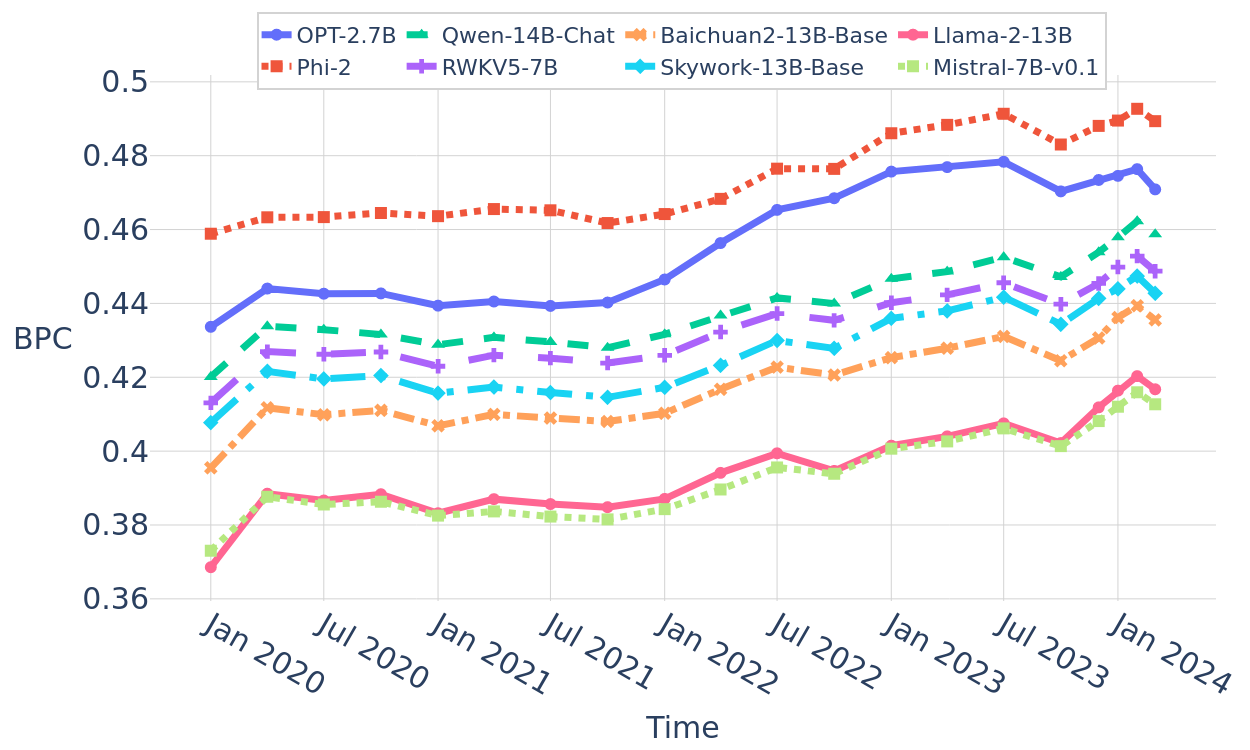
To delve deeper into the temporal generalization capabilities of models, we plot the BPC curve of fresh text over time. We sampled arXiv papers from 2015 to 2024 and applied smoothing techniques to the data because the number of samples was not sufficient to completely stabilize the average language likelihood. Nonetheless, a slight downward trend in model BPC can be observed, which is noteworthy. What is more, models with initially higher BPC showed a larger percentage decrease in BPC (as seen in models like OPT-2.7B and PHI-2 in Figure 4). For models with lower initial BPC, the decrease trend is less pronounced. Taking arXiv text as an example, nearly most models do not show clear flaws in absolute generalization, as BPC decreases over time. Moreover, in terms of arXiv data, LLMs exhibit a neophilia bias rather than a nostalgia bias, capturing the present more effectively than the past.
Turning to BBC news text, the observed trends in BPC from 2020 to 2023, depicted in Figure 4, provide insight into how well these models process and understand news content over a span of several years. As delineated in the figure, we note a pronounced increase in BPC across the observed period, which suggests a diminishing adaptability of the models to newer data, indicative of a nostalgia bias. This trend may stem from the dynamic and evolving nature of news narratives. Detailed data for arXiv, BBC, and Wiki datasets are listed in Table 1.
| Model Name | Released Date | TBI*1000 (arXiv) | TBI*1000 (BBC) | TBI*1000 (Wiki) |
| OPT-13B | May 2022 | -19.4 | 1689.0 | -30.2 |
| OPT-2.7B | May 2022 | -18.8 | 1080.7 | -46.9 |
| LLaMA-7B | Feb 2023 | -15.3 | 713.0 | 52.0 |
| Pythia-12B | Mar 2023 | -8.1 | 802.7 | -11.1 |
| Falcon-rw-1B | Apr 2023 | -26.8 | 607.4 | -47.7 |
| Baichuan-13B-Chat | Jun 2023 | -11.7 | 685.7 | 4.8 |
| Baichuan-7B-Chat | Jun 2023 | -14.6 | 726.6 | -16.5 |
| LLaMA-2-13B | Jul 2023 | -11.1 | 769.6 | 65.9 |
| LLaMA-2-7B | Jul 2023 | -12.6 | 684.6 | 23.2 |
| Baichuan-13B-Chat | Jul 2023 | -7.0 | 717.2 | 12.1 |
| Zhongjing-Base | Jul 2023 | -15.0 | 759.7 | 56.9 |
| InternLM-Chat-7B | Jul 2023 | -19.3 | 574.0 | -22.0 |
| Baichuan2-7B-Base | Aug 2023 | -9.5 | 687.5 | 3.7 |
| Baichuan2-7B-Chat | Aug 2023 | -8.4 | 781.8 | -11.6 |
| Mistral-7B-v0.1 | Sep 2023 | -15.1 | 756.8 | 10.4 |
| Phi-1.5 | Sep 2023 | -26.0 | 1212.9 | -60.7 |
| Baichuan2-13B-Base | Sep 2023 | -9.1 | 747.9 | 15.8 |
| Baichuan2-13B-Chat | Sep 2023 | -7.0 | 717.2 | 12.1 |
| Colossal-LLaMA-2-7B-Base | Sep 2023 | -21.2 | 696.3 | -36.2 |
| Qwen-14B-Chat | Sep 2023 | -7.9 | 762.2 | 51.5 |
| Qwen-7B | Sep 2023 | -11.7 | 662.4 | 7.4 |
| Qwen-7B-Chat | Sep 2023 | -13.2 | 705.7 | -3.6 |
| Skywork-13B-Base | Oct 2023 | -16.3 | 549.1 | 30.8 |
| ChatGLM3-6B | Oct 2023 | -25.5 | 412.6 | -70.4 |
| Zephyr-7B-beta | Oct 2023 | -21.1 | 506.9 | 3.7 |
| Yi-6B | Nov 2023 | -9.4 | 451.7 | 24.6 |
| Yi-6B-Chat | Nov 2023 | -9.4 | 506.5 | 20.2 |
| Qwen-1.8B | Nov 2023 | -22.7 | 374.0 | -46.2 |
| Qwen-1.8B-Chat | Nov 2023 | -25.3 | 426.8 | -50.3 |
| RWKV-v5-Eagle-7B | Nov 2023 | -12.8 | 511.3 | 4.2 |
| TinyLLaMA-1.1B-Chat-v0.6 | Dec 2023 | -25.0 | 300.1 | -45.3 |
| Phi-2 | Dec 2023 | -21.2 | 669.3 | -44.7 |
3.3 Temporal Generalization
To quantify model temporal generalization, we computed the BPC for various models on the Wiki and BBC datasets. We established a base BPC using data from the six months prior to each model’s release. Subsequently, we measured the changes in BPC at 3, 6, 9 and 12 months post-release relative to the base BPC. The specific results are detailed in Appendix C
The generalization of BPC in Wikipedia dataset shows that the models exhibit a relatively stable performance on Wikipedia data, which suggests a consistent ability to handle well-structured and formal text types like those found in Wikipedia.
The generalization of BPC in BBC dataset shows that, as opposed to Wikipedia data, providing a more significant differentiation between models. This distinction is crucial as it reveals the models’ ability to generalize to future, unseen data. Notably, although there is an overall trend of increasing BPC for BBC text from 2020 to 2024, the immediate post-cutoff performance of individual models varies. For instance, Baichuan2 series appears to adapt better to new texts, showcasing an improved familiarity with them. On the other hand, models like Zephyr exhibit poorer generalization in this context.
In our analysis across both the Wiki and BBC datasets, we have observed significant correlations between model attributes and performance decay, detailed in Table 2. The data shows a consistent pattern where higher benchmark scores correlate with faster performance decay, indicating a trade-off between capability and flexibility. This suggests that models with higher capabilities and sophistication, as reflected in their task scores, may compromise adaptability, becoming so specialized that they struggle to adjust to new or evolving data scenarios without a noticeable decrease in performance.
Specifially, in the Wiki dataset, larger models, which generally have higher capabilities, tend to decay quicker (with a correlation of 0.504), likely due to overfitting on training data. Conversely, in the BBC dataset, where the information is more dynamic and rapidly changing, the correlation between model size and performance decay is almost negligible, suggesting that the impact of model size on decay is significantly less in environments that continuously present new challenges. Additionally, across both datasets, newer models show larger correlations, hinting that despite their advanced capabilities, they may decay faster, potentially as a consequence of these enhanced capabilities.
These insights emphasize the importance of designing models that not only perform well on benchmarks but also maintain robustness over time and across varying data environments. As machine learning applications continue to grow in complexity and scale, the ability to generalize well temporally will become increasingly critical. This analysis serves as a cornerstone for future research aimed at enhancing the longevity and adaptability of machine learning models in dynamic settings.
| Task or model feature | Correlation with BPC change rate average (Wiki) | Correlation with BPC change rate average (BBC) |
| Model Size | 0.504 | -0.044 |
| Release Date(month since 2015) | 0.267 | 0.313 |
| MMLU | 0.599 | 0.384 |
| MMLU:Humanities | 0.500 | 0.317 |
| MMLU:SocialSciences | 0.594 | 0.311 |
| MMLU:STEM | 0.393 | 0.186 |
| MMLU:Other | 0.528 | 0.153 |
| GSM8 | 0.473 | 0.188 |
| Ar20c | 0.380 | -0.071 |
| Hellawasg | 0.581 | 0.248 |
| TrustfulQA | 0.200 | 0.485 |
| Winogrande | 0.632 | 0.204 |
| Longbench | 0.404 | 0.549 |
3.4 Correlation with Existing Benchmarks
The Selected Existing Benchmarks
We explored the correlation between BPC and existing benchmarks, particularly focusing on how specific content types, such as GSM, influence model performance. The selected benchmarks encompass common sense reasoning, depth and breadth of knowledge across diverse subjects, truthfulness, natural language understanding, and mathematical reasoning, ensuring a well-rounded assessment of the model’s performance.
| Benchmark | Description |
| HellaSwag | Tests an AI’s common sense reasoning by requiring it to complete sentences or narratives that reflect everyday logic, highlighting the model’s ability to predict logical continuations. (Zellers et al., 2019) |
| MMLU | Evaluates an AI’s breadth and depth of understanding across a diverse range of subjects, from science to literature, showcasing its versatility and comprehensive grasp of human language. (Hendrycks et al., 2021) |
| TruthfulQA | Focuses on the model’s capacity to provide honest and accurate responses, particularly to questions where the truth may not be intuitive, testing its commitment to truthfulness and its proficiency in avoiding misinformation. (Lin et al., 2022) |
| Winogrande | Assesses common sense reasoning and natural language understanding through sentence completion tasks, measuring an AI’s ability to apply common sense knowledge in language processing. (Sakaguchi et al., 2019) |
| GSM8K | Challenges AI models with elementary-level math problems, testing their mathematical reasoning capabilities and their understanding and application of basic math concepts. (Cobbe et al., 2021) |
Base vs. Chat Models
Table 4 shows the comparative analysis of base and tuned models. Our findings suggest that: 1) Base models exhibit a stronger correlation with established benchmarks, implying that these models, in their fundamental form, possess a robust capacity for modeling language. This observation advocates for conducting initial evaluations using base models to capture their intrinsic language modeling capabilities. 2) The exploration of tuned models reveals potential deeper patterns in model tuning, suggesting that specific tuning strategies may unlock further enhancements in model performance across different tasks and domains.
| Benchmarks | Loss of Base Model | Loss of Chat Model | Delta |
| MMLU | -0.61 | -0.22 | 0.39 |
| MMLU:Humanities | -0.59 | -0.42 | 0.17 |
| MMLU:SocialSciences | -0.54 | 0.42 | 0.96 |
| MMLU:STEM | -0.29 | 0.02 | 0.31 |
| MMLU:Other | -0.47 | -0.1 | 0.37 |
| Arc | -0.46 | 0.34 | 0.8 |
| Hellawasg | -0.66 | -0.57 | 0.09 |
| Wnogrande | -0.56 | 0.57 | 1.13 |
| Longbench | -0.04 | -0.65 | -0.61 |
| GSM8K | -0.4 | 0.22 | 0.62 |
| TrustfulQA | 0.05 | 0.39 | 0.34 |
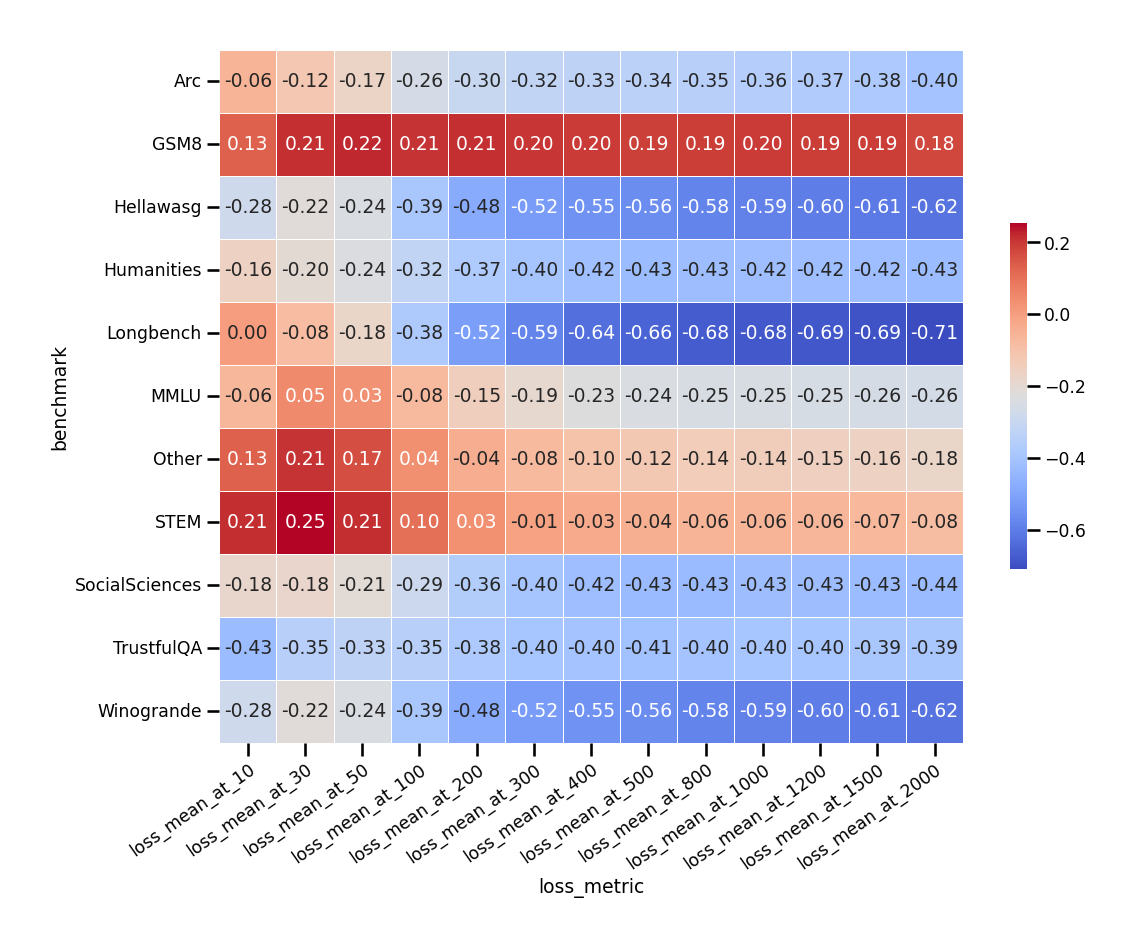
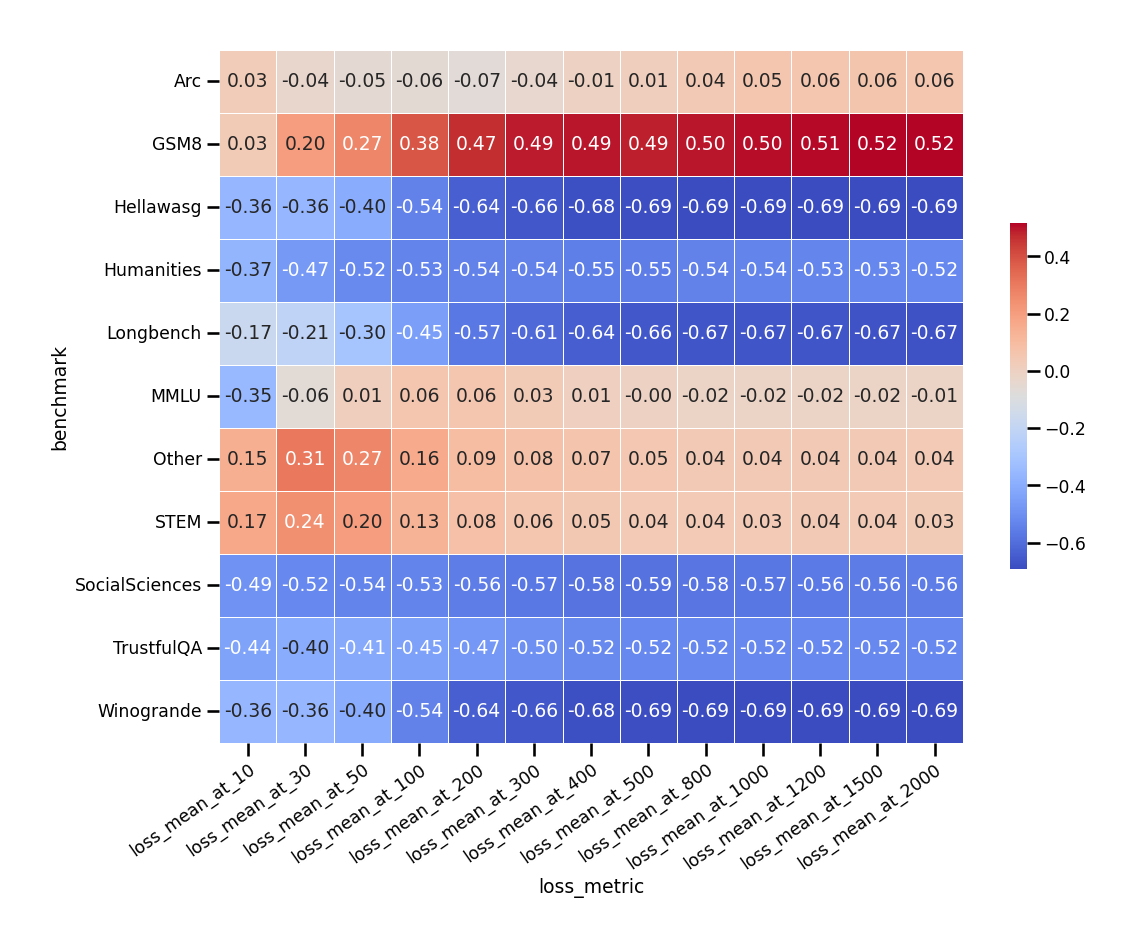
Correlation alone Text Length
Table 5 is about a long text understanding benchmark Longbench.
For chat models in this task, the correlation between BPC and scores is logical—higher probabilities of generating the text correlate with higher scores, and this correlation strengthens with longer text lengths. This suggests a consistent alignment between the model’s language likelihood in long text and its scoring, reinforcing the chat model’s robustness in handling extensive text inputs.
However, an inverse trend is observed with base models, where a familiar text paradoxically results in lower scores on related comprehension tasks. This indicates that fine-tuning may alter the base models’ understanding of the texts, perhaps shifting their processing in ways that do not favor traditional comprehension metrics.
This indicates scenarios where a model scores high on language likelihood due to its text-generation skills but may not perform equally well on tasks that require deep semantic understanding or critical thinking. Thus, relying solely on language likelihood as an indicator of overall performance might overlook crucial aspects of cognitive and interpretative abilities that are essential for more complex applications.
| Length | 10 | 30 | 50 | 100 | 200 | 300 | 400 | 500 | 800 | 1000 | 1200 | 1500 | 2000 |
| Base Models | 0.35 | 0.13 | 0.06 | -0.03 | -0.05 | -0.06 | -0.05 | -0.05 | -0.04 | -0.04 | -0.04 | -0.04 | -0.04 |
| Chat Models | 0.01 | -0.07 | -0.16 | -0.39 | -0.53 | -0.58 | -0.61 | -0.63 | -0.65 | -0.65 | -0.67 | -0.67 | -0.68 |
On the Genres of Corpora
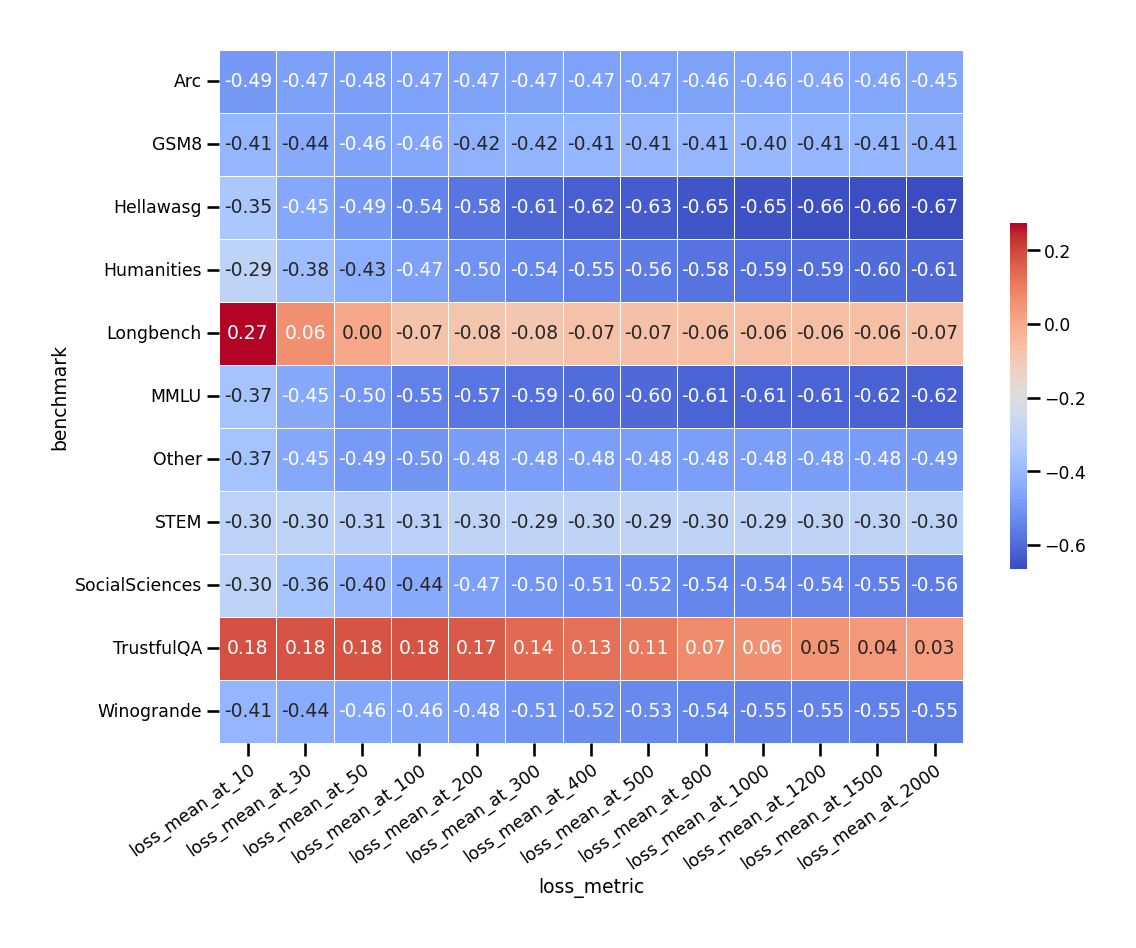
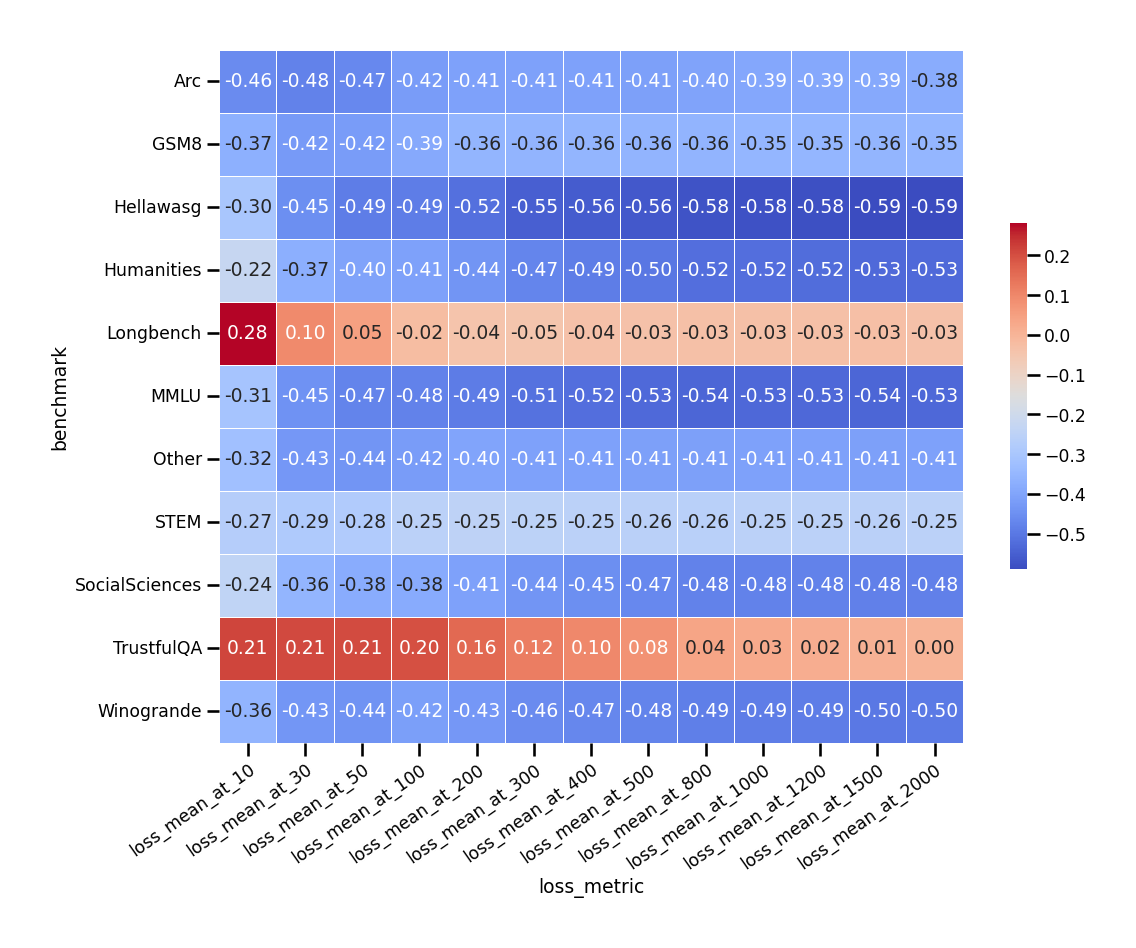
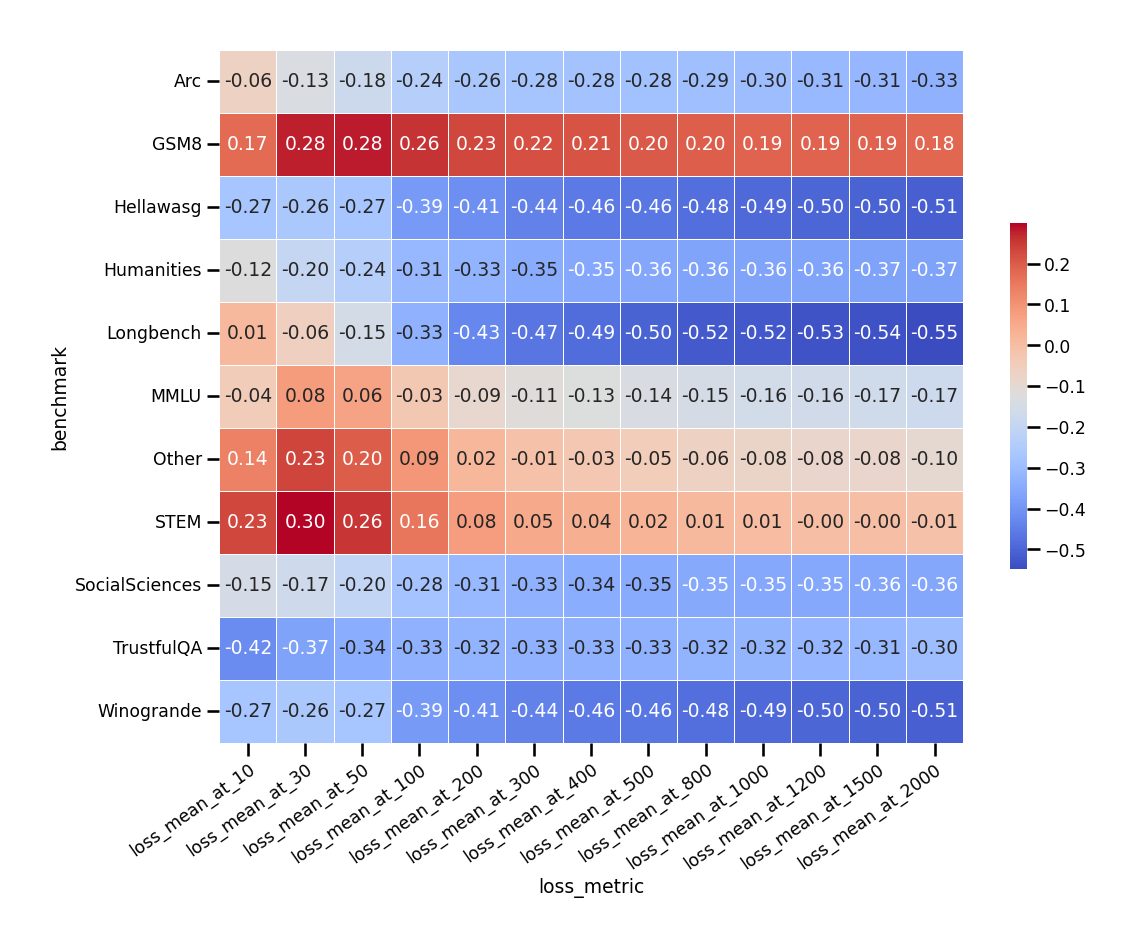
As can be seen in Appendix D, whether all models are observed or only those of a specific scale does not make a big difference. Comparisons across different model sizes show that the differences are not substantial, indicating consistency in performance correlations across benchmarks.
Further analysis from Table 6 within the MMLU benchmark sections reveals interesting patterns. While we assume models to be generally excel in domains closely aligned with their training data, this correlation is not strong. Specifically, STEM scores do not show strong correlation with STEM-related texts. Moreover, academic papers, even in Social Sciences and Humanities, exhibit stronger correlations than Internet data, which includes forums and news.
In this context, code-related data show similarities in performance correlation with academic texts, suggesting a closer alignment than previously anticipated. Similarly, Internet data, including forums and news, also shows comparative closeness in performance, indicating nuanced relationships across different types of content.
| Benchmark | Academia STEM | Academia non-STEM | Code | Internet article | Internet Chat |
| MMLU:STEM | -0.17 | -0.19 | -0.11 | -0.01 | -0.01 |
| MMLU:Humanities | -0.54 | -0.53 | -0.51 | -0.29 | -0.39 |
| MMLU:Social Sciences | -0.49 | -0.42 | -0.46 | -0.25 | -0.31 |
Additionally, compared to chat forum texts, more formal academic texts demonstrate a stronger correlation with benchmarks. The genre of text has a minor impact on the sign of the correlation coefficient, which is relatively small compared to the differences across model types.
3.5 The Drawbacks of Evaluating Language Likelihood
Inaccessibility to API-based Models
A fundamental limitation of using language likelihood as a metric lies in its inapplicability to closed-source models, where key indicators such as perplexity, logits, or losses are inaccessible. This restriction excludes a broad spectrum of proprietary models from evaluation and significantly narrows the scope of comparative analysis. The consequent inability to assess these models hampers our ability to gain a comprehensive understanding of the language technology landscape and the capabilities of different models within it.
Susceptibility to Training Focus
The effectiveness of language likelihood as a metric can be compromised by models that are finely tuned or trained with a particular emphasis on certain formats or domains. In such cases, the likelihood measure might disproportionately favor these specialized areas, skewing the overall evaluation and presenting a distorted view of a model’s general performance.
4 Temporal Generalization in terms of Prognostication Prediction
The above Drawbacks in Sec. 3.5 motivated us to research temporal generalization and bias from the perspective of future prediction. In the context of the model release date, events that occurred before this date are considered ”past events”, while those that took place after are termed ”future events”. In this chapter, we have divided the experiments into two categories based on this criterion: Bias and Temporal Generation.
4.1 Experimental Settings
4.1.1 Data Source
We have sourced all questions from Good Judgment Open and all binary questions from Metaculus through web scraping and API downloads. The collected data includes initiation and conclusion dates, domains, questions, descriptions, and answers, which are ordered appropriately for further processing.
4.1.2 Extraction of Predictive Responses
Using the lm-eval-harness (Gao et al., 2023) tool, we predict model choices based on probability associated with each option. This probability-driven method serves as a reliable metric for evaluating the predictive performance of language models across a variety of topics and question formats.
4.2 Temporal Bias
As can be seen in Table 7, most analyzed models exhibit a negative slope. This is an uncommon scenario in a typical statistical analysis, indicating a general tendency across models to perform better or be more aligned with historical data than recent data. We define the following classification thresholds to discern subtle differences in how models handle temporal information, despite an overall inclination towards nostalgia.
-
•
Positive TBI (Neophilia Bias): TBI values greater than 0.001 suggest the model has a neophilia bias. This implies the model’s performance is better on more recent data, potentially favoring newer over older training data.
-
•
Near-Zero TBI (Balanced): TBI values between -0.001 and 0.001 indicate a balanced performance over time. A TBI of 0, in particular, suggests that the model’s performance is evenly distributed around the mean, showing no temporal bias.
-
•
Negative TBI (Nostalgia Bias): TBI values less than -0.001 indicate a nostalgia bias, suggesting the model may favor historical data, possibly overlooking important recent information.
The choice of ±0.001 as the threshold for these categories is designed to fine-tune the sensitivity of our analysis to subtle temporal biases, ensuring that the classification is both meaningful and practically significant.
| model | TBI | y-axis intercept | bias category |
| OPT-13B | -1.37 | 0.70 | Nostalgia |
| OPT-2.7B | -2.85 | 0.97 | Nostalgia |
| LLaMA-7B | -3.71 | 0.96 | Nostalgia |
| Pythia-12B | -3.90 | 0.95 | Nostalgia |
| Falcon-rw-1B | -2.47 | 0.84 | Nostalgia |
| Baichuan-13B-Chat | -2.79 | 0.98 | Nostalgia |
| Baichuan-7B-Chat | -1.17 | 0.80 | Nostalgia |
| GPT-3.5-turbo-0613 | -0.81 | 0.86 | Symmetrical |
| LLaMA-2-7B | -1.66 | 0.75 | Nostalgia |
| LLaMA-2-13B | -0.80 | 0.73 | Symmetrical |
| LLaMA-2-7B-Chat | -3.92 | 0.93 | Nostalgia |
| Zhongjing-Base | 0.08 | 0.63 | Symmetrical |
| InternLM-Chat-7B | -1.76 | 0.94 | Nostalgia |
| Baichuan2-7B-Base | -3.50 | 0.84 | Nostalgia |
| Baichuan2-7B-Chat | -3.71 | 0.94 | Nostalgia |
| Mistral-7B-v0.1 | -0.47 | 0.75 | Symmetrical |
| Phi-1.5 | 0.24 | 0.38 | Symmetrical |
| Baichuan2-13B-Base | -3.06 | 0.72 | Nostalgia |
| Baichuan2-13B-Chat | -1.53 | 0.70 | Nostalgia |
| Colossal-LLaMA-2-7B-Base | -3.38 | 0.91 | Nostalgia |
| Qwen-14B-Chat | -2.31 | 0.93 | Nostalgia |
| Qwen-7B | -0.35 | 0.69 | Symmetrical |
| Qwen-7B-Chat | -2.98 | 0.62 | Nostalgia |
| Skywork-13B-Base | -1.46 | 0.65 | Nostalgia |
| ChatGLM3-6B | -4.46 | 0.92 | Nostalgia |
| Zephyr-7B-beta | -2.73 | 0.99 | Nostalgia |
| Yi-6B | -5.18 | 0.98 | Nostalgia |
| Yi-6B-Chat | 0.34 | 0.71 | Symmetrical |
| Qwen-1.8B | -3.59 | 0.80 | Nostalgia |
| Qwen-1.8B-Chat | -4.32 | 0.96 | Nostalgia |
| GPT-4-1106 | -0.08 | 0.96 | Symmetrical |
| TinyLLaMA-1.1B-Chat-v0.6 | -1.78 | 0.53 | Nostalgia |
| Gemini-pro-1213 | -0.43 | 0.76 | Symmetrical |
| Phi-2 | -1.54 | 0.77 | Nostalgia |
Table 8 shows an analysis covering the period from 2015 to 2024, with the year 2019 serving as a pivotal midpoint, a distinct pattern emerges from the performance data of various language models: all models reached their peak accuracy before 2020. This observation points to a notable trend toward ”nostalgia,” where models demonstrate optimal performance on data from the earlier part of the timeline analyzed. This tendency highlights the models’ alignment with the informational characteristics prevalent prior to the latter half of the observed period, suggesting their training data may disproportionately reflect earlier times.
The peak accuracy periods analyzed are based on the average accuracy of all questions within three-month intervals, to provide a stable and robust assessment of each model’s performance.
| Peak Period | Model | Peak Time of Accuracy | Cutoff Time | Interpolation |
| Post-2019 | TinyLLaMA1.1B | 2019-07 | 2023-11 | 52 |
| 2017 to 2018 | GPT4-1106 | 2018-07 | 2023-06 | 59 |
| LLaMA2-13B | 2018-07 | 2023-02 | 55 | |
| Baichuan2-13B-Base | 2018-01 | 2023-06 | 65 | |
| 2015 to 2016 | Baichuan2-7B-Chat | 2016-01 | 2023-08 | 91 |
| Colossal-LLaMA-2-7B-Base | 2016-01 | 2023-09 | 92 | |
| LLaMA2-7B | 2016-01 | 2023-02 | 85 |
4.3 Temporal Generalization
It is crucial to note that for models, any data post-release represents the future, allowing us to assess their generalization capabilities on upcoming events.
In the analysis of temporal generalization, it is important to acknowledge that the performance of models post-release primarily reflects their ability to predict future events based on past training. As evidenced by the data in Table 9, many models show significant fluctuations in accuracy percentages following their release. This variability suggests that immediately after the cutoff event, most models are essentially guessing, leading to high volatility in performance metrics.
Given the substantial fluctuations observed post-release, the temporal generalization of current models may appear to have limited significance. This is largely because these models exhibit weak capabilities in adapting to new, unseen data, often resulting in what can be described as near-random performance at the cutoff point. Such outcomes highlight the models’ limited understanding of the world and their inability to effectively generalize from past information to future contexts.
However, this should not detract from the potential utility of these measures in the future. As language models continue to evolve and become more sophisticated in their world understanding, the metric of temporal generalization will likely become more relevant and insightful. Future models that better comprehend and adapt to the world will provide more meaningful insights into their generalization capabilities over time, thereby enhancing the value of this assessment.
The current limitations underscore the need for further development in language modeling, particularly in improving the models’ ability to generalize across time. As we progress towards models with a deeper and more accurate understanding of complex world dynamics, temporal generalization measures will play a crucial role in evaluating their long-term effectiveness and adaptability.
| Base adjusted ACC | Adjusted ACC Change at 3 months (%) | Adjusted ACC Change at 6 months (%) | Adjusted ACC Change at 9 months (%) | adjusted ACC Change at 12 months (%) | Mean (%) | |
| Model | ||||||
| OPT-2.7B | 0.86 | 0.11 | -13.63 | -23.41 | -18.98 | -13.98 |
| LLaMA-7B | 0.66 | -0.31 | -20.59 | 5.09 | 9.89 | -1.48 |
| Pythia-12B | 0.77 | -27.68 | -24.85 | -6.22 | -3.68 | -15.61 |
| Falcon-rw-1B | 0.69 | -34.51 | -8.30 | 7.15 | -4.52 | -10.04 |
| Baichuan-13B-Chat | 0.64 | 0.69 | 12.79 | 8.00 | 0.13 | 5.40 |
| GPT-3.5-turbo-0613 | 0.65 | -29.81 | 16.71 | 26.91 | -39.69 | -6.47 |
| LLaMA-2-13B | 0.57 | 29.19 | 38.00 | 34.54 | - | 33.91 |
| LLaMA-2-7B | 0.54 | 25.57 | 41.09 | 27.09 | - | 31.25 |
| LLaMA-2-7B-Chat | 0.61 | 25.39 | 23.81 | 12.52 | - | 20.58 |
| Zhongjing-Base | 0.59 | 25.16 | 37.70 | 14.65 | - | 25.83 |
| InternLM-Chat-7B | 0.48 | 3.43 | 25.13 | 21.65 | - | 16.74 |
| Baichuan2-7B-Base | 0.60 | 14.99 | 32.31 | 4.81 | - | 17.37 |
| Baichuan2-7B-Chat | 0.60 | 16.12 | 22.67 | -18.59 | - | 6.73 |
| Mistral-7B-v0.1 | 0.61 | 30.25 | 34.87 | -22.79 | - | 14.11 |
| Phi-1.5 | 0.65 | 19.30 | 10.78 | -17.57 | - | 4.17 |
| Baichuan2-13B-Base | 0.61 | 10.81 | 17.67 | 6.75 | - | 11.75 |
| Colossal-LLaMA-2-7B-Base | 0.58 | 15.99 | 3.33 | - | - | 9.66 |
| Qwen-14B-Chat | 0.59 | 14.68 | 14.30 | - | - | 14.49 |
| Qwen-7B | 0.62 | 7.45 | -7.31 | - | - | 0.07 |
| Qwen-7B-Chat | 0.48 | 60.26 | 74.85 | - | - | 67.55 |
| Skywork-13B-Base | 0.61 | 20.20 | 5.04 | - | - | 12.62 |
| ChatGLM3-6B | 0.60 | 3.24 | 6.29 | - | - | 4.76 |
| Zephyr-7B-beta | 0.61 | 14.33 | 18.22 | - | - | 16.28 |
| Yi-6B | 0.63 | 8.42 | -9.47 | - | - | -0.53 |
| Yi-6B-Chat | 0.67 | 13.11 | -6.19 | - | - | 3.46 |
| Qwen-1.8B | 0.68 | -6.93 | -33.98 | - | - | -20.46 |
| Qwen-1.8B-Chat | 0.73 | 4.74 | -8.91 | - | - | -2.08 |
| RWKV-v5-Eagle-7B | 0.70 | -0.09 | -20.38 | - | - | -10.23 |
| GPT-4-1106 | 0.42 | 6.67 | -7.11 | - | - | -0.22 |
| TinyLLaMA-1.1B-Chat-v0.6 | 0.71 | 13.27 | -16.30 | - | - | -1.51 |
| Gemini-pro-1213 | 0.71 | -15.15 | -41.28 | - | - | -28.21 |
| Phi-2 | 0.81 | 7.11 | - | - | - | 7.11 |
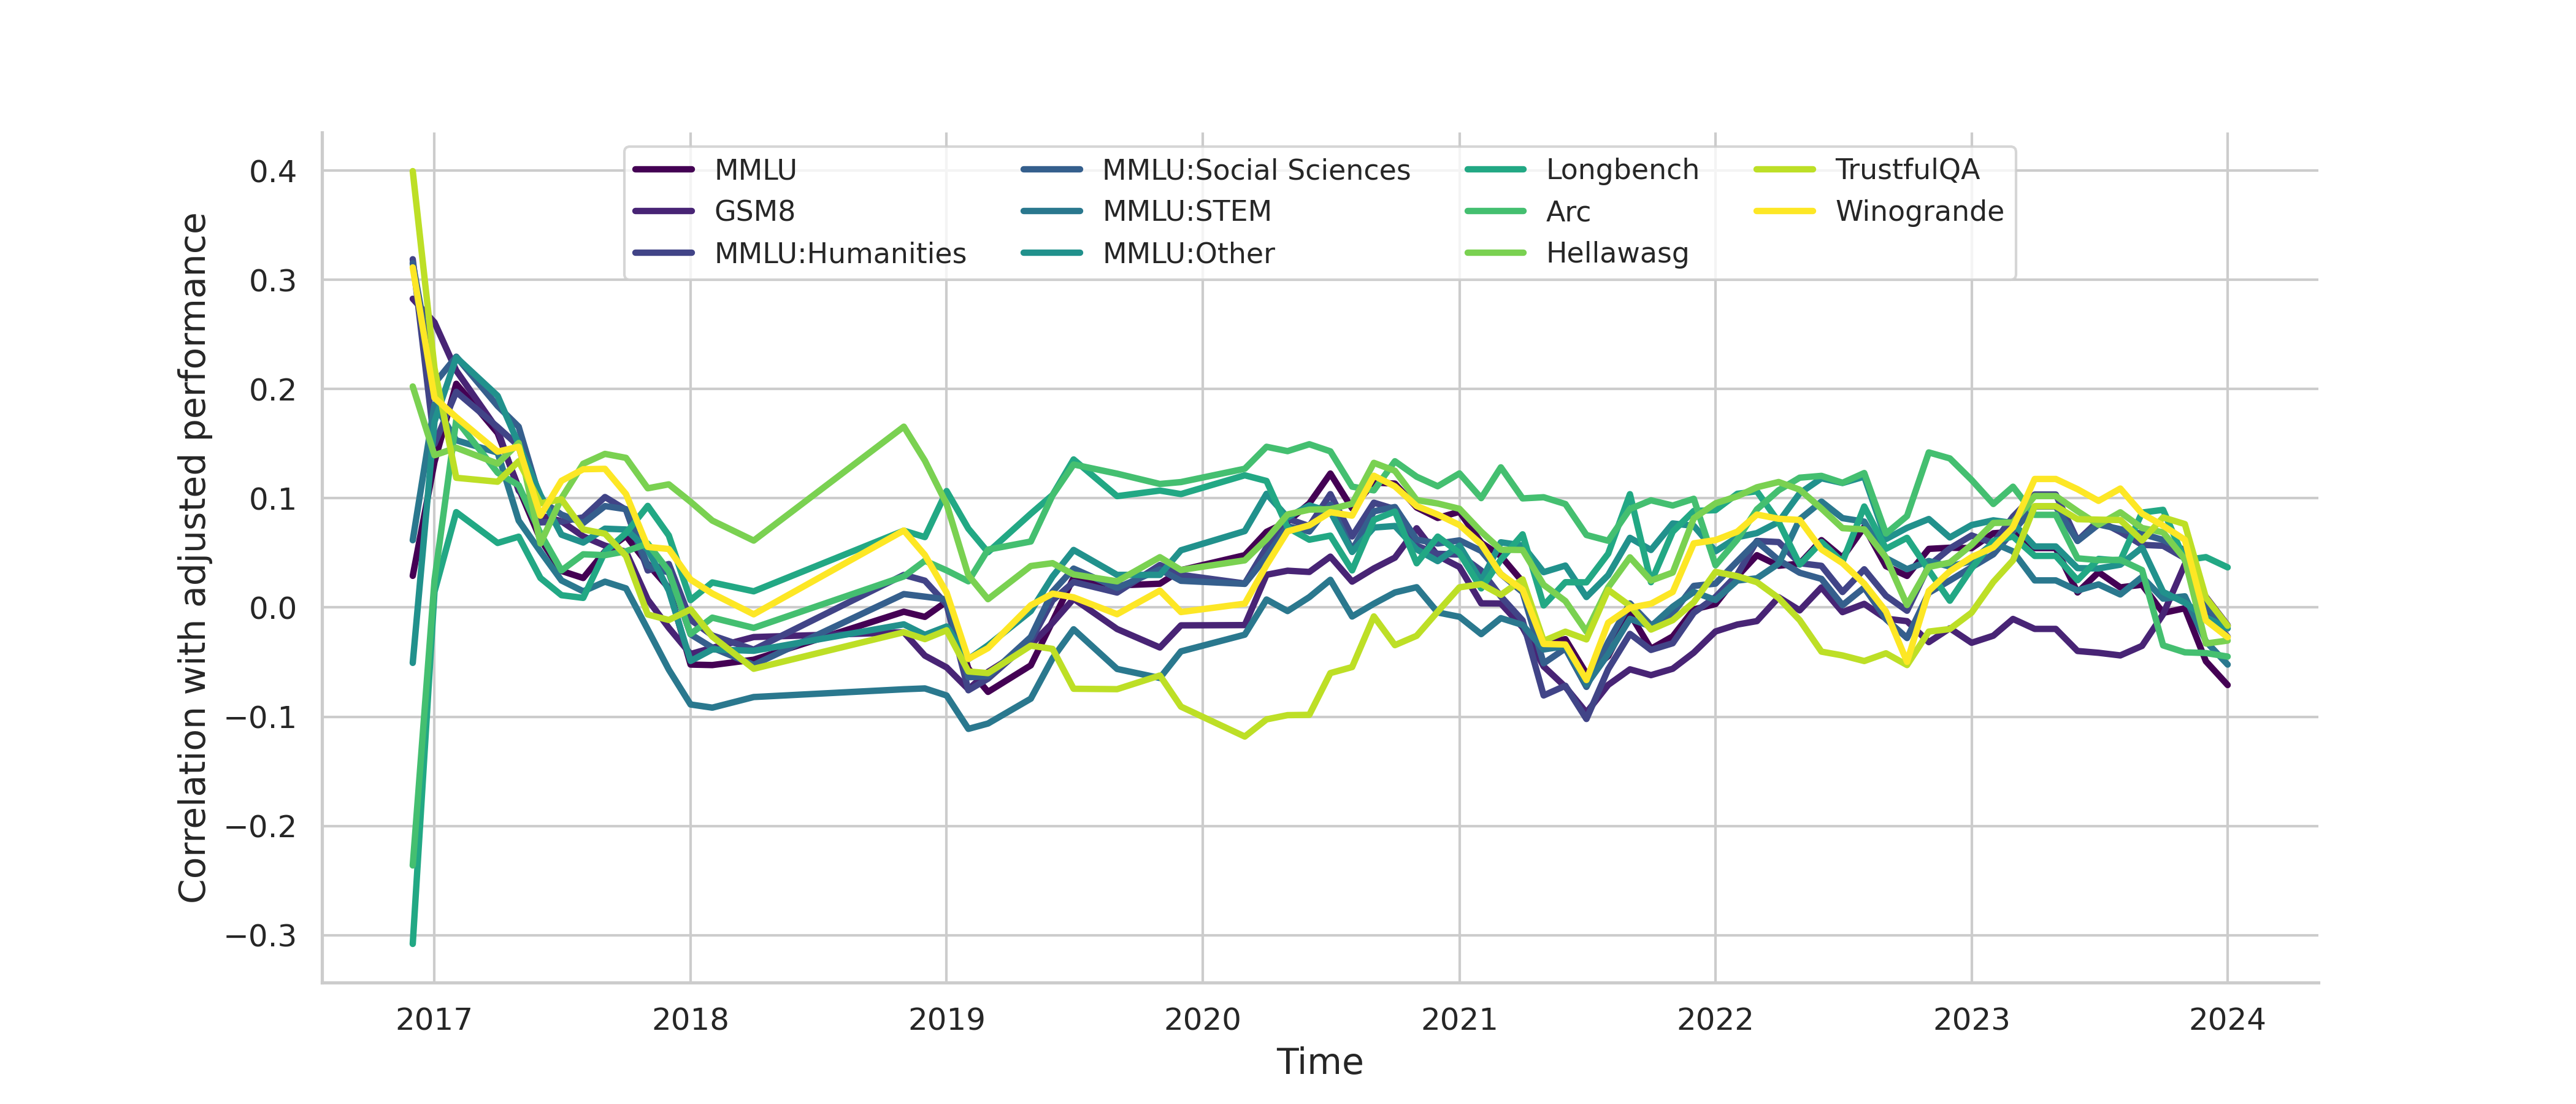
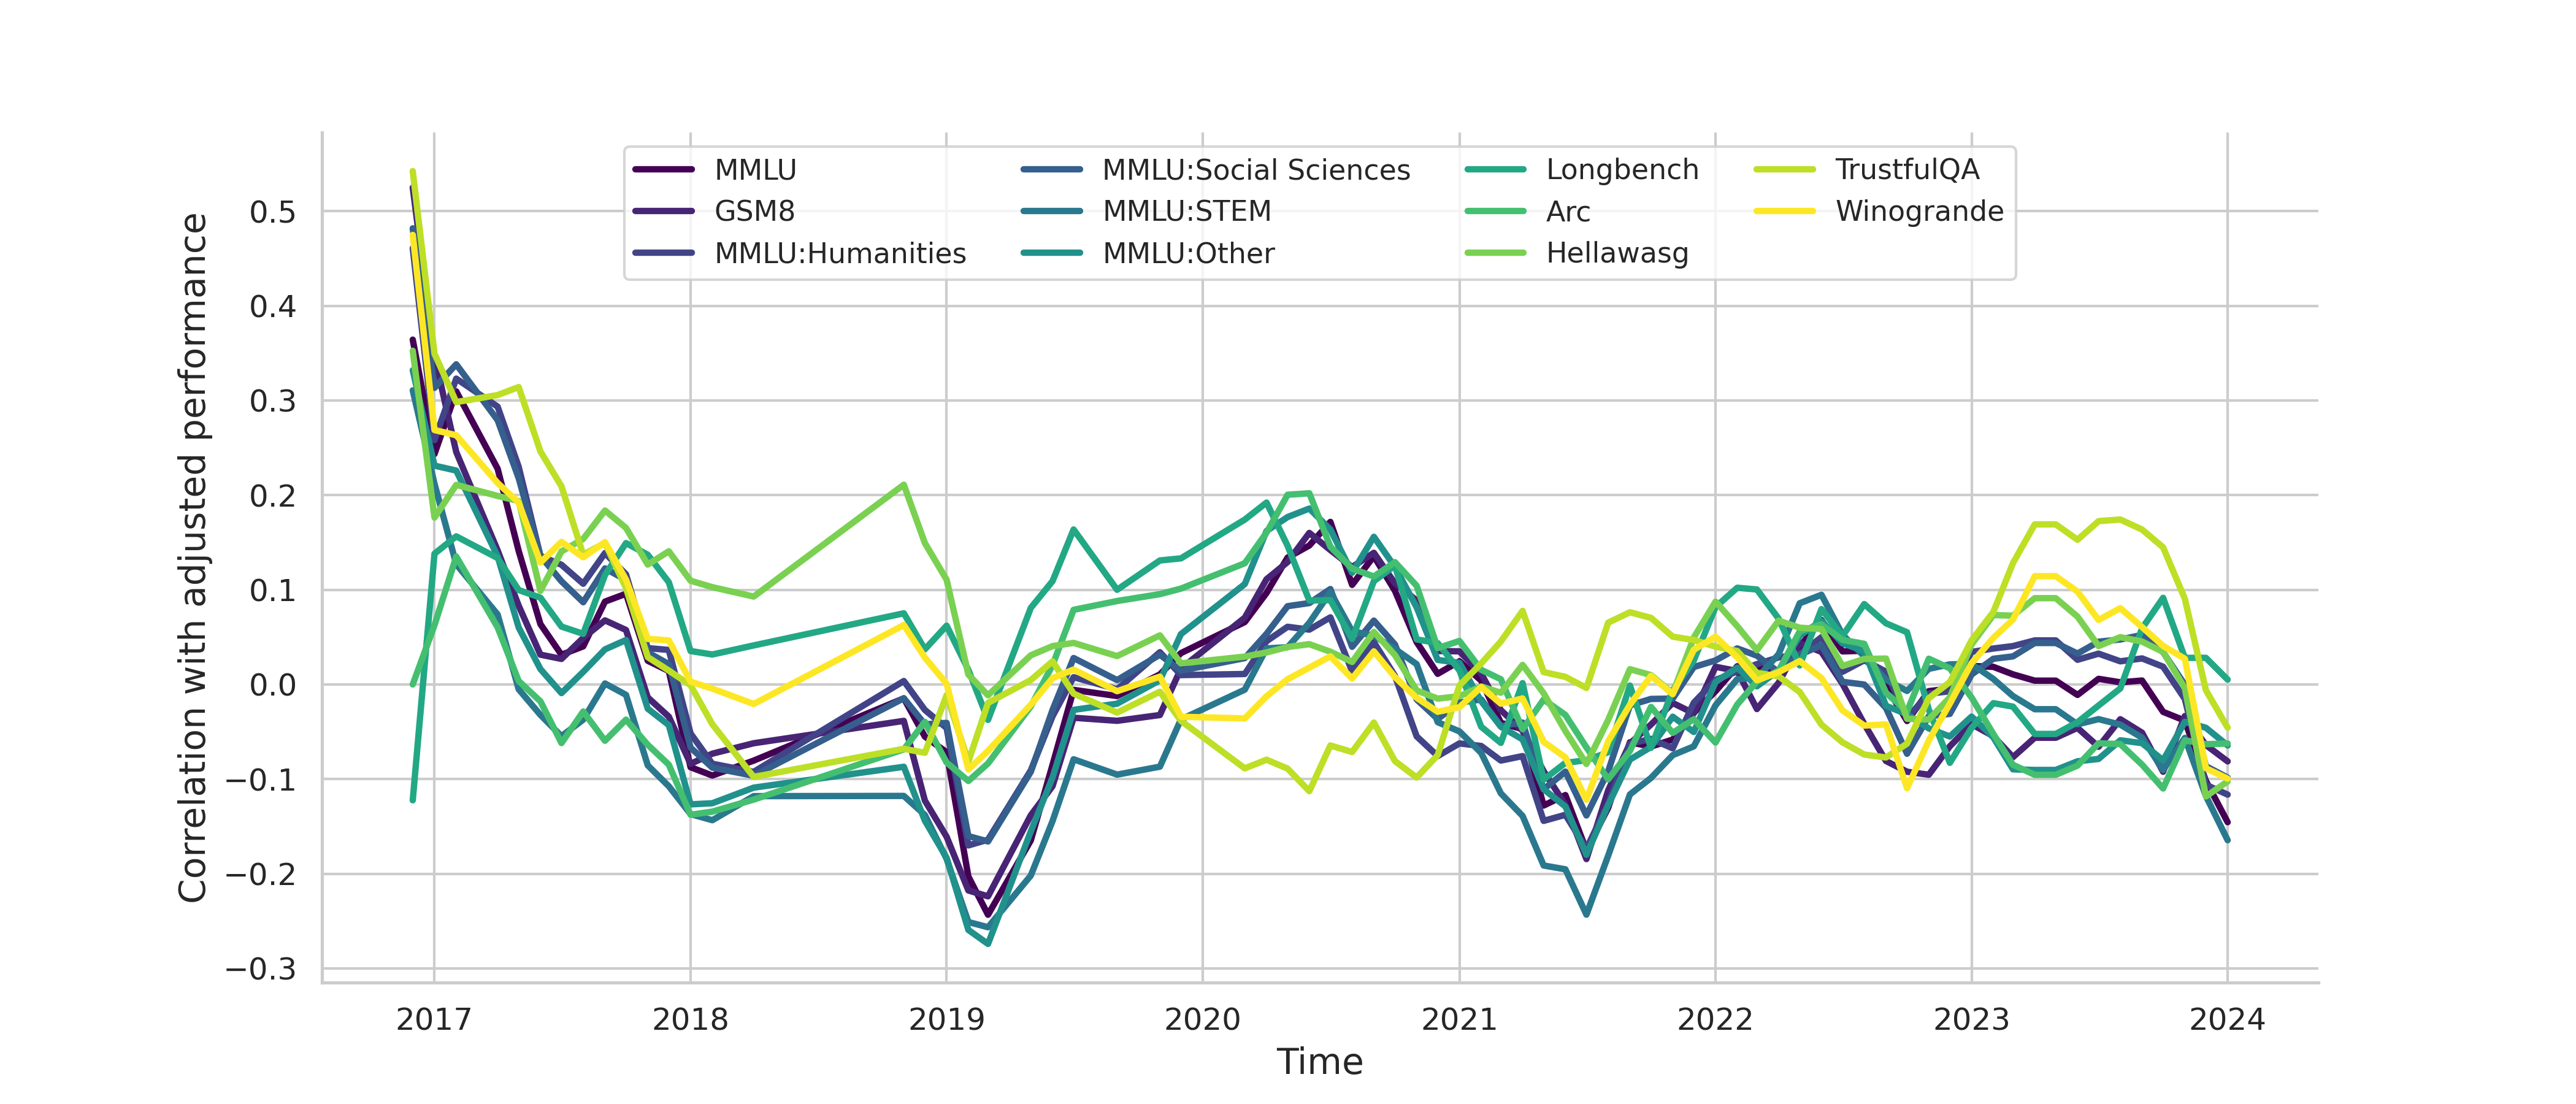
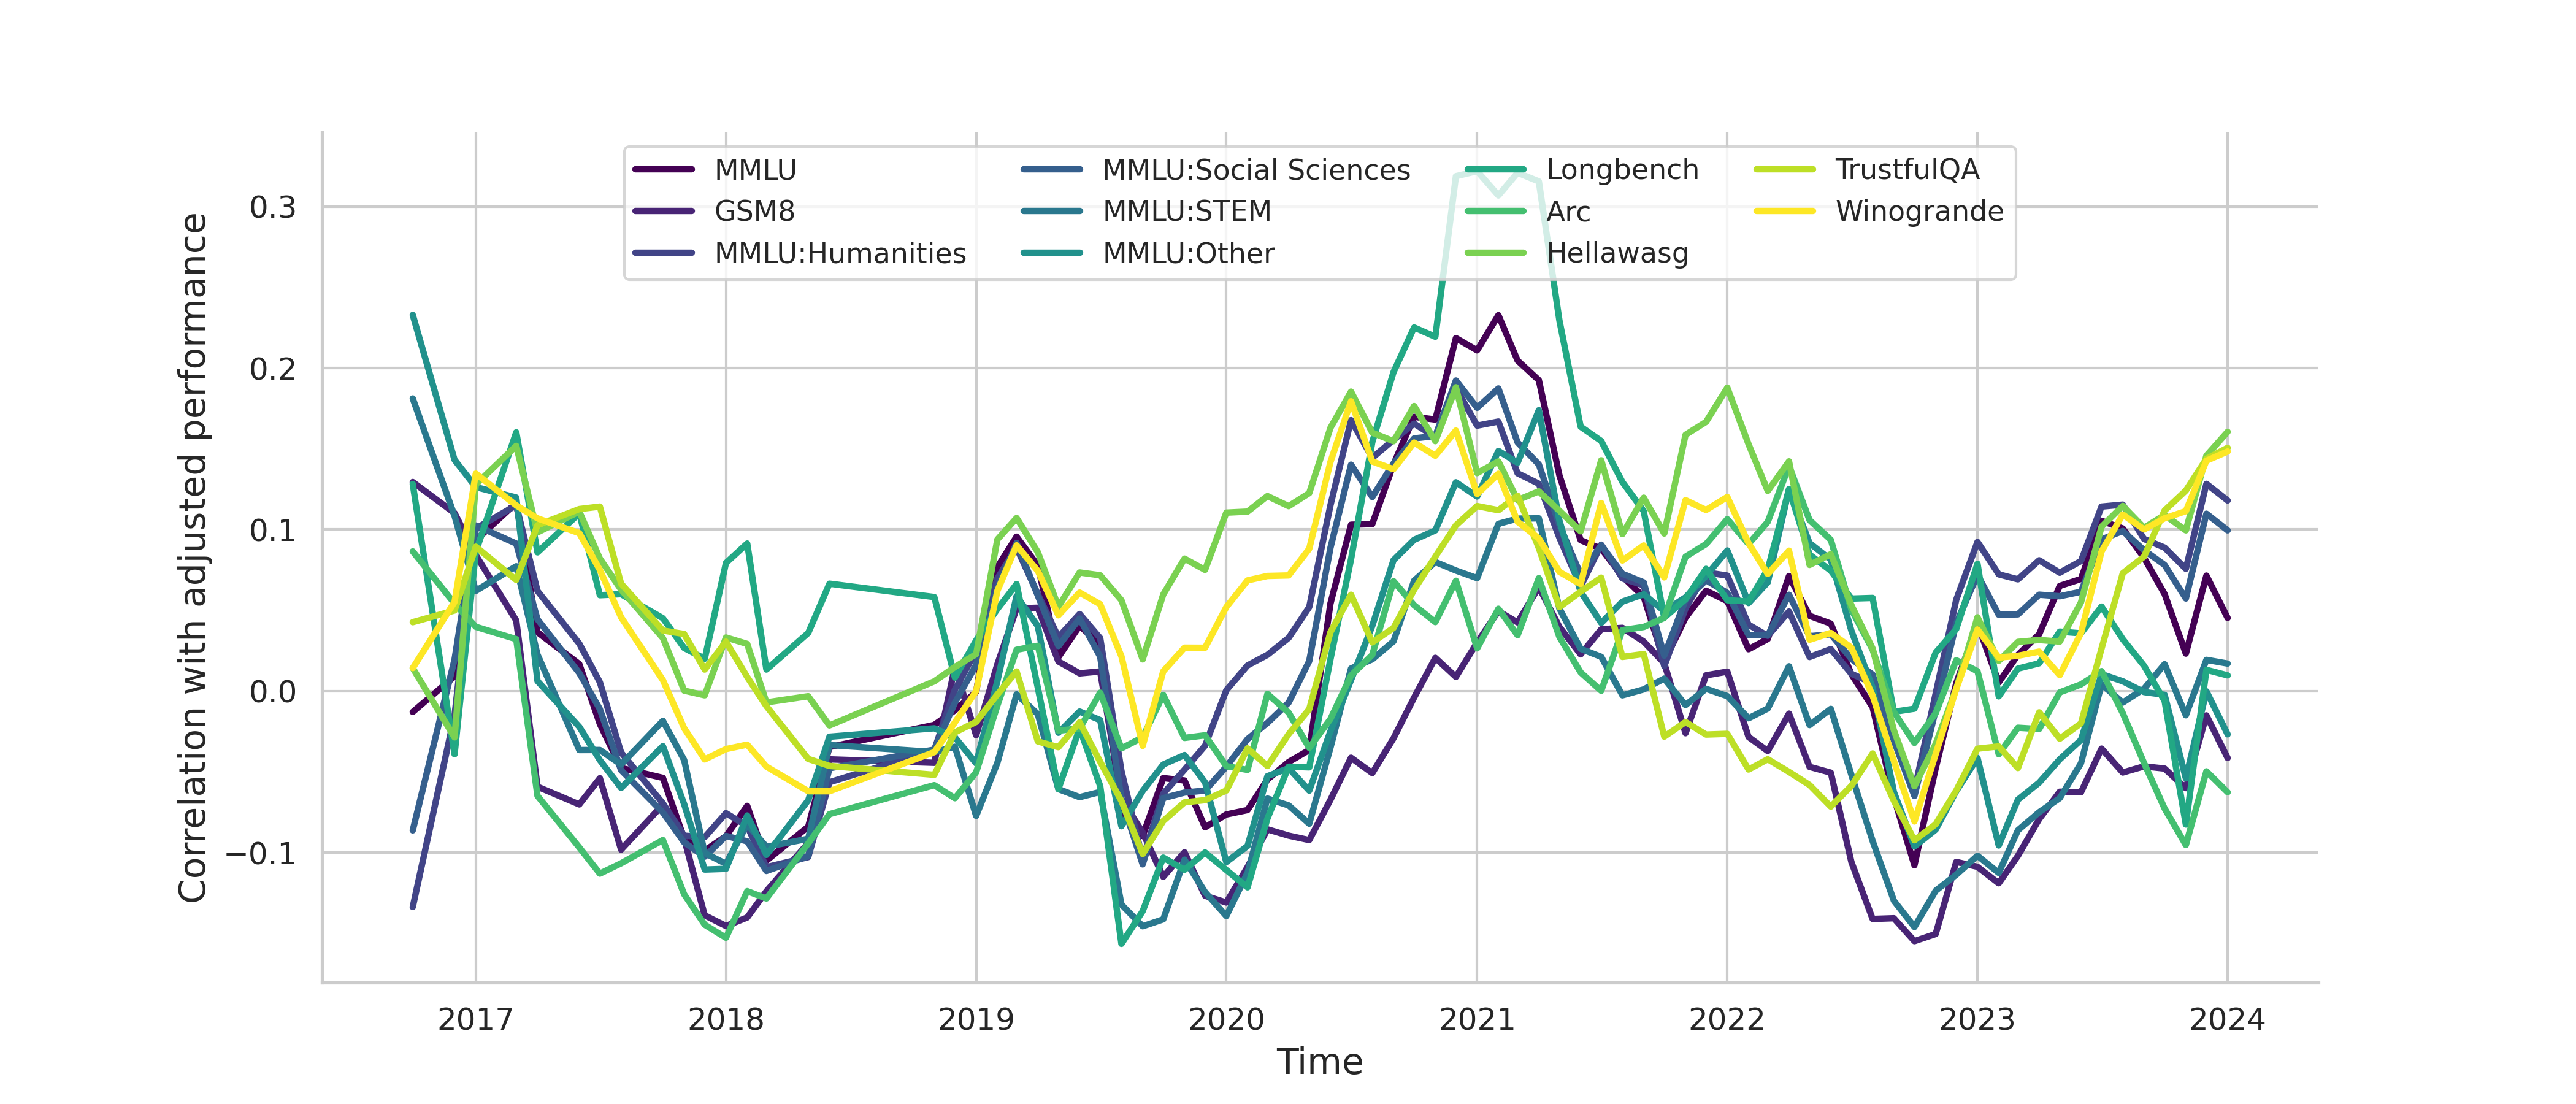
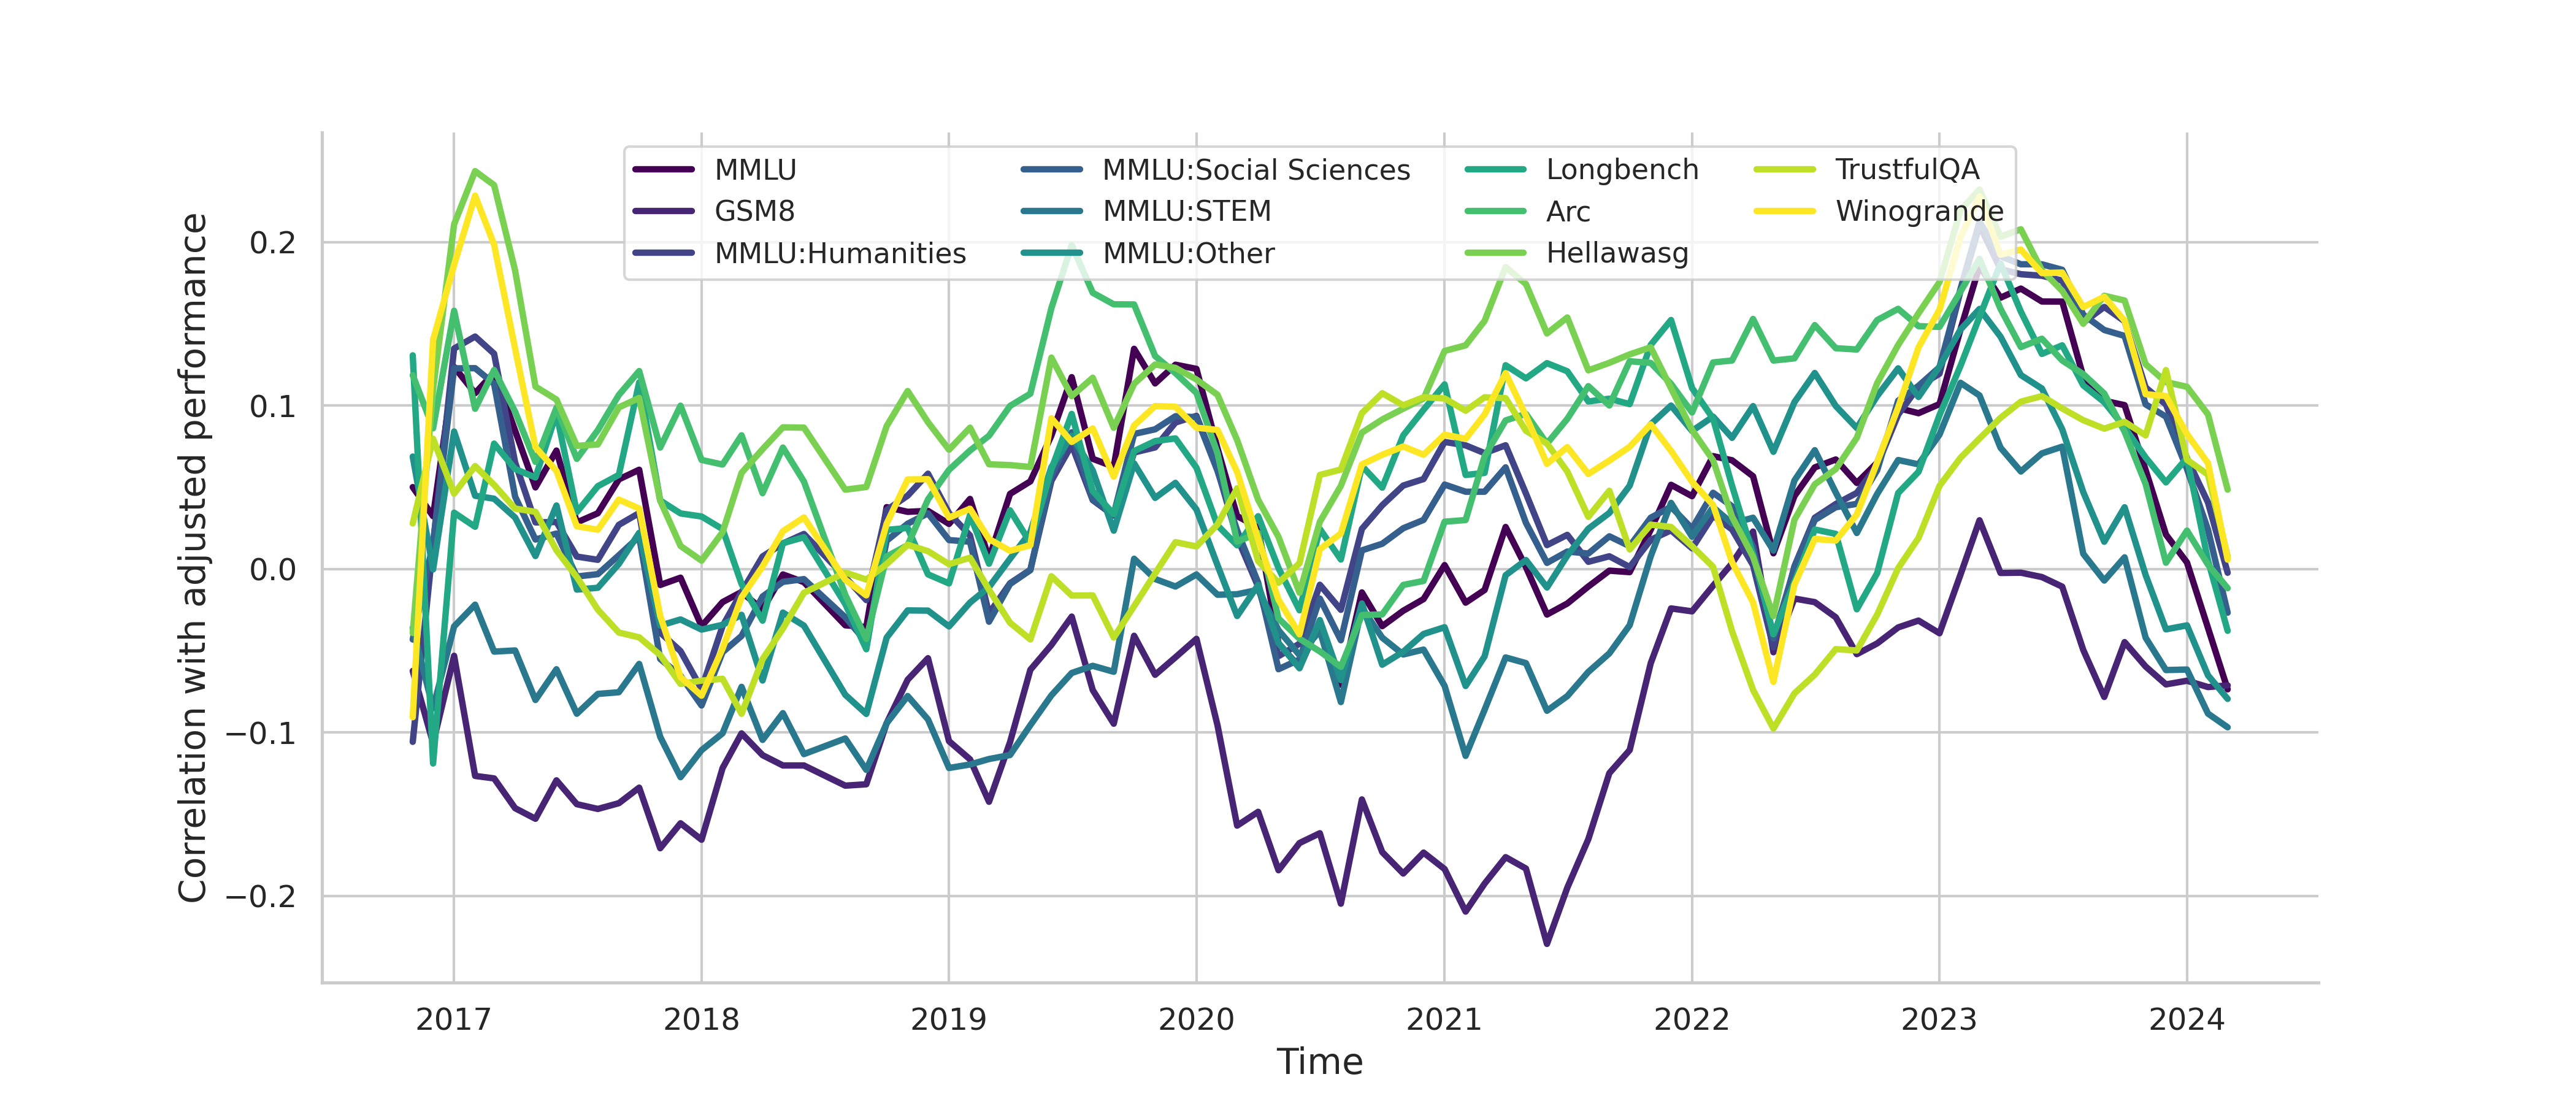
4.4 Correlation with Existing Benchmarks
Following our previous chapter 3.4, we continue to explore the correlation between prediction performance and existing benchmarks, using the same benchmarks as in 3.4. We have categorized the tags of questions into several groups: Societal Issues Items, Political and Government Affairs, Economic and Business Items, and Science and Technology Items. Each group represents a significant area of interest.
In our analysis, we focus on how the correlation between these categories and various benchmarks evolves over time. We use correlation coefficients to measure the strength of association between the performance scores of questions within each category and the benchmarks across different times.
Notably, our analysis revealed that while the Economic and Business Items and Science and Technology Items on base models displayed relatively high initial correlations, there appears to be little to no relationship in Societal issues Items and Political and Government Affairs, we think such topics are influenced by a multitude of unpredictable factors such as social changes, policy adjustments, and public sentiment. These elements make accurate predictions particularly challenging, leading to the observed low correlation with performance metrics. Detailed figures are in Appendix H.
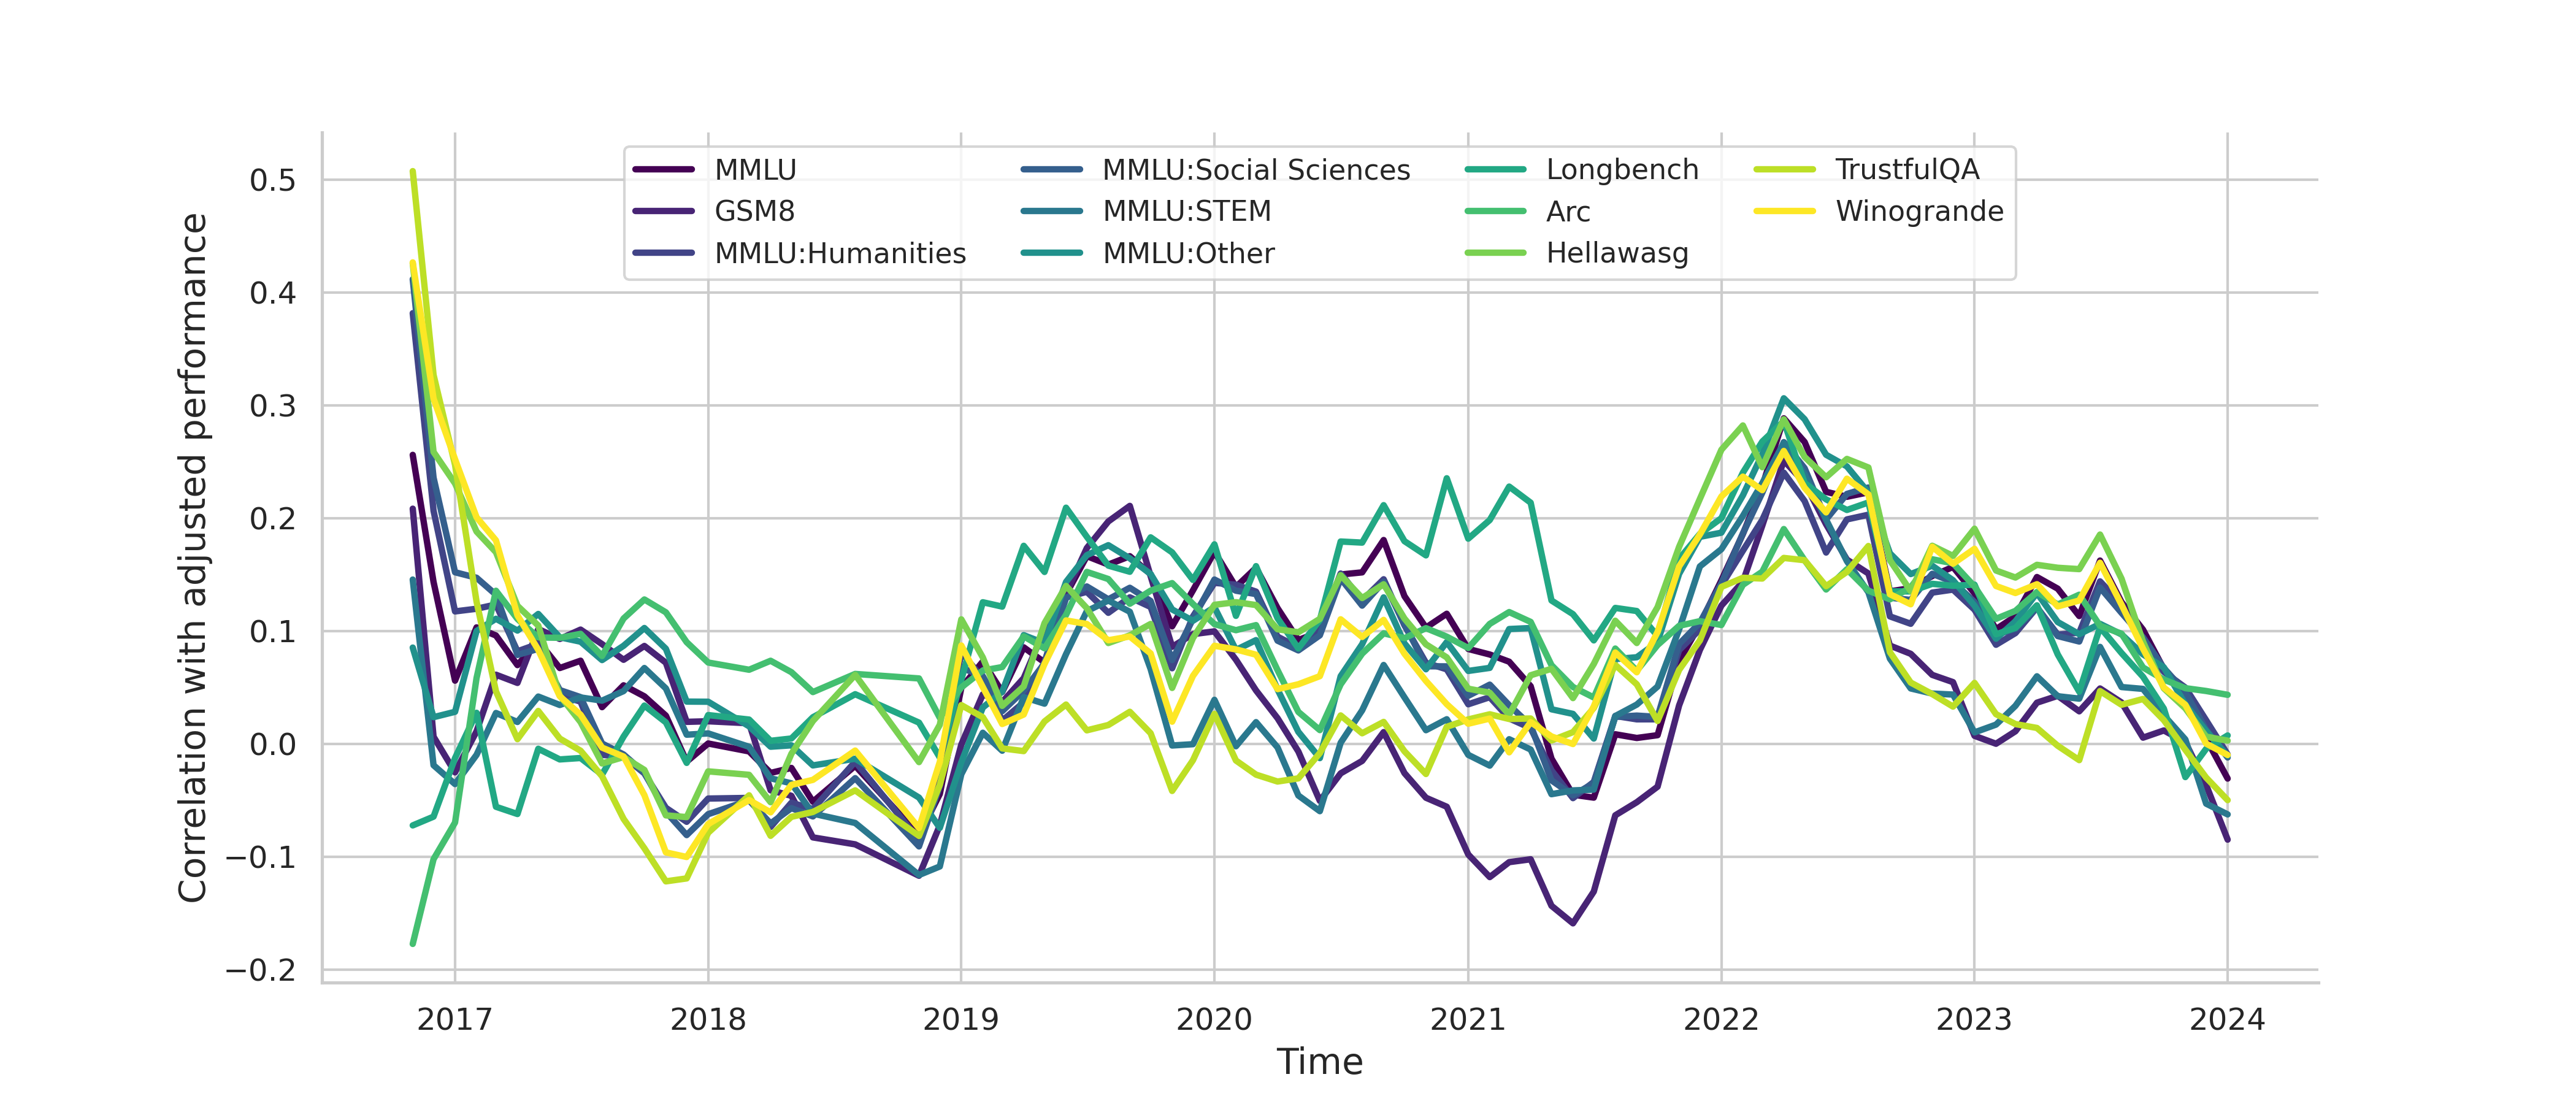
The graphical representations in our analysis plot the changes in correlation coefficients over time. Each line in the graph represents the changing relationship between a category’s average adjusted performance and a specific benchmark, highlighting periods of stronger or weaker association.
For a detailed breakdown of the categories and the number of entries in each, please refer to the Appendix G. This provides a clearer picture of the dataset’s composition and the scope of our analysis.
4.5 Community Call to Action
We urge the community to take note of the above phenomenon: models tend to have a better comprehension of earlier events. This observation supports the findings in Cheng et al. (2024), which suggest that models are most familiar with knowledge up to 2020. This observation is contrary to our initial hypothesis that models may overfit current events, which is significantly more concerning. It suggests that caution is needed, especially for those hoping to use model judgments directly.
5 Conclusion
We rigorously define and qualify temporal generalization and bias within LLMs, uncovering significant challenges in their ability to predict and adapt to future contexts. The experiments reveal that LLMs often struggle with temporal biases, affecting their reliability in real-world applications, particularly in dynamic scenarios requiring accurate forecasting.
The evaluation framework we provide allows for an in-depth assessment of these models’ performance over time. The findings underscore the urgent need for improvements in LLM training and updating processes to enhance their adaptability and mitigate biases.
Moving forward, it is crucial to refine LLM development and evaluation techniques to better handle evolving informational environments, ensuring their continued relevance and utility in various applications.
Looking ahead, our agenda for future work includes several ambitious goals aimed at enhancing the versatility and depth of our evaluation framework. Key among these objectives are:
-
•
Integrating a wider array of models, particularly focusing on those based on the Transformer architecture, such as Griffin and Mamba models.
-
•
Expanding the number of checkpoints accessed for a more comprehensive temporal analysis of model performance.
-
•
Delving into the relationship between token-level loss metrics and overall scores, which could offer more granular insights into model capabilities.
-
•
Developing methodologies to assess the obsolescence of benchmarks and models, potentially offering a dynamic approach to evaluating the relevance and efficiency of language models over time.
These initiatives represent our commitment to advancing the state of the art in language model evaluation, ensuring that our tools remain at the forefront of technological progress and innovation.
Limitations
Despite the system’s innovative approach to evaluating LLMs using the latest textual data, it is important to acknowledge certain limitations. One significant limitation is the system’s applicability primarily to open LLMs that provide access to their logits. This dependency arises because our evaluation mechanism relies on analyzing these logits to compute loss metrics. Consequently, our system may not be directly applicable to non-open LLMs, where such detailed internal outputs are not accessible. This constraint highlights the need for adaptable evaluation strategies that can cater to a broader range of LLMs, including those with closed architectures.
Ethics Statement
We fully acknowledge the need to adhere to ethical standards in handling and generating textual data. Hence, we commit to:
-
•
Handling User-Uploaded Content: We respect the privacy and copyright of content uploaded by users. All data provided by users will be used solely for the purpose of model evaluation and not for any other purposes. Reasonable measures will be taken to protect this data from unauthorized access, use, or disclosure.
-
•
Responsibility for Content Generated by Open-Source Models: We recognize that content generated by our system or through the use of open-source models involved in the evaluation might reflect or amplify biases. While efforts are made to minimize these biases and improve the fairness of the content, we cannot take responsibility for the generated content. We encourage users and developers to critically engage with these models and remain vigilant of their outputs.
-
•
Addressing Data Leak Issues: Our system aims to tackle data leak issues by dynamically generating benchmarks and ensuring models generalize to new or future texts. We commit to continuously monitoring and updating our evaluation methods to avoid potential data leakage, ensuring the validity and reliability of our assessment results.
-
•
Transparency: We are committed to maintaining the highest level of transparency in our work, including our evaluation methods, data sources used, and assessment outcomes. We encourage open critique and suggestions for improvement of our methodology, aiming to foster knowledge sharing and technological advancement.
We believe that through this approach, we can offer a valuable resource to the research and development community, while fostering deep reflection and discussion on ethical issues in the artificial intelligence field.
References
- Anil et al. (2023) Rohan Anil, Andrew M. Dai, Orhan Firat, Melvin Johnson, Dmitry Lepikhin, Alexandre Passos, Siamak Shakeri, Emanuel Taropa, Paige Bailey, Zhifeng Chen, et al. Palm 2 technical report, 2023.
- Anthropic (2023) Anthropic. Model card and evaluations for claude models. https://www-files.anthropic.com/production/images/Model-Card-Claude-2.pdf, 2023.
- Bonde (2022) Mathias Kirk Bonde. Getting gpt-3 to predict metaculus questions. https://www. lesswrong.com/posts/c3cQgBN3v2Cxpe2kc/getting-gpt-3-to-predict-metaculus-questions, 2022. Last accessed on 2022-06-08.
- Chen et al. (2024) Guiming Hardy Chen, Shunian Chen, Ziche Liu, Feng Jiang, and Benyou Wang. Humans or llms as the judge? a study on judgement biases. arXiv preprint arXiv:2402.10669, 2024.
- Cheng et al. (2024) Jeffrey Cheng, Marc Marone, Orion Weller, Dawn Lawrie, Daniel Khashabi, and Benjamin Van Durme. Dated data: Tracing knowledge cutoffs in large language models, 2024.
- Cobbe et al. (2021) Karl Cobbe, Vineet Kosaraju, Mohammad Bavarian, Mark Chen, Heewoo Jun, Lukasz Kaiser, Matthias Plappert, Jerry Tworek, Jacob Hilton, Reiichiro Nakano, Christopher Hesse, and John Schulman. Training verifiers to solve math word problems, 2021.
- Gao et al. (2023) Leo Gao, Jonathan Tow, Baber Abbasi, Stella Biderman, Sid Black, Anthony DiPofi, Charles Foster, Laurence Golding, Jeffrey Hsu, Alain Le Noac’h, Haonan Li, Kyle McDonell, Niklas Muennighoff, Chris Ociepa, Jason Phang, Laria Reynolds, Hailey Schoelkopf, Aviya Skowron, Lintang Sutawika, Eric Tang, Anish Thite, Ben Wang, Kevin Wang, and Andy Zou. A framework for few-shot language model evaluation, 12 2023. URL https://zenodo.org/records/10256836.
- (8) Good Judgment Open. Good judgment open: A global forecasting platform. URL https://www.gjopen.com/.
- GoogleAI (2023) GoogleAI. Bard. https://bard.google.com, 2023.
- Halawi et al. (2024) Danny Halawi, Fred Zhang, Chen Yueh-Han, and Jacob Steinhardt. Approaching human-level forecasting with language models, 2024.
- Hendrycks et al. (2020) Dan Hendrycks, Collin Burns, Steven Basart, Andy Zou, Mantas Mazeika, Dawn Song, and Jacob Steinhardt. Measuring massive multitask language understanding. arXiv preprint arXiv:2009.03300, 2020.
- Hendrycks et al. (2021) Dan Hendrycks, Collin Burns, Steven Basart, Andy Zou, Mantas Mazeika, Dawn Song, and Jacob Steinhardt. Measuring massive multitask language understanding, 2021.
- Huang et al. (2023) Yuzhen Huang, Yuzhuo Bai, Zhihao Zhu, Junlei Zhang, Jinghan Zhang, Tangjun Su, Junteng Liu, Chuancheng Lv, Yikai Zhang, Jiayi Lei, Yao Fu, Maosong Sun, and Junxian He. C-eval: A multi-level multi-discipline chinese evaluation suite for foundation models. In Advances in Neural Information Processing Systems, 2023.
- Li et al. (2023) Xuechen Li, Tianyi Zhang, Yann Dubois, Rohan Taori, Ishaan Gulrajani, Carlos Guestrin, Percy Liang, and Tatsunori B. Hashimoto. Alpacaeval: An automatic evaluator of instruction-following models. https://github.com/tatsu-lab/alpaca_eval, 2023.
- Liang et al. (2023) Percy Liang, Rishi Bommasani, Tony Lee, Dimitris Tsipras, Dilara Soylu, Michihiro Yasunaga, Yian Zhang, Deepak Narayanan, Yuhuai Wu, Ananya Kumar, Benjamin Newman, Binhang Yuan, Bobby Yan, Ce Zhang, Christian Cosgrove, Christopher D. Manning, Christopher Ré, Diana Acosta-Navas, Drew A. Hudson, Eric Zelikman, Esin Durmus, Faisal Ladhak, Frieda Rong, Hongyu Ren, Huaxiu Yao, Jue Wang, Keshav Santhanam, Laurel Orr, Lucia Zheng, Mert Yuksekgonul, Mirac Suzgun, Nathan Kim, Neel Guha, Niladri Chatterji, Omar Khattab, Peter Henderson, Qian Huang, Ryan Chi, Sang Michael Xie, Shibani Santurkar, Surya Ganguli, Tatsunori Hashimoto, Thomas Icard, Tianyi Zhang, Vishrav Chaudhary, William Wang, Xuechen Li, Yifan Mai, Yuhui Zhang, and Yuta Koreeda. Holistic evaluation of language models, 2023.
- Lin et al. (2022) Stephanie Lin, Jacob Hilton, and Owain Evans. Truthfulqa: Measuring how models mimic human falsehoods, 2022.
- (17) Metaculus. Metaculus. https://www.metaculus.com/. Accessed: 2024-03-01.
- OpenAI (2023) OpenAI. Gpt-4 technical report, 2023.
- Sakaguchi et al. (2019) Keisuke Sakaguchi, Ronan Le Bras, Chandra Bhagavatula, and Yejin Choi. Winogrande: An adversarial winograd schema challenge at scale, 2019.
- Saunshi et al. (2021) Nikunj Saunshi, Sadhika Malladi, and Sanjeev Arora. A mathematical exploration of why language models help solve downstream tasks. In 9th International Conference on Learning Representations, ICLR 2021, Virtual Event, Austria, May 3-7, 2021. OpenReview.net, 2021. URL https://openreview.net/forum?id=vVjIW3sEc1s.
- Tay et al. (2022) Yi Tay, Mostafa Dehghani, Jinfeng Rao, William Fedus, Samira Abnar, Hyung Won Chung, Sharan Narang, Dani Yogatama, Ashish Vaswani, and Donald Metzler. Scale efficiently: Insights from pretraining and finetuning transformers. In The Tenth International Conference on Learning Representations, ICLR 2022, Virtual Event, April 25-29, 2022. OpenReview.net, 2022. URL https://openreview.net/forum?id=f2OYVDyfIB.
- Touvron et al. (2023) Hugo Touvron, Louis Martin, Kevin Stone, Peter Albert, Amjad Almahairi, Yasmine Babaei, Nikolay Bashlykov, Soumya Batra, Prajjwal Bhargava, Shruti Bhosale, Dan Bikel, Lukas Blecher, Cristian Canton Ferrer, Moya Chen, Guillem Cucurull, David Esiobu, Jude Fernandes, Jeremy Fu, Wenyin Fu, Brian Fuller, Cynthia Gao, Vedanuj Goswami, Naman Goyal, Anthony Hartshorn, Saghar Hosseini, Rui Hou, Hakan Inan, Marcin Kardas, Viktor Kerkez, Madian Khabsa, Isabel Kloumann, Artem Korenev, Punit Singh Koura, Marie-Anne Lachaux, Thibaut Lavril, Jenya Lee, Diana Liskovich, Yinghai Lu, Yuning Mao, Xavier Martinet, Todor Mihaylov, Pushkar Mishra, Igor Molybog, Yixin Nie, Andrew Poulton, Jeremy Reizenstein, Rashi Rungta, Kalyan Saladi, Alan Schelten, Ruan Silva, Eric Michael Smith, Ranjan Subramanian, Xiaoqing Ellen Tan, Binh Tang, Ross Taylor, Adina Williams, Jian Xiang Kuan, Puxin Xu, Zheng Yan, Iliyan Zarov, Yuchen Zhang, Angela Fan, Melanie Kambadur, Sharan Narang, Aurelien Rodriguez, Robert Stojnic, Sergey Edunov, and Thomas Scialom. Llama 2: Open foundation and fine-tuned chat models, 2023.
- Wettig et al. (2023) Alexander Wettig, Tianyu Gao, Zexuan Zhong, and Danqi Chen. Should you mask 15% in masked language modeling? In Andreas Vlachos and Isabelle Augenstein (eds.), Proceedings of the 17th Conference of the European Chapter of the Association for Computational Linguistics, EACL 2023, Dubrovnik, Croatia, May 2-6, 2023, pp. 2977–2992. Association for Computational Linguistics, 2023. doi: 10.18653/V1/2023.EACL-MAIN.217. URL https://doi.org/10.18653/v1/2023.eacl-main.217.
- Zellers et al. (2019) Rowan Zellers, Ari Holtzman, Yonatan Bisk, Ali Farhadi, and Yejin Choi. Hellaswag: Can a machine really finish your sentence?, 2019.
- Zheng et al. (2023) Lianmin Zheng, Wei-Lin Chiang, Ying Sheng, Siyuan Zhuang, Zhanghao Wu, Yonghao Zhuang, Zi Lin, Zhuohan Li, Dacheng Li, Eric Xing, et al. Judging llm-as-a-judge with mt-bench and chatbot arena. arXiv preprint arXiv:2306.05685, 2023.
- Zou et al. (2022) Andy Zou, Tristan Xiao, Ryan Jia, Joe Kwon, Mantas Mazeika, Richard Li, Dawn Song, Jacob Steinhardt, Owain Evans, and Dan Hendrycks. Forecasting future world events with neural networks, 2022.
Appendix A Details of Data Collection
The data for our system is sourced from a diverse set of online platforms, each selected for its relevance to different data types and domains. We utilize a Python-based crawling framework, which is detailed in our publicly available repository. This framework is designed to be adaptable, allowing for the inclusion of additional sources as they become relevant.
The primary data sources include:
-
•
Financial News: Crawled from Yahoo, providing up-to-date information on global financial trends.
-
•
Political News: BBC News is used to gather the latest political developments worldwide.
-
•
Discussion Forums: Reddit is scraped to capture current discussions across a variety of tofigures.
-
•
Online Literature: Wattpad offers a rich source of contemporary fiction and non-fiction.
-
•
Encyclopedia: Wikipedia’s latest changes feed is monitored for updates across all domains.
-
•
Academic Papers: arXiv is used to access the newest research across multiple scientific fields.
-
•
Code Repositories: GitHub Trending provides insights into the latest developments in software engineering.
-
•
Question and Answer Forums: Quora, focusing on popular topics such as Technology, Mathematics, Health, and Movies.
To facilitate efficient and effective data collection, our system’s environment is configured with a specific Python package index URL and utilizes Playwright for web navigation and content extraction. This setup addresses potential challenges, such as page refresh requirements on Yahoo and hostname verification issues encountered with certain websites.
Our system employs a combination of tools and libraries, including Requests, Playwright, and various PDF processing utilities, to collect the latest textual data from the internet. This approach enables us to dynamically update our benchmark datasets with fresh information, ensuring that our evaluation reflects current language use and information trends.
Data Pre-processing For some raw content clean the text by removing these tags to ensure that only the content text is analyzed.
Filtering out short texts: Extremely short texts may not provide enough contextual information for analysis or model training. Setting a minimum text length threshold of 100 chars to filter out such instances.
External Dataset For the analysis of text likelihood and bias, we employed not only our own collection of historical arXiv data but also sampled entries from two additional datasets. We incorporated data from the BBC News and Wikitext datasets, which are publicly available through the Hugging Face datasets repository. Specifically, the datasets used were bbc_news_alltime and wikitext_alltime, accessible via the following URLs:
- •
- •
Sampling from these datasets was carried out every three months, with each instance involving the collection of 50 entries per dataset. This structured sampling approach was designed to ensure a consistent and representative analysis of content over time, enabling an effective assessment of textual bias and likelihood trends.
Appendix B Data Overview of One Crawl
Table 10 presented below offers a comprehensive overview of the diverse sources and categories of texts that were analyzed in one data crawl. Classified into distinct groups such as Academic STEM, Academic Non-STEM, Internet QA, and Internet articles, the table delineates the number of texts extracted from each source along with their average length. This includes detailed counts from different academic archives like arXiv, various categories from Internet question and answer platforms like Reddit and Quora, and articles from well-known online platforms including Wiki and BBC.
| Category | Source | Count | Length |
| Academic STEM | arXiv Mathematics | 50 | 42850 |
| arXiv Computer Science | 50 | 43336 | |
| arXiv Physics | 50 | 42580 | |
| arXiv Statistics | 50 | 42619 | |
| arXiv Electrical Engineering and Systems Science | 50 | 43027 | |
| Academic Non-STEM | arXiv Economics | 50 | 42592 |
| arXiv Quantitative Finance | 50 | 43969 | |
| arXiv Quantitative Biology | 50 | 42974 | |
| Code | GitHub | 30 | 21849 |
| Internet QA | 583 | 643 | |
| Quora Health | 20 | 1150 | |
| Quora Movies | 69 | 1349 | |
| Quora Mathematics | 70 | 1365 | |
| Quora Technology | 80 | 1674 | |
| Internet article | Wiki | 220 | 4091 |
| Wattpad | 38 | 6615 | |
| BBC | 45 | 4792 | |
| Yahoo | 41 | 5373 |
Appendix C Detailed results of BPC generalization on Wiki and BBC dataset
| Model | Base BPC | BPC Change at 3 months (%) | BPC Change at 6 months (%) | BPC Change at 9 months (%) | BPC Change at 12 months (%) | mean |
| OPT-13B | 0.450 | 2.273 | -2.087 | 1.265 | 0.839 | 0.572 |
| OPT-2.7B | 0.475 | 1.970 | -2.228 | 1.192 | 1.143 | 0.519 |
| LLaMA-7B | 0.450 | 1.270 | 0.177 | -7.776 | 3.266 | -0.766 |
| Pythia-12B | 0.480 | -0.233 | -3.888 | -2.612 | -1.012 | -1.936 |
| Falcon-rw-1B | 0.510 | 0.459 | -7.814 | 1.201 | -1.474 | -1.907 |
| Baichuan-13B-Chat | 0.467 | -3.645 | -1.078 | 0.413 | - | -1.436 |
| LLaMA-2-13B | 0.416 | -6.928 | 3.502 | 1.683 | - | -0.581 |
| LLaMA-2-7B | 0.434 | -7.314 | 3.092 | 1.279 | - | -0.981 |
| LLaMA-2-7B-Chat | 0.505 | -8.308 | 2.695 | 0.664 | - | -1.650 |
| Zhongjing-Base | 0.465 | -8.488 | 2.662 | -1.290 | - | -2.372 |
| InternLM-Chat-7B | 0.515 | -2.476 | -1.344 | 0.236 | - | -1.195 |
| Baichuan2-7B-Base | 0.451 | -3.059 | 0.595 | -4.649 | - | -2.371 |
| Baichuan2-7B-Chat | 0.517 | -3.571 | -0.038 | -5.315 | - | -2.975 |
| Mistral-7B-v0.1 | 0.398 | 1.110 | 5.347 | -0.661 | - | 1.932 |
| Phi-1.5 | 0.602 | -1.772 | 1.131 | -1.837 | - | -0.826 |
| Baichuan2-13B-Base | 0.439 | -2.943 | 0.882 | -4.390 | - | -2.150 |
| Baichuan2-13B-Chat | 0.495 | -3.541 | -0.995 | 0.232 | - | -1.435 |
| Colossal-LLaMA-2-7B-Base | 0.618 | 2.825 | 3.715 | - | - | 3.270 |
| Qwen-14B-Chat | 0.445 | 2.682 | 4.847 | - | - | 3.764 |
| Qwen-7B | 0.441 | 1.892 | 3.689 | - | - | 2.791 |
| Qwen-7B-Chat | 0.466 | 1.809 | 3.606 | - | - | 2.708 |
| Skywork-13B-Base | 0.429 | 7.163 | 3.261 | - | - | 5.212 |
| ChatGLM3-6B | 0.832 | 5.567 | 1.684 | - | - | 3.626 |
| Zephyr-7B-beta | 0.435 | 7.340 | 3.928 | - | - | 5.634 |
| Yi-6B | 0.427 | 6.478 | 3.144 | - | - | 4.811 |
| Yi-6B-Chat | 0.446 | 3.030 | -2.798 | - | - | 0.116 |
| Qwen-1.8B | 0.520 | 1.899 | -2.082 | - | - | -0.091 |
| Qwen-1.8B-Chat | 0.599 | 1.635 | -2.033 | - | - | -0.199 |
| RWKV-v5-Eagle-7B | 0.440 | 4.956 | 2.278 | - | - | 3.617 |
| TinyLLaMA-1.1B-Chat-v0.6 | 0.513 | 2.539 | -3.678 | - | - | -0.569 |
| Phi-2 | 0.487 | 1.882 | - | - | - | 1.882 |
| Model | Base BPC | BPC Change at 3 months (%) | BPC Change at 6 months (%) | BPC Change at 9 months (%) | BPC Change at 12 months (%) | mean |
| OPT-13B | 0.075 | -0.623 | 0.105 | -0.413 | -0.818 | -0.437 |
| OPT-2.7B | 0.082 | -0.658 | 0.024 | -0.528 | -0.915 | -0.519 |
| LLaMA-7B | 0.052 | 0.214 | -0.425 | 0.379 | -0.067 | 0.025 |
| Pythia-12B | 0.071 | -0.578 | -0.933 | -0.859 | -0.903 | -0.818 |
| Falcon-rw-1B | 0.083 | -1.272 | -1.113 | -1.131 | -1.207 | -1.181 |
| Baichuan-13B-Chat | 0.058 | 0.019 | 0.124 | -0.125 | - | 0.006 |
| LLaMA-2-13B | 0.041 | 1.700 | 1.446 | 1.796 | - | 1.647 |
| LLaMA-2-7B | 0.050 | 0.774 | 0.349 | 0.517 | - | 0.547 |
| LLaMA-2-7B-Chat | 0.060 | 0.132 | -0.186 | -0.093 | - | -0.049 |
| Zhongjing-Base | 0.050 | 0.756 | 0.269 | 0.569 | - | 0.531 |
| InternLM-Chat-7B | 0.080 | -0.482 | -0.301 | -0.250 | - | -0.344 |
| Baichuan2-7B-Base | 0.059 | 0.523 | 0.157 | 0.185 | - | 0.289 |
| Baichuan2-7B-Chat | 0.068 | 0.343 | -0.035 | -0.073 | - | 0.078 |
| Mistral-7B-v0.1 | 0.053 | 0.381 | -0.028 | 0.018 | - | 0.124 |
| Phi-1.5 | 0.098 | 0.066 | -0.125 | -0.248 | - | -0.102 |
| Baichuan2-13B-Base | 0.053 | 1.019 | 0.797 | 0.900 | - | 0.905 |
| Baichuan2-13B-Chat | 0.062 | 0.299 | 0.628 | 0.512 | - | 0.480 |
| Colossal-LLaMA-2-7B-Base | 0.065 | -0.042 | -0.199 | - | - | -0.121 |
| Qwen-14B-Chat | 0.049 | 1.301 | 1.939 | - | - | 1.620 |
| Qwen-7B | 0.061 | 0.428 | 0.430 | - | - | 0.429 |
| Qwen-7B-Chat | 0.065 | 0.302 | 0.226 | - | - | 0.264 |
| Skywork-13B-Base | 0.050 | 0.075 | 0.276 | - | - | 0.175 |
| ChatGLM3-6B | 0.105 | -0.187 | -0.245 | - | - | -0.216 |
| Zephyr-7B-beta | 0.059 | -0.049 | -0.033 | - | - | -0.041 |
| Yi-6B | 0.058 | -0.071 | 0.022 | - | - | -0.024 |
| Yi-6B-Chat | 0.060 | -0.028 | 0.023 | - | - | -0.003 |
| Qwen-1.8B | 0.080 | -0.131 | -0.251 | - | - | -0.191 |
| Qwen-1.8B-Chat | 0.091 | -0.331 | -0.496 | - | - | -0.414 |
| RWKV-v5-Eagle-7B | 0.065 | 0.149 | 0.220 | - | - | 0.184 |
| TinyLLaMA-1.1B-Chat-v0.6 | 0.070 | -0.332 | -0.473 | - | - | -0.403 |
| Phi-2 | 0.072 | -0.037 | - | - | - | -0.037 |
Appendix D Analysis of Language Likelihood Values and Benchmark Correlation Across Text and Model Groups
Appendix E Function Fitting Strategies
We considered several fitting strategies, each with its unique mathematical approach to model decay:
- Linear Decay
-
Linear decay is represented by a straight line, suggesting a constant rate of decay over time. The model is given by the equation .
- Exponential Decay
-
Exponential decay is modeled by an exponential function, expressed as , where is the initial value, is time or another decaying factor, and is the decay constant that denotes the rate of decay.
- Power Law Decay
-
Power law decay implies a polynomial relationship and is expressed as , where is a positive constant, is time or another related factor, and represents the exponent characterizing the rate of decay.
- Logarithmic Decay
-
Logarithmic decay suggests a decrease that becomes more gradual over time, typically modeled as , where and are constants, and represents time or another related factor.
The variance of the residuals for each model was calculated as follows:
| Model | Variance |
| Linear | 2.346e-3 |
| Exponential | 1.71e3 |
| Power Law | 3.78e-3 |
| Logarithmic | 3.33e-3 |
E.0.1 Findings
Our analysis found that the linear model provided the best fit, with the lowest variance among the residuals. This indicates a steady, unchanging rate of knowledge decay over time, as opposed to the more complex models that assume varying rates.
We aimed to evaluate the understanding and recency of knowledge across various language models, including GPT-4 and others. To accomplish this, we devised a methodology to calculate a weighted accuracy score for each model, reflecting not only its performance but also the contemporaneity of its knowledge base.
We began by assigning weights to different quarters, starting from 0 for the first quarter of 2015, up to 1 for the most recent quarter. This linear interpolation of weights was chosen to emphasize the value of more current information, underlining our hypothesis that accuracy concerning more recent knowledge is indicative of a model’s modernity and relevance.
The formula applied was straightforward: for each model, we multiplied its accuracy (Acc) by the corresponding weight based on the time difference since the first quarter of 2015. The resulting weighted accuracies were then summed up to yield an overall score for each model, which we used to rank them accordingly.
GPT-4 and other leading models demonstrated a notably later peak in knowledge, suggesting that their databases include more recent information. This is particularly valuable in fast-evolving fields where the timeliness of information is crucial.
Below is a partial presentation of rankings and scores for selected models, showcasing their weighted accuracy scores. The complete table can be found in Table 14.
| Model Name | Score |
| GPT4-1106 | 794.275 |
| GPT4-0613 | 699.8 |
| Zephyr-7B-beta | 601.35 |
| InternLM-Chat-7B | 592.15 |
| GPT3.5-turbo-0613 | 578.025 |
| Baichuan-13B-Chat | 571.8 |
| Qwen-14B-Chat | 565.45 |
| OPT-2.7B | 547.375 |
| Yi-6B-Chat | 541.05 |
| Mistral-7B-v0.1 | 528.725 |
| Baichuan-7B-Chat | 527.825 |
| LLaMA-7B | 524.075 |
| Baichuan2-7B-Chat | 517.725 |
| Pythia-12B | 513.375 |
| Colossal-LLaMA2-7B-Base | 513.35 |
| LLaMA2-7B-Chat | 508.4 |
| LLaMA2-13B | 508.15 |
| Qwen-7B | 506.7 |
| Qwen-1.8B-Chat | 505.225 |
| Phi-2 | 497.4 |
| Yi-6B | 496.15 |
| Zhongjing-Base | 490.1 |
| LLaMA2-7B | 486.2 |
| Falcon-rw-1B | 481.15 |
| ChatGLM3-6B | 479.8 |
| Baichuan2-7B-Base | 479.175 |
| Baichuan2-13B-Chat | 463.75 |
| OPT-13B | 453.075 |
| Baichuan2-13B-Base | 446.225 |
| Skywork-13B-Base | 445.8 |
| Qwen-1 8B | 435.775 |
| RWKV5-Eagle-7B | 408.425 |
| Qwen-7B-Chat | 394.9 |
| Phi-1.5 | 385.975 |
| TinyLLaMA-1.1B-Chat-v0.6 | 366.125 |
Appendix F Details of Model Accuracy Peaks
Table15 captures the peak performance periods of various models on Freshbench. It lists specific models along with their respective dates when they achieved the best performance.
| Date | Models |
| 2015-01 | Skywork-13B-Base, Phi-1.5 |
| 2015-07 | Skywork-13B-Base, Phi-1.5 |
| 2016-01 | Baichuan2-7B-Chat, Colossal-LLaMA-2-7B-Base, LLaMA-2-7B, Qwen-14B-Chat, Qwen-1.8B, Qwen-1.8B-Chat, Yi-6B, Yi-6B-Chat, Baichuan-13B-chat, Baichuan-7B-chat, ChatGLM3-6B, falcon-1B, InternLM-chat-7B, OPT-13B, Phi-2 |
| 2016-07 | RWKV5-Eagle-7B |
| 2017-01 | GPT-3.5-turbo-0613 |
| 2017-07 | Baichuan2-7B-Base |
| 2018-01 | Baichuan2-13B-Base |
| 2018-07 | Baichuan2-13B-Chat, LLaMA-2-13B-hf, Qwen-7B, GPT4-0613, GPT4-1106, LLaMA2-7B-Chat, LLaMA-7B, mistral-7B-v0.1, OPT-2.7B, Pythia-12B, Zephyr-7B-beta |
| 2019-07 | TinyLLaMA-1.1B-Chat |
| 2020-01 | |
| 2020-07 | |
| 2021-01 | |
| 2021-07 | |
| 2022-01 | |
| 2022-07 | |
| 2023-01 | |
| 2023-07 | |
| 2024-01 | |
| 2024-07 |
Appendix G Question Tag Details
| Group | Category | Number of Entries |
| Political and Government Affairs | Leader Entry/Exit | 199 |
| US Politics | 338 | |
| Elections and Referenda | 265 | |
| US Policy | 223 | |
| Foreign Policy | 242 | |
| Non-US Politics | 415 | |
| Security and Conflict | 413 | |
| Total: | 2095 | |
| Economic and Business Items | Business | 575 |
| Economic Indicators | 253 | |
| Finance | 284 | |
| Economic Policy | 147 | |
| Total: | 1259 | |
| Societal issues Items | Society | 379 |
| Health | 237 | |
| Environment | 75 | |
| Sports | 120 | |
| Entertainment | 132 | |
| Total: | 943 | |
| Science and Technology Items | Technology | 346 |
| Total: | 346 | |
Appendix H Prediction Correlation over Time