The significant contribution of supersoft X-ray Sources to the nebular HeII line emission
Abstract
Nebular spectral lines provide insight into the properties of the interstellar medium and the ionizing radiation within galaxies. The presence of high-energy ionization lines, such as , indicates the existence of hard ionizing photons, because the second ionization energy of helium is high (. The enigma surrounding the origin of these lines observed in star-forming galaxies persists, as stellar ionization cannot account for such high energy emission. This paper proposes that supersoft X-ray sources (SSS) may produce these high energy ionization lines in star-forming galaxies. We model the spectra of such sources using blackbody radiation and then add the blackbody to stellar population spectra to represent the overall spectra of galaxies. We then use a photoionization model to predict the resulting emission lines and compare the contribution of SSS to the observation of highly ionized lines in star-forming galaxies, both at low and high redshifts. We find that incorporating a blackbody with temperatures between can boost the emission line ratio to the observed level. The blackbody temperature range aligns with the observed temperatures of the SSSs. The number of SSSs in spiral galaxies listed in Chandra catalogues, and our estimates of the total population, confirms that SSSs are promising candidates for the source of the ionization.
1 Introduction
During a period known as the epoch of reionization, the neutral gas in the Universe is ionized by the first stars in the first galaxies until it becomes fully ionized as observed today (Barkana, 2016). This period is crucial because it heavily impacts subsequent galaxy evolution. Ionizing photons heat up the intergalactic medium (Fan et al., 2006), altering the gas infall into the galaxies, which later influences the cooling and star-formation processes. To understand cosmic reionization is a crucial quest in galaxy evolution. To do so, we need to examine the gas properties and radiation field of distant galaxies of distant galaxies.
Nebular lines arise from the ionization of neutral gas by a radiation field. Hence, such lines provide strong diagnostics for both the properties of the gas in the interstellar medium (ISM) and the ionizing radiation source. Combinations of the ratios of restframe UV and optical lines has been used to infer gas-phase metallicity, electron temperature, and ionization parameters (see Kewley et al., 2019, for a review). It also has been widely used in distinguishing among primary star formation, active galactic nuclei (AGN), and other energetic source (Baldwin et al., 1981; Kewley et al., 2001; Kauffmann et al., 2003).
The presence of lines with different ionization potential is related to the shape of the radiation field powering the emission. High ionization spectral features, such as , require ionizing photons with energy above 54eV, which usually relates to energetic sources such as AGN. However, highly ionized lines have been detected in star-forming galaxies (Garnett et al., 1991; Shirazi & Brinchmann, 2012). At low redshift, such emission is more common among metal-poor galaxies (Shirazi & Brinchmann, 2012; Senchyna et al., 2017, 2019; Berg et al., 2019). Several high ionization lines in ultraviolet has even been detected in galaxies (Stark et al., 2015; Schmidt et al., 2017).
The observation of such lines presents a puzzle (e.g., Garnett et al., 1991; Shirazi & Brinchmann, 2012). Normal stars do not produce such high energy photons, except for exotic species such as Wolf-Rayet stars, which could reach sufficient temperature to produce photons with high enough energies (Schaerer, 1996). However, WR stars are short-lived and rare in low metallicity stellar populations where the strength of such high ionization lines are elevated. This implies the need for additional sources. Several other mechanisms has been proposed to solve this problem, including X-ray sources, such the Ultraluminous X-ray sources (ULXs) (Simmonds et al., 2021) and High-Mass X-ray Binaries (HMXBs) (Schaerer et al., 2019; Senchyna et al., 2020), radiative shocks (Thuan & Izotov, 2005; Izotov et al., 2012; Plat et al., 2019), Population III like stars (Cassata et al., 2013), and other binary-produced processes (Stanway & Eldridge, 2019). However, we do not yet have a clear answer.
In this paper, we propose the possibility that supersoft X-ray source (SSS) provide enough hard ionizing photons to produce the observed highly ionized lines, including . SSSs are found in nearby galaxies and have extremely soft X-ray spectra (Greiner, 1996; Kahabka et al., 2008). With typical values of for the observed SSSs ranging between eV and eV, and luminosities ranging from erg s-1 (Kahabka & van den Heuvel, 1997), they have the potential to produce the ionized lines. One of the first and most well-studied SSSs in Large Magellanic Cloud, CAL 83, is surrounded by a large nebulae exhibiting emission (Crampton et al., 1987; Schmidtke et al., 2004). SSSs have been discovered in the Local group and in external galaxies (Di Stefano & Kong, 2003a; Orio et al., 2010; Galiullin & Gilfanov, 2021).
We expand upon the characteristics and possible natures of SSSs in §2. Because the definition of SSSs is based on phenomenology, we do not expect that they represent sources with a single physical nature. Their contribution to the ionization of the gas in galaxies is, however, independent of their fundamental natures. It depends only on the numbers of SSSs populating the galaxy, and the distribution of luminosities and temperatures among the SSSs.
As the first approach in modelling SSS as the source of high ionization lines, we take a blackbody spectra with various temperatures and luminosity as inputs to MAPPINGS photoionization code. The resulting optical lines are then compared to observation of emission in star-forming galaxies. For a more realistic approach in modelling the galaxy spectra with SSS, we combine the SSS blackbody spectra with stellar spectra from BPASS with various scaling for the blackbody contribution in the total spectra. We found that a substantial contribution of blackbody spectra is required to produce the emission line fluxes observed in star forming galaxies. The methodology is described in §3 and we introduced our observation sample in §3.3. The results are presented in §4. We discuss our prediction and comparison with the observation in §5. Our conclusions are summarised in §6.
2 Why Supersoft X-ray Sources?
2.1 Classical SSSs
The class of luminous supersoft X-ray sources (SSSs) is defined phenomenologically, in terms of the temperatures and luminosities of the sources. The first-discovered SSSs were in the Magellanic Clouds (Long et al., 1981). During the early 1990s, the ROSAT observatory established the class of SSSs by discovering additional Magellanic Cloud SSSs, as well as M31 SSSs and a small number in the Galaxy (Greiner, 2000). These SSSs had values of in the range from about eV to roughly eV, and luminosities in the range a few erg s-1 to a few erg s-1.
Sources in the temperature range of SSSs can be highly effective providers of the photons needed to create high-energy ionization states. The magnitude of their influence as ionizers within and around the galaxies they populate depends on the sizes of SSS populations within galaxies. Establishing the size of a galaxy’s SSS population is challenging because a large fraction of the radiation they emit is absorbed before reaching our detectors. Thus, the very circumstance that makes them important ionization sources decreases the detectability of SSSs. We can therefore detect only a fraction of the SSSs present, especially in galaxies containing gas and dust.
Di Stefano & Rappaport (1994) used the ROSAT-observed SSSs to estimate the size of the underlying populations in the Magellanic Clouds, M31, and in the Galaxy. They constructed several models for the distributions of gas and dust in each of these systems, and then seeded each galaxy with sources having the properties of the observed SSSs. The range of galaxy models allowed an estimate of the range of population sizes. It was found that in the Magellanic Clouds, the ROSAT-observed SSSs could represent an total population of similar SSSs as small as 22 and as large as . (These are sources that would be “on”, but not detectable because of absorption.) The total SSS population numbers in the Milky Way range from 400 to 2900, with a most likely value of . Because the numbers of SSSs reported in M31 was large (), and the distance is greater, thereby reducing the count rate, the estimated population of SSSs was larger: with a likely value of . While the ranges of population sizes consistent with the early data were large, the common factor is that ROSAT was detecting a small fraction of the SSSs active at any given time. This fraction ranges from on the order of in the Magellanic Clouds to about a percent in M31. Furthermore, the fraction of the SSSs detected is highly sensitive to the source’s temperature, increasing with increasing temperature.
If we take erg s-1 to be a typical SSS luminosity, the Milky Way and M31 would have minimum SSS total luminosities (i.e. using the lowest possible estimated fractions) of erg s-1 and erg s-1, respectively. Note that the work described here makes no assumptions about the nature or natures of the SSSs.
2.2 Possible Natures of SSSs
2.2.1 Hot White Dwarfs
While the population estimates discussed above are independent of the physical natures of SSSs, the galactic environments they inhabit, does however, depend on the natures of the sources.
The ranges of luminosities and temperatures of the first-discovered “classical”, are consistent with the effective radii of hot white dwarfs (WDs). There is evidence that many of the Local Group SSSs are WDs. The largest number are post-nova WDs. A nova explosion occurs when matter accreted from a stellar companion reaches a critical mass, whose value depends on the WD mass, the accretion rate, and the composition of the accreting matter. After the ejecta have become diffuse enough to allow soft X-ray photons to escape, the nova will be detected as an SSS if residual nuclear burning is occurring or if the WD has not yet cooled. A program of X-ray observations of optical novae in M31 has found the largest number of SSSs in the Local Group (Henze et al., 2014).
Another type of system observed as SSSs are close binaries with orbital periods on the order of 10 hours to about a day. These are hypothesized to be WDs that are hot because they are burning incoming matter donated by a companion (van den Heuvel et al., 1992). Because nuclear burning requires high accretion rates, these are special binaries, often referred to as “close binary supersoft sources (CBSSs). Perhaps a better name for them would be close binary nuclear burning white dwarfs, since not all of the systems identified as CBSSs are always observed as supersoft. There may even be a subset of the class that is rarely ever detected as an SSS.
Symbiotic stars in which a wide orbit companion donates mass to a WD at high rates, generally through winds or through a combination of winds and Roche-lobe filling, are also observed as SSSs. Some symbiotics have rates of mass transfer that are too low to permit quasisteady nuclear burning but are high enough to lead to recurrent novae. The special significance of SSSs that are nuclear-burning WDs can retain matter (van den Heuvel et al., 1992). It may therefore be the case that some are progenitors of accretion induced collapse in which a EWD gains enough mass to collapse and transform into a NS (van den Heuvel et al., 1992). In other cases, the nuclear-burning WD may become a Type Ia supernova (Rappaport et al., 1994).
2.2.2 Neutron Stars and Black Holes
At least one of the “classical” SSSs has been hypothesized to be an accreting black hole (BH) (Cowley et al., 1990). Whether or not that system contains a BH, there is reason to believe that some SSSs in external galaxies contain BHs. The likelihood that a subset of SSSs have BH or neutron star (NS) accretors is suggested by extensions of the class of SSSs that have been discovered in other galaxies. As we will discuss below, some SSSs have luminosities greater than erg s-1. This is too large a luminosity to be produced WDs.
2.3 SSS Characteristics Derived from Galactic Studies
2.3.1 Duty Cycle
Some of the known CBSSs have been observed in X-ray “off” states, during which there is no X-ray emission. Transitions between SSS states and X-ray “off” states can take place over intervals of days. During ‘off” states, the optical emission, most of which is provided by the accretion disk, increases by about a magnitude. This is consistent with the X-ray emitting region having a larger effective radius, thereby providing more EUV and UV irradiation of the accretion disk. This combination of X-ray and optical behavior suggests that the photosphere of the SSS has expanded, moving the high-energy tail out of the X-ray regime toward longer-wavelength radiation. The known CBSSs spend enough of the time with SSS temperatures to provide a good chance of X-ray detection. But there may be a subset of sources with the same physical nature that have temperatures above keV rarely if at all.
2.3.2 Nebulae
Given their spectrum, SSSs are capable of exciting high-energy ionization states. The photons that travel from the source through the ISM have the ability to ionize many solar masses, so that regions of Mpc around each source could be ionized. CAL 83 has such a nebula (Remillard et al., 1995). Other SSSs, however, have not been seen to have them. One possible reason is that the duty cycle of the SSS phase of binary evolution is too short. Simple calculations indicate that the duty cycle would have to be on the order of a few percent in order to explain the lack of SSSs. The other possibility is that the ISM in regions around most SSSs is not as dense as is the region around CAL83. This could be because of the position of the sources within the galaxy. But it is also feasible that the sources themselves lower the local density. Jets, seen in some SSSs are one way in which the ISM can be pushed away from the source. In addition, if a nebula forms it is expected to expand. The radiation from SSSs in regions of moderate to low density would escape and ionize gas far from the SSS.
2.4 Extensions of the Class of SSSs Derived from Extra-Galactic Studies
The calculations of Di Stefano & Rappaport (1994) used the then-known SSSs as input, assuming that they were typical representatives of the class. With the advent of Chandra and XMM-Newton, it became possible to detect SSSs in other galaxies. Typical numbers of SSSs with temperatures and luminosities similar to those in the Local Group were an the order of tens (Table 1). Di Stefano & Rappaport (1994) showed that, as expected, the effects of increased absorption are to make it more difficult to observe the lower-temperature sources. Thus, in other galaxies we are observing the SSSs that are not within or behind regions with high absorption, and preferentially the higher temperature sources which also tend to be the brightest SSSs. Beyond simply finding more SSSs (Di Stefano & Kong, 2003b) in external galaxies, we also discovered extensions of the class.
-
•
QSSs: External galaxies were found to contain not only SSSs, whose flux falls to zero above keV (Di Stefano & Kong, 2004), but also a higher photon-energy extension composed of quasisoft X-ray sources (QSSs). QSSs emit photons above 1 keV, but not above keV. The estimated values of the effective temerature are typically eV.
-
•
ULSs: When we observe entire galaxies, as Chandra and XMM-Newton do for many galaxies, we find more bright X-ray sources (XRSs) of every type. This has allowed us to discover rare classes of XRSs. Among the most important of these are ultraluminous XRSs (ULXs). ULXs are non-nuclear sources with X-ray luminosities above erg s-1. As is the case with SSSs, the empirical definition of the class means that is is likely composed of subclasses, each having a different physical nature. Some have been identified as neutron-star systems through the detection of pulsations (Israel et al., 2017). Others are thought to be black-hole accretors (Kong & Di Stefano, 2005). BHs of stellar mass and higher have been considered. Ultraluminous SSSs (ULSs) have been discovered. They constitute a significant fraction (as many as 1 in 7) of all ULXs (Liu, 2011).
Some ULXs and ULSs have been observed to either be transient or to pass through phases in which the X-ray spectrum changes (Kong & Di Stefano, 2005). When they are “on” they contribute significantly to the soft X-ray flux emitted by the galaxy. It is important to note that ULSs tend to have temperatures at the high end of the SSS temperature range, with values that can be eV or higher. Some would be called QSSs.
-
•
HSSs: Recently, a low-photon-energy extension of the class of SSSs has been discovered (private communication). These Hypersoft X-ray sources (HSSs) exhibit little or no emission above keV. HSSs appear to be sources that have values of below roughly eV. Among the “classical SSSs”–i.e., those found in the Local Group, some have lower limits of in this range, and one has both a lower and upper limit consistent with HSSs (Greiner, 2000). These classical low-photon-energy sources have typical luminosities around erg s-1. There is a definite connection between the classical SSSs and HSSs. Within the Local Group, two M31 novae have been seen to transition from an SSS phase to an HSS phase as they cool post-explosion. These HSSs have lumiosities in the range erg s
Just as with SSSs, however, there appear to be other classes of HSSs that may be ultraluminous. The HSSs discoveries outside of the Local group have typical luminosities about ten to about 100 times higher than the local SSSs. Such high luminosites cannot be generated by WDs. This suggests that HSSs in other galaxies may be NS or BH accretors. Like the WD accretors whose photoshpere appears to increase in size, the same may be true of NS and BH accretors, where the source’s photosphere and/or the radius of the inner disk increases.
| Morphology | Source | SFR ( ) | SSS count (Liu, 2011) | SSS count (Wang et al., 2016) | |
|---|---|---|---|---|---|
| Spiral | M51 | 4.5 | 2.9 | 27 | 28 |
| M81 | 5.4 | 0.5 | 11 | 13 | |
| M83 | 3.0 | 3.1 | 28 | 42 | |
| M101 | 2.3 | 2.9 | 36 | 35 | |
| Lenticular | Cen A | 4.9 | 0.8 | 8 | 11 |
| NGC 3115 | 6.9 | - | 0 | 1 | |
| Elliptical | NGC 3379 | 5.8 | - | 6 | 4 |
| NGC 4278 | 6.0 | - | 2 | 3 | |
| NGC 4697 | 6.0 | - | 10 | 8 |
Given these challenges, in this paper we do not use the characteristics of a population of SSSs to compute their contribution to various ionization states. Instead, we compute the ionization due to SSSs having a range of luminosities and temperatures and compute how large the population would have to be in order to contribute significantly to the observed ionization states.
3 Modeling
Predicting the nebular emission lines depends on two key features of the photoionization process: the ionizing radiation field and the characteristic of the ionized gas. This paper focuses on the radiation field powered by SSSs to predict the intensity of highly ionized lines in star-forming galaxies. We assume that the spectral energy distribution (SED) of SSSs conforms to a blackbody model, which serves as input to the MAPPINGS photoionization code (Sutherland et al., 2018). In this section, we describe the details of the SED and outlines the configuration of the grid employed in the MAPPINGS model.
3.1 Ionizing radiation field
3.1.1 BPASS stellar population synthesis
In star-forming galaxies, stellar populations of main sequence and giants are the primary source for ionizing photons. The spectral energy distribution (SED) of the stellar component mainly changes with stellar age and metallicity (see Conroy, 2013, for a review). Several model has been developed to predict the stellar spectra with different prescriptions regarding the initial mass function (IMF), stellar evolution track and spectral library. In these models, the shape of the UV flux beyond the Lyman limit is highly uncertain, depending on the adopted stellar evolution and atmospheric model. These cause systematic uncertainties in the production of ionizing photons. So far, models accounting only stellar component has not been able to produce sufficient UV flux to reproduce the observed flux in star-forming galaxies.
We adopted the stellar SED from BPASS 2.2 model which incorporates the binary stellar evolution (Stanway & Eldridge, 2018). The inclusion of binaries is important in increasing the stellar contribution in ionizing flux. The code follows the evolution of single and binary stars from the STARS stellar evolution tracks (Eggleton, 1971; Eldridge et al., 2008). Synthetic stellar spectral library from BaSel v3.1 (Westera et al., 2002) is adopted and complemented with the library from Lejeune et al. (1998) for lower metallicity stars. Spectra for WR stars are calculated using the Postdam PoWR theoretical library (Hamann et al., 2006; Sander et al., 2015) and those for O stars are calculated using the WM Basic code (Pauldrach et al., 2001) which adopts grid in Smith et al. (2002).
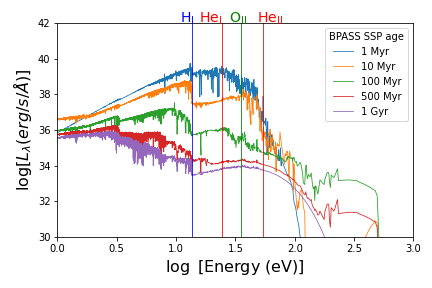
BPASS provides nine IMF options, we use one that resembles the Kroupa (2001) IMF which consists of a double power law with a slope of for stellar mass range of to and a steeper slope of for a higher stellar mass range from to . We assumed a stellar metallicity of . Figure 1 shows SED of stellar populations from BPASS with our chosen metallicity and different stellar population age, ranging from 1 Myr to 1 Gyr, normalised for a total stellar mass of . Vertical lines in the figure marks ionization potential of different species.
In Figure 1, the youngest stellar population with an age of 1 Myr produce the highest flux in the energy range correlated with the ionization potential of four species shown. The flux of ionizing photons decrease as the stellar population age increase because the most massive stars which produce these photons has died. Because of this, we chose the 1 Myr SED normalised for a population as the basis for our photoionization model. We note that old stellar populations (100-500 Myr) produces higher flux in energy range eV compared to the younger populations, which account for the influence of binaries in the later stage of stellar population. For example, white dwarfs (WDs) only start to form after about 100 Myr and the formation rate increases after that. SSS and other X-ray binaries are part of these population as well and their spectra should be incorporated in the population modelling. However, the spectra of such sources in multi wavelength range is rather incomplete and is difficult to account for. In the current state, BPASS fails to reproduce the intensity of high ionization such as (Xiao et al., 2018; Stanway & Eldridge, 2019). Other sources like X-ray binaries needs to be incorporated in an ad-hoc fashion to elevate the emission to the observed level (Schaerer et al., 2019; Senchyna et al., 2020).
3.1.2 Blackbody to represent SSS
Super-soft sources (SSS) are typically observed in the X-ray spectrum, and limited information is available regarding their radiation in other wavelength bands. The X-ray spectra of SSS are commonly approximated using a blackbody model. To approximate the ionizing radiation field emitted by SSS, first we input the blackbody spectrum with seven different temperatures, ranging from 5eV (kK) to 100eV (K). Our primary focus is on testing the reproduction of highly ionized lines using SSS, and we do not aim to consistently match the low ionization lines, which have previously been successfully predicted using SED from stellar population synthesis.
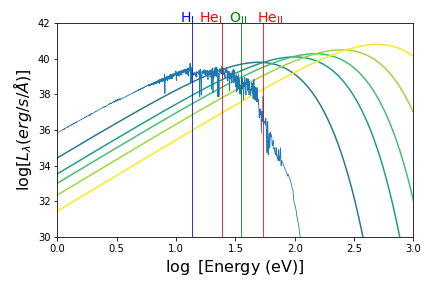
Figure 2 shows blackbody spectra with temperature and 100 eV compared to the spectra of 1 Myr stellar population from BPASS with a total stellar mass of . The color varies from green to yellow as the temperature varies from 10 to 100 eV. To compute the luminosity of the blackbody from the flux distribution, we assume the radius of the source to be cm. In this figure, we assume that the bolometric luminosity of each blackbody equals to that of the stellar population. Again, the vertical lines mark the ionization potential of four different species. The figure shows that the inclusion of a blackbody source can be important in modelling high ionization species. The contribution of a eV blackbody is roughly equal to the stellar component for ionization gaining more importance for a species with higher ionization energy like and . We use a pure blackbody with various properties as an input to our photoionization model to gain insight on which properties are influential in producing the observed emission. The properties are listed in Table 2 and the results are discussed in Section 4.1.
3.1.3 Combination of stellar spectra and blackbody
We combine the stellar spectra from BPASS with blackbody spectra to represent the addition of SSS as one the source of ionizing photons in a galaxy. We use the spectra from the 1 Myr stellar population with total stellar mass of from BPASS as these young population is the most efficient producer of the ionizing flux and explore seven blackbody temperatures presented in Table 2. In the combination, we explore different contributions of the blackbody to the BPASS spectra by changing the bolometric luminosity fraction of the blackbody to the stellar population. The luminosity fractions that we applied are 0 (pure stellar), 0.01, 0.1, 1 and 10. These ranges are also presented in Table 2.
3.2 Photoionization model grid
We use ionizing spectra as described in Section 3.1 as inputs for the MAPPINGS V111https://mappings.anu.edu.au/code/ code Nicholls et al. (2014); Sutherland et al. (2018) to generate a grid of photoionisation models. MAPPINGS includes heating, ionization and shocks within a gas nebula to compute the resulting nebular spectra (continuum and emission line flux). It takes into account the input ionizing spectrum, gas properties of the nebula and a dust treatment (Groves et al., 2004). The atomic data used in the latest version comes from the CHIANTI version 8 (Del Zanna et al., 2015).
We explore the effect of different input spectrum and the gas ionizing parameters to the calculated [/ ] emission line ratio from MAPPINGS. We compared the line ratio from different model variants to detect the sensitive parameters that drives the change in the line ratio. We then compared the line ratio from the models to the observed datasets from local and high redshift galaxies and discuss the ranges of parameters that can reproduced the observations. Here we describe the parameters that we use in the model and discuss the different parameters that we tested and their value ranges. Table 2 summarise the different input spectrum and gas ionization parameters.
When running the photoionization model, we set the gas-phase metallicity to be . We use the solar abundance from Anders & Grevesse (1989) and the depletion factors from Jenkins (2014) for each element, with a logarithmic base depletion of 1.50 for iron. These values are chosen to mimic the conditions in the diffuse interstellar medium (ISM) of the Milky Way. MAPPINGS incorporates dust treatment with a grain size distribution following Mathis et al. (1977), without allowing for grain destruction. The depletion fraction of polycyclic aromatic hydrocarbons (PAHs) is set at .
Ionization parameters () are adopted with values ranging from to in 0.5 dex increments, corresponding to dimensionless ionisation parameters between and . The ranges are selected to align with observed values for local starburst galaxies (Kewley et al., 2001; Rigby & Rieke, 2004).
We assume a closed-spherical geometry, where radiation is confined within the nebula, and all ionizing photons interact with the gas. The gas pressure is held constant at , with an initial temperature of , corresponding to initial density of . The chosen value is comparable to the observed density of for local galaxies in the COSMOS-[] sample (Kaasinen et al., 2017). We assume the nebula to be radiation-bounded, meaning the gas absorbs all ionizing photons.
| Ionizing spectra | Parameters | Values | Unit |
|---|---|---|---|
| Blackbody | 5, 10, 20, 30, 50, 80, 100 | eV | |
| Ionization parameters () | -4, -3.5, -3, -2.5 | - | |
| Blackbody BPASS | 5, 10, 20, 30, 50, 80, 100 | eV | |
| Blackbody luminosity fraction | 0, 0.01, 0.1, 1, 10 | - | |
| Ionization parameters () | -4, -3.5, -3, -2.5 | - |
3.3 Observational sample
We compare our model predictions with the observed highly ionized emission lines detected in galaxies at both low and high redshifts. Our study is based on a sample of strong emission line galaxies from SDSS DR7 (Abazajian et al., 2009), specifically those with detection as reported by Shirazi & Brinchmann (2012). To ensure the reliability of the data, Shirazi & Brinchmann (2012) employ a sample criterion of for key emission lines, including , , , and . The primary ionization source of galaxies is then classified based on the Baldwin et al. (1981) diagram. Our analysis is confined only to the star-forming galaxies, totalling 189 in number.
In addition to the SDSS galaxies, our observation sample includes the emission lines detected in high-redshift galaxies from the NIRSPEC instrument in JWST. The data reduction procedure is described in Heintz et al. (2023). We take the line measurement available in the public NIRSPEC dataset111https://dawn-cph.github.io/dja/blog/2023/07/18/nirspec-data-products/ and select only sources with signal to noise ratio higher than 3 (SNR 3) for and lines. This results in five galaxies with redshift of and . Table 3 expands on the identification and position of each galaxy as well as the log [/].
| Root | redshift (z) | RA | Dec | log / |
|---|---|---|---|---|
| gds-deep-hr-v1 | 5.9193 | 53.126535 | -27.8180923 | -0.8458293 |
| gds-deep-mr-v1 | 3.0877 | 53.1699528 | -27.7684022 | -0.77633943 |
| gds-deep-mr-v1 | 5.91677 | 53.12259 | -27.760569 | -0.42892498 |
| snH0pe-v1 | 1.78625 | 171.76933299 | 42.45423372 | -0.79143747 |
| snH0pe-v1 | 1.24423 | 171.7715309 | 42.47715313 | -0.36345819 |
4 Results
4.1 emission from supersoft X-ray source
The X-ray emission from supersoft X-ray sources (SSS) is best-fitted with a pure blackbody spectra resulting from a binary with a white dwarf as one of the companion. Because multi-wavelength observations of such sources has not been conducted, we model the spectra to be blackbody here to test whether SSS can account for the elevated lines observed in galaxies at low and high redshift. As discussed in Section 3.1 and Table 2, the main parameters of the model that we varies to see their effect on the resulting line are the blackbody temperatures and ionization parameters. Aside from these parameters, we have tried exploring the bolometric luminosity effect in the resulting / line ratio and find that it does not have a strong influence. This result is expected because increasing luminosity of the input spectrum drive an increase in the total line flux for each line, but the increase in both and line flux will results in a similar line ratio. In this section, we expand on the how temperature and ionization parameter affects the / line from MAPPINGS.
4.1.1 Effect of varying temperatures on emission
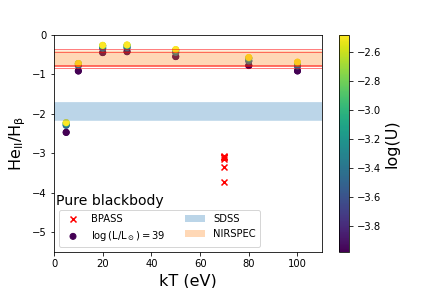
Blackbody temperatures play an important role in the shape of the input spectra as shown in Figure 2. A higher blackbody temperature increase the peak energy of the spectra. Figure 3 shows the ratio of the to the line flux as a function of blackbody temperatures in . In this figure, the variation of the ionization parameter is shown in the color bar. Increasing the temperatures from to 20 cause a dex rise in the line ratio, while increasing the further to eV cause a dex decrease in the line ratio. This shows that the emission is sensitive to the blackbody temperature and the blackbody with around eV is the most efficient in producing the line. The model aligns with the observation of CAL83, the only SSS with detected line in its nebula, that has the temperature in the range of 20-50 eV.
The red cross in Figure 3 shows the / line ratio from the model with a 1 Myr stellar population spectra from BPASS as an input. The ionization parameter range is kept the same as the blackbody model. The line ratio from stellar input is to dex lower than the ratio from the blackbody model. The blue shaded region shows the observed range of the line ratio from the SDSS sample and the orange shaded region shows the observed range from the NIRSPEC sample. The line ratio produced from the BPASS stellar population, albeit using a very young stellar population of 1 Myr, is more than 1 dex lower than the observed range from the SDSS and dex lower than the NIRSPEC observation. Meanwhile, the line ratio from pure blackbody models cover both the SDSS and NIRSPEC observation completely.
This result shows that while the usual stellar population spectra can not produce the observed level of emission observed in local and high redshift galaxies, a blackbody spectra with temperature ranging from eV can reproduce the elevated emission from the observation. This results shows the feasibility of SSS to drive the production of lines in galaxies as the spectra of these sources are best modelled with SSS in this temperature range.
4.1.2 Effect of ionization parameters in the emission
One of the important properties of the nebular gas to the resulting emission lines is the ionization parameters. Strong emission lines like [OIII] and [OII] are known to be sensitive to the ionization parameter and can be use as a diagnostic to trace it. In Figure 3, the symbols are colored based on the ionization parameter , with lighter colors mark higher ionization parameter. The red cross shows the line ratio from BPASS model with similar range of ionization parameter.
Figure 3 present that / line ratio from model with blackbody input increase dex with increasing ionization parameter from to . The variation of line ratio due to ionization parameter is larger in the line ratio from BPASS model, reaching to approximately dex. The increase in the level is not linear with increasing ionization parameter, with a slower rise in the high ionization parameter range. When the ionization parameter of the gas is sufficiently high, increasing it will not drive a crucial change in the resulting line ratio, including the / ratio. We can see that even though the line ratio from the pure BPASS model is sensitive to the ionization parameter, it cannot reach the observed level even after we increase the ionization parameter. The blackbody model, on the other hand, can provide ionization for the for the species in the typical ISM, with little dependencies to the parameter.
4.2 emission from star-forming galaxies with supersoft X-ray source
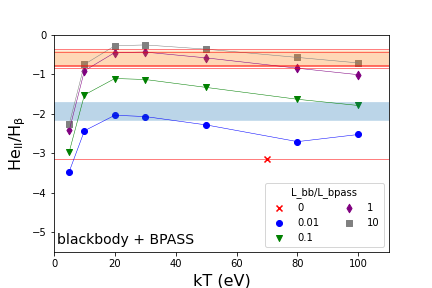
We have discussed the ability of a blackbody to produce line in a nebulae in the section above. However, to explain the detectability of lines in star-forming galaxies, we also need to take into account the ionization from stellar population. We do not have a realistic accounting of the portion of luminosities arise from stellar population versus the supersoft X-ray source from observations as a constrain. Therefore, we varies the fraction of the bolometric luminosity of the blackbody to the bolometric luminosity of the stellar spectra (), ranging from to . The total bolometric luminosity of the stellar population is constant and derived by integrating the 1 Myr SED model from BPASS with a total stellar mass and a metallicity of . The ionization parameter is fixed to be .
Figure 4 shows the line ratio as a function of blackbody temperature from a model using the combined spectra as inputs. Different colors and symbols mark the model with different contribution of blackbody spectra, as indicated in the legend. The red cross represent the line ratio produced by pure BPASS stellar population model ().
In figure 4, the combination of BPASS spectra and a blackbody with a temperature of eV produce similar results to the model with pure BPASS spectra when , indicating that the blackbody does not affect the resulting lines. The stagnancy of line flux produced by these variants indicates that at these combinations, the ionization of the is powered mostly by the stellar population. Increasing the blackbody contribution increases the ionization. For , for example, the resulting line ratio is almost 1 dex higher than the pure BPASS result, marking the importance of the blackbody component in elevating the ratio. Although, the line ratio produced by these models are slightly below the ratio observed in SDSS galaxies (blue shaded region), indicating the requirement for a higher temperature blackbody.
The combination of BPASS stellar spectra and a blackbody with between 10-50 eV, using the lowest (shown as blue circles in the figure) reproduce the line ratio detected in the local galaxies by SDSS. The model with (shown as green triangles in the figure) reproduced the / ratio of the SDSS galaxies when using a blackbody with a temperature between eV.
There is a sharp increase in the resulting ratio when the temperature changes from eV to eV, above which the ratio slightly decline. In the temperature range, a combination with a blackbody luminosity equals to the stellar’s of (purple diamonds Figure 4) reproduce the range of the / observed in high-redshift galaxies observed by NIRSPEC instruments in JWST (orange shaded region). Increasing the blackbody contribution to (grey squares) also produce similar results but with slightly higher / ratio than observed in eV.
The efficiency of a blackbody in elevating the ratio decrease even further in a combined model with a eV blackbody. The / ratios produced by these model are to dex lower than that produced by a model with eV blackbody. In this temperature range, the model with the lowest luminosity fraction () fail to reproduce the SDSS observation. The SDSS galaxies are rather matched by the model with (green triangles). The model with high blackbody contribution () can still reproduce the high redshift galaxies represented by the orange shaded region.
In conclusion, we found that adding a blackbody spectra to the BPASS stellar spectra can elevate the production of lines and the resulting / line ratio. In general, a eV blackbody is the most efficient producer of the ionizing flux, where we detect a peak in the resulting / from all models with various . The blackbody contribution in the combined spectra, represented by , is a crucial parameter in elevating the / ratio to the observed range. In general, the ionization increase significantly with an increasing . The increase tapered above . The / ratio observed in local galaxies by SDSS can be reproduced by using a model with a low temperature blackbody with eV and a a higher blackbody contribution of , a model with a slightly lower temperature of and a higher blackbody contribution of , or a model with much higher blackbody temperature of eV with the same blackbody contribution of . The ratio observed in high redshift galaxies by JWST can be produced using a blackbody with a wide range of eV and a . The accounting of the SSS based on the temperature and luminosity of blackbody required to reproduce the observed ratio in local and high redshift galaxies are discussed further in Section 5.
5 Possibility of SSS to ionize in galaxies
We have discussed the possibility of SSS, represented by blackbody spectra with temperatures between eV, in ionizing the line whether by itself (Section 4.1) or in combination with stellar spectra (Section 4.2). The main takeaway is that an SSS alone can produce the level of ratio observed in local and high-redshift galaxies as long as is higher than 5 eV. The total luminosity of the system and the gas ionization parameter does not really affect the resulting line flux.
In a combination of a blackbody and 1 Myr stellar SED, the bolometric luminosity fraction of SSS to stellar spectra () also plays a crucial role in producing the line in addition to the temperature. In general, / line ratio increase dex when the temperature increase from to eV, then slightly decline ( dex) when the temperature increase from to eV. The highest line ratio is produced in a system with a eV blackbody. Figure 2 shows that with the same luminosity, the blackbody with eV produce the highest flux around the ionisation energy. A blackbody with a higher temperature produce less flux in this energy because the peak of the SED shifted to a higher energy regime. On the other hand, the SED of a lower temperature blackbody have reached its peak before this energy range and started to decline.
Increasing the luminosity fraction of blackbody to stellar spectra also increase the / line ratio. The most significant rise ( dex) occur in a system with a blackbody temperature ranges from eV to eV when multiplying the by 10 from to and from to . The line ratio only slightly increase ( dex) when increasing from 1 to 10. In these systems, the total rise of ratio when increasing the from to is about 1.5 to 2 order of magnitude. The increment of the line in a system with a low temperature blackbody of eV is less significant, with the total rise of dex when the increase from to . Again, this is because such a low temperature blackbody cannot produce a large flux of ionization photon. Similar effects happened for a system with a very high blackbody temperature of eV because the SED of such a system is still inclining to reach its peak at a higher energy level.
The observed / line ratio in local SDSS galaxies can be reproduced by a system with a 1 Myr stellar SED and a blackbody with: (i) a bolometeric luminosity fraction of and eV, and (ii) a bolometric luminosity fraction of and a very low temperature of eV or a very high temeprature of eV. The / ratio observed at high redshift galaxies agrees with the model employing a higher luminosity fraction of with a wide temperature range (10-100 eV).
5.1 SSS in a more realistic galaxy model
In Section 4.2, we have obtained the properties of the system consisting of stellar populations and a blackbody that can reproduced the observed line ratio in local and high redshift galaxies. However first, we need to translate those SSS properties from our simplified model in a context of a more complicated and real galaxy. Therefore, we can later do the accounting of SSS needed to reproduce the observed line ratio in low and high redshift galaxies.
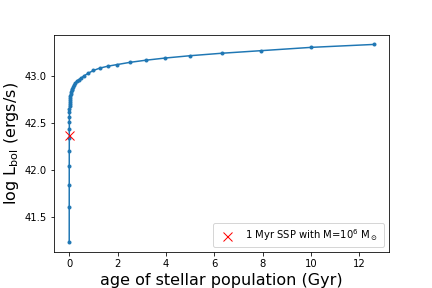
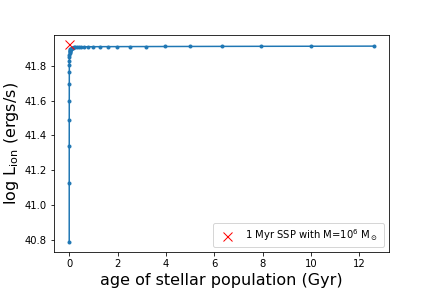
In Figure 5, we compare the bolometric luminosity of the 1 Myr simple stellar population from BPASS with a total mass of with the build up of bolometric luminosity of a model star-forming galaxy. The luminosity of the model galaxy is derived by assuming a delayed-tau star formation history () where Gyr. Such a model is often adopted to represent a Milky Way like galaxy. The total stellar mass of the model galaxy is . The red cross in Figure 5 shows the total luminosity of the 1 Myr population that we use as a benchmark for the SSS in the combined system. It is shown that the bolometric luminosity of the 1 Myr population is around an order of magnitude smaller than the total luminosity of the model galaxy, or accounting only of the total light. However, in Figure 6 we plot the total ionizing luminosity (those with wavelength ) of the 1 Myr population versus the model galaxy and we found that the 1 Myr population that we use can recover all the ionizing flux from a galaxy. Therefore, we are convinced that the 1 Myr population that we use as a benchmark represent the ionizing stellar population in a galaxy.
5.2 Reproducing the line ratio of local SDSS galaxies
In Section 4.2, we found that a blackbody with eV can reproduce the line ratio observed in local SDSS galaxies if the luminosity fraction is . In Figure 5, the bolometric luminosity of our 1 Myr BPASS population is about . Therefore, with the total luminosity of SSS needed to produce the observed line ratio from SDSS is . For typical SSSs with a luminosity of , this translate to a need of hundreds or thousands of SSS in local galaxies. For high luminosity SSSs with , the numbers required is in the tens.
At the moment, we do not have a good constrain for the intrinsic total number of SSS in galaxies due to its low detectability. However, we can use SSS observed in nearby galaxies and their properties as a proxy on whether the SSS could be a major contributor for ionization.
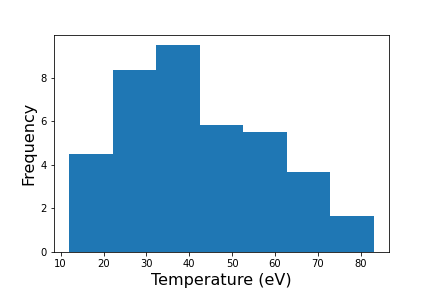
Figure 7 shows the number distribution of observed SSS in nearby galaxies as a function of temperature compiled by Greiner (1996). Some of sources have a wide range of temperature detected, so we weighted their contribution in several temperature bins. The number of SSS with eV from this figure is around 4-8 sources. Di Stefano & Rappaport (1994) has found that such low temperature sources are difficult to observe, and therefore only a small fraction of the total number can be detected. The detection fraction increase with increasing temperature. Based on their modeling, for every SSS detected, the estimate for the intrinsic number of SSS could be in order of tens to thousands (). Assuming fraction of , consequently, the total number of SSS with eV can reach sources. Based on our photoionization model, this number of SSS with eV are able to produce the ionization in local galaxies if their luminosity is in the range of .
Another SSS populations with a feasibility to reproduce the line ratio in local galaxies are those with between 5-10 eV or eV with a luminosity fraction of . Which means their bolometric luminosity would be of the 1 Myr BPASS spectra, or . For SSS with and , the numbers needed to make up the total bolometric luminosity are in the , and , consequently. Unfortunately, we do not find SSS with those range of temperatures in the Greiner (1996) catalog, so we refrain to make a calculation on the numbers of detected SSS and how it match to the number needed by the model.
5.3 Reproducing the line ratio of high redshift galaxies
The / ratio detected in high redshift galaxies is significantly ( dex) higher than observed in local galaxies. Our photoionization model shows the need of quite high blackbody luminosity fraction of to when trying to match the line ratio from high redshift galaxies. However, the model with is actually adequate to cover the range of observed line ratio in high redshift galaxies and the increase of when increasing from 1 to 10 is insignificant. Therefore, here we are making calculation on the number of SSS required to reproduce the / ratio on high-redshift galaxies based on the model with only.
Figure 4 shows that the model variants with match the observed ratio for a wide range of blackbody temperature, ranging from eV to eV. This figure shown how each model with single temperature perform to reproduce the observed data. However, Figure 7 shows that in a galaxy, there are sources with various temperatures and all contributes differently to the ionization based on how abundant they are and their total luminosity. However, there are no clear constrain on the distribution of temperature and luminosity of SSSs in a galaxy that we can use for our model, making a realistic calculation become complicated.
Fortunately, Figure 4 shows that the range of / ratio produced by the model with across eV are quite narrow, which means that the ionization efficiency for each of these blackbody is quite similar. Therefore, we can assume that the ratio from a single temperature model will be similar to that produced by a model consisting with multiple blackbodies with various temperatures as long as the total luminosity are equals. A fraction of blackbody luminosity translate to , equal to the bolometric luminosity of the stellar population. Such a high bolometric luminosity requires the number of SSS with to be in the thousands, or SSS with to be in the ten thousands.
While the numbers required are shockingly big, we have to remember this is the total number of the source with temperatures in the eV range. To get the total number of SSS in this temperature range, we need to integrate the number distribution in Figure 7, or look at the total SSS count detected in a galaxy as shown in Table 1. Both shows that the total SSS number in a galaxy can reach sources (e.g., in M83 and M101 in Table 1). In Di Stefano & Rappaport (1994), it is shown that the fraction of the detected number of source versus the intrinsic number can reach as low as in Milky Way. Using this number as our assumption, the total count of the SSS in a galaxy then can reach sources, which match the requirement for the total number of SSS from the photoionzation model to reproduce the high-redshift galaxies.
5.4 Different ionization level in low and high-redshift galaxies
The / ratio observed in local galaxies is significantly lower than that detected in high-redshift galaxies (see Figure 4, which impact different characteristic of SSS required to produce the ionization photons in those galaxies. As discussed in Section 5.2, only a couple of hundreds SSS with low temperatures between eV are enough to produce the ionization photons required to match the observed ratio in local galaxies, while a couple of thousands SSS with a wider range of temperatures are needed to reproduce to observed ratio of high redshift galaxies.
The properties of SSS detected in a galaxy can vary widely, as shown in Table 1, including their temperature, luminosity and total number count. The detected number count, which we found important in computing the total ionizing luminosity of the SSS, can vary from 1 to 42 in a local galaxy. Translating the detection into the intrinsic number count would also depend on factors like the temperature of the source and the absorption of the X-ray photons by dense gas in a galaxy. The interplay between all these factors influence our interpretation of the production of ionizing photons, which directly affect the resulting line ratio in a galaxy.
The SSS properties of a galaxy, such as the number count, could correlates on the intrinsic galaxy properties, such as stellar mass, star formation rate (SFR), or morphology. In Table 1, spiral galaxies are shown to host more SSS than the lenticular or elliptical galaxies. Although, the star formation rate could be the main driver for this correlation. Further studies are needed to investigate whether the SSS populations are truly different in local and high-redshift galaxies and the origin of this variability.
6 Summary
The origin of lines observed in starforming galaxies has been a mistery because stellar sources can not produce high energy photons to produce such highly ionized species. Previous works has proposed several alternatives including the ultra lumnious X-ray sources (ULXs) and high mass X-ray binaries (HMXBs) but no conclusive solution has been found.
We proposed supersoft X-ray sources (SSSs) as the primary contributor to the origin of ionization in starforming galaxies. SSS are best described as blackbody with temperature ranging from eV and has been found in nearby galaxies. Unfortunately, the low temperature of SSS made it difficult to detect due to the absorption of soft photons produced. The observed number of the population is often much smaller than the true total number. Di Stefano & Rappaport (1994) found that the fraction of the observed number drops with lower temperature SSS and with an increase of gas density.
Using MAPPINGS photoionization code, we test the ability of the SSS to reproduce the observed [/] ratio and explore properties that are sensitive to the resulting line ratio. We model the SSS as a blackbody with temperature between eV. In Figure 3 we found that change in temperature can affect the resulting significantly. We also explore the importance of the gas ionization paramater and find that it does not change the ratio by much.
We explored the possibility of SSS to contribute to the ionization in star-forming galaxies by combining the spectra from the stellar component and blackbody in the photoionization code (Figure 4). The stellar population SED is adopted from BPASS with an age of 1 Myr, a metallicity of , and a total stellar mass of . We fixed the luminosity of the stellar spectra but vary the temperature of the blackbody and the luminosity fraction of the blackbody to the combined spectra. The prediction from the model is plotted in comparison to the observed measurement from local and high redshift galaxies. We also consider the observed number of SSS (Figure 7) and the estimated total number of SSSs as a function of temperature.
Considering the results of the photoionization model and the abundance of SSSs in galaxies as a function of temperature, we found that SSSs with between eV could be the main producer of the ionizing photons in local star-forming galaxies. The model variants that best match the data from SDSS are those with a luminosity fraction of , which translates to roughly a couple of hundreds of sources in number. The / ratio observed in high-redshift galaxies are about dex higher than the local galaxies, implying a much higher ionization. The model with a luminosity fraction of with temperature range from to eV can reproduce the data. The high luminosity fraction implies that the number of sources can reach . The intrinsic number between to required to produce the observed ratio match the calculation of intrinsic SSS count that we made based on the observed count (Table 1 and Figure 7) and the assumptions that only small number of sources are detected due to the absorption of X-ray photons by gas column in galaxies.
Different ionization level observed in local and high-redshift galaxies represent varieties in the SSS population resides in such galaxies. Further studies on SSS population and their host galaxies are required to investigate whether there are correlations between the SSS and the intrinsic host galaxy properties, and the driver of such correlations.
Appendix A Appendix information
References
- Abazajian et al. (2009) Abazajian, K. N., Adelman-McCarthy, J. K., Agüeros, M. A., et al. 2009, ApJS, 182, 543, doi: 10.1088/0067-0049/182/2/543
- Anders & Grevesse (1989) Anders, E., & Grevesse, N. 1989, Geochim. Cosmochim. Acta, 53, 197, doi: 10.1016/0016-7037(89)90286-X
- Astropy Collaboration et al. (2013) Astropy Collaboration, Robitaille, T. P., Tollerud, E. J., et al. 2013, A&A, 558, A33, doi: 10.1051/0004-6361/201322068
- Astropy Collaboration et al. (2018) Astropy Collaboration, Price-Whelan, A. M., Sipőcz, B. M., et al. 2018, AJ, 156, 123, doi: 10.3847/1538-3881/aabc4f
- Baldwin et al. (1981) Baldwin, J. A., Phillips, M. M., & Terlevich, R. 1981, PASP, 93, 5, doi: 10.1086/130766
- Barkana (2016) Barkana, R. 2016, Phys. Rep., 645, 1, doi: 10.1016/j.physrep.2016.06.006
- Berg et al. (2019) Berg, D. A., Erb, D. K., Henry, R. B. C., Skillman, E. D., & McQuinn, K. B. W. 2019, ApJ, 874, 93, doi: 10.3847/1538-4357/ab020a
- Brammer (2023) Brammer, G. 2023, ’msaexp: NIRSpec analyis tools’, 0.6.17, doi: 10.5281/zenodo.8319596
- Cassata et al. (2013) Cassata, P., Le Fèvre, O., Charlot, S., et al. 2013, A&A, 556, A68, doi: 10.1051/0004-6361/201220969
- Conroy (2013) Conroy, C. 2013, ARA&A, 51, 393, doi: 10.1146/annurev-astro-082812-141017
- Cowley et al. (1990) Cowley, A. P., Schmidtke, P. C., Crampton, D., & Hutchings, J. B. 1990, ApJ, 350, 288, doi: 10.1086/168381
- Crampton et al. (1987) Crampton, D., Cowley, A. P., Hutchings, J. B., et al. 1987, ApJ, 321, 745, doi: 10.1086/165667
- Del Zanna et al. (2015) Del Zanna, G., Dere, K. P., Young, P. R., Landi, E., & Mason, H. E. 2015, A&A, 582, A56, doi: 10.1051/0004-6361/201526827
- Di Stefano & Kong (2003a) Di Stefano, R., & Kong, A. K. H. 2003a, ApJ, 592, 884, doi: 10.1086/375858
- Di Stefano & Kong (2003b) —. 2003b, ApJ, 592, 884, doi: 10.1086/375858
- Di Stefano & Kong (2004) —. 2004, ApJ, 609, 710, doi: 10.1086/421318
- Di Stefano & Rappaport (1994) Di Stefano, R., & Rappaport, S. 1994, ApJ, 437, 733, doi: 10.1086/175035
- Eggleton (1971) Eggleton, P. P. 1971, MNRAS, 151, 351, doi: 10.1093/mnras/151.3.351
- Eldridge et al. (2008) Eldridge, J. J., Izzard, R. G., & Tout, C. A. 2008, MNRAS, 384, 1109, doi: 10.1111/j.1365-2966.2007.12738.x
- Fan et al. (2006) Fan, X., Strauss, M. A., Becker, R. H., et al. 2006, AJ, 132, 117, doi: 10.1086/504836
- Galiullin & Gilfanov (2021) Galiullin, I., & Gilfanov, M. 2021, A&A, 646, A85, doi: 10.1051/0004-6361/202039522
- Garnett et al. (1991) Garnett, D. R., Kennicutt, Robert C., J., Chu, Y.-H., & Skillman, E. D. 1991, ApJ, 373, 458, doi: 10.1086/170065
- Greiner (1996) Greiner, J. 1996, Supersoft X-Ray Sources, Vol. 472, doi: 10.1007/BFb0102238
- Greiner (2000) —. 2000, New A, 5, 137, doi: 10.1016/S1384-1076(00)00018-X
- Groves et al. (2004) Groves, B. A., Dopita, M. A., & Sutherland, R. S. 2004, ApJS, 153, 9, doi: 10.1086/421113
- Hamann et al. (2006) Hamann, W. R., Gräfener, G., & Liermann, A. 2006, A&A, 457, 1015, doi: 10.1051/0004-6361:20065052
- Heintz et al. (2023) Heintz, K. E., Watson, D., Brammer, G., et al. 2023, arXiv e-prints, arXiv:2306.00647, doi: 10.48550/arXiv.2306.00647
- Henze et al. (2014) Henze, M., Pietsch, W., Haberl, F., et al. 2014, A&A, 563, A2, doi: 10.1051/0004-6361/201322426
- Israel et al. (2017) Israel, G. L., Belfiore, A., Stella, L., et al. 2017, Science, 355, 817, doi: 10.1126/science.aai8635
- Izotov et al. (2012) Izotov, Y. I., Thuan, T. X., & Guseva, N. G. 2012, A&A, 546, A122, doi: 10.1051/0004-6361/201219733
- Jenkins (2014) Jenkins, E. B. 2014, arXiv e-prints, arXiv:1402.4765, doi: 10.48550/arXiv.1402.4765
- Kaasinen et al. (2017) Kaasinen, M., Bian, F., Groves, B., Kewley, L. J., & Gupta, A. 2017, MNRAS, 465, 3220, doi: 10.1093/mnras/stw2827
- Kahabka et al. (2008) Kahabka, P., Haberl, F., Pakull, M., et al. 2008, A&A, 482, 237, doi: 10.1051/0004-6361:20078535
- Kahabka & van den Heuvel (1997) Kahabka, P., & van den Heuvel, E. P. J. 1997, ARA&A, 35, 69, doi: 10.1146/annurev.astro.35.1.69
- Kauffmann et al. (2003) Kauffmann, G., Heckman, T. M., Tremonti, C., et al. 2003, MNRAS, 346, 1055, doi: 10.1111/j.1365-2966.2003.07154.x
- Kewley et al. (2001) Kewley, L. J., Dopita, M. A., Sutherland, R. S., Heisler, C. A., & Trevena, J. 2001, ApJ, 556, 121, doi: 10.1086/321545
- Kewley et al. (2019) Kewley, L. J., Nicholls, D. C., & Sutherland, R. S. 2019, ARA&A, 57, 511, doi: 10.1146/annurev-astro-081817-051832
- Kong & Di Stefano (2005) Kong, A. K. H., & Di Stefano, R. 2005, ApJ, 632, L107, doi: 10.1086/498020
- Kroupa (2001) Kroupa, P. 2001, MNRAS, 322, 231, doi: 10.1046/j.1365-8711.2001.04022.x
- Lejeune et al. (1998) Lejeune, T., Cuisinier, F., & Buser, R. 1998, A&AS, 130, 65, doi: 10.1051/aas:1998405
- Liu (2011) Liu, J. 2011, ApJS, 192, 10, doi: 10.1088/0067-0049/192/1/10
- Long et al. (1981) Long, K. S., Helfand, D. J., & Grabelsky, D. A. 1981, ApJ, 248, 925, doi: 10.1086/159222
- Mathis et al. (1977) Mathis, J. S., Rumpl, W., & Nordsieck, K. H. 1977, ApJ, 217, 425, doi: 10.1086/155591
- Nicholls et al. (2014) Nicholls, D. C., Dopita, M. A., Sutherland, R. S., Jerjen, H., & Kewley, L. J. 2014, ApJ, 790, 75, doi: 10.1088/0004-637X/790/1/75
- Orio et al. (2010) Orio, M., Nelson, T., Bianchini, A., Di Mille, F., & Harbeck, D. 2010, ApJ, 717, 739, doi: 10.1088/0004-637X/717/2/739
- Pauldrach et al. (2001) Pauldrach, A. W. A., Hoffmann, T. L., & Lennon, M. 2001, A&A, 375, 161, doi: 10.1051/0004-6361:20010805
- Plat et al. (2019) Plat, A., Charlot, S., Bruzual, G., et al. 2019, MNRAS, 490, 978, doi: 10.1093/mnras/stz2616
- Rappaport et al. (1994) Rappaport, S., Di Stefano, R., & Smith, J. D. 1994, ApJ, 426, 692, doi: 10.1086/174106
- Remillard et al. (1995) Remillard, R. A., Rappaport, S., & Macri, L. M. 1995, ApJ, 439, 646, doi: 10.1086/175204
- Rigby & Rieke (2004) Rigby, J. R., & Rieke, G. H. 2004, ApJ, 606, 237, doi: 10.1086/382776
- Sander et al. (2015) Sander, A., Shenar, T., Hainich, R., et al. 2015, A&A, 577, A13, doi: 10.1051/0004-6361/201425356
- Schaerer (1996) Schaerer, D. 1996, ApJ, 467, L17, doi: 10.1086/310193
- Schaerer et al. (2019) Schaerer, D., Fragos, T., & Izotov, Y. I. 2019, A&A, 622, L10, doi: 10.1051/0004-6361/201935005
- Schmidt et al. (2017) Schmidt, K. B., Huang, K. H., Treu, T., et al. 2017, ApJ, 839, 17, doi: 10.3847/1538-4357/aa68a3
- Schmidtke et al. (2004) Schmidtke, P. C., Cowley, A. P., Hutchings, J. B., Winter, K., & Crampton, D. 2004, AJ, 127, 469, doi: 10.1086/380222
- Senchyna et al. (2019) Senchyna, P., Stark, D. P., Chevallard, J., et al. 2019, MNRAS, 488, 3492, doi: 10.1093/mnras/stz1907
- Senchyna et al. (2020) Senchyna, P., Stark, D. P., Mirocha, J., et al. 2020, MNRAS, 494, 941, doi: 10.1093/mnras/staa586
- Senchyna et al. (2017) Senchyna, P., Stark, D. P., Vidal-García, A., et al. 2017, MNRAS, 472, 2608, doi: 10.1093/mnras/stx2059
- Shirazi & Brinchmann (2012) Shirazi, M., & Brinchmann, J. 2012, MNRAS, 421, 1043, doi: 10.1111/j.1365-2966.2012.20439.x
- Simmonds et al. (2021) Simmonds, C., Schaerer, D., & Verhamme, A. 2021, A&A, 656, A127, doi: 10.1051/0004-6361/202141856
- Smith et al. (2002) Smith, L. J., Norris, R. P. F., & Crowther, P. A. 2002, MNRAS, 337, 1309, doi: 10.1046/j.1365-8711.2002.06042.x
- Stanway & Eldridge (2018) Stanway, E. R., & Eldridge, J. J. 2018, MNRAS, 479, 75, doi: 10.1093/mnras/sty1353
- Stanway & Eldridge (2019) —. 2019, A&A, 621, A105, doi: 10.1051/0004-6361/201834359
- Stark et al. (2015) Stark, D. P., Walth, G., Charlot, S., et al. 2015, MNRAS, 454, 1393, doi: 10.1093/mnras/stv1907
- Sutherland et al. (2018) Sutherland, R., Dopita, M., Binette, L., & Groves, B. 2018, MAPPINGS V: Astrophysical plasma modeling code, Astrophysics Source Code Library, record ascl:1807.005. http://ascl.net/1807.005
- Thuan & Izotov (2005) Thuan, T. X., & Izotov, Y. I. 2005, ApJS, 161, 240, doi: 10.1086/491657
- van den Heuvel et al. (1992) van den Heuvel, E. P. J., Bhattacharya, D., Nomoto, K., & Rappaport, S. A. 1992, A&A, 262, 97
- Wang et al. (2016) Wang, S., Liu, J., Qiu, Y., et al. 2016, ApJS, 224, 40, doi: 10.3847/0067-0049/224/2/40
- Westera et al. (2002) Westera, P., Lejeune, T., Buser, R., Cuisinier, F., & Bruzual, G. 2002, A&A, 381, 524, doi: 10.1051/0004-6361:20011493
- Xiao et al. (2018) Xiao, L., Stanway, E. R., & Eldridge, J. J. 2018, MNRAS, 477, 904, doi: 10.1093/mnras/sty646