1
\SetBgContents
Draft:
Draft:
\SetBgColorred
\SetBgAngle270
\SetBgOpacity0.2
Synchronized Object Detection for Autonomous Sorting, Mapping, and Quantification of Medical Materials
Abstract
The circular economy paradigm is gaining interest as a solution to reduce both material supply uncertainties and waste generation. One of the main challenges is monitoring materials, since in general, something that is not measured cannot be effectively managed. In this paper, we propose real-time synchronized object detection to enable, at the same time, autonomous sorting, mapping, and quantification of end-of-life medical materials. Dataset, code, and demo videos are publicly available111https://github.com/fedezocco/2MMUsMed.
Index Terms:
Materials monitoring, deep learning on the edge, healthcare, circular economy.I INTRODUCTION
The UK alone generated 222.2 million tonnes of total waste in 2018 [1], while each EU inhabitant generated 4.8 tonnes of waste in 2020 [2]. The recycling rate is around 45% in UK [1] and 39.2% in EU [2]. In parallel to waste generation, several countries are also experiencing uncertainties of material supplies, e.g., UK [3] and EU [4]. Some of the critical materials enable green and digital technologies such as lithium for electric vehicles, tungsten for mobile phones, and boron for wind turbines. A transition from a linear to a circular economy has the potential to reduce both waste generation and supply uncertainties by recovering and reusing materials as much as possible [5].
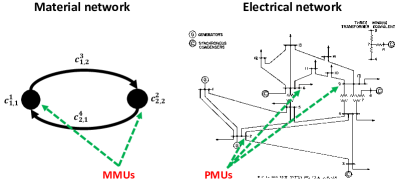
The design of circular material flows is an active area of research. Recently, the conceptualization of material flows and stocks as a network of thermodynamic compartments was proposed in [6], which results from the application of compartmental dynamical thermodynamics [7]. Then, a graph-based formalization was developed in [8]. The graph-based perspective allows to abstract from electrical to material networks, and hence, from wide-area power system monitoring to wide-area material monitoring. While the former is enabled by phasor measurement units (PMUs) [9, 10, 11, 12, 13], the latter could be based on the system proposed in this paper.
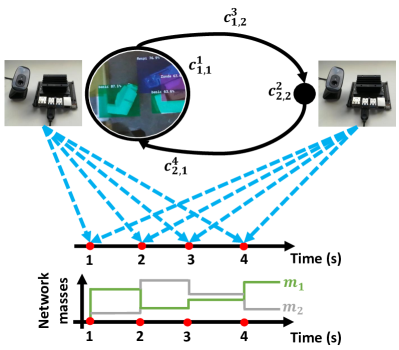
However, measuring materials cannot be performed through the same principles used in PMUs for measuring the phasors of voltages and currents. A vision-based approach can work instead. In particular, object detection has been one of the techniques that has benefited the most from the latest advances in deep learning [14, 15] and it is the one we leverage in our system (Fig. 1).
II THE SYSTEM
II-A Problem Statement
Consider the thermodynamical material network (TMN) depicted on the left-hand side of Fig. 2, which can be expressed as
| (1) |
using the notation in [6]. Assume that the vertex-compartment is a waste sorting facility and also that no material is exchanged between the two vertex-compartments, i.e.,
| (2) |
where , is the set of non-negative integers, and where is the mass of material moving from the vertex-compartment to . Hence, the state of the TMN can be represented with the discrete-time mass-flow matrix [16]
| (3) |
where , is the number of vertices, and is the mass in the vertex-compartment .
We need to perform two tasks:
-
1.
Sort different types of end-of-life products in the sorting facility, i.e., in ; specifically, in this work, the end-of-life products are inhalers.
-
2.
Map and quantify the distribution of materials across the whole network (1) in real-time, i.e., estimate the entries of (3) and their geographical location. This task can be seen as the answer to the following three questions: “How much material is distributed across the network ?”, “What materials are in ?”, and “Where are the detected materials?”.
In the next section, we will describe how we used object detection at the edge [17] to jointly perform both tasks. It is important to note that Task 1 requires to focus on the sorting compartment only, i.e., , whereas Task 2 requires to work at a systemic level. Hence, hereinafter, we will refer to them as compartmental detection and distributed detection, respectively, and they are covered in Subsections II-B and II-C, respectively.
II-B Compartmental Detection
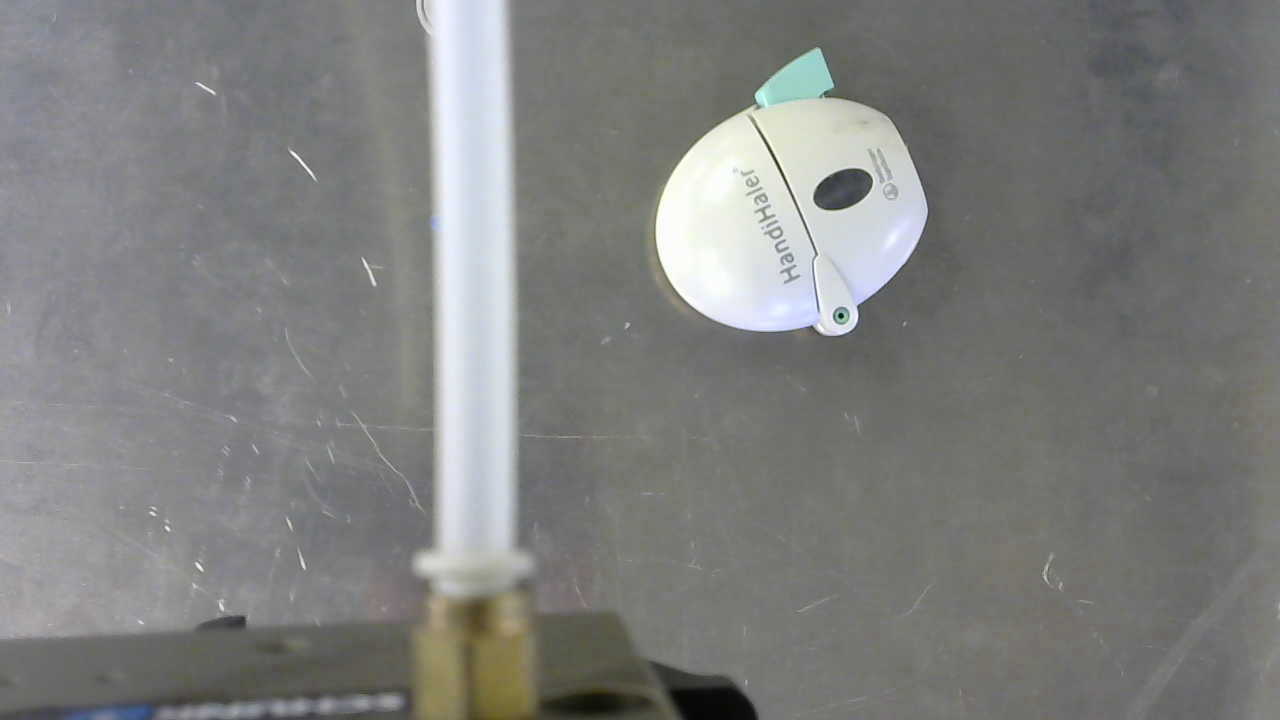
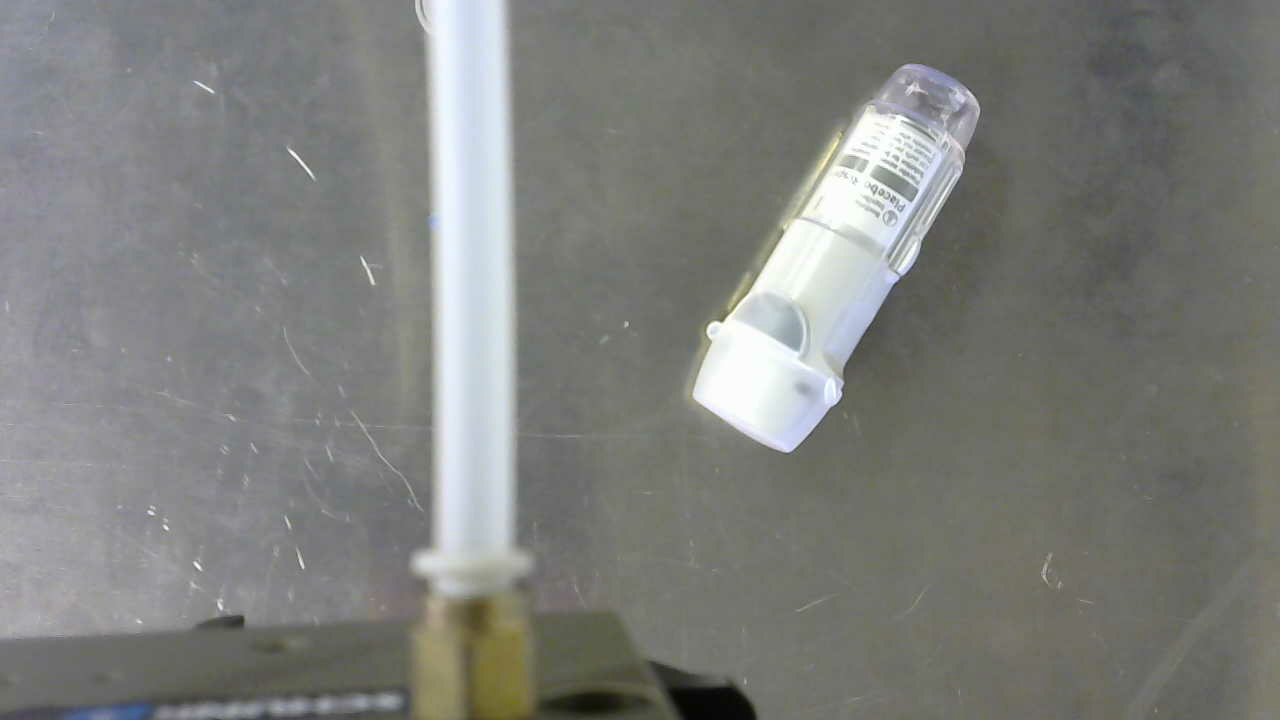
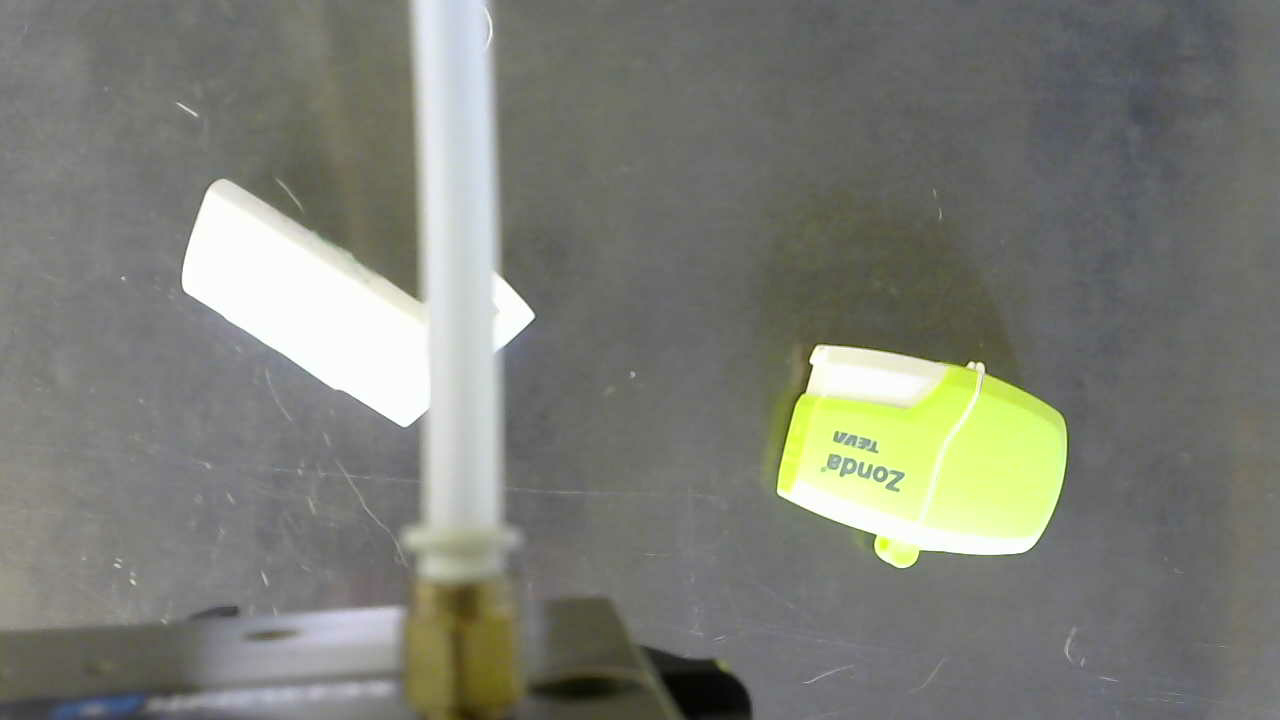
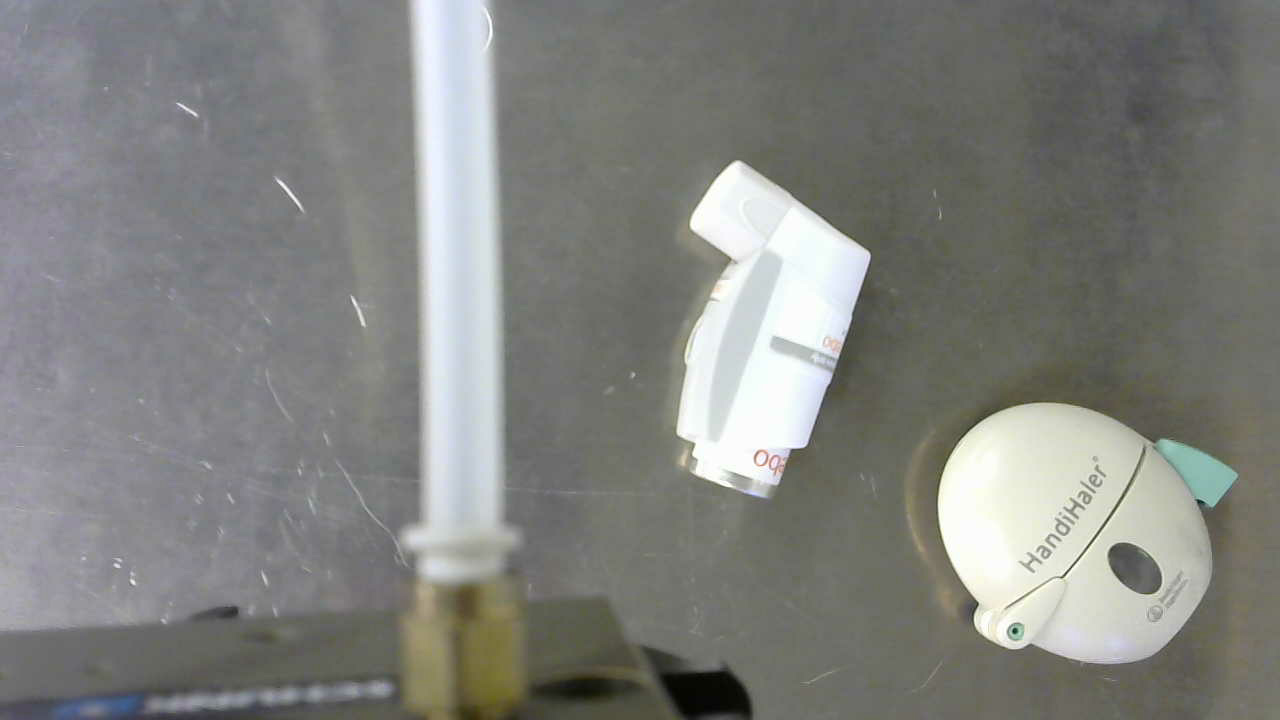
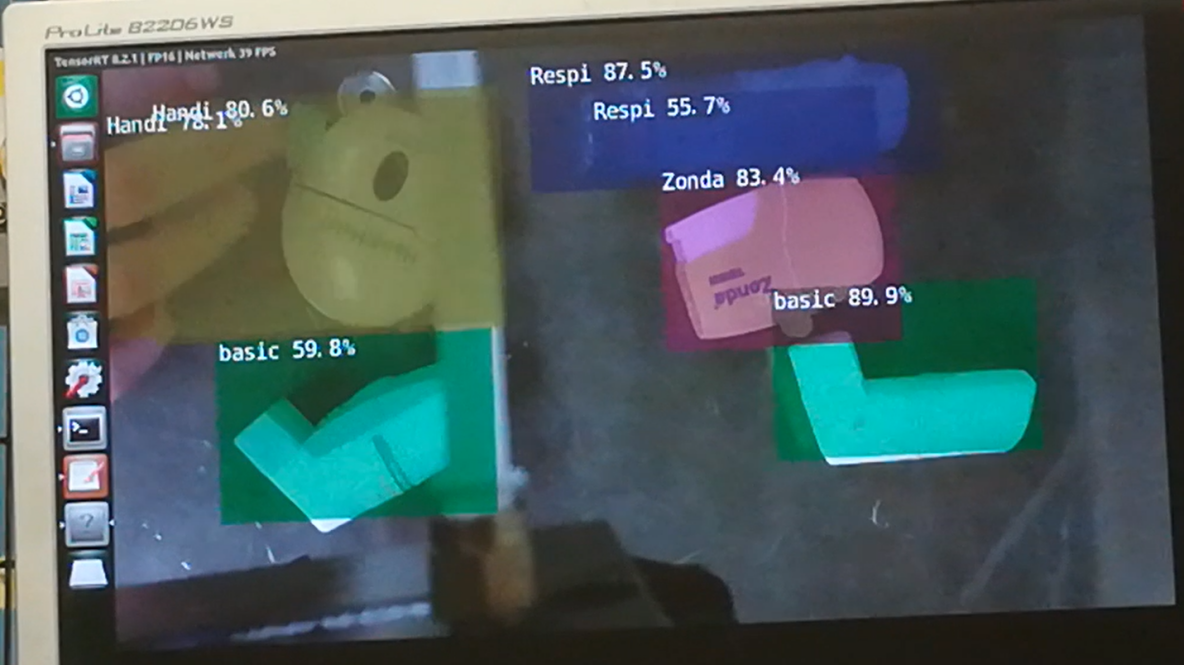
Live object detection can enable the autonomous sorting of end-of-life inhalers in the vertex-compartment , which is a waste sorting facility. To design the detector, we collected and fully annotated 1000 images with the Pascal VOC format using the GUI of an Nvidia Jetson Nano [20]. The images are distributed as follows and some samples are showed in Figs. 3(a)–3(d): 160 with the basic inhaler (label: “basic”), 160 with the HandiHaler model (label: “Handi”), 160 with the Respimat model (label: “Respi”), 160 with the Zonda model (label: “Zonda”), 160 with the flutiform model (label: “fluti”); this results in 800 images. Then, we collected images of pairs of inhalers equally distributed so that each model appears with all the others the same number of times to avoid the class imbalance. The possible combinations/pairs are , with and . For each possible pair, we collected 20 images. Thus, the images of pairs were 200 and they were added to the single-model images to reach the total of 1000 samples.
In addition, for each inhaler, we also annotated the pick point for picking it with a vacuum gripper (label: “pkPnt”). The pick point is essentially a small bounding box located in a position that is quite flat and internal to the device body so that the vacuum gripper is able to generate the vacuum between the inhaler surface and the suction cup. Hence, the dataset name is “5IPP”, which stands for “5 Inhalers with Pick Points”, and it has 6 classes: “basic”, “Handi”, “Respi”, “Zonda”, “fluti”, and “pkPnt”.
On the same Nvidia Jetson Nano, we trained an SSD-MobileNet on 5IPP and pre-trained on COCO. We trained the model for 100 epochs with batch size of 2 and the SGD optimizer with learning rate of 0.01, momentum of 0.9, weight decay of , and gamma of 0.1. We used 100% of the samples for training (i.e., no validation and test sets) since the performance we are interested on is not on a test set, but rather on live inhaler detection and tracking as needed for waste sorting.
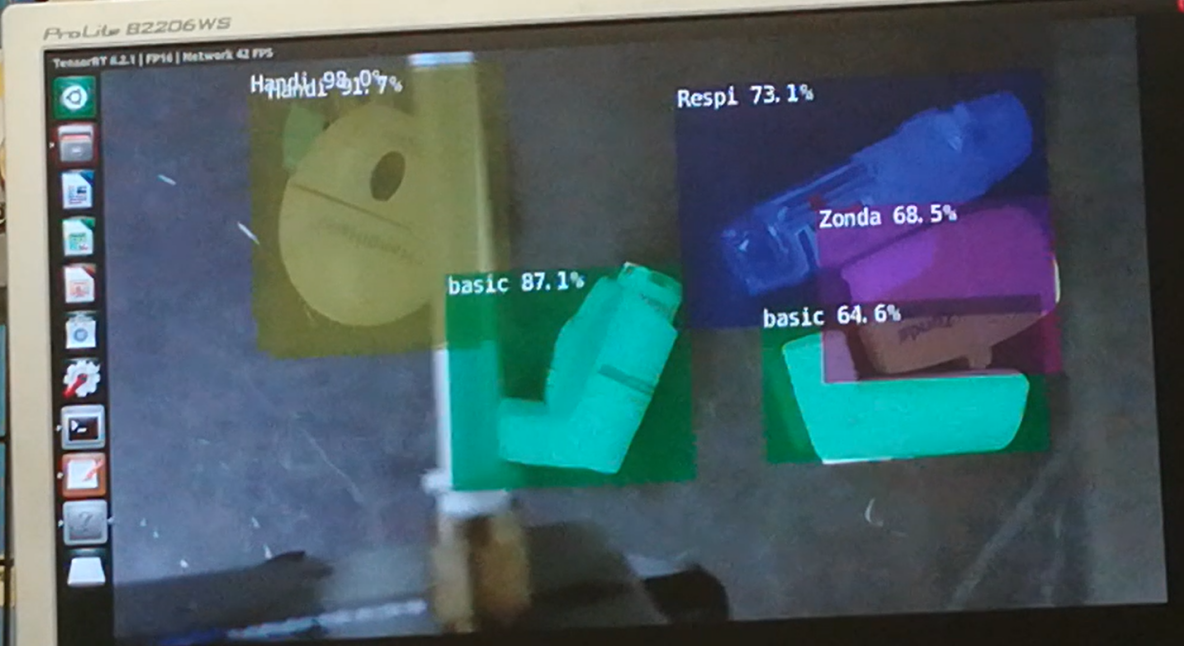
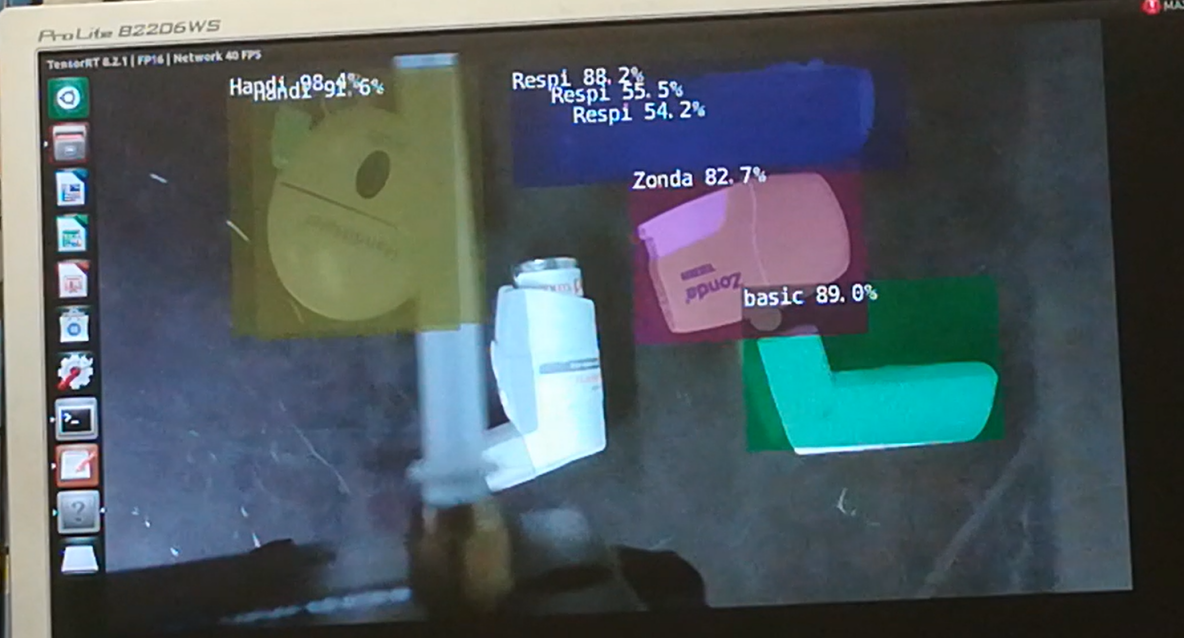
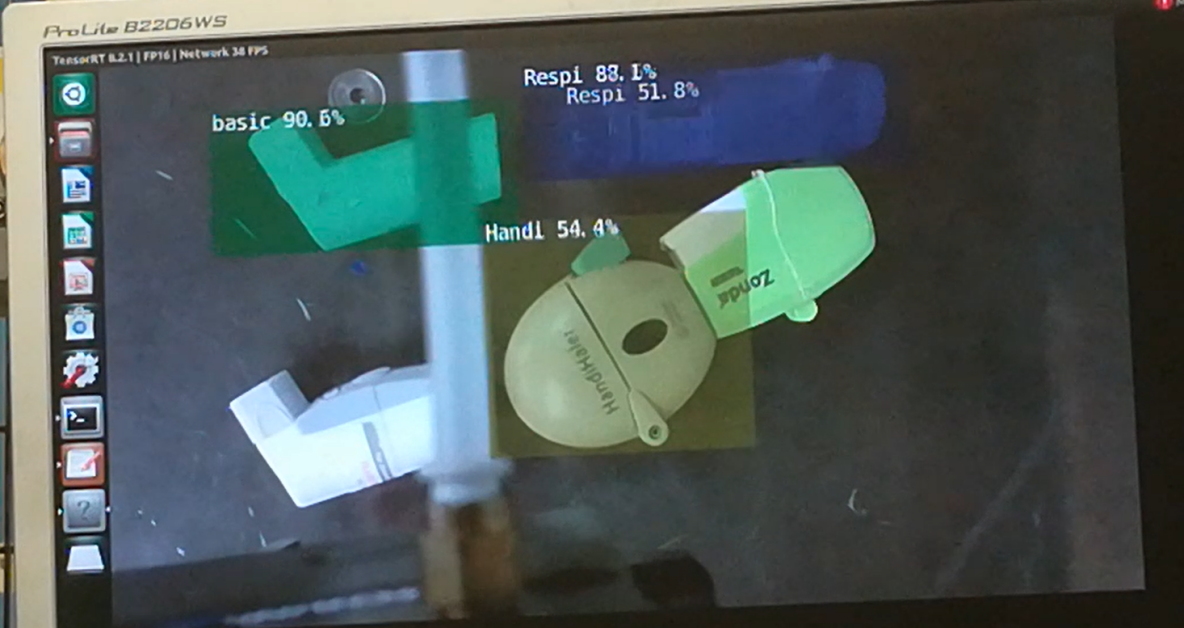
A qualitative performance evaluation is visible from the demo video11footnotemark: 1. Figures 3(e)–3(h) are frames of the demo video and they are in chronological order. Fig. 3(e) shows the detection with a random initial configuration of all the inhalers. The percentage next to the class is the detection confidence. Note that the system works even if the training samples depicted either one or two objects only. The accuracy, however, is not perfect: there is a double detection of HandiHaler, the flutiform model is classified as basic, and the pick points are missing. A longer training ( 100 epochs) could further increase the overall accuracy and mitigate these misdetections. Fig. 3(f) shows the detection after that the Respimat, flutiform, and Zonda models have been moved. The system still works although the detection of flutiform is lost, but it is recovered after it has been moved again (Fig. 3(g)). Finally, the HandiHaler and the basic models were swapped in Fig. 3(h) and the detector correctly tracked the change.
II-C Distributed Detection
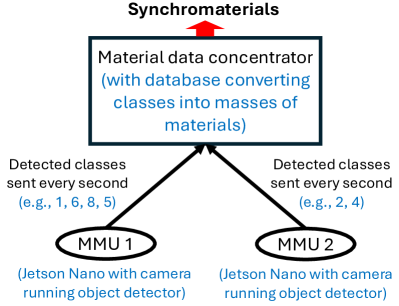
For automatically mapping and quantifying materials across (1), we placed an MMU in each vertex-compartment, i.e., in and (Fig. 2). Each MMU consists of an Nvidia Jetson Nano microprocessor running the detector covered in Section II-B and connected to a Logitech C270 webcam. The two GPS modules, tested but not yet integrated into the whole system, are the model NEO-6M-0-001 with SMA connector, which can be connected to a Nano serial port via a CP2102-USB-to-TTL-UART serial converter module.
The frames captured by each webcam are processed by one neural detector with a speed of approximately 40 FPS. Every second, each unit sends the detected classes to the material data concentrator (Fig. 4), which is a laptop in this prototype (note the analogy with the phasor data concentrator [9]).
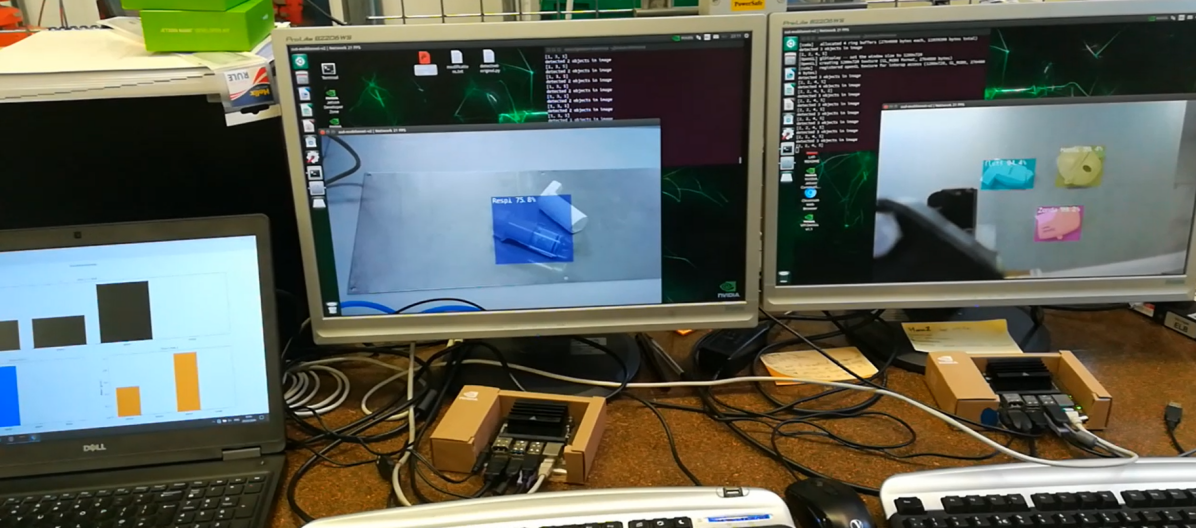
The communication between the units and the data concentrator is via Ethernet cables. Specifically, the laptop and the two Jetson Nano microprocessors are connected through a network switch, model Netgear FS105 with 5 ports. The timing of each unit is given by the Nano internal clock. Since the masses of materials are computed using detections synchronized in time fired by the units (sent every second), we refer to these masses as synchromaterials (note the analogy with the synchrophasors [9]).
Definition 1 (Synchromaterial).
Mass of a material automatically detected at different locations and computed using material attributes transmitted in a synchronized fashion.
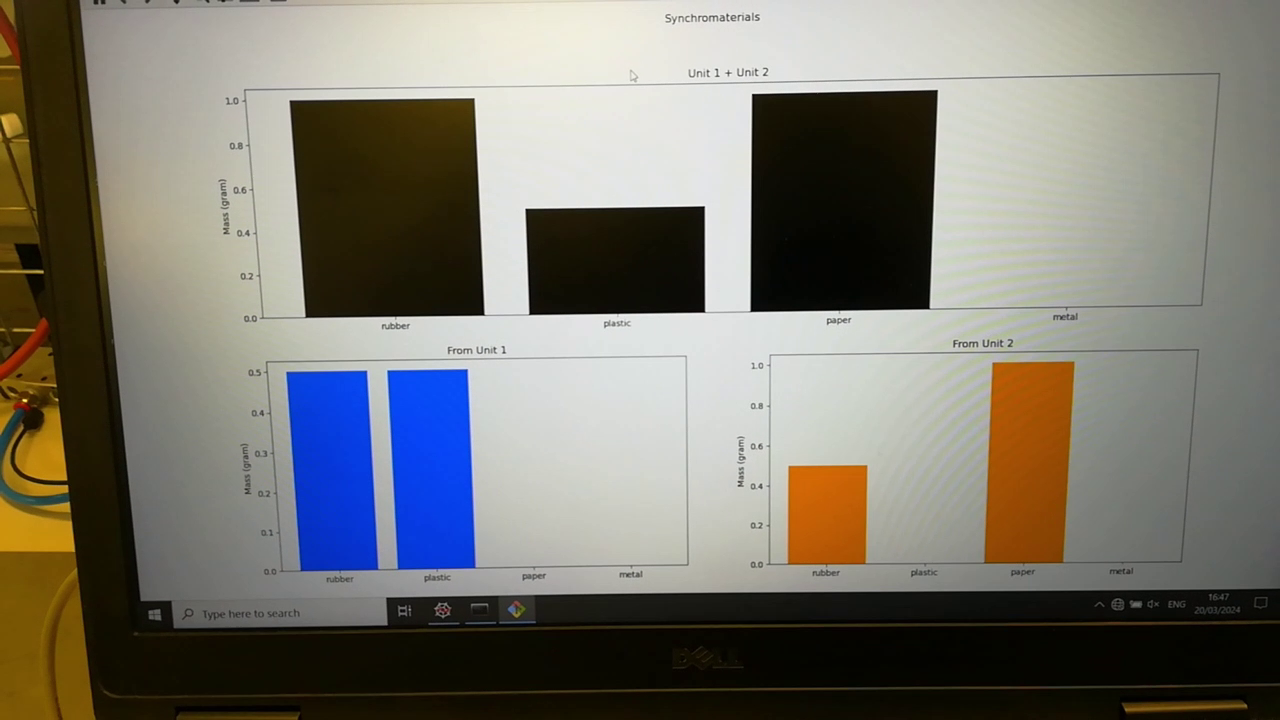
The synchromaterials are displayed in bar charts to facilitate the reading to the material flow engineer or manager as in Fig. 5. A demo video is available11footnotemark: 1. The current system works with only one instance per object class, e.g., by considering only one Zonda inhaler even when two are detected. The current list of materials is merely to show the working principle of the system as visible in Fig. 1, where the -axis labels are “rubber”, “plastic”, “paper”, and “metal”: there is no paper in these inhalers. Note also in Fig. 1 that the chart at the top (with bars in black) is the sum of the masses from Unit 1 and Unit 2 (bars at the bottom in blue and orange, respectively). The GPS module can provide the location of the unit it is connected to, and hence, the location of the detected materials.
III CONCLUSION
This paper presented the use of real-time synchronized object detection for automating sorting, mapping, and quantification of materials. Different types of inhalers were considered as the case study. The working principle is detailed to show the applicability and scalability of the system. It can work for wide-area materials monitoring as it is currently done with PMUs in electrical networks.
This work is a first step towards autonomous materials monitoring systems. A large-scale computational infrastructure based on MMUs could facilitate the implementation of a circular economy by improving decision making about material resources management.
For sorting, future work could be to improve the detector accuracy and, if the pick points are still missed, replace it with another one more accurate. For autonomous mapping and quantification, future work could be to synchronize the MMUs using a common clock such as the PPS signal, enable the system to work with multiple instances per class, and compile a more precise list of materials for each object class in the material data concentrator.
ACKNOWLEDGMENT
The authors gratefully thank the ReMed Team (https://www.remed.uk/team) for the valuable discussions.
References
- [1] UK Government, “UK statistics on waste,” 2023, webpage: https://www.gov.uk/government/statistics/uk-waste-data/uk-statistics-on-waste; last access: 26 April 2024.
- [2] Eurostat, “Waste statistics,” 2023, webpage: https://ec.europa.eu/eurostat/statistics-explained/index.php?title=Waste_statistics; last access: 26 April 2024.
- [3] British Geological Survey, “Critical raw materials,” webpage: https://www2.bgs.ac.uk/mineralsuk/statistics/criticalRawMaterials.html; last access: 26 April 2024.
- [4] European Commission, “Critical raw materials,” 2023, webpage: https://single-market-economy.ec.europa.eu/sectors/raw-materials/areas-specific-interest/critical-raw-materials_en; last access: 26 April 2024.
- [5] Ellen MacArthur Foundation, “What is a circular economy?” webpage: https://www.ellenmacarthurfoundation.org/topics/circular-economy-introduction/overview; last access: 26 April 2024.
- [6] F. Zocco, P. Sopasakis, B. Smyth, and W. M. Haddad, “Thermodynamical material networks for modeling, planning, and control of circular material flows,” International Journal of Sustainable Engineering, vol. 16, no. 1, pp. 1–14, 2023.
- [7] W. M. Haddad, A dynamical systems theory of thermodynamics. Princeton University Press, 2019.
- [8] F. Zocco, B. Smyth, and P. Sopasakis, “Circularity of thermodynamical material networks: Indicators, examples, and algorithms,” arXiv preprint arXiv:2209.15051, 2022.
- [9] D. Dwivedi, P. K. Yemula, and M. Pal, “DynamoPMU: A physics informed anomaly detection, clustering and prediction method using non-linear dynamics on PMU measurements,” IEEE Transactions on Instrumentation and Measurement, 2023.
- [10] G. Liu, X. Li, C. Wang, Z. Chen, R. Chen, and R. C. Qiu, “Hessian locally linear embedding of PMU data for efficient fault detection in power systems,” IEEE Transactions on Instrumentation and Measurement, vol. 71, pp. 1–4, 2022.
- [11] Y. Bansal and R. Sodhi, “A half-cycle fast discrete orthonormal s-transform-based protection-class PMU,” IEEE Transactions on Instrumentation and Measurement, vol. 69, no. 9, pp. 6934–6945, 2020.
- [12] A. Falahati, M. Shamirzaee, and B. Alizadeh, “An FPGA-based hardware architecture for P+M class PMU using accuracy-aware o-spline filter selection and modulation detection,” IEEE Transactions on Instrumentation and Measurement, 2024.
- [13] V. N. Giotopoulos and G. N. Korres, “A laboratory PMU based on third order generalized integrator phase-locked loop,” IEEE Transactions on Instrumentation and Measurement, 2024.
- [14] Z.-Q. Zhao, P. Zheng, S.-t. Xu, and X. Wu, “Object detection with deep learning: A review,” IEEE Transactions on Neural Networks and Learning Systems, vol. 30, no. 11, pp. 3212–3232, 2019.
- [15] Z. Zou, K. Chen, Z. Shi, Y. Guo, and J. Ye, “Object detection in 20 years: A survey,” Proceedings of the IEEE, vol. 111, no. 3, pp. 257–276, 2023.
- [16] F. Zocco, D. Sleath, and S. Rahimifard, “Towards a thermodynamical deep-learning-vision-based flexible robotic cell for circular healthcare,” arXiv preprint arXiv:2402.05551, 2024.
- [17] R. Galliera and N. Suri, “Object detection at the edge: Off-the-shelf deep learning capable devices and accelerators,” Procedia Computer Science, vol. 205, pp. 239–248, 2022.
- [18] F. Zocco, S. McLoone, and B. Smyth, “Material measurement units for a circular economy: Foundations through a review,” Sustainable Production and Consumption, vol. 32, pp. 833–850, 2022.
- [19] K. G. Khajeh, E. Bashar, A. M. Rad, and G. B. Gharehpetian, “Integrated model considering effects of zero injection buses and conventional measurements on optimal PMU placement,” IEEE Transactions on Smart Grid, vol. 8, no. 2, pp. 1006–1013, 2015.
- [20] Nvidia Developer, “Jetson AI fundamentals – S3E5 – Training object detection models,” 2021, available at: https://www.youtube.com/watch?v=2XMkPW_sIGg; last access: 17 April 2024.