Evidence for a cyclotron absorption line and spectral transition in EXO 2030+375 during 2021 giant outburst
Abstract
Based on Insight-HXMT observations of EXO 2030+375 during its 2021 giant outburst, we report the analysis of pulse variations and the broadband X-ray spectrum, and find the presence of a potential cyclotron resonant scattering feature (CRSF) with the fundamental line at keV from both average spectra and phase-resolved spectroscopy. During the outburst, the source reached an X-ray luminosity of erg cm-2 s-1 from 2 – 105 keV at a distance of 7.1 kpc. The X-ray pulsar at the spin period of seconds exhibits complex timing and spectral variations with both energy and luminosity during the outburst. The shapes of the pulses profiles show the single main peak above keV, while appear to exhibit multi-peak patterns in low energy bands, and the transition of the 10 – 20 keV pulse profiles from multi-peak to single-peak is observed at erg cm-2 s-1, which suggests the evolution from the subcritical luminosity (pencil-beam dominated) to supercritical luminosity (fan-beam dominated) regimes. A dip structure before the energy of the cyclotron resonant scattering features is found in the pulse fraction–energy relation near the peak luminosity. A detailed analysis of spectral parameters showed that the power-law photon index exhibits three distinct trends as luminosity increases, and these changes also signify a spectral transition from sub-critical to super-critical regimes. The critical luminosity infers the magnetic field of G, which supports the presence of the cyclotron line at 47 keV. A Comptonization model applied for the broad X-ray spectra during the outburst also suggests the surface magnetic field ranging from G.
1 Introduction
Neutron-star X-ray binaries appear as the brightest objects in the X-ray sky. X-ray binaries can be classified as high-mass X-ray binaries (HMXBs) or low-mass X-ray binaries (LMXBs) according to the donor star masses. Based on the spectral type of the donor star, the neutron star HMXBs are also classified as either supergiant X-ray binaries or Be/X-ray binaries (Fornasini et al., 2023). A majority of the HMXB systems are known to be Be/X-ray binaries (BeXBs) in which young optical companions are spectral type O or B (Caballero & Wilms, 2012). An amount of emission in the infrared band is also observed from these companion stars. The observed emission lines and infrared excess are attributed to the presence of an equatorial disc around the Be star, which is formed by the rapid rotation of the Be star expelling material (Porter & Rivinius, 2003). The outburst activity of transient BeXBs is usually divided into two types according to the X-ray variability in terms of duration and luminosity. Type I X-ray outbursts exhibit regular and periodic (or quasi-periodic) behaviour, occurring close to the periastron passage of the neutron star (Stella et al., 1986). Type II X-ray bursts are major events that represent a significant increase of times of the X-ray flux compared to the quiescence and are normally known to last for several weeks to months (Okazaki & Negueruela, 2001). These outbursts are possibly caused by the enhanced episodic outflow of the Be Star (Paul & Naik, 2011).
The high-energy radiation associated with the rotation of the neutron star is produced as a result of the gradual accumulation of matter from a donor star heating the polar cap of the neutron star. At low luminosity, radiation is produced by hot spots or mounds on the polar cap and predominantly escapes along magnetic field lines, resulting in the so-called “pencil beam” (Burnard et al., 1991; Nelson et al., 1993). At high luminosity, radiation pressure is sufficient to effectively decelerate the accreted plasma, forming a radiatively dominated shock above the polar cap and an extended emission region known as the accretion column. In this case, the radiation mainly escapes through the column walls, forming a “fan beam” (Basko & Sunyaev, 1976; Wang & Welter, 1981).
The pulse profile of some sources exhibits a complex evolution with energy and luminosity, in particular around the expected critical luminosity, which may be related to the change in emission patterns (Wang et al., 2022; Ji et al., 2020). Pulse profiles are also observed to change near the cyclotron frequency in some sources (e.g. V0332+53, 4U 0115+63, 1A 0535+262) Lutovinov & Tsygankov 2009). The pulse fraction, a measure of the pulsation amplitude depending on the energy band, has been analyzed in X-ray pulsars. The pulse fraction of some sources is known to exhibit a complex evolution with energy (Tsygankov et al., 2010). The characteristics of the accreting plasma may undergo abrupt changes around the cyclotron frequency, leading to alterations in the observable emitted beam pattern (Lutovinov & Tsygankov, 2009). The relationship between pulse fraction and energy, as dependent on luminosity, was observed in V0332+53 and 4U 0115+63 (Tsygankov et al., 2010, 2007). The CRSF-dependent structure in the pulse fraction–energy relationship of 1A 0535+262 is the first source for which dependence is observed within a limited luminosity range between and (Wang et al., 2022).
Be/X-ray binary pulsar EXO 2030+375 was discovered by observatory during a giant X-ray outburst (type II outburst Parmar et al. 1989). In this system, the pulsar with a spin period of 42 s (Fu et al., 2023) orbits a B0 Ve star (Janot-Pacheco et al., 1988) along with an orbital modulation of 46 days (Wilson et al., 2005). The system was located at a distance of 7.1 kpc measured by optical and infrared observations (Motch & Janot-Pacheco, 1987; Coe et al., 1988), but the latest measured distance is kpc by Gaia (Arnason et al., 2021). Type I outbursts have been nearly detected at every periastron passage of its approximately 46 days orbit period. (Wilson et al., 2008). In June 2006, EXO 2030+375 was observed to experience the second giant outburst since its discovery with source flux peaking up to 750 mCrab from the INTEGRAL observatory (Klochkov et al., 2008). In 2021, the third giant outburst with peak flux up to 550 mCrab has been monitored with the X-ray instruments onboard MAXI/GSC, NICER, Fermi/GBM, Swift/BAT, NuSTAR, Insight-HXMT and IXPE observatories (Nakajima et al., 2021; Thalhammer et al., 2021; Tamang et al., 2022; Fu et al., 2023; Malacaria et al., 2023). Fu et al. (2023) showed the pulse profile evolution during the outburst based on Insight-HXMT data. IXPE observations suggest a low polarization degree and the magnetic axis of EXO 2030+375 swings close to the observer’s line of sight (Malacaria et al., 2023).
The study of pulsars’ energy spectrum during outbursts provides a rather accurate method for the estimation of the physical properties of compact stars. Detection of cyclotron resonance scattering features (CRSFs) due to the photons being resonantly scattered by the electrons in the pulsar spectrum provides a direct way to estimate the surface magnetic field of neutron stars. The continuum spectrum in EXO 2030+375 was fitted by an acceptable continuum of the power law along with thermal blackbody component at 1.1 keV during the 1985 giant outburst (Sun et al., 1994). The majority of data of later observations were fitted by an absorbed power-law modified with a high energy cutoff model (Wilson et al., 2008). Okazaki & Negueruela (2001) find that NPEX also provided a statistically acceptable fit to the data. On using the continuum model cutoffpl, Tamang et al. (2022) also successfully fit the spectrum. Several authors discovered possible evidence for an absorption feature near 10 keV (Wilson & Finger, 2006; Klochkov et al., 2007; Wilson et al., 2008). Reig & Coe (1999) reports that a possible spectral absorption feature at 36 keV is tentatively attributed to a cyclotron absorption line. Klochkov et al. (2008) suggested that the absorption line at 63 which appeared in the spectrum obtained close to the maximum of the 2006 outburst might be the first harmonic line. Thus, there has not solid evidence of CRSFs in EXO 2030+375 until now.
In this paper, we report the detailed results of the timing and spectral analysis of the broadband spectrum (2–105 ) of the X-ray pulsar EXO 2030+375 during the 2021 giant outburst observed with the Insight-HXMT. In Section 2, we present the observations and the data extraction. Timing analysis and pulse profiles are presented in section 3. The X-ray spectral analysis, including phase-averaged spectrum and phase-resolved spectroscopy, are presented in section 4, and we report the discovery of the cyclotron resonance scattering feature in EXO 2030+375. Broad continuum spectral fitting with a Comptonization model is presented in section 5. The conclusion and a brief discussion are summarized in Section 6.
2 OBSERVATIONS
Insight-HXMT is the first X-ray astronomical satellite in China, launched on 2017 June 15. Insight-HXMT consists of three main instruments: the High Energy X-ray telescope (HE) operating in 20–250 and the areas of the telescopes are 5100 cm2 (Liu et al., 2020), the Medium Energy X-ray telescope (ME) operating in 5–30 with a detection area of 952 cm2 (Cao et al., 2020) and the Low Energy X-ray telescope (LE) covering the energy range 1–15 with a detection area of 384 cm2 (Chen et al., 2020).
| Observatory | Year of Observations | Proposal ID | No. of Obs | On Source time ( ) |
|---|---|---|---|---|
| Insight-HXMT | 2021 Jul – 2021 Nov | P0304030 | 65 | 2292 |
| P0404147 | 1 | 172.5 |
EXO 2030+375 was observed during the Type-II outburst from July 28, 2021 to November 21, 2021. We have used 66 observations from Insight-HXMT with a total exposure time of 2464.5 ksec. The specifications related to the Insight-HXMT observations under consideration are presented in Table 1. The Insight-HXMT Data Analysis Software (HXMTDAS) v2.04 is used to analyze data (more details on the analysis were introduced in previous publications, e.g., Wang et al. 2021; Chen et al. 2021). In order to take advantage of the best-screened event file to generate the high-level products including the energy spectra, response file, light curves and background files, we use tasks to remove spike events caused by electronic systems and be utilized to select good time interval (GTI) when the pointing offset angle ; the pointing direction above earth ; the geomagnetic cut-off rigidity GeV and the South Atlantic Anomaly (SAA) did not occur within 300 seconds. We also utilize the FTOOL to improve the counting statistic of the spectrum.
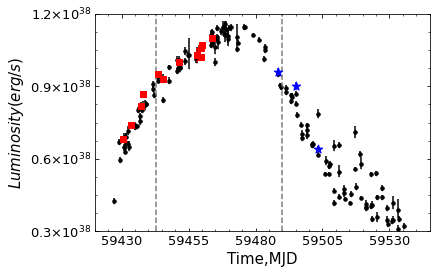
In Figure 1, the X-ray light curves of EXO 2030+375 which present the Type II outburst lasting about four months monitored by Insight-HXMT are shown, and the pointing observations cover the entire outburst from half of the peak luminosity in ascending interval to about a quarter of the peak luminosity in the decrease phase. Thus, the good spectral analysis ability of the Insight-HXMT and high-quality data during outburst allowed us to study the spectral variations of EXO 2030+375 and search for the possible cyclotron absorption features.
3 TIMING ANALYSIS
Based on high-cadence observations and high-quality data of EXO 2030+375 during its giant outburst in 2021, at first, we use HXMTDAS task to change the photon arrival time from TT (Terrestrial Time) to TDB (Barycentric Dynamic Time) which considers the time delay due to the movement of the earth and satellite. The epoch-folding FTOOL helps us to estimate the pulse period of sec for the example observation ObsID P030403002703 (MJD 59463). The range of errors is estimated by folding the light curve with a large number of periods around the approximate period by maximization. The uncertainties of the spin period are estimated using a Gaussian error. Using the obtained pulse period, we generated the light curves of each Insight-HXMT observation by folding the background-subtracted light curves with a phase bin of 64.
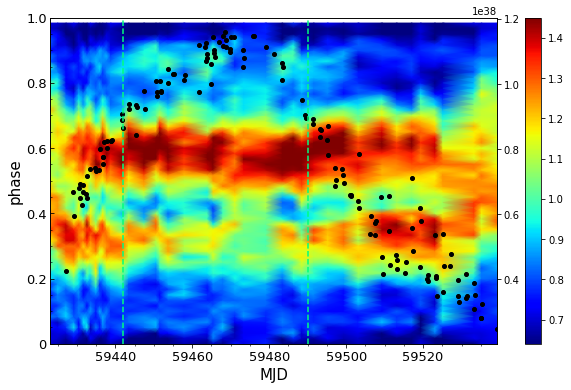
The pulse profiles during the outburst evolution for the Insight-HXMT ME detectors from 10–20 are presented in Figure 2. Pulse profiles show abrupt changes from double peaks to a single peak around MJD 59442. The structure of peak 1 (0.35 phase) disappears and the intensity of peak 2 (0.6 phase) gradually improves. The pulse profile switches between single and double peaks around MJD 59490, corresponding to a luminosity of (assuming the distance of 7.1 kpc in this work). This luminosity also corresponds to the location of pulse profile transitions around MJD 59442. This phenomenon is consistent with investigations of this source (Fu et al., 2023). The transition between the double peak and the single peak reveals the transition from the subcritical to supercritical accretion regime, corresponding luminosity can be interpreted in the context of the critical luminosity (Becker et al., 2012).
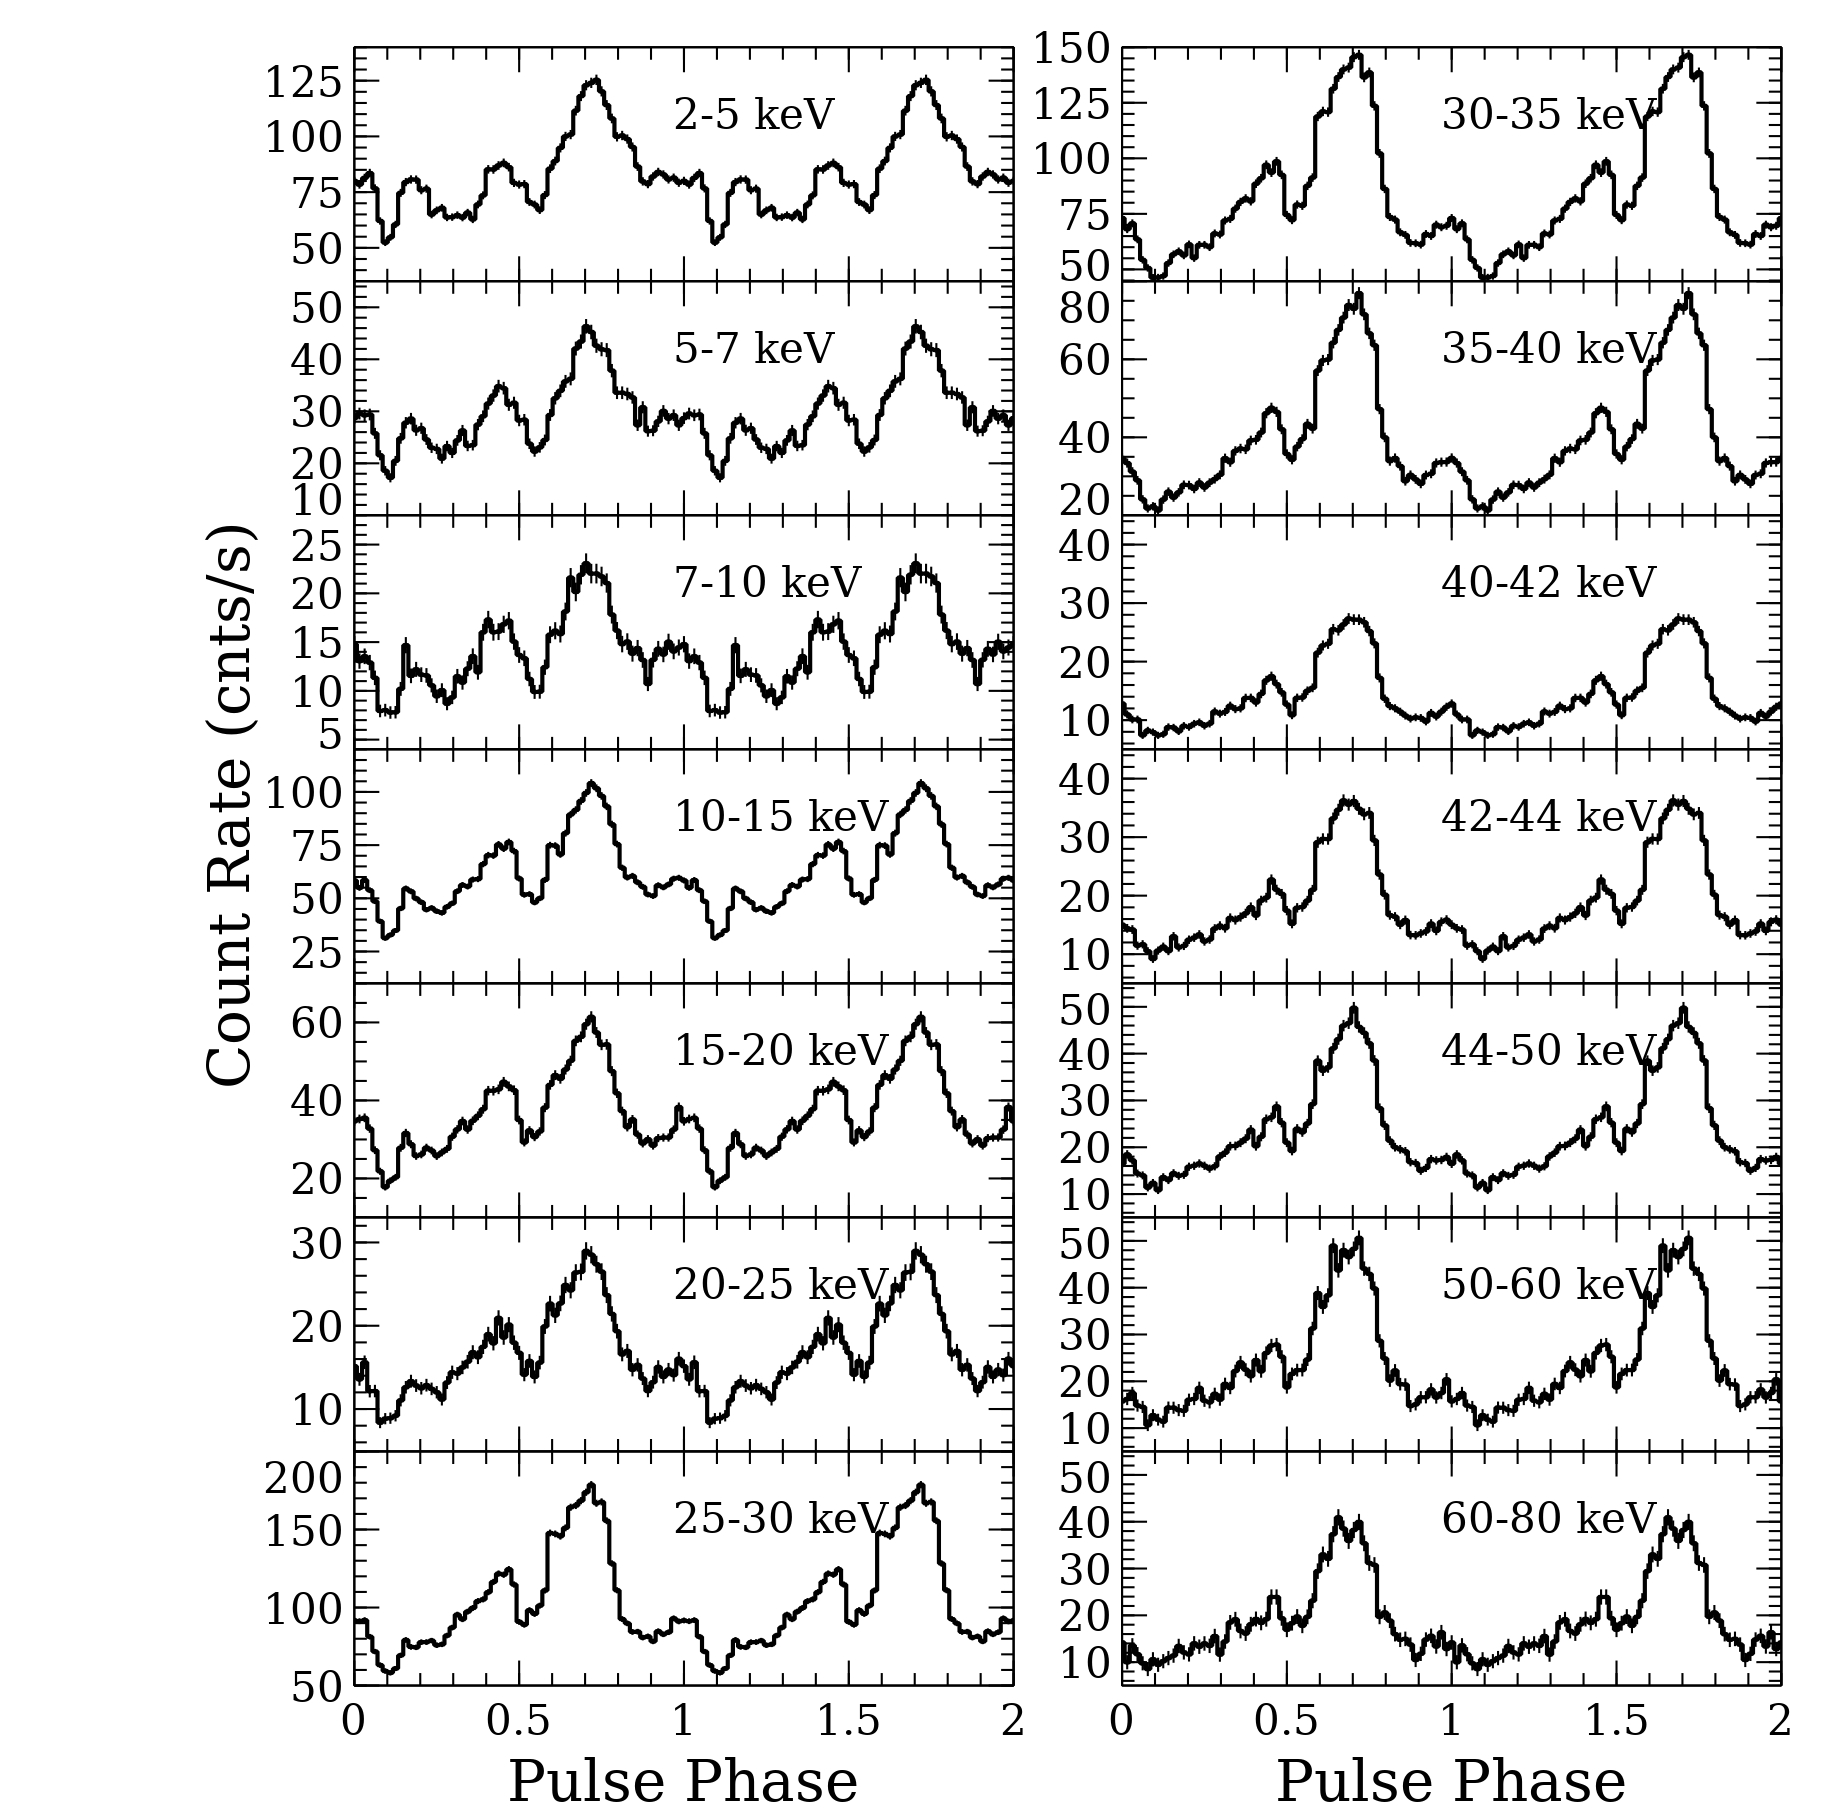
The pulse profiles of the accretion pulsar with energies are also studied. The entire Insight-HXMT energy band was resolved into various sub-intervals as: 2–5 , 5–7 , 7–10 , 10–15 , 15–20 , 20–25 , 25–30 , 30–35 , 35–40 , 40–42 , 42–44 , 44–50 , 50–60 and 60–80 . Corresponding to each interval, the energy-resolved pulse profiles were generated in order to analyze the dependence of the shape with energy.
The pulse profiles strongly depend on energy as the example presented in Fig. 3. The shapes of the pulses below 20 keV appear to exhibit clearer indications of multi-peak patterns compared to those above 20 , which is observed for the majority of bright XRPs (Shaw et al., 2009). At the few to about 10 keV energy range, the pulse profile shows two distinct peaks: the main peak and the secondary peak at phases 0.4 and 0.7 respectively, and at about 0.2 phase and 0.95 phase, there are two weak peaks in the pulse profile. A secondary peak, approximately of the intensity of the primary peak, is especially notable between 2–30 . Above 30 keV, the pulse profile still shows signs of double peaks with a secondary peak intensity decreasing with the energy, and above 60 keV, the pulse profile evolves from double peaks to a single peak. Klochkov et al. (2008) analyzed the giant outburst data of EXO 2030+375 that was observed by JEM-X and IBIS/ISGRI in June–September 2006, and the evolution of the pulse profiles with energy is consistent with our result.
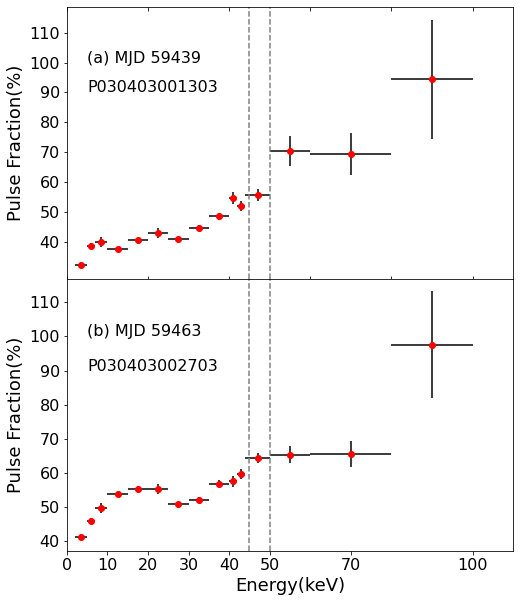
We use the rms pulse fraction to characterize the observed changes in the pulse profile. The rms pulse fraction is determined as , where and are fluxes in the maximum and minimum of the pulse profile, respectively. The error range is estimated by the propagation of uncertainties. We present the results of rms pulse fraction with energy in Figure 4. At MJD 59463 when the luminosity is high (around ), the rms pulse fractions show a gradually rising trend below 20 . Between 20 and 30 , the rms pulse fraction shows a decreasing trend. Above 30 , the rms pulse fractions gradually rise as expected for accreting pulsars. As the luminosity decreases (e.g., at MJD 59439), the rms pulse fraction energy dependence again simplifies, with the rms pulse fraction rising gradually with energy between 1.0 and 100.0 , similar to that generally observed in accreting pulsar systems. Based on the assumption that high-energy photons are emitted from regions close to the neutron star surface, while soft photons are formed in the upper part of the column, the contrast between the minimum and maximum visible surfaces of the accretion columns is the highest at higher energies and exhibits a sharp decrease around cyclotron line energy Lutovinov & Tsygankov 2009. The results obtained are also similar to those obtained by other authors (see, e.g., Klochkov et al. 2008).
4 Spectral studies
4.1 Phase-averaged spectrum
We analyzed phase-averaged spectra of EXO 2030+375 by using data from Insight-HXMT observations to probe spectral characteristics corresponding to change with luminosity and whether the cyclotron line features are presented in the pulsar spectrum. The spectral models that have been generally used to represent the X-ray spectra of accreting X-ray pulsars are usually composed of a power-law continuum with low-energy absorption and a cut-off at energies about 12–20 . The spectrum of EXO 2030+375 is typical for accreting XRPs (Klochkov et al., 2008). Several authors mentioned that a typical spectrum usually consists of a cutoff power-law component with cutoff energies around 20–30 , and the soft X-ray component could be fitted by a blackbody-like spectrum with temperature (Sun et al., 1994). Naik et al. (2013) described the source spectrum by a two-component continuum model consisting of a blackbody component with temperature 1.1 keV and power law with an exponential cutoff.
Thus we successfully used power-law with a highecut model to fit the source spectra, despite this model leads to a line-like feature in the spectral around the (Burderi et al., 2000). The function of the model is shown below:
| (1) |
where represents the high energy cutoff power-law model, is the photon energy and is the normalization factor, is the photon index of the power law, and is exponential folding energy and cutoff energy in units of keV respectively. The other form of the continuum model represents a power law with high energy exponential roll-off (cutoffpl model)
| (2) |
where is the power law photon index, E is the photon energy and K is the normalization factor. E-folding energy of exponential rolloff (in ) is described by .
We also modeled the data using a global absorption column tbabs model proposed by Wilms et al. (2000) to describe the absorption of X-rays below 4 by gas and dust composed mainly of hydrogen in the Galaxy. There also exists an iron fluorescence emission line with an equivalent width of 200 eV at 6.4 , we add a Gaussian function to fit the iron emission line.
Based on the observations of EXO 2030+375 during the brighter portion of the 2006 June outburst, several authors had reported a cyclotron feature near 10 (Wilson et al., 2008; Klochkov et al., 2007), they added a gaussian absorption at 10 into a power law/cutoff model and the cyclotron energy was 10.1(2) with a Gaussian width of 3.3(2) and a peak depth of 1.1(1). Recently, Tamang et al. (2022) used the continuum model combination: constant*phabs*(cutoffpl+Gaussian), and the spectrum showed highly significant negative residuals at about 10 , the value of gabs strength and is about 0.2 and 2 respectively. Ferrigno et al. (2016) mentioned that the source EXO 2030+375 shows some complex absorption features in its spectrum and cannot be modeled by a single continuum model. Therefore, we also modeled broadband continuum spectra of EXO 2030+375 with alternative spectral features to probe related negative residuals.
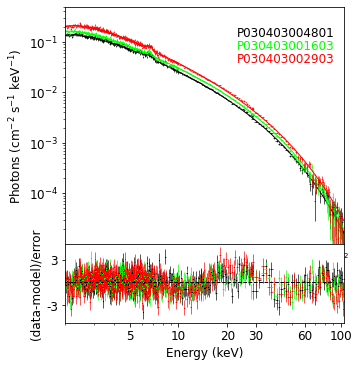
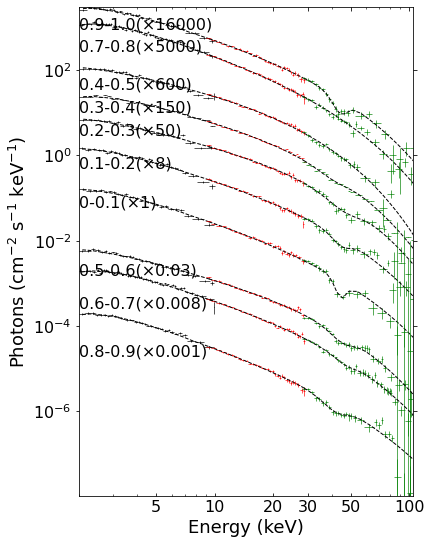
After fitting all the observations, we only explore the 10 absorption features in the spectra in seven observations around the peak of outburst with ObsIDs: P030403002401 (MJD:59454), P040414700104 (MJD:59459), P030403002703 (MJD:59463), P030403002903 (MJD:59465), P030403003002 (MJD:59466), P030403003201 (MJD:59468), P030403003801 (MJD:59479). The energy spectra with the simple model consisting of: tbabs*(cutoffpl+Gaussian) are shown in Figure 5, which shows the energy spectra from of the three examples together, and black, red, and green colors correspond to an unabsorbed luminosity of , , and in the 2–105 range, respectively. Negative residuals can be observed at around 10 in the residual plot only for one ObsID P030403002903 represented in red, indicating a corresponding high luminosity of . Such features were not detected during the decaying and rising phases of the outburst. Various combinations of models such as: high energy cutoff power-law, cutoffpl, along with blackbody were used to test the reliability of the reported dip in seven observations. When we add a blackbody component with 1 keV to the above continuum models, any signature of the broad absorption feature at 10 was not found in the residuals, and a reduced- close to 1 (see an example in Fig. 6). For EXO 2030+375, if we allowed for another free absorption line at near 10 , however, the fit ‘line’ was a broad feature near 6.9 . Thus, a possible cyclotron absorption line would be model-independent and should appear in spite of change in continuum model used to fit the spectrum. A broad absorption-like feature at 10 was detected in some accreting pulsars (e.g., 4U 1907+09, Her X-1, Manikantan et al. 2023). Epili et al. (2017) proposed that they used a high energy cutoff model along with a blackbody component to test the reliability of the reported line. The feature was also not detected in the pulsar spectra obtained from RXTE observations when the blackbody component was included (Epili et al., 2017). Therefore, we conclude that the pattern of 10 residuals is not a signature of the cyclotron resonance scattering feature obtained from all the observations during peak of outburst.
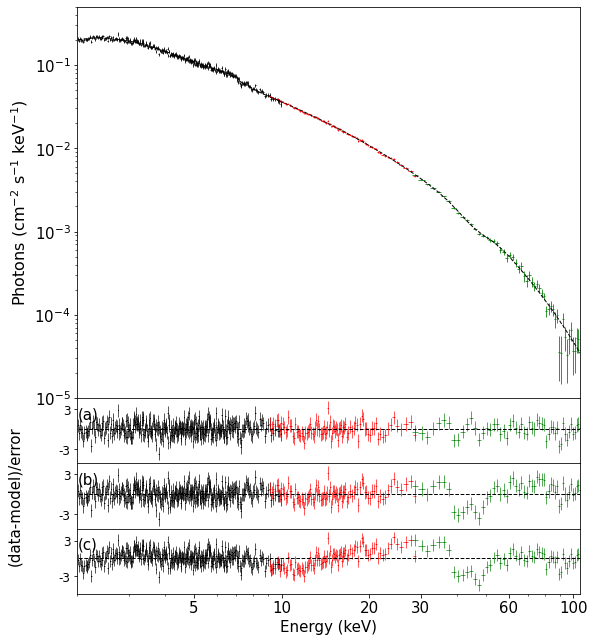
For the details of the spectral fitting for the observations with possible 10 keV features, the example spectrum and fitting procedures are shown in Fig. 6. The initially adopted model: “tbabs*( cutoffpl+ Gaussian)”, does not give a good fit for ObsID P030403002703, specially the absorption feature at 47 , negative residuals can be also observed at 10 as relevant from the bottom panel of Fig. 6 and value of 1441(1162). We then added a blackbody component to improve the fits, the 10 residuals disappear, the changed to 1219 (1160 d.o.f.). The absorption structure around 40–55 still be observed in the middle residual panel of Fig. 6. A possible explanation for those residuals at 47 is that there might be presence of cyclotron line which allowed us to add a CRSF component in the spectral model. In the case of the model: tbabs*(cutoffpl*gabs+Gaussian+bbody), the changed to 1129 (with 1157 d.o.f) with a F-test probability of for the fitting improvement. The low false alarm probabilities may make the detection of the line stable against even crude mistakes in the computation of the significance (Kreykenbohm, 2004). Therefore, we conclude that a statistically acceptable spectral fit can be obtained when a Gaussian absorption line is included in the spectral model. For other observations without 10 keV features, the fitting results by adding the blackbody component did not improve, then we did not consider adding the blackbody component for these observations without a 10 keV absorption feature.
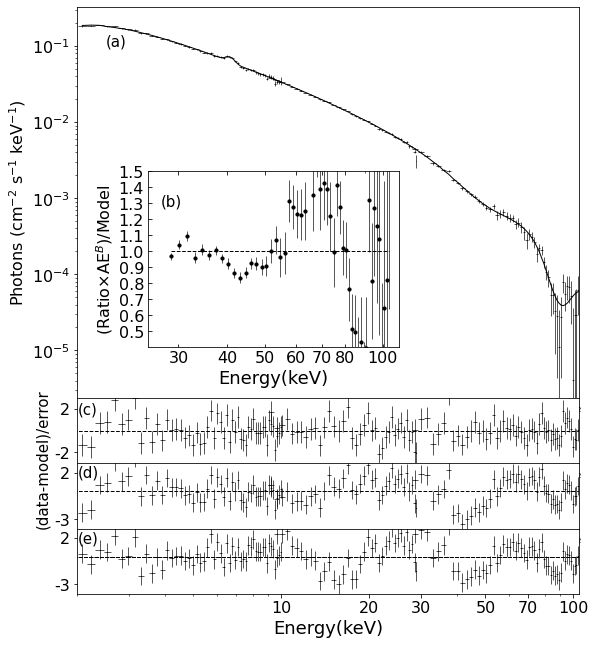
As noted in Fig.1, the part of observations show the absorption feature around 47 . During the peak region, the spectrum of one observation on Aug 24, 2021 (ObsID P030403002001), shows two possible absorption features, thus here we show detailed spectral fits for this representative observation in Fig. 7. Following Wilson et al. (2008), we first use a model combinations: tbabs*(powerlaw*highecut+Gaussian) to describe the energy spectrum of EXO 2030+375. After the continuum spectral fittings, there exist the significant negative residuals at and (see Fig. 7(e)). This model leads to a line-like feature in the spectrum around the (Burderi et al., 2000) and a poor fit with a reduced of 1.15. We used different model combinations: tbabs*(cutoffpl+ Gaussian) to fit the broadband spectrum of the source with the of 954 (861 d.o.f.), which still results in two absorption features: one absorption line at 45 and a weaker negative residual at 90 as observed from Fig. 7(d). We then added two additional absorption components (gabs) to improve the fits, the changed to 842 (855 d.o.f.). The spectrum of EXO 2030+375 along with the best-fitting model Fig. 7(a) and residuals Fig. 7(c) for Insight-HXMT observations are shown.
| Date | 2021-8-24 | |
|---|---|---|
| MJD | 59450 | |
| Model | Parameters | |
| tbabs | ||
| cutoffpl | ||
| gabs | ||
| ( ) | ||
| ( ) | ||
| gabs | ||
| ( ) | ||
| ( ) | ||
| Gaussian | ||
| Luminosity | ( ) | |
| Fitting |
In order to check the presence of two absorption-like features in the pulsar spectrum. We examined the ratio between the ObsID P030403002001 (MJD:59450) and Crab pulsar count rate spectra derived by HE detectors (see Fig. 7(b)). This ratio has the advantage of removing the presence of any uncertainties related to calibration. We used the data of Crab observed by the Insight-HXMT in September 2021 (MJD:59462), which is closest to the observation time of the ObsID P030403002001. This ratio exhibits a noticeable negative feature below 60 . Although the ratio showed an absorbed line at 90 , the spectrum above 60 has much poorer statistics, so the presence of this feature is unclear.
Therefore, the final model for the spectral fittings of all HXMT observations in EXO 2030+375 from keV can be summarized as
The best-fitted parameters obtained from spectral fitting based on Obs ID P030403002001 with optimal models (possible two absorption feartures) are presented in Table 2. In Table 3, the best-fitting parameters of all the other observations containing only the 47 absorption structure are presented together.
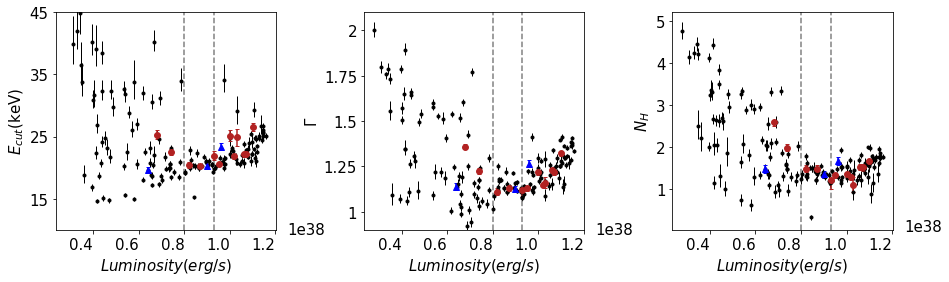
Spectral parameters such as photon index (), cutoff energy, additional column density (), obtained from a continuum and tbabs model fitting of all Insight-HXMT observations of EXO 2030+375 with corresponding luminosity are shown in Figure 8. All these parameters showed intriguing trends with luminosity, which has been explored earlier by Epili et al. (2017). In the figure, we can notice that the values of power-law photon index distribute in three distinct regions such as negative, constant, and positive correlations with source luminosity, suggesting a direct measure of spectral transition in EXO 2030+375. At lower luminosity, the pulsar spectrum was relatively soft. A negative correlation between the powerlaw photon index and luminosity can be clearly seen for this regime. The value of the photon index was found to vary between 1.2 and 2. When the luminosity was in the range of , the distribution of values of the photon index did not show any dependence on source luminosity. With an increase of source luminosity, the photon index showed a positive correlation with luminosity. In our spectral fitting, the column density () and cutoff energy () also show similar changes with luminosity.
4.2 Pulse phase-resolved spectroscopy
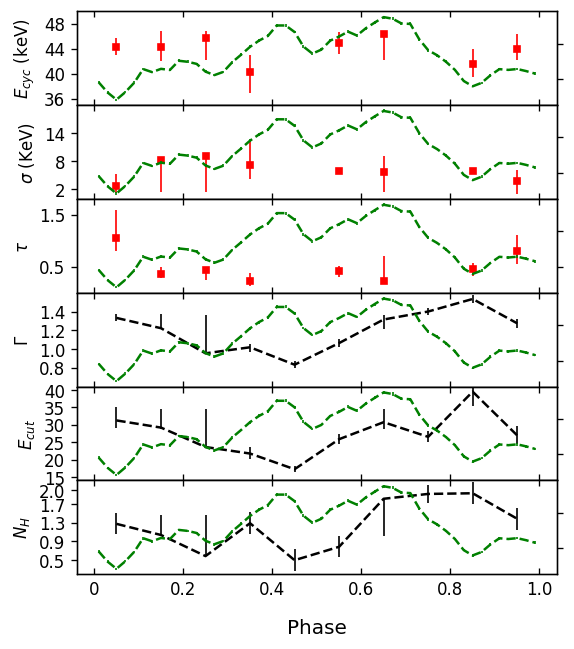
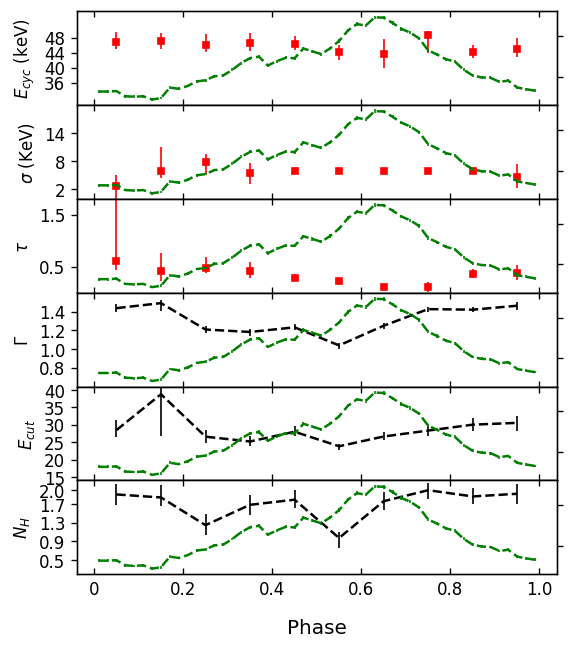
This is well established that the spectrum of an X-ray pulsar varies with the pulse phase, parameters of cyclotron line and continuum would change with pulse phases. In order to reveal the phase dependence of the spectral features, we divide the pulse period into ten pulse phases, determine the spectrum for each phase, thus fit the phase-resolved spectrum with the model tbabs*(cutoffpl)*gabs. An example of such variability for the ObsID P030403002001 with individual pulse phase is presented in Fig. 9. Variations in the best-fit parameter values of the cyclotron absorption line over the pulse phase including two ObsIDs P030403002001 and P030403002703 are also presented in Fig. 10. Here we focus on understanding whether the absorption features are detected at individual pulse phases in order to exclude the situation when the detection of the features in the averaged spectrum arises from the modeling of superimposed spectra variable across different pulse phases.
The spectrum of the several phase intervals show obvious absorption features between 40 and 50 . The inclusion of an absorption line at 47 improves the fit quality. After removing the gabs model from the overall model for ObsID P030403002001, the value of the changes from 731(742 d.o.f.) to 775(745 d.o.f.) at the of 0.9-1.0. For phases 0.2-0.3, from 691 (674 d.o.f.) to 731 (677 d.o.f.). In the phases 0.2-0.3 and 0.9-1.0, the inclusion of the gabs model yielded the F-test probability were and respectively. In Figure 10, the red points denote the line energy , line width and optical depth in the gabs model. For phases 0.5-0.6 and 0.8-0.9 of ObsID P030403002001, we fixed the width of the cyclotron line to be obtained from the average value of the other phases. Similarly, within the phases 0.4-0.9 for P030403002703, we maintained the width at 6 keV, which may be due to the low S/N caused by the insufficient statistics of the phase-resolved spectrum. The lack of a significant absorption feature for phases 0.4-0.5 and 0.7-0.8 of ObsID P030403002001 does not motivate us to add a CRSF. We also find that varies between to along the pulse phase in 0.4–0.7. From Figure 10, the , and also show significant phase-dependent structures. exhibits a distinct bimodal pattern, being smaller than 1.0 during the main pulse and exceeding 1.2 elsewhere. This suggests a harder spectrum during the main pulse. decreases from 35 to 20 when the phase changes from 0 to 0.5 and increases from 20 to 30 for phase 0.5-1.0. The neutral hydrogen column density components are also phase-dependent, the hydrogen column density decreases by within the phase 0-0.2, and it increases once again in the decay of the main peak.
| ObsID | ( ) | ( ) | ( ) | ( ) | ( ) | ( ) | ( ) | ( ) | (d.o.f.) | ||
|---|---|---|---|---|---|---|---|---|---|---|---|
| P030403000501 | - | ||||||||||
| P030403000801 | - | ||||||||||
| P030403001103 | - | ||||||||||
| P030403001203 | - | ||||||||||
| P030403001702 | - | ||||||||||
| P030403001803 | - | ||||||||||
| P030403002101 | - | ||||||||||
| P030403002503 | - | ||||||||||
| P040414700103 | - | ||||||||||
| P040414700104 | |||||||||||
| P040414700105 | - | ||||||||||
| P030403002703 | |||||||||||
| P030403004202 | - | — | — | ||||||||
| P030403004602 | - | ||||||||||
| P030403005001 | - |
5 Broad continuum spectral fit with a Comptonization Model
In order to explore the accretion column emission from the pulsar in EXO 2030+375, during its 2021 Type-II outburst, we have applied the Thermal & Bulk Comptonization model (BW model) proposed by Becker & Wolff (2007) to study the broad X-ray spectra from 2 – 105 keV. This model assumes that, the emergent radiation spectrum from the NS accretion column emission is a sum of bulk and thermal Comptonization of seed photons produced via bremmstrahlung, cyclotron and blackbody emission in the accretion plasma. The formation of blackbody seed photons is at the base of the column where the thermal mound is located. Whereas the seed photons of cyclotron and Bremmstrahlung emission are produced above the thermal mound in optically thin regions.
The BW model is implemented in Xspec as bwcycl whose application details are explained in Ferrigno et al. (2009). Assuming the canonical NS mass and radii as and , the BW model has left with six fundamental free parameters. These are namely: the mass accretion rate (), the electron temperature (), the radius of accretion column (), the magnetic field strength (), the Comptonization parameter () and the photon diffusion parameter(). The parameters and are defined as:
| (3) |
where denotes the proton mass, is the speed of light, and and represent the Compton -parameters for the bulk and thermal Comptonization processes describing the average fractional energy change experienced by a photon before it escapes through the column walls.
The X-ray luminosity is obtained from the observed source flux of EXO 2030+375 in the range of 1-100 . The source flux is estimated at first from the best fitted empirical high-energy cutoff power law model to the phase averaged spectra of EXO 2030+375 for each of the observation epochs as mentioned in Table LABEL:table4. We consider the distance to the source as 7.1 kpc and assume an isotropic accretion with unitary efficiency (i.e observed X-ray luminosity being equal to the accretion luminosity). The mass accretion rate, therefore can be constrained from the X-ray luminosity estimates as : . Its known that, is strongly degenerate with and the parameter . Therefore, as suggested in Ferrigno et al. (2009), we fix the value of after obtaining a good fit. A similar procedure has been carried out earlier by Epili et al. (2017). Except the model normalization, the other normalization components of the model due to blackbody, cyclotron and the Bremsstrahlung emission seed photon are kept fixed to the values as suggested for bwcycl model in Xspec . For the spectra obtained at the the peak of the outbursts (i.e observations between MJDs 59466–59486), a partial covering component (tbpcf) is needed along with the galactic absorption component (tbabs) to explain the heavily absorbed spectra. We have noticed from the spectral residual that, there is an additional emission component near seen in the spectra due to emission for neutral Fe . This has been modelled with a Gaussian component as has been done with while fitting the phase averaged spectra with the empirical models in section 4.1.
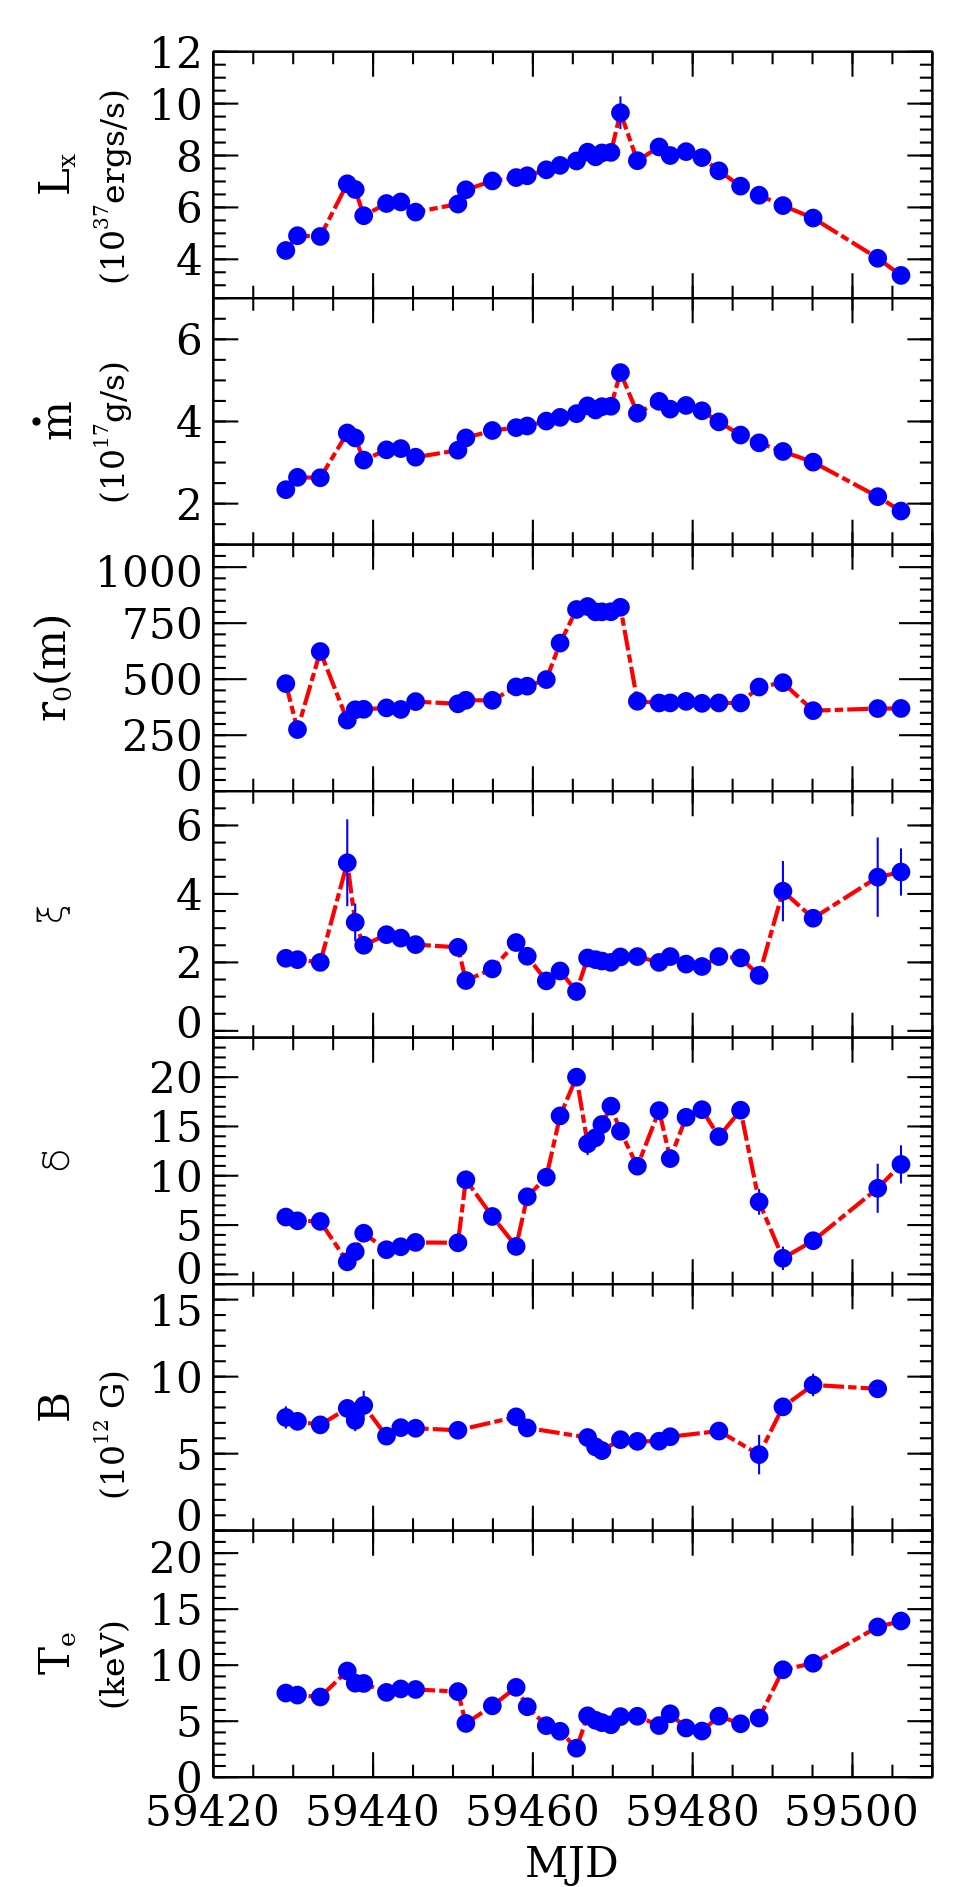
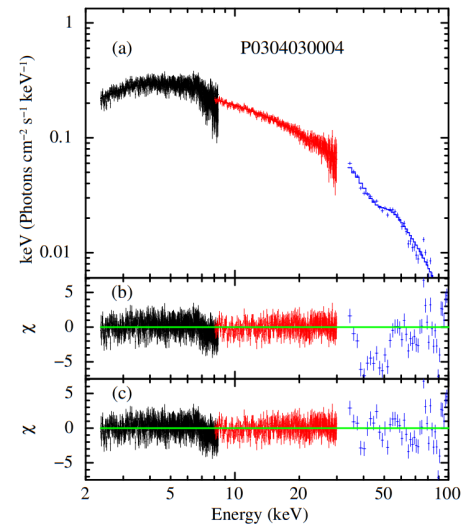
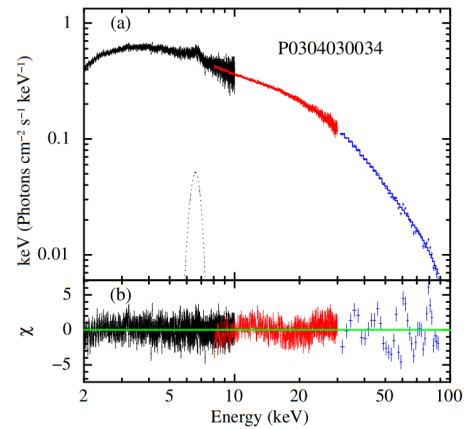
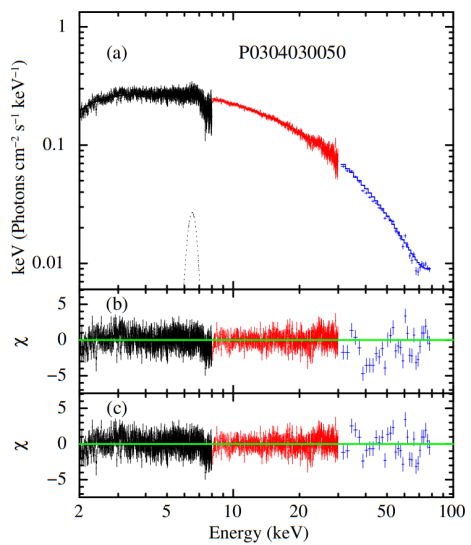
In hard X-rays, we have used an absorption component (gabs) between 40-55 to account for the cyclotron line absorption seen in the spectra of EXO 2030+375 from the Insight-HXMT observations. We have used the composite BW model along with the additional components to explain the spectra EXO 2030+375 at 34 luminosity epochs across its 2021 outburst observed with Insight-HXMT. The best fitted spectral parameters obtained BW model are shown in Table LABEL:table4. It can be seen from the reduced- values that, we could obtain a better fit of the phase-averaged spectra in wide luminosity range of EXO 2030+375. In Figure 11, we show a variation of these physical parameters as the source luminosity varies across the each observation during the giant outburst. The best-fitted phase averaged spectra with BW model at three different luminosity epochs are shown in Fig. 13.
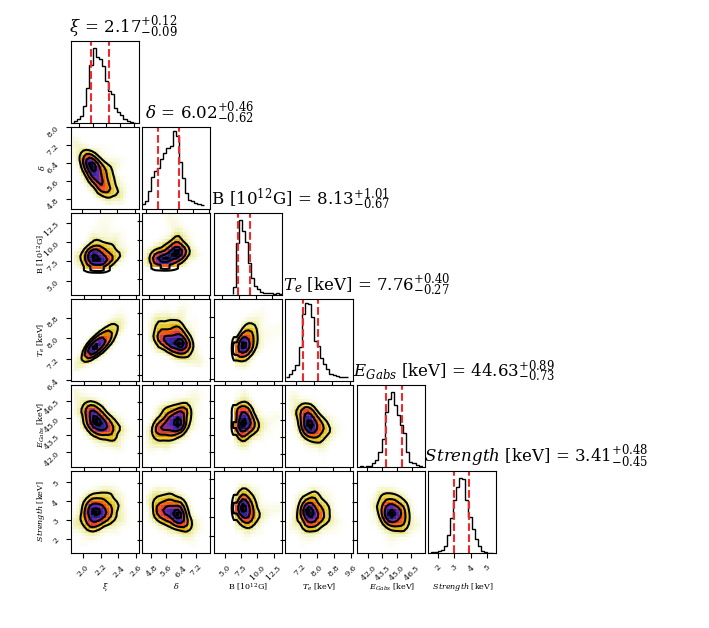
To check the parameter degeneracy of the best fitted BW model spectral parameters, we have run a Monte Carlo Markov Chain (MCMC) having chain length of 20000 with Goodman-Weare chain algorithm using 20 walkers for the Obs-ID:P0304030004. A corner plot (Foreman-Mackey, 2016) obtained from these Xspec MCMC chains is shown in Figure 12. During the 2006 giant outburst of EXO 2030+375, the broadband spectra in 3-60 were explained with a BW model (Epili et al., 2017) without the need of any cyclotron line component. However the present 2021 outburst observations clearly detected a strong cyclotron line component in broad hard X-rays from 2- 105 keV.
Among the BW spectral parameters we find that, the estimated range of NS magnetic field responsible for the production of cyclotron emission as per BW model is G. However, during the progress of outburst, we observed the varying of cyclotron line energy in the range of 40–55 . An estimated value of NS magnetic field from the range of detected cyclotron line energy is within G. This clearly indicates that the Comptonized emission region as per BW model is spatially offset from the cyclotron absorption region in EXO 2030+375. Such an offset is also seen in the case of 4U 0115+63 (Ferrigno et al., 2009). We discuss more on this in Section 6. During the onset, progress and peak of the giant outburst, the NS magnetic field is found to be within the range of G. However during the declining phase of the outburst as the source luminosity decreases due to decrease in mass accretion rate, we notice higher estimates of the magnetic field value increasing upto G. This indicates a luminosity dependence of the Comptonized emission region in EXO 2030+375. In other words, a change of column emission height with luminosity, from where the Comptonized emission of X-ray photons contribute to the overall X-ray luminosity in the pulsar. This is also seen from the variation of accretion column radius () with luminosity. We see an increase of value with increasing the source luminosity up to the outburst peak. As the outburst fades. after attaining the peak luminosity, the column emission radius also decreases to its pre-outburst peak value m. The dominance of bulk-Comptonization during the peak luminosity is evident from the variation of parameter with luminosity. This parameter signifies the effective role of thermal Comptonization and bulk Comptonization processes in shaping the pulsar accretion column.
At low X-ray luminosity, its expected that, the energizing of photons takes place through thermal scattering of plasma electrons. Whereas at high X-ray luminosity, its the bulk motion of electrons energizes the X-ray photons in accretion column via inverse Compton scattering. At peak luminosity, we see that, its the pure bulk Comptonization process (as indicated by the higher values of ), that dominates net Comptonized column emission from the pulsar. There is an interesting variation of accretion plasma temperature () with the luminosity. At higher source luminosity, we see a slight decrease in the , implying a cooling of plasma emission at the outburst peak. This may happen, as the most of the hard X-ray photons escape from the side walls of accretion column above critical luminosity during which the emission beam pattern from the pulsar switches from a pure pencil beam emission at low X-ray luminosity to a mixture of pencil-beam and fan-beam emission pattern after attaining its critical luminosity. The dimensionless parameter is expressed in equations (26,103,104) of Becker & Wolff (2007) in terms of ratio of the dynamical time scale () for the accretion of gas onto the neutron star from the sonic point down to the NS surface to the time scale () for the radiation to diffuse through the column walls of the radiation dominated accretion column. The ratio of these two timescales relates to (through equation 104 of Becker & Wolff 2007) as : . Comparing our estimated values of for EXO 2030+375 (as shown in Table LABEL:table4), we find that these two time scales are of comparable magnitude. This shows that the accretion flow in the column is radiation dominated where photons find the least resistance to escape in the side walls of accretion column rather than upward diffusion along the column. The column emission radius or the hotspot radius (), is found to be increasing with source luminosity reaching a maximum value m at the outburst peak for few observation epochs in the high luminosity range of . However during most of the outburst, the estimated hot spot radius m is within the theoretical constraints (see equation 112 in Becker & Wolff 2007).
| BW model Parameters | |||||||||||
| Obs-IDs | Luminositya | B | Te | r0 | (d.o.f) | ||||||
| ( ) | () | ( G) | ( ) | (m) | ( ) | ( ) | |||||
| P0304030004‡ | 2.34 | 480.2 | 5.0 | 1.187(1117) | |||||||
| P0304030005 | 2.64 | 275.2 | 5.0 | 1.110(1236) | |||||||
| P0304030008 | 2.63 | 623.5 | 5.8 | 1.108(1236) | |||||||
| P0304030011 | 3.72 | 317.2 | – | – | – | 1.031(1237) | |||||
| P0304030012 | 3.60 | 363.4 | 5.0 | 1.045(1235) | |||||||
| P0304030013 | 3.06 | 365.6 | 5.0 | 1.053(1235) | |||||||
| P0304030016 | 3.31 | 371.9 | 5.0 | 1.036(1236) | |||||||
| P0304030017 | 3.34 | 364.8 | 5.0 | 1.092(1236) | |||||||
| P0304030018 | 3.13 | 399.9 | 5.0 | 0.998(1237) | |||||||
| P0304030020 | 3.30 | 390.0 | 5.0 | 1.037(1229) | |||||||
| P0304030021 | 3.60 | 405.9 | 11.6 | 1.042(1354) | |||||||
| P0304030024 | 3.78 | 405.6 | 5.0 | 1.109(1352) | |||||||
| P0304030025 | 3.85 | 465.5 | 5.0 | 1.163(1355) | |||||||
| P0404147001 | 3.89 | 468.8 | 5.0 | 1.124(1347) | |||||||
| P0304030026 | 4.01 | 498.2 | 5.0 | 1.077(1351) | |||||||
| P0304030027 | 4.10 | 661.0 | 4.9 | 1.002(1345) | |||||||
| P0304030029 | 4.19 | 811.0 | 8.36 | 1.104(1345) | |||||||
| P0304030030 | 4.38 | 824.2 | – | – | – | 1.081(1360) | |||||
| P0304030031 | 4.28 | 800.5 | – | – | – | 1.152(1360) | |||||
| P0304030032 | 4.36 | 800.5 | – | – | – | 1.021(1353) | |||||
| P0304030033 | 4.37 | 800.9 | – | – | – | 1.112(1353) | |||||
| P0304030034‡ | 5.19 | 820.7 | – | – | – | 1.143(1346) | |||||
| P0304030035 | 4.20 | 401.3 | – | – | – | 1.103(1352) | |||||
| P0304030036 | 4.49 | 393.8 | – | – | – | 1.137(1352) | |||||
| P0304030037 | 4.30 | 394.1 | – | – | – | 1.003(1353) | |||||
| P0304030038 | 4.39 | 401.0 | – | – | – | 0.995(1361) | |||||
| P0304030039 | 4.26 | 392.2 | – | – | – | 1.022(1360) | |||||
| P0304030040 | 3.99 | 394.0 | – | – | – | 1.172(1360) | |||||
| P0304030041 | 3.67 | 393.9 | – | – | – | 1.141(1349) | |||||
| P0304030042 | 3.48 | 465.0 | 5.0 | 1.112(1110) | |||||||
| P0304030044 | 3.27 | 484.4 | 5.0 | 1.032(1025) | |||||||
| P0304030046 | 3.01 | 359.5 | 3.9 | 1.187(1124) | |||||||
| P0304030050‡ | 2.17 | 369.0 | 5.0 | 1.030(1102) | |||||||
| P0304030051 | 1.82 | 369.4 | 5.0 | 1.032(1104) | |||||||
| OBSID | (g s-1 cm-2) | (K) | |||||||
|---|---|---|---|---|---|---|---|---|---|
| P0304030004 | 0.594 | 0.015 | 0.026 | 0.80 | 1.30 | ||||
| P0304030034 | 0.605 | 0.016 | 0.027 | 0.68 | 1.29 | ||||
| P0304030050 | 1.257 | 0.016 | 0.013 | 0.34 | 0.89 |
6 DISCUSSIONS
In this paper, we have presented the timing and spectral analysis of EXO 2030+375 using Insight-HXMT observations in 2021 which monitored the source between X-ray luminosity range of and . The obtained pulse profiles evolve with luminosity and energy are shown in Fig 2 and Fig 3. The energy dependence of the pulse fraction are presented in Fig 4. We found for the first time a clear cyclotron line energy at 47 (see Fig 7). The existence of 47 CRSF in EXO 2030+375 is not dependent on the continuum spectral models (e.g., highecut and cutoffpl). This 47 absorption structure can also be observed in the phase-resolved spectrum within several phase intervals, as shown in Fig 9. The pulse profile evolution and spectral parameter variations with luminosity suggest the spectral transition near the critical luminosity near erg s-1. In the followings, we use critical luminosity model to discuss the magnetic field strength of the NS.
The transition from subcritical to supercritical accretion regimes around critical luminosity is anticipated to bring alterations to the geometry of the emission region, consequently influencing the shape of the pulse profile. This phenomenon has been discussed in several published articles (Becker et al., 2012; Becker & Wolff, 2007; Wang et al., 2022; Mushtukov et al., 2015). At lower luminosity, the deceleration of the accretion flow can occur through Coulomb breaking within a plasma cloud. The stopping region of the flow is positioned just above the neutron star (NS) surface, and the emission originating from this stopping region escapes from the top of the column, forming a pencil beam. At luminosity above , deceleration is predominantly dominated by radiation pressure, with emission primarily escaping through the column walls, forming a fan-beam. The emission pattern transitions from a pencil-beam at low luminosity to a fan-beam at higher luminosity. The beam pattern translate from a fan-beam to a pencil-beam which is usually accompanied by a conversion between the two-peak pulse profile and the one-peak pulse profile. The strong changes in the pulse profile shape are observed at a luminosity of .
Parameters such as photon index, column density, and cutoff energy exhibit an inverse correlation with luminosity at low luminosity. With the increase in luminosity, there is an inverse correlation compared to low luminosity. Due to absence of substantial bulk Comptonization of photons with the accreting electrons, the pulsar spectrum appear soft (Becker et al., 2012; Epili et al., 2017). For the subcritical area (luminosity ), the accretion flow still goes through the radiation-dominated shock, and due to the pressure of the radiation is insufficient to bring the matter to rest at the stellar surface, the accretion flow will be decelerated by Coulomb braking ultimately. The photon index and luminosity show negative correlation, due to the emission zone decreases with the increasing luminosity. It seems like EXO 2030+375 undergo a transition from a negative to positive evolution and show a flat trend during 2021 outburst, in the range between . The luminosity of the transition revealed by the spectrum coincides with the changes in pulse profiles. Those phenomena seem to conclude that these are two distinct transitions that occurred in the range within a certain luminosity range . The critical luminosity at which the emission mode shifts relies on the strength of the neutron star’s magnetic field. This can be calculated as follows(Becker et al., 2012):
| (4) | ||||
For the case of EXO 2030+375, we assume that neutron star mass and radius values = 1.4 and = 10km, and = 0.1 and = 1 based on the theoretical considerations. The inferred magnetic field strength range for the NS in EXO 2030+375 is G.
Cyclotron resonance scattering features are the only way to directly measure the surface magnetic field strength of a neutron star. Several authors considered that there was a possible cyclotron absorption feature around 10 in EXO 2030+375 (Wilson & Finger, 2006; Klochkov et al., 2007; Wilson et al., 2008), although the Insight-HXMT observations suggest that such an absorption structure may be model-dependent rather than a genuine characteristic. If this is indeed a cyclotron absorption feature, the corresponding magnetic field is G. Reig & Coe (1999) attributed a possible spectral absorption feature at 36 to a cyclotron absorption line, the corresponding magnetic field strength will be G. From a CRSF at reported by Insight-HXMT, we estimated the NS surface magnetic field strength of EXO 2030+375 and gave it to be G, which is good agreement with the magnetic field strength based on the critical luminosity.
The 2021 giant outburst of EXO 2030+375 shows that, the column emission is radiation dominated around the outburst peak. This allows us to use the physics based BW model (Becker & Wolff, 2007) to explore the column emission of the pulsar assuming the canonical values of neutron star and the accretion rate estimated from observed X-ray luminosity of the pulsar during the outburst. With the BW model applied to the phase averaged spectra of EXO 2030+375, we are able to estimate the fundamental parameters such as : , , and . The variations of these parameters with the outburst luminosity could illustrate the role of thermal and bulk Comptonization of the accretion plasma in shaping the pulsar column emission which is radiation dominated. Based on these fundamental parameters, the BW model can also be used to compute several additional parameters of the model.
In Table 5, we show some of these physical parameter values obtained using the BW model. These are namely: (1) : the constant of the assumed velocity profile (), (2) : the ratio of the scattering cross section of photons propagating parallel the magnetic field to the Thomson scattering, (3) : angle averaged cross section in units of the Thomson value, (4) : the mass accretion flux, (5) (K): The temperature of the thermal mound in , (6) : The inflow speed at the mound surface in terms of , (7) : optical depth at the top of the thermal mound, (8) : The maximum optical depth, a dynamical constraint for the assumed velocity profile such that, at large distances from the neutron star, the radiation pressure is negligible and (9) : The optical depth of the trapped radiation in the rapidly falling gas in the accretion column. These parameters are defined in Becker & Wolff (2007) respectively in the equations (33),(83),(84),(92),(93),(88),(89),(79) & (107).
From our calculations, we find that, the inflow speed at the thermal mound , whereas the free fall velocity at the top of accretion column is . This shows a significant deceleration of the accretion plasma at the NS surface during the outburst. The mound temperature ((K)) is found to be increasing as the mass accretion flux () increases. From the comparison of and values , we find that, for all the three luminosity epochs of observations as mentioned Table 5, . This indicates that, the trapped region of the accretion column is from where most of the observed emission is produced. In the radiation dominated accretion column as the matter falls rapidly, the photon “trapping” occurs when the downward advective flux of photons dominates the upward diffusion of photons along the column axis (Becker & Wolff, 2007). This leads to confinement of photons in the lower regions of the accretion flow. However through diffusion, the radiation is effectively transported vertically from the lower regions of the column. We find that in addition to the observed luminosity epochs as mentioned in Table 5 for EXO 2030+375, at the other epochs of the 2021 outbursts also (as noted in Table LABEL:table4), the condition holds good. This is a further indication that, during the giant outburst, as the accretion column is highly radiation dominated, the bulk Comptonization traps the radiation in the lower regions of accretion column.
Apart from the bulk Comptonization being an efficient mechanism of energy transfer from the accreting gas to the the photons, we find that, in EXO 2030+375 during the progress and declining of the giant outburst, the thermal Comptonization as well plays a vital role in formation of broadband spectra. The phase-averaged spectra EXO 2030+375 has been successfully explained with quasi-exponential cutoff at high energies (i.e highecut) with a flattening of spectrum at low energies. The contribution of these spectral shapes is mainly due to thermal processes that transfer the energy from high to low frequency radiation. Now this is evident from application of BW model, from which we can see the thermal Comptonization playing a significant role via Compton scattering of high energy photons. The flattened spectra is due to the subsequent inverse Compton scattering of soft photons by the recoiling plasma electrons leading to energy transfer to low frequency photons (Becker & Wolff, 2007).
7 Summary
Using high-cadence and high-statistic observations by Insight-HXMT, we investigate the timing and spectral properties of this source during the brightest type II outburst of EXO 2030+375 occurring in 2021 in details. A previously unnoticed cyclotron absorption line is reported in the spectrum. In the pulse phase-averaged spectra, the fundamental CRSF is clearly detected between 44 and 50 with the different continuum models. Phase-resolved spectral analyses consistently show strong evidence of CRSF around 47 . A transition from sub-critical to super-critical regime is seen in the variations of spectral parameters, which will be due to changes in the emission geometry across the critical luminosity.
There is an energy dependence and a luminosity dependence of the pulse profile shape. The rms pulse fraction drops sharply at 30 appearing near luminosity . The pulse profile exhibits significant changes between two peaks and one peak around the luminosity corresponding to the transition between subcritical and supercritical accretion regimes. Based on the calculation of the critical luminosity model, the magnetic field of EXO 2030+375 can be estimated to be G. In addition, the BW model is applied to the wide band spectrum, and constrains the pulsar magnetic field in the range of G.
Acknowledgements
We are grateful to the referee for the suggestions to improve the manuscript. This work is supported by the NSFC (No. 12133007) and the National Key Research and Development Program of China (Grants No. 2021YFA0718503). This work has made use of data from the Insight-HXMT mission, a project funded by the China National Space Administration (CNSA) and Chinese Academy of Sciences (CAS).
References
- Arnason et al. (2021) Arnason, R. M., Papei, H., Barmby, P., Bahramian, A., & D. Gorski, M. 2021, Monthly Notices of the Royal Astronomical Society, 502, 5455, doi: 10.1093/mnras/stab345
- Basko & Sunyaev (1976) Basko, M., & Sunyaev, R. A. 1976, Monthly Notices of the Royal Astronomical Society, 175, 395
- Becker et al. (2012) Becker, P., Klochkov, D., Schönherr, G., et al. 2012, Astronomy & Astrophysics, 544, A123
- Becker & Wolff (2007) Becker, P. A., & Wolff, M. T. 2007, The Astrophysical Journal, 654, 435
- Burderi et al. (2000) Burderi, L., Salvo, T. D., Robba, N. R., Barbera, A. L., & Guainazzi, M. 2000, The Astrophysical Journal, 530, 429, doi: 10.1086/308336
- Burnard et al. (1991) Burnard, D. J., Arons, J., & Klein, R. I. 1991, Astrophysical Journal, Part 1 (ISSN 0004-637X), vol. 367, Feb. 1, 1991, p. 575-592. Research supported by the Lawrence Livermore National Laboratory., 367, 575
- Caballero & Wilms (2012) Caballero, I., & Wilms, J. 2012, arXiv preprint arXiv:1206.3124
- Cao et al. (2020) Cao, X., Jiang, W., Meng, B., et al. 2020, SCIENCE CHINA Physics, Mechanics & Astronomy, 63, 1
- Chen et al. (2021) Chen, X., Wang, W., Tang, Y., et al. 2021, The Astrophysical Journal, 919, 33
- Chen et al. (2020) Chen, Y., Cui, W., Li, W., et al. 2020, Science China Physics, Mechanics & Astronomy, 63, 1
- Coe et al. (1988) Coe, M. J., Longmore, A., Payne, B. J., & Hanson, C. G. 1988, Monthly Notices of the Royal Astronomical Society, 232, 865, doi: 10.1093/mnras/232.4.865
- Epili et al. (2017) Epili, P., Naik, S., Jaisawal, G. K., & Gupta, S. 2017, Monthly Notices of the Royal Astronomical Society, 472, 3455, doi: 10.1093/mnras/stx2247
- Ferrigno et al. (2009) Ferrigno, C., Becker, P. A., Segreto, A., Mineo, T., & Santangelo, A. 2009, A&A, 498, 825, doi: 10.1051/0004-6361/200809373
- Ferrigno et al. (2016) Ferrigno, C., Pjanka, P., Bozzo, E., et al. 2016, Astronomy & Astrophysics, 593, A105
- Foreman-Mackey (2016) Foreman-Mackey, D. 2016, The Journal of Open Source Software, 1, 24, doi: 10.21105/joss.00024
- Fornasini et al. (2023) Fornasini, F. M., Antoniou, V., & Dubus, G. 2023, High-mass X-ray Binaries. https://arxiv.org/abs/2308.02645
- Fu et al. (2023) Fu, Y.-C., Song, L., Ding, G., et al. 2023, Monthly Notices of the Royal Astronomical Society, 521, 893
- Janot-Pacheco et al. (1988) Janot-Pacheco, E., Motch, C., & Pakull, M. 1988, Astronomy and Astrophysics, 202, 81
- Ji et al. (2020) Ji, L., Ducci, L., Santangelo, A., et al. 2020, Monthly Notices of the Royal Astronomical Society, 493, 5680
- Klochkov et al. (2008) Klochkov, D., Santangelo, A., Staubert, R., & Ferrigno, C. 2008, Astronomy & Astrophysics, 491, 833
- Klochkov et al. (2007) Klochkov, D., Horns, D., Santangelo, A., et al. 2007, Astronomy & Astrophysics, 464, L45
- Kreykenbohm (2004) Kreykenbohm, I. 2004, PhD thesis, Universität Tübingen
- Liu et al. (2020) Liu, C., Zhang, Y., Li, X., et al. 2020, SCIENCE CHINA Physics, Mechanics & Astronomy, 63, 1
- Lutovinov & Tsygankov (2009) Lutovinov, A., & Tsygankov, S. 2009, Astronomy Letters, 35, 433
- Malacaria et al. (2023) Malacaria, C., Heyl, J., Doroshenko, V., et al. 2023, Astronomy & Astrophysics, 675, A29
- Manikantan et al. (2023) Manikantan, H., Paul, B., & Rana, V. 2023, Monthly Notices of the Royal Astronomical Society, 526, 1
- Motch & Janot-Pacheco (1987) Motch, C., & Janot-Pacheco, E. 1987, Astronomy and Astrophysics (ISSN 0004-6361), vol. 182, no. 2, Aug. 1987, p. L55-L58., 182, L55
- Mushtukov et al. (2015) Mushtukov, A. A., Suleimanov, V. F., Tsygankov, S. S., & Poutanen, J. 2015, Monthly Notices of the Royal Astronomical Society, 447, 1847
- Naik et al. (2013) Naik, S., Maitra, C., Jaisawal, G. K., & Paul, B. 2013, The Astrophysical Journal, 764, 158
- Nakajima et al. (2021) Nakajima, M., Mihara, T., Negoro, H., et al. 2021, The Astronomer’s Telegram, 14809, 1
- Nelson et al. (1993) Nelson, R. W., Salpeter, E., & Wasserman, I. 1993, Astrophysical Journal v. 418, p. 874, 418, 874
- Okazaki & Negueruela (2001) Okazaki, A. T., & Negueruela, I. 2001, A&A, 377, 161, doi: 10.1051/0004-6361:20011083
- Parmar et al. (1989) Parmar, A. N., White, N. E., & Stella, L. 1989, ApJ, 338, 373, doi: 10.1086/167205
- Paul & Naik (2011) Paul, B., & Naik, S. 2011, arXiv preprint arXiv:1110.4446
- Porter & Rivinius (2003) Porter, J. M., & Rivinius, T. 2003, Publications of the Astronomical Society of the Pacific, 115, 1153, doi: 10.1086/378307
- Reig & Coe (1999) Reig, P., & Coe, M. 1999, Monthly Notices of the Royal Astronomical Society, 302, 700
- Shaw et al. (2009) Shaw, S., Hill, A., Kuulkers, E., et al. 2009, Monthly Notices of the Royal Astronomical Society, 393, 419
- Stella et al. (1986) Stella, L., White, N., & Rosner, R. 1986, The Astrophysical Journal, 308, 669
- Sun et al. (1994) Sun, X.-J., Li, T.-P., Wu, M., & Cheng, L.-X. 1994, Astronomy and Astrophysics, 289, 127
- Tamang et al. (2022) Tamang, R., Ghising, M., Tobrej, M., Rai, B., & Paul, B. C. 2022, Monthly Notices of the Royal Astronomical Society, 515, 5407
- Thalhammer et al. (2021) Thalhammer, P., Ballhausen, R., Pottschmidt, K., et al. 2021, The Astronomer’s Telegram, 15006, 1
- Tsygankov et al. (2007) Tsygankov, S., Lutovinov, A., Churazov, E., & Sunyaev, R. 2007, Astronomy Letters, 33, 368
- Tsygankov et al. (2010) Tsygankov, S., Lutovinov, A., & Serber, A. 2010, Monthly Notices of the Royal Astronomical Society, 401, 1628
- Wang et al. (2022) Wang, P., Kong, L., Zhang, S., et al. 2022, The Astrophysical Journal, 935, 125
- Wang et al. (2021) Wang, W., Tang, Y., Tuo, Y., et al. 2021, Journal of High Energy Astrophysics, 30, 1, doi: https://doi.org/10.1016/j.jheap.2021.01.002
- Wang & Welter (1981) Wang, Y.-M., & Welter, G. 1981, Astronomy and Astrophysics, vol. 102, no. 1, Sept. 1981, p. 97-108. Research supported by the Universitaet Bonn., 102, 97
- Wilms et al. (2000) Wilms, J., Allen, A., & McCray, R. 2000, ApJ, 542, 914, doi: 10.1086/317016
- Wilson et al. (2005) Wilson, C. A., Fabregat, J., & Coburn, W. 2005, The Astrophysical Journal, 620, L99, doi: 10.1086/428838
- Wilson & Finger (2006) Wilson, C. A., & Finger, M. H. 2006, The Astronomer’s Telegram, 877, 1
- Wilson et al. (2008) Wilson, C. A., Finger, M. H., & Camero-Arranz, A. 2008, The Astrophysical Journal, 678, 1263