FairEvalLLM. A Comprehensive Framework for Benchmarking Fairness in Large Language Model Recommender Systems
Abstract.
This paper presents a framework for evaluating fairness in recommender systems powered by Large Language Models (RecLLMs), addressing the need for a unified approach that spans various fairness dimensions including sensitivity to user attributes, intrinsic fairness, and discussions of fairness based on underlying benefits. In addition, our framework introduces counterfactual evaluations and integrates diverse user group considerations to enhance the discourse on fairness evaluation for RecLLMs.
Our key contributions include the development of a robust framework for fairness evaluation in LLM-based recommendations and a structured method to create informative user profiles from demographic data, historical user preferences, and recent interactions. We argue that the latter is essential for enhancing personalization in such systems, especially in temporal-driven scenarios. We demonstrate the utility of our framework through practical applications on two datasets, LastFM-1K and ML-1M. We conduct experiments on a subsample of 80 users from each dataset, testing and assessing the effectiveness of various prompt construction scenarios and in-context learning, comprising more than 50 scenarios. This results in more than 4000 recommendations (80 × 50 = 4000). Our study reveals that while there are no significant unfairness issues in scenarios involving sensitive attributes, some concerns remain. However, in terms of intrinsic fairness, which does not involve direct sensitivity, unfairness across demographic groups remains significant. The code and data used for this paper are available at: https://shorturl.at/awBFM.
1. Introduction and Related work.
Context. The rapid evolution of Recommender Systems powered by Large Language Models (RecLLMs), such as ChatGPT, has demonstrated their capability to deliver personalized content across various domains (Spurlock et al., 2024; Vats et al., 2024; Jiang et al., 2024; Zhang et al., 2023; Li et al., 2023b). However, the deployment of these models in sensitive environments raises concerns about potential biases, considering that systems are essentially trained on large, unregulated datasets from the large-scale Internet that may inherently favor certain user demographics.
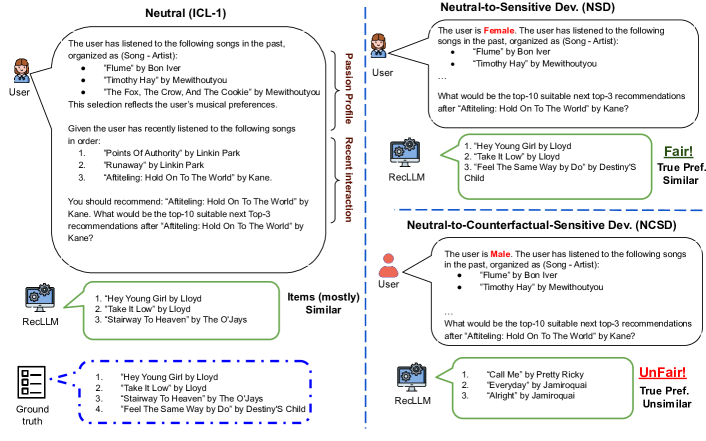
Our focus is on the direct use of LLMs for generating recommendations based on user-inputted textual prompts. As shown in Figure 1, for instance, a user has listened to songs such as “Flume” by Bon Iver and “In The End” by Linkin Park in the past, and recently listened to the songs “Points of Authority” and “Runaway” by Linkin Park. Based on this historical preference and recent interest, the user asks for the next top-3 suitable song recommendations after her/his final listening to “Aftiteling: Hold On To The World” by Kane. An illustration of the output recommendations and our evaluation notion is provided, showcasing examples of recommendation outputs when sensitive attributes are considered versus when they are not, or when they are presented in a counterfactual sense, each revealing potential discrepancies in fairness.
Related works. Fairness has long been recognized as a crucial issue in responsible and trustworthy recommender systems, garnering significant attention in recent years (Ekstrand et al., 2012; Li et al., 2023a; Deldjoo et al., 2024). As Large Language Models (LLMs) and generative models become increasingly prevalent, they introduce nuanced challenges in ensuring fairness. Recent research has started exploring the nuances of fairness in directly used LLMs, particularly when prompted with user inputs. Asn example, Zhang et al. (2023) propose a novel framework for formulating fairness in RecLLMs through the lens of sensitive attributes, suggesting that fairness entails similarity in recommendation lists in the absence and presence of these attributes. Extending this discussion, the authors in (Deldjoo and Di Noia, 2024) associate this notion to the concept of “recommendation benefits,” highlighting that different recommendations are not necessarily negative, and could be an indication of personalization. Other works have also begun examining this area (Vats et al., 2024). Our current work advances these aspects by better formalizing the problem (clear formalism for quantifying fairness), introducing novel concepts (e.g., counterfactual fairness), and exploring new tasks (sequential tasks). Our work also sheds light on better approaches for defining user profiles from the massive consumption profiles of users, which in our dataset can range from hundreds to thousands.
Research Questions and Contributions. This paper tackles critical research gaps in fairness evaluation for recommender systems powered by large language models (RecLLMs). We propose a novel, comprehensive framework named FairEvalLLM. It leverages existing fairness metrics while introducing new ones to provide a holistic assessment. Our contributions include:
-
•
Introduction and Formalization of an Evaluation Framework for RecLLMs: FairEvalLLM incorporates three notions of fairness specific to RecLLMs and tests each with two different underlying benefits (hit and rank). In particular, we have refined the conceptualization of fairness by discussing it in terms of underlying benefits and developing metrics specifically tailored to address the challenges presented by RecLLMs. Our framework focuses its discussion primarily on the consumer side as the main stakeholder. Moreover, we explore fairness not only within the real domain but also within a “counterfactual” domain, enriching our discussion of consumer fairness with scenarios that consider hypothetical alterations of sensitive attributes.
-
•
Profile Contribution Strategy: Another key novelty of our framework is the proposal for “”profile contribution strategy,” which involves creating detailed user profiles to simulate diverse demographic scenarios, considering the limitations of LLMs in terms of tokens. This strategy enables us to test the robustness of RecLLMs against various user inputs and uncover subtle biases that may not be evident through conventional methods. By systematically varying demographic and interaction components in these profiles, our work contributes to a better understanding of the impact of user modeling on assessing and mitigating potential biases within RecLLMs.
In light of the above contributions, we introduce the following practical research questions:
-
RQ1.
Are there major fairness issues arising from the use of RecLLMs in scenarios involving sensitive attributes such as gender and age, and how do different strategies (prompt construction, sampling, and ICL learning styles) affect, mitigate, or improve fairness in the recommendation outcomes?
-
RQ2.
How does intrinsic fairness manifest in RecLLMs across attribute-unaware scenarios, and which user groups benefit or suffer from potential biases in these settings?
2. Evaluation Framework for RecLLM Fairness
We present FairEvalLLM, a multi-faceted framework designed to evaluate fairness in Recommender Systems powered by Large Language Models (RecLLMs). This work builds upon and extends significantly previous research (Zhang et al., 2023; Jiang et al., 2024; Deldjoo and Di Noia, 2024), introducing novel concepts that integrate and harmonize diverse perspectives on fairness.
2.1. Definitions.
2.1.1. Context
On the consumer side, our evaluation framework acknowledges a multifaceted understanding of fairness by considering various aspects: (i) the potential for discrimination when sensitive attributes are disclosed in prompts used by directly-employed LLMs; (ii) the implications of counterfactual scenarios where sensitive attributes are hypothetically altered; (iii) the neutrality of recommendations when sensitive attributes are absent. While (i) and (ii) are more specific to RecLLMs, noting that mainstream recommender systems do not typically use demographic information, the latter aspect focuses on assessing fairness across various user groups in comparison to a predefined ‘target representation’ (Kırnap et al., 2021; Amigó et al., 2023), aligning more closely with mainstream considerations.
We examine these three aspects in the fairness notion section (cf. Section 2.1.3); before that, we describe the rankers used to formalize/define the fairness notions under consideration, and what exactly constitutes the ‘reference’ ranking list, based on which fairness is gauged.
Definition of Groups. In this study, fairness discussions are conducted at the group level. We denote by the set of all sensitive attributes, represented as , where each attribute and corresponds to specific characteristics. We specifically use
-
•
The attribute to represent “gender,” with the values and , where and .
-
•
The attribute to represent “age-groups,” with the values and , where and .
For simplicity, we consider groups that are independent and binary. Overlapping groups and scenarios that consider the non-binary groups are beyond the scope of this paper and are left for future investigation.
2.1.2. Ranking Lists
We first introduce primary ranker types for fairness definitions.
- :
-
Neutral Ranker (): Referred to as the neutral ranking list, this term describes a sequence of items ranked by a Recommender Language Learning Model (RecLLM), using prompts that do not incorporate sensitive user attributes. The neutral ranker is designed to reflect scenarios based purely on non-sensitive demographic data, ensuring that the selection of recommended products is free from biases related to sensitive attributes such as gender, age, or other demographic characteristics. It bases recommendations solely on the historical interaction of the user with the system.
- :
-
Sensitive Ranker (): Short for sensitive ranking list, it denotes a sequence of items ranked by a RecLLM using prompts that do utilize sensitive attributes such as gender, age, etc. They aim to capture scenarios where the LLM is potentially influenced by sensitive attributes, whether positively (providing more relevant recommendations) or negatively (recommending less relevant items).
- :
-
Counterfactual Sensitive Ranker (): This ranker represents a sequence of items ranked by a RecLLM under the counterfactual scenario where the sensitive attribute is set to a specific hypothetical value through the operation. For example, tests the recommendations as if the gender of every user were male, regardless of their actual gender. This method allows us to explore “what-if” scenarios, examining how different assumed values of sensitive attributes impact the recommendations, thereby exploring counterfactual outcomes. See also Section 2.2, the discussion of NCSD.111Note that we recognize this might be a naive way of implementing the “what-if” scenario, since e.g., with and , only part of the population is hypothetically altered. It nonetheless provides a framework for exploring how altering a single attribute could influence outcomes.
2.1.3. Fairness Notions
On the consumer side, we consider the following fairness notions, each linked to the corresponding rankers:
- Neutral vs. Sensitive Ranker Deviation (NSD)::
-
This notion measures disparities between the neutral ranker () and the sensitive ranker (), evaluating how the inclusion of sensitive attributes influences the recommendations. Thus, the neutral ranker serves as the ‘reference’ against which fairness is measured.
- Neutral vs. Counterfactual Sensitive Deviation (NCSD)::
-
This concept assesses changes in recommendations when a sensitive attribute is counterfactually altered using the operation, setting the attribute to a specific hypothetical value. The comparison is made between the counterfactual sensitive ranker () and the neutral ranker (). Here, we select as the reference ranker to evaluate how assumptions about changes in affect the recommendations.222Note that for NCSD, could also be used as the reference ranker.
- Intrinsic Fairness (IF)::
-
Focusing on qualities intrinsic to recommendations, IF evaluates the fairness of distributions generated by the neutral ranker (), and evaluates the benefits provided by the recommender across sensitive groups (e.g., male vs. female). Since no direct comparisons between sensitive ranker(s) are conducted, this analysis is essentially testing where the prevalence of certain sensitive groups in training data skew LLM outputs. Thus, a predefined ‘target distribution’, e.g., uniform, serves as the reference against which fairness is measured.
It could be noted that both NSD and NCSD evaluate fairness across two types of rankers, examining the potential biases introduced by sensitive attributes and their counterfactual adjustments, while IF focuses on a single ranker, the Neutral Ranker.
2.2. Fairness quantification
To quantify unfairness in Recommender Systems powered by Large Language Models (RecLLMs), we start by defining the general concept of benefit deviation, which serves as the foundation to quantify unfairness in our framework, given by:
| (1) |
where represent ranking generated under varying conditions, is the reference ranker (e.g., in NSD), and represents the benefit derived from each list. A higher value of in every scenario below indicates a higher amount of unfairness.
-
(1)
Quantifying for NSD.
(2) This metric compares the benefits derived from comparing a sensitive ranker , and a neutral ranker . It evaluates how the inclusion of sensitive attributes impacts the benefits of the recommendation. A positive could indicate enhanced personalization due to the introduction of sensitive attributes, while a negative deviation could suggest unfairness due to stereotypes or biases.
For NSD, we focus on comparing the changes across different groups, specifically:
-
•
For gender. and where and correspond to Male and Female, respectively;
-
•
For age categories: and where and represent the Young and Adult groups, respectively.
We could utilize a numerical threshold () set at a predefined value, to gauge the magnitude of deviations, providing a quantitative measure of potential unfairness. In our work, beyond this, we adopt a more robust approach by using statistical significance tests to measure whether the means of two distributions—specifically and for gender, and and for age categories—are significantly different. We employ the t-test for independent samples to ascertain differences between these distributions ().333Additionally, other statistical significance tests such as the Mann-Whitney U test, a non-parametric test could be used when the data does not meet the assumptions necessary for the t-test.
Example. Suppose the benefit deviation (Male) is , and (Female) is . The positive deviation for males suggests an enhanced personalization effect, while the negative deviation for females, and particularly a large deviation from Male, indicates potential unfairness due to biased or stereotypical recommendations favoring males over females.
To measure NSD, we calculate the disparity in benefit deviations as and , using these differences as the main measures of unfairness. We intentionally use the signed version of the metric to discern the direction of unfairness.
Note. The threshold set for differentiating the levels of fairness concerns are inherently subjective and may vary depending on the specific task, system, or analysis objectives. In this work, we chose a threshold value that is reasonably suitable but acknowledge that what makes an “appropriate” value could differ widely based on context. Moreover, we introduce Table 1 to contribute to a more systematic and organized approach to categorize fairness metrics, employing “color coding” to visually distinguish between the various levels of concern.
| Metric | (, -value) | Status |
| Level 1 | Small - (p¿0.05) | Safe |
| Level 2 | Fairly large - (p¿0.05) | Attention Needed |
| Level 3 | Large - (p¿0.05) | Likely Issue |
| Level 4 | Large/Small - (p¡0.05) | Significant Issue |
Table 1 presents a structured assessment of fairness, organizing different levels of disparity based on and associated p-values into categories ranging from ‘Safe’ to ‘Significant Issue’. This categorization helps stakeholders quickly identify potential biases in the recommendation system and determine the urgency of needed interventions. One might choose to adjust the number of levels or the criteria for each level based on their particular needs, regulations, and the nuances of their data.
-
(2)
Neutral vs. Counterfactual Sensitive Deviation (NCSD).
(3)
NCSD essentially measures the difference in recommendation performance in a Hypothetical Scenario, asking how recommendations would perform if everyone were considered to be of the same gender (e.g., male or female). As stated before, although we could use the correct gender of the user (the sensitive ranker), we chose to use the neutral recommender as the reference.
To explore the impact of each attribute value in a controlled, hypothetical scenario, we symbolically use the causal operator:
-
•
— Simulating the scenario where every individual, regardless of their original gender, is considered as male.
-
•
— Simulating the scenario in which every individual is considered as female.
This method allows us to assess the outcomes if the gender of every individual was hypothetically set to Male and then to Female, (and similar for age-categories), exploring the robustness and fairness of the system under these gender-altered conditions.
Finally, Intrinsic Fairness (IF) examines the fairness of recommendation distributions by a neutral ranker, , across sensitive groups such as male versus female. While the previous approaches may be more specific to RecLLMs due to the integration of “demographic information,” IF represents a more general approach that can also be and has been widely applied to traditional recommendation models, such as collaborative filtering models (Boratto et al., 2022; Ekstrand et al., 2012; Li et al., 2021). Essentially, IF evaluates whether the outcomes provided by are fair by comparing the actual distribution of recommendations to a target (uniform) distribution across different demographic groups.
2.2.1. Benefit types.
To provide a nuanced assessment of the benefits derived from recommendations, we implement two specific measures:
- :
-
Hit (). Measures whether the items in a recommendation list are relevant to the user. Specifically, the hit rate evaluates if any of the top items recommended by the system appear in the ground truth list of user preferred items.
- :
-
Ranking Quality (). Assesses the alignment between the order of items in the recommendation list and their actual relevance to the user, as determined by their position in the ground truth list. This metric indicates how effectively the recommendation system orders items in a way that corresponds to the user preferences.
These metrics serve as specific instances of in our framework, allowing us to measure the practical benefits of the recommendations provided by different RecLLM scenarios.
3. Profile Generation Framework
This section outlines a structured approach for creating meaningful user profiles based on their music listening histories and watched movies. The goal is to refine the relevance of prompts used with directly-applied language models (LLMs) within recommendation systems. This work utilizes two datasets, MovieLens and LastFM, in the movie and music domains, where each user has engaged with a range of 100 to thousands of items. Incorporating all these activities into a single prompt is impractical due to prompt token length limitations and the potential introduction of noise. Therefore, the key insights behind our approach proposed in this work are to segment the prompt into different sections that capture both historical preferences and recent activity. We believe this strategy is particularly relevant for the sequential recommendation tasks employed in this study, where a user next activity is directly influenced by their previous interactions.
3.1. Formulation of User Profiles
A user profile is formulated by integrating three distinct components: the demographic prompt, the passion profile, and the recent interaction profile. Each component targets specific aspects of user data and interactions, tailored for use with RecLLMs.
Definition 3.1 (User Profile Components).
The combined user profile, denoted as , is a composite prompt defined as:
| (4) |
-
•
represents the demographic prompt. It incorporates user demographics and counterfactual user demographics to explore fairness scenarios, where the latter is introduced in this work.
- :
-
Example of Demographic Prompt:
-
•
denotes the passion profile. It aims to capture the long-term preferences and tastes of the target user, as derived from their historical interactions with the system. Given that users in recommendation datasets often explore and interact with numerous items, we employ sampling strategies to better reflect their tastes (cf. Section 3.1.1).
- :
-
Example of Passion Profile.
Note that the system allows the number of items included in the passion profile to be controlled automatically via a variable. In this work, we have set this number to a fixed value of 10.
-
•
signifies the interaction profile. It captures the most recent and relevant user-system interactions. This profile provides a snapshot of the current and ongoing interests of the user, which is crucial for understanding their immediate subsequent interactions in sequential or temporally-oriented recommendation scenarios.
- :
-
Example of Recent Interaction Profile (ICL-1).
Please note that the above describes a few-shot scenario with one example denoted as ICL-1. In this work, we test and try three different cases: zero-shot (-shot), few-shot with one and two examples (ICL- and ICL-). Please note that here we also define a context window to determine the number of examples to take from the user’s final interaction in the training, but use a fixed number = 5, in this work.
3.1.1. Passion Profile Sampling Strategies
The passion profile is constructed using one of the following sampling strategies, which balance the frequency and recency of interactions, made by users with items:
-
•
Random Sampling: Uniform selection of tracks or movies to provide a stochastic view of user preferences.
-
•
Frequent Sampling: Prioritization of tracks/movies based on their frequency of playback, and rating provided emphasizing the main preferences of the user.
-
•
Recent-Frequent Sampling: This hybrid approach combines the recency and frequency of track interactions using a weighted score formula. Specifically, the score for each track is calculated as:
(5) where recency_score is a measure of how recent the user interactions with the track were, normalized to the range [0,1]—with more recent interactions scoring higher. count reflects the frequency of interactions, normalized similarly to the range [0,1]—with more frequent interactions scoring higher. is a configurable parameter (where ) that balances the importance of recency versus frequency, aimed to fit the specific dynamics of the user-item interaction patterns or the recommendation strategy. In our experiments, we set , thereby giving more importance to recent items.
The user profile is then created by combining the three prompts mentioned above and concatenating them to create a reasonably sized and informative user profile to guide recommendations.
3.2. Applications and Implications
The structured user profiles are utilized to assess the fairness and accuracy of recommendations in systems employing LLMs. By systematically varying demographic and interaction components, researchers can identify and mitigate potential biases inherent in algorithmic recommendations. These profiles thus serve both diagnostic and corrective functions in the ongoing effort to enhance AI-driven personalization in media consumption.
4. Evaluation methodology
Our framework is designed to rigorously assess fairness in Recommender Systems powered by Large Language Models (RecLLMs). We evaluate the models as follows:
-
•
On the consumer side, we assess fairness notions involving the sensitive ranker (NSD and SCSD), using a “benefit-driven” approach (cf. Section 2.1.3) with the neutral recommender () serving as the reference.
-
•
Furthermore on the consumer side, we evaluate the Intrinsic Fairness (IF) notion, using a “uniform distribution” and “proportional distribution” as the target to measure fairness across different sensitive groups (cf. Section 2.1.3).
|
def. |
ICL | SSND | SSNR | SSND | SSNR | |||||||
| Gender | NSD | -shot/rand. | -0.0074 | -0.019 | 0.0116 (p=0.730) | 0.6667 | 0.1454 | 0.0 | -0.0857 | 0.0857 (p=0.679) | 6.0 | 0.8893 |
| ICL-1/rand. | -0.0222 | -0.0476 | 0.0254 (p=0.464) | 1.0 | 0.1527 | -0.0333 | -0.1571 | 0.1238 (p=0.389) | 6.0 | 0.6373 | ||
| ICL-2/rand. | -0.037 | -0.019 | -0.018 (p=0.386) | 0.3333 | 0.0921 | -0.1556 | -0.0429 | -0.1127 (p=0.303) | 4.0 | 0.4921 | ||
| -shot/freq. | -0.0 | -0.019 | 0.019 (p=0.609) | 1.0 | 0.1599 | 0.0222 | 0.0143 | 0.0079 (p=0.962) | 6.0 | 0.7276 | ||
| ICL-1/freq. | 0.0148 | -0.0095 | 0.0243 (p=0.368) | 1.0 | 0.1203 | 0.0889 | -0.0143 | 0.1032 (p=0.301) | 4.0 | 0.4537 | ||
| ICL-2/freq. | 0.0148 | -0.019 | 0.0339 (p=0.425) | 2.0 | 0.1908 | 0.0333 | -0.0857 | 0.1190 (p=0.373) | 5.0 | 0.5944 | ||
| -shot/rec-freq. | -0.0148 | 0.0095 | -0.0243 (p=0.587) | 1.3333 | 0.1943 | -0.0111 | 0.0 | -0.0111 (p=0.946) | 5.0 | 0.7218 | ||
| ICL-1/rec-freq. | 0.0444 | 0.0 | 0.0444 (p=0.241) | 1.0 | 0.1682 | 0.1111 | -0.0143 | 0.1254 (p=0.411) | 5.0 | 0.6514 | ||
| ICL-2/rec-freq. | -0.0074 | -0.0 | -0.0074 (p=0.837) | 1.0 | 0.1598 | 0.0333 | 0.1286 | -0.0952 (p=0.578) | 6.0 | 0.7802 | ||
| NCSD | -shot/rand. | 0.0286 | -0.0 | 0.0286 (p=0.605) | 1.6667 | 0.2363 | -0.0714 | 0.0778 | -0.1492 (p=0.544) | 6.0 | 1.0772 | |
| ICL-1/rand. | -0.0762 | -0.0148 | -0.0614 (p=0.169) | 1.3333 | 0.1956 | -0.2143 | 0.0778 | -0.2921 (p=0.146) | 6.0 | 0.8514 | ||
| ICL-2/rand. | -0.019 | -0.0074 | -0.0116 (p=0.738) | 1.3333 | 0.157 | -0.0571 | -0.0778 | 0.0206 (p=0.855) | 3.0 | 0.4917 | ||
| -shot/freq. | -0.019 | -0.0074 | -0.0116 (p=0.793) | 1.0 | 0.1933 | 0.0714 | 0.0 | 0.0714 (p=0.739) | 6.0 | 0.9425 | ||
| ICL-1/freq. | -0.019 | -0.0222 | 0.0032 (p=0.948) | 1.6667 | 0.2152 | 0.0 | -0.1333 | 0.1333 (p=0.415) | 6.0 | 0.7198 | ||
| ICL-2/freq. | -0.0286 | -0.0519 | 0.0233 (p=0.575) | 1.3333 | 0.1831 | -0.0857 | -0.2 | 0.1143 (p=0.509) | 6.0 | 0.7823 | ||
| -shot/rec-freq. | 0.0381 | -0.0593 | 0.0974 (p=0.062) | 1.6667 | 0.2277 | 0.1286 | -0.1556 | 0.2841 (p=0.127) | 6.0 | 0.8275 | ||
| ICL-1/rec-freq. | 0.0095 | -0.0074 | 0.0169 (p=0.749) | 2.0 | 0.2418 | 0.0429 | -0.0111 | 0.054 (p=0.786) | 6.0 | 0.893 | ||
| ICL-2/rec-freq. | -0.019 | 0.0148 | -0.0339 (p=0.343) | 1.0 | 0.1516 | 0.1857 | 0.0778 | 0.1079 (p=0.553) | 5.0 | 0.784 | ||
| SSND | SSNR | SSND | SSNR | |||||||||
| Age-group | NSD | -shot/rand. | -0.0183 | 0.0 | -0.0183 (p=0.814) | 1.0 | 0.1576 | -0.0685 | -0.2857 | 0.2172 (p=0.666) | 6.0 | 0.9526 |
| ICL-/rand. | -0.0046 | 0.0476 | -0.0522 (p=0.573) | 0.6667 | 0.1673 | -0.0068 | 0.7857 | -0.7926 (p=0.137) | 6.0 | 0.8694 | ||
| ICL-/rand. | -0.0183 | 0.0476 | -0.0659 (p=0.226) | 1.0 | 0.1194 | 0.089 | -0.2857 | 0.3748 (p=0.094) | 4.0 | 0.5039 | ||
| -shot/freq. | -0.0228 | 0.0 | -0.0228 (p=0.228) | 1.0 | 0.1126 | -0.0959 | -0.1429 | 0.047 (p=0.784) | 5.0 | 0.575 | ||
| ICL-/freq. | -0.0091 | 0.0 | -0.0091 (p=0.483) | 0.6667 | 0.0778 | 0.0137 | 0.0 | 0.0137 (p=0.754) | 3.0 | 0.2615 | ||
| ICL-/freq. | -0.0091 | 0.0 | -0.0091 (p=0.658) | 1.3333 | 0.1232 | -0.0342 | 0.0 | -0.0342 (p=0.587) | 4.0 | 0.3762 | ||
| -shot/rec-freq. | 0.0411 | 0.0 | 0.0411 (p=0.072) | 1.0 | 0.1348 | 0.1781 | 0.1429 | 0.0352 (p=0.844) | 5.0 | 0.6549 | ||
| ICL-/rec-freq. | -0.0046 | 0.0952 | -0.0998 (p=0.340) | 1.0 | 0.1965 | -0.0068 | 0.3571 | -0.364 (p=0.357) | 6.0 | 0.8301 | ||
| ICL-/rec-freq. | -0.0046 | 0.0 | -0.0046 (p=0.976) | 1.3333 | 0.2737 | 0.0342 | -0.1429 | 0.1771 (p=0.708) | 5.5 | 0.881 | ||
| NCSD | -shot/rand. | 0.0 | -0.0046 | 0.0046 (p=0.954) | 1.3333 | 0.2024 | -0.2857 | -0.0548 | -0.2309 (p=0.702) | 6.0 | 1.1873 | |
| ICL-/rand. | 0.0 | -0.0365 | 0.0365 (p=0.812) | 1.3333 | 0.2821 | -0.2143 | -0.0685 | -0.1458 (p=0.737) | 5.0 | 0.8852 | ||
| ICL-/rand. | 0.0952 | -0.0228 | 0.1181 (p=0.108) | 1.3333 | 0.155 | -0.1429 | 0.0 | -0.1429 (p=0.407) | 6.0 | 0.5579 | ||
| -shot/freq. | 0.0476 | -0.0091 | 0.0568 (p=0.307) | 1.0 | 0.1533 | 0.4286 | 0.0753 | 0.3532 (p=0.451) | 6.0 | 0.9767 | ||
| ICL-/freq. | 0.0476 | -0.0091 | 0.0568 (p=0.312) | 1.3333 | 0.1629 | -0.1429 | 0.0685 | -0.2114 (p=0.259) | 6.0 | 0.7027 | ||
| ICL-/freq. | 0.0 | -0.0548 | 0.0548 (p=0.022) | 1.3333 | 0.1407 | 0.0 | -0.1507 | 0.1507 (p=0.134) | 6.0 | 0.5959 | ||
| -shot/rec-freq. | -0.1429 | 0.0183 | -0.1611 (p=0.159) | 1.3333 | 0.211 | -0.3571 | 0.0822 | -0.4393 (p=0.309) | 5.0 | 0.8432 | ||
| ICL-/rec-freq. | 0.0 | 0.0183 | -0.0183 (p=0.418) | 1.0 | 0.1345 | 0.0 | -0.0342 | 0.0342 (p=0.703) | 6.0 | 0.5374 | ||
| ICL-/rec-freq. | 0.0 | -0.032 | 0.0320 (p=0.835) | 1.6667 | 0.2916 | -0.1429 | -0.0685 | -0.0744 (p=0.874) | 5.0 | 0.8751 |
Consumer Side Fairness: Sensitive Ranker Fairness Assessment
For NSD and NCSD, we adopt a benefit deviation approach () to measure disparities in recommendations when sensitive attributes are considered.
The evaluation proceeds through the following steps:
- :
-
Compilation of Recommendations: We obtain the top-K recommendations from , our main recommender that displays sensitive attributes (i.e., ) and from , our reference recommender that serves as a neutral baseline (i.e., );
- :
-
Similarity and Deviation Assessment: We define the hit rate and the average rank to measure the alignment of recommendations of a ranker in question (that is, ) with the ground truth of user preferences:
(6) (7) where represents the set of items in the ground truth preferences of the target user, denotes the rank of item within , and is the number of top recommendations considered. These measures provide an indication of recommendation relevance and ranking accuracy and are used based on the fairness notions (NSD, SCSD) to determine which recommender is providing more relevant recommendations.
- :
-
Fairness Quantification: Fairness is quantified using the Sensitive-to-Neutral Similarity Range (SNSR) and the Sensitive-to-Neutral Similarity Variance (SNSV), which are derived from the benefit deviations:
(8) (9) where denotes the set of all possible values of the studied sensitive attribute. For example, if , then represents the benefit deviation when comparing the hit rate of recommendations for the Male group against their ground truth preferences, and would represent the same for the Female group. The benefit deviation for a particular value quantifies the disparity between the recommendation of the sensitive ranker for group and the ground truth preferences. then is the mean benefit deviation across both groups, providing an overall measure of the deviation for the sensitive attribute .
- :
-
Results Interpretation: A high SNSR or SNSV value indicates a significant potential for bias. Such findings are critical for identifying and addressing areas within the RecLLM that may lead to unfair treatment of various user groups.
Consumer Side Fairness: Intrinsic Fairnes
As stated in Section 2.2, Intrinsic Fairness (IF) evaluates the fairness of recommendation distributions from a neutral ranker, , focusing on benefits Hit Rate (HR) and Average Rank (AR) across various demographic groups such as male and female. To ensure statistical robustness, a bootstrapping methodology is employed, which involves repeatedly sampling from the data. This process can be formalized as follows: for each bootstrap replicate, we sample data points with replacement from the original dataset and compute the sample mean . This is repeated times to form a distribution of sample means, which helps quantify the variability of benefits and uses statistical t-tests to assess the significance of differences between groups. By integrating IF with these statistical methods, our approach rigorously quantifies and assesses the fairness of recommendations in various settings, providing a scientifically grounded analysis.
Setup. In our study, we focus on two main datasets from the movie and music sectors: MovieLens 1M and LastFM-1K. These datasets are widely recognized in the academic community, providing a basis for evaluating our models in terms of fairness across different types of media consumption data.
Our approach involves a sequential recommendation task where we employ timestamps to ensure the data is split temporally. Initially, we randomly select a subset of 80 users who exhibit a moderate level of interaction within the datasets. This allows us to handle the data efficiently while ensuring that the users selected have enough interactions to inform the training process but are not so many as to skew the representativeness of typical user behavior. The data for these users is then divided into training and test sets by sorting their interactions over time and splitting them such that 80% of a user’s interactions are used for training, with the remaining 20% held out for testing. This method respects the chronological order of interactions, thereby simulating a realistic scenario where a model can only learn from past data to make predictions about future user behavior.
| Dataset / Statistic | Training Data | Testing Data | ||||
| LastFM |
|
|
||||
| MovieLens |
|
|
5. Result and Discussion
This section provides a detailed analysis of the fairness metrics related to gender and age-group within RecLLMs, based on evaluations of Hit Rate (HR) and Average Rank (AR). The assessment draws from color-coded tables, highlighting statistically significant deviations and trends.
5.1. Fairness involving sensitive attributes
In this section, we describe the outcomes of the NSD and NCSD, as detailed in Section 2.2.
Gender-Based Analysis
In examining the fairness metrics, our analysis reveals minor gender disparities in scenarios such as the -shot/random sampling where for males and for females. This results in a difference with a p-value of 0.730, indicating a lack of statistical significance. However, the Neutral vs. Counterfactual Sensitive Deviation (NCSD) under the -shot/rec-frequent sampling illustrates more pronounced issues, with a significant deviation of (p=0.062). This suggests potential fairness concerns when gender attributes are hypothetically modified.
The impact of sampling and ICL styles on gender-related fairness outcomes is substantial. For instance, the rec-frequent sampling method in NCSD scenarios demonstrates increased fairness concerns, potentially due to the combined influence of recent and frequent interactions on the recommendations. Additionally, augmenting the ICL process from -shot to ICL-2 leads to fluctuations in values, which underscores how introducing more contextual examples can alter fairness outcomes.
Age-Group-Based Analysis
Age-group analysis similarly shows significant deviations in some scenarios. For example, in NCSD, particularly under the ICL-2/rand sampling, the deviation reaches (p=0.108), highlighting fairness issues when assuming a hypothetical uniform age attribute across the user base.
The consistency of SSNR and SSNV values across both sensitive attributes provides further validation of these findings. Higher SSNR values generally correlate with larger deviations in values, affirming the importance of the neutral ranker in identifying potential biases. This correlation supports the observed disparities and emphasizes the impact of methodological choices on fairness metrics.
5.2. Intrinsic Fairness in Recommender Systems
Based on the data presented in Table 4, we notice significant fairness issues in attribute-unaware scenarios, particularly in contexts where certain demographic groups dominate. For example, in the random sampling scenarios, females consistently achieve higher HR (Hit Rate) values than males, with a notable difference of -0.0903 in the ICL-1 setting. This trend suggests that fairness is often in favor of females, possibly due to algorithmic biases or the dominance of content that appeals more to this group.
Conversely, in the recent-frequent sampling settings, males tend to have higher HR values, indicating a reversal in bias. For instance, in the 0-shot/recent-frequent setting, the difference swings to a positive 0.0939 in favor of males. Similar patterns are observed with age groups, where the ’Old’ group tends to outperform the ’Young’ group in random scenarios, as shown by a -0.0892 difference in the ICL-1/random setting.
These disparities suggest that the recommendation algorithms may be amplifying existing preferences or biases inherent in the dataset. The analysis indicates that strategies such as altering sampling methods or integrating corrective algorithms could be essential in mitigating these biases. For instance, introducing more balanced or diverse content representation in the training data could help reduce the unfair advantage observed in certain groups.
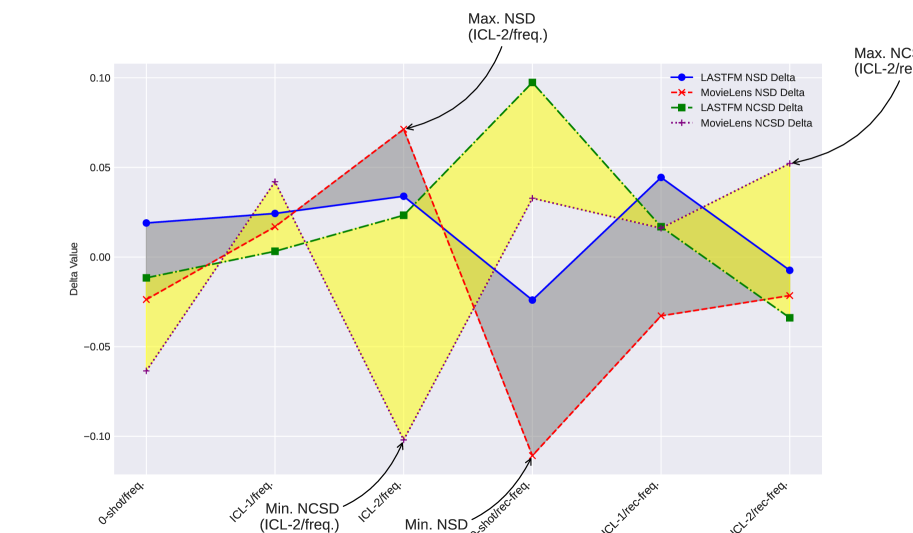
To compare the results and draw conclusions with other datasets, we also analyze the chart presented in Figure 2. This chart compares the fairness metrics between two datasets – MovieLens and LastFM–across various scenarios. We observe distinct patterns in how each dataset behaves under different conditions. The chart plots the delta values of Neutral vs. Sensitive Deviation (NSD) and Neutral vs. Counterfactual Sensitive Deviation (NCSD) for both datasets. The highlighted yellow region for MovieLens and the gray for LastFM indicate the variance in fairness measures particularly in scenarios involving intrinsic and counterfactual attributes. Notably, MovieLens shows a peak in NSD during the ICL-2/frequent scenario, suggesting a significant disparity when sensitive attributes are explicitly considered. LastFM, contrastingly, exhibits its maximum NSD under similar conditions but with less amplitude, implying a possibly more balanced handling of sensitive attributes but still showing notable variance. The analysis of these trends indicates that the impact of sensitive attributes on recommendation fairness varies significantly between different types of media content and user interactions, highlighting the complexity of achieving fairness in recommender systems.
| HR | |||
| Male | Female | Difference | |
| 0-shot/random | 0.1492 | 0.1822 | -0.0330 |
| ICL-1/random | 0.1401 | 0.2304 | -0.0903 |
| ICL-2/random | 0.1610 | 0.1984 | -0.0374 |
| 0-shot/frequent | 0.2015 | 0.2089 | -0.0074 |
| ICL-1/frequent | 0.1320 | 0.1781 | -0.0461 |
| ICL-2/frequent | 0.1166 | 0.2000 | -0.0834 |
| 0-shot/recent-frequent | 0.2638 | 0.1699 | 0.0939 |
| ICL-1/recent-frequent | 0.2230 | 0.1328 | 0.0902 |
| ICL-2/recent-frequent | 0.2394 | 0.1724 | 0.0670 |
| Young | Old | Difference | |
| 0-shot/random | 0.1478 | 0.1795 | -0.0317 |
| ICL-1/random | 0.1399 | 0.2291 | -0.0892 |
| ICL-2/random | 0.1643 | 0.2001 | -0.0358 |
| 0-shot/frequent | 0.1997 | 0.2084 | -0.0087 |
| ICL-1/frequent | 0.1337 | 0.1793 | -0.0456 |
| ICL-2/frequent | 0.1190 | 0.1989 | -0.0799 |
| 0-shot/recent-frequent | 0.2672 | 0.1699 | 0.0973 |
| ICL-1/recent-frequent | 0.2236 | 0.1314 | 0.0922 |
| ICL-2/recent-frequent | 0.2339 | 0.1744 | 0.0595 |
6. Conclusion
This paper introduces a novel framework for the evaluation of Large Language Models (LLMs) in recommender systems, using ChatGPT and two datasets on music and movie domains, for sequential recommendation tasks as a case study. Our work significantly advances the discussion in the field by providing a tangible method to quantify fairness based on underlying benefits. This approach allows for a more nuanced understanding of how recommender systems perform across different user demographics and behavioral patterns.
We further validate our results across these datasets, focusing on the Neutrality vs. Sensitive Deviation (NSD) and Neutrality vs. Counterfactual Sensitive Deviation (NCSD) metrics. These metrics revealed that while there are some scenarios where sensitive attributes do not significantly impact recommendations, other cases exhibit notable biases. For example, NCSD analysis showed that hypothetical modifications of gender and age can lead to substantial shifts in recommendation patterns. Overall, our study illustrates that while explicit fairness issues under changes in sensitive attributes are rare, intrinsic fairness problems persist, which can be presumably attributed to the overrepresentation or underrepresentation of certain groups within the dataset. This highlights the need for ongoing adjustments and refinements in recommender system strategies to better serve diverse user tastes and preferences.
References
- (1)
- Amigó et al. (2023) Enrique Amigó, Yashar Deldjoo, Stefano Mizzaro, and Alejandro Bellogín. 2023. A unifying and general account of fairness measurement in recommender systems. Information Processing & Management 60, 1 (2023), 103115.
- Boratto et al. (2022) Ludovico Boratto, Gianni Fenu, Mirko Marras, and Giacomo Medda. 2022. Consumer fairness in recommender systems: Contextualizing definitions and mitigations. In European Conference on Information Retrieval. Springer, 552–566.
- Deldjoo and Di Noia (2024) Yashar Deldjoo and Tommaso Di Noia. 2024. CFaiRLLM: Consumer Fairness Evaluation in Large-Language Model Recommender System. arXiv preprint arXiv:2403.05668 (2024).
- Deldjoo et al. (2024) Yashar Deldjoo, Dietmar Jannach, Alejandro Bellogin, Alessandro Difonzo, and Dario Zanzonelli. 2024. Fairness in recommender systems: research landscape and future directions. User Modeling and User-Adapted Interaction 34, 1 (2024), 59–108.
- Ekstrand et al. (2012) Michael D Ekstrand, Anubrata Das, Robin Burke, and Fernando Diaz. 2012. Fairness in recommender systems. In Recommender systems handbook. Springer, 679–707.
- Jiang et al. (2024) Meng Jiang, Keqin Bao, Jizhi Zhang, Wenjie Wang, Zhengyi Yang, Fuli Feng, and Xiangnan He. 2024. Item-side Fairness of Large Language Model-based Recommendation System. arXiv preprint arXiv:2402.15215 (2024).
- Kırnap et al. (2021) Ömer Kırnap, Fernando Diaz, Asia Biega, Michael Ekstrand, Ben Carterette, and Emine Yilmaz. 2021. Estimation of fair ranking metrics with incomplete judgments. In Proceedings of the Web Conference 2021. 1065–1075.
- Li et al. (2023b) Xinyi Li, Yongfeng Zhang, and Edward C Malthouse. 2023b. Exploring fine-tuning chatgpt for news recommendation. arXiv preprint arXiv:2311.05850 (2023).
- Li et al. (2021) Yunqi Li, Hanxiong Chen, Zuohui Fu, Yingqiang Ge, and Yongfeng Zhang. 2021. User-oriented fairness in recommendation. In Proceedings of the web conference 2021. 624–632.
- Li et al. (2023a) Yunqi Li, Hanxiong Chen, Shuyuan Xu, Yingqiang Ge, Juntao Tan, Shuchang Liu, and Yongfeng Zhang. 2023a. Fairness in recommendation: Foundations, methods, and applications. ACM Transactions on Intelligent Systems and Technology 14, 5 (2023), 1–48.
- Spurlock et al. (2024) Kyle Dylan Spurlock, Cagla Acun, Esin Saka, and Olfa Nasraoui. 2024. ChatGPT for Conversational Recommendation: Refining Recommendations by Reprompting with Feedback. arXiv preprint arXiv:2401.03605 (2024).
- Vats et al. (2024) Arpita Vats, Vinija Jain, Rahul Raja, and Aman Chadha. 2024. Exploring the Impact of Large Language Models on Recommender Systems: An Extensive Review. arXiv preprint arXiv:2402.18590 (2024).
- Zhang et al. (2023) Jizhi Zhang, Keqin Bao, Yang Zhang, Wenjie Wang, Fuli Feng, and Xiangnan He. 2023. Is chatgpt fair for recommendation? evaluating fairness in large language model recommendation. In Proceedings of the 17th ACM Conference on Recommender Systems. 993–999.