Multispectral Fine-Grained Classification of Blackgrass in Wheat and Barley Crops
Abstract
As the burden of herbicide resistance grows and the environmental repercussions of excessive herbicide use become clear, new ways of managing weed populations are needed. This is particularly true for cereal crops, like wheat and barley, that are staple food crops and occupy a globally significant portion of agricultural land. Even small improvements in weed management practices across these major food crops worldwide would yield considerable benefits for both the environment and global food security. Blackgrass is a major grass weed which causes particular problems in cereal crops in north-west Europe, a major cereal production area, because it has high levels of of herbicide resistance and is well adapted to agronomic practice in this region. With the use of machine vision and multispectral imaging, we investigate the effectiveness of state-of-the-art methods to identify blackgrass in wheat and barley crops. As part of this work, we provide a large dataset with which we evaluate several key aspects of blackgrass weed recognition. Firstly, we determine the performance of different CNN and transformer-based architectures on images from unseen fields. Secondly, we demonstrate the role that different spectral bands have on the performance of weed classification. Lastly, we evaluate the role of dataset size in classification performance for each of the models trialled. We find that even with a fairly modest quantity of training data an accuracy of almost 90% can be achieved on images from unseen fields.
1 Introduction
Weeds compete with crops for light, water and nutrients. Additionally, grains from grass weeds get harvested alongside grains from the crop, contaminating the harvest, and can drastically lower the price received for the crop. Current mainstream weed management practices involve broadcast spraying, where the entire field is sprayed with a selective herbicide. An alternative approach, known as precision spraying, targets herbicide only at areas of weed cover guided by machine vision. Precision spraying facilitates up to 95% reduction in herbicide use (depending on crop and field) [92], and a proportional decrease in herbicide costs and environmental damage from runoff. In addition, precision spraying allows a wider range of herbicides (potentially broad spectrum) to be used, opening more options for resistance management [9]. Meanwhile, other technologies, like automated camera-guided mechanical weeding, promise non-chemical weed control. Both of these promising technologies are predicated on accurate, real-time weed recognition within often complex crop canopies.
Efforts to reduce herbicide usage in staple cereal crops have the potential to deliver significant impact. The area of global cropland devoted to growing cereals, and in particular rice, wheat and maize, is orders of magnitude greater than that of many vegetable crops [25]. Furthermore, wheat is second only to rice as a global staple [21], with a global consumption of 65.6 kg per person per year. Therefore, not only is sustainable and reliable crop care for wheat critical for global food security, any technology that reduces herbicide usage in these global staples has the potential to massively reduce the environmental impact of herbicide use globally.
Moreover, particular weeds present a greater threat to global food supply than others; grass weeds are a particular problem in wheat production due to their biological similarities [11, 91, 51, 35]. In Europe, blackgrass is one of the most economically damaging weeds [82], so effective strategies to manage populations are a priority. Due to high levels of resistance to selective herbicides [35], using them for precision spraying may not be sufficient to control blackgrass populations. In these instances, precision spraying with non-selective herbicides could be an alternative approach, but requires a high degree of confidence in detection and targeting so as not to damage the crop. Such confidence will rely on well tested, accurate, real time machine vision systems that can be deployed at scale to the field.
2 Background
We start by reviewing the relevant research. First we look at how the variety of color spaces have been used in the research to date, and secondly, how those color spaces, along with other features, have been used to recognise weeds. Lastly, we systematically evaluate all recent research on weed recognition in wheat and barley to understand on which weed species research effort has been focused.
2.1 Color Spaces for Weed Recognition
Initially, color indices derived from RGB like Excess Greenness (ExG), Excess Redness (ExR), ExG minus ExR (ExGR) and Normalized Difference Index (NDI) were used in weed recognition research [38]. Multispectral imaging for crop and weed discrimination is now an active area of research. There is an existing precedent for the use of multispectral imaging in plant analysis since the Normalized Difference Vegetation Index (NDVI) [66], derived from near-infrafed (NIR) and red light, has long been used in agriculture to assess crop health. Studies trialling different combinations of NIR, Red and NDVI as inputs to a convolutional neural network (CNN) to detect weeds in sugar beet fields found that NIR and Red values used together performed the best when identifying weeds [67, 62]. Interestingly, including NDVI as an input, alongside NIR and Red values, did not improve the performance [67, 62]. With the use of hyperspectral cameras, it was found that increasing the number of bands from 3 up to 61 resulted in incremental improvements in weed species classification accuracy [27]. In a study where several color indices where trialled, the inclusion of NIR information either alone, or alongside other indices like ExG and NDI, significantly improved the segmentation accuracy [84].
2.2 Weed Recognition Techniques
Early research into techniques for weed recognition relied on hand-crafted feature-based techniques. Approaches to discriminating grass weeds in cereal crops use color [6], texture [89], depth [89] and spectral [5, 38] features. For weed classification, support vector machine (SVM) [13] and k-Nearest Neighbor (k-NN) [12] approaches were used to learn decision boundaries in the feature space [89].
Deep learning-based weed classification rose to prominence after the success of early CNN architectures like AlexNet [41] and VGG [71]. However, ResNet [34] improved the applicability of this technology by utilising skip connections to address the vanishing gradient problem, which enabled the training of deeper neural networks, resulting in improved performance and convergence. In the following years, deep learning-based methods with faster inference speeds and smaller memory footprints enabled weed recognition on the edge, like the popular MobileNetV3 architecture, which exploits lightweight depthwise separable convolutions for improved efficiency [36]. EfficientNet employed a neural architecture search approach to design a network and a novel method to scale the model depth, width, and resolution of the network in order to balance accuracy and efficiency[77]. Recently, transformers have demonstrated how powerful self-attention mechanisms can be for recognizing complex patterns in sequential data [83]. Vision Transformer (ViT) [16] applied transformer technology to image classification by treating an image as a sequence of patches, which were then linearly embedded and processed through a transformer architecture. The self-attention mechanism in transformers allowed ViT to analyze global contextual information, improving performance on various image classification benchmarks.
ResNet, MobileNetV3 and MobileViT [48] — a compact version of ViT — demonstrated strong performance in weed classification in wheat [1]. Deep learning-based object detection techniques, that identify the region where an object is located in an image, have been used to detect grass weeds in wheat crops including using DetectNet [18], SSD [19], Faster R-CNN [88, 90]. Additionally, there is work segmenting grass species, such as ryegrass, using an adapted ERFNet [75], as well as green foxtail and horsetail using an adapted U-Net network [94].
2.3 Prevalence of Grass Weed Recognition in Cereal Crops
We systematically reviewed the latest machine vision research on wheat and barley crops and identified that grass weeds are understudied compared to broadleaf weeds. Grass weeds are more challenging to distinguish from cereal crops (which are themselves grass species). Papers were identified in Google Scholar and Scopus using search query “weed identification” OR “weed recognition” OR “weed discrimination” OR “weed detection” OR “weed classification” OR “weed segmentation” on 20th October 2023. All publications from recognised, peer-reviewed, English-language journals and conference venues that could be accessed were included. For this analysis, we are only interested in weed detection in wheat and barley crops, so excluding all other weed detection papers we found a total of 79 papers.
Our analysis of the distribution of weeds species used in weed recognition papers in wheat and barley crops is shown in Figure 1. Each weed species from each paper is added to the cumulative total for that species. The weed species are divided into eudicots (broadleaf plants) and monocots (grasses). While the common names are used in the figure, the full list of papers categorised by weeds, along with their Latin names, is available in Appendix A.
Figure 1 shows that broadleaf weeds have garnered more research interest than grass weeds. One possible explanation for this discrepancy is how challenging weed recognition is in grass weeds compared to broadleaf weeds. Grass crops also present a high level of challenge compared to broad leaf crops as they occlude one another, as well as any weeds in the field, even at relatively early growth stages. By contrast, many broadleaf crops remain spaced out, display distinctive features, for example distinctive color and leaf shape, at early growth stages. Additionally, many grass crops look very similar to other grass plants. Distinguishing between grass species is an example of fine-grained visual classification [47]. This is a subgroup of classification tasks that aims to distinguish between similar examples based on some subcategory like plant species or car model. Moreover, like with the classification of medical images, another fine-grained visual classification task, experts are required to produce ground-truth images — adding to the cost of producing a dataset. Therefore, grass weed recognition in cereal crops has some of the same challenges as medical imaging domains when it comes to building datasets.

An early contribution to the field of deep learning for weed detection in wheat was the Plant Seedling Classification dataset [31]. This dataset contained images of crops including wheat, maize and sugar beet along with 9 common weed species including blackgrass. Over a third of the papers on wheat/weed recognition reviewed for this survey carried out experiments on the Plant Seedling Classification dataset [10, 8, 20, 39, 23, 30, 57, 72, 80, 22, 24, 26, 50, 70, 81, 14, 42, 43, 52, 63, 74, 78, 7, 15, 32, 49, 53]. This dataset has made a great contribution to the field by drawing attention to the problem of crop and weed discrimination for crops that are critical to the world’s food supply. However, using this dataset does not enable an evaluation of in-field crop and weed discrimination.
The rest of the wheat papers use in-field images of wheat and weeds. A few papers explore the problem of weed detection in mature wheat crops using both color features [60] and LiDAR [69]. Most of the others attempt to detect weeds at an early stage. Many of these focused solely on broadleaf weeds [55, 1, 40, 93, 4, 2, 3, 90] which are easier to distinguish in grass crops than grass weeds. Some of the work discriminating grasses, hand-crafted approaches using color [6], texture [89], depth [89] and spectral [5, 38] features were implemented. In this work, we focus on using deep learning-based approaches as they have been shown to be more robust to changes in illumination and occlusion.
2.4 Paper Overview
To facilitate evaluating agricultural vision systems on in-context, in-field data, we present a weed image data set featuring wheat and barley of over 15,000 images across 51 fields in the UK, with and without blackgrass — a grass weed of cereal crops. This dataset is comparable in scale to the seminal Plant Seedling Classification dataset [31]. The visual similarity of blackgrass to cereal crops poses a challenging fine-grained classification task for precision weed management technology. The release of this dataset will accelerate the development of weed detection systems for black-grass, and due to their visual similarity, other grass weeds, for wheat, a critical global staple.
The contributions of this paper are as follows:
-
•
A dataset containing over 15,000 multispectral images of wheat and blackgrass stratified by field, season, geo-location and soil-type, enabling the study of domain generalisation with respect to these factors;
-
•
An evaluation the effect of using different spectral bands for blackgrass classification; and
-
•
An assessment of the effect of training data quantity on model performance providing guidelines for future dataset building.
3 Materials and Methods
In this section, we first present our dataset of blackgrass in wheat and barley crops. We then outline our detection approach including architectures, experiments, training settings and evaluation methods.
3.1 Dataset
The dataset111The dataset will be made publicly available upon acceptance. consists of images of blackgrass in wheat and barley crops collected from 51 fields across eight different soil types in the east of England, a key grain growing region of the UK, between 3rd November 2020 and 16th October 2021. An average of 300 images was taken from each field. The majority of fields had more than 100 images both with and without blackgrass, however, seven fields only had ‘blackgrass’ images and four fields only had ‘no blackgrass’ images. As shown in Table 1, the images were split into by field so that there is approximately a 80-10-10 split for training, validation and test sets. The aim of this stratification is to ensure that each model’s ability to generalise to unseen fields is assessed. Table 2 shows how many images are in each set according class, crop type and season. Care was taken to ensure the sets were balanced in terms of positive and negative examples as well as to ensure each set contain some images from each stage in the season and each crop type.
| Dataset | Number of Fields |
|---|---|
| Train | 37 |
| Validation | 8 |
| Test | 6 |
| Train | Validation | Test | Total | ||
|---|---|---|---|---|---|
| Class | Blackgrass | 5770 | 1023 | 1095 | 7888 |
| dashed]2-6 | No Blackgrass | 5982 | 1036 | 1023 | 8041 |
| Crop Type | Winter Wheat | 9425 | 1731 | 1569 | 12725 |
| dashed]2-6 | Spring Barley | 542 | 123 | 372 | 1037 |
| dashed]2-6 | Winter Barley | 1613 | 205 | 177 | 1995 |
| Season | Early | 3631 | 335 | 583 | 4549 |
| dashed]2-6 | Mid | 4571 | 841 | 1166 | 6578 |
| dashed]2-6 | Late | 3550 | 883 | 369 | 4802 |
Land managers were consulted to find patches of blackgrass in wheat and barley fields. Images of class ‘no blackgrass’ were taken near the blackgrass patches. Fields with a good number of blackgrass patches were re-visited to collect images at different growth stages of the crop and blackgrass. Blackgrass class was assessed at the time of image collection by the same observer for all images across all fields to maximise the number of images collected. The dataset therefore only has image level labels.
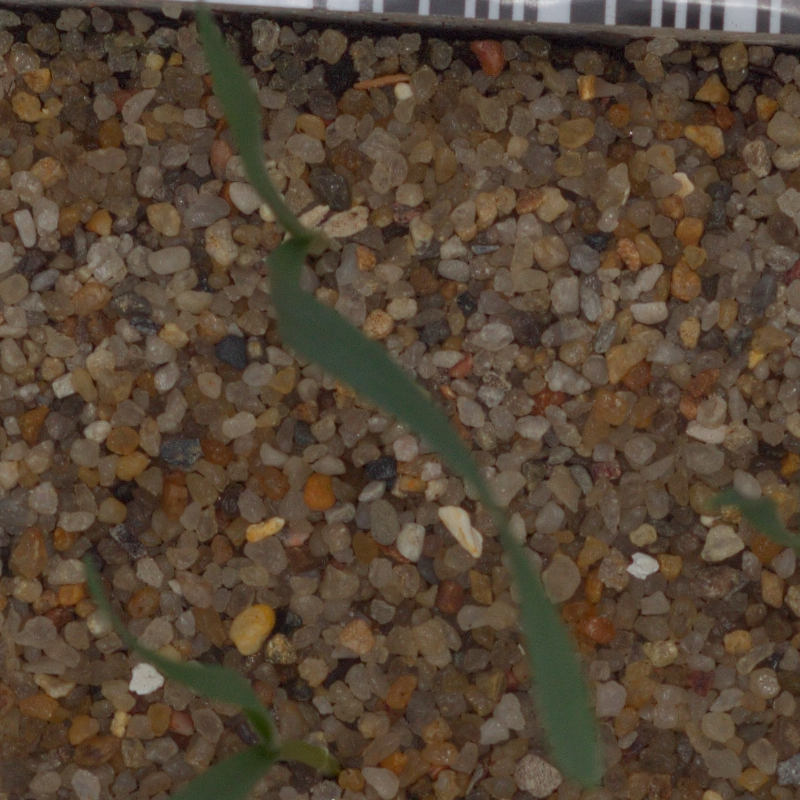
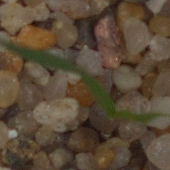
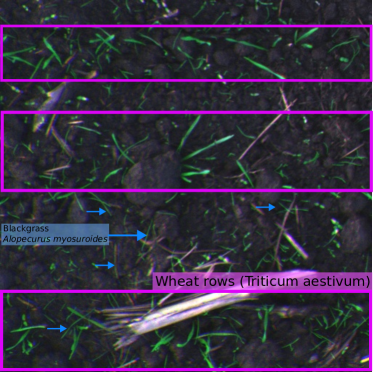
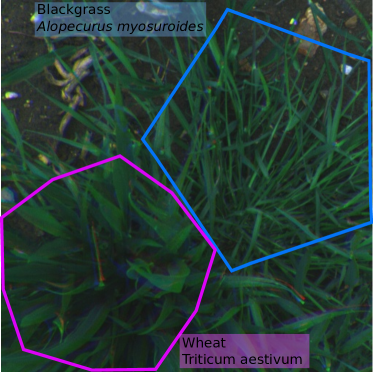
Figures 3(a) and 3(b) are example images from the early growing season (November to January) where the crop plants were well separated and blackgrass was present in short, singular, thin blades. Figures 3(c) and 3(d) are from February on-wards where the crop canopy exposes less bare soil and the individual blackgrass blades developed into a bushier structure.


For each field, the soil type in that field was categorised according to the Cranfield Soil and Agrifood Institute’s Soilscapes databases [73]. Due to the geography of the farms that were visited, there were no fields visited that contained predominantly peat, or predominantly chalky soil. Table 3 describes each soil type in the dataset and shows the break down of images with each soil type in each of the dataset splits. Note that, due to prioritising a stratification based on geo-location, it was not possible to have every soil type represented in each dataset split.
| Soil Type | Description | Train | Validation | Test | Total |
|---|---|---|---|---|---|
| Type 1 | Free draining lime-rich loamy | 379 | 0 | 0 | 379 |
| Type 2 | Free draining, base-rich, slightly acidic loamy | 497 | 0 | 581 | 1078 |
| Type 3 | Wet slightly acidic loamy and clayey | 489 | 0 | 492 | 981 |
| Type 4 | Wet lime-rich loamy and clayey | 1724 | 0 | 0 | 1724 |
| Type 5 | Acidic sandy and loamy | 0 | 0 | 0 | 0 |
| Type 6 | Base-rich loamy and clayey, wet | 1444 | 214 | 0 | 1658 |
| Type 7 | Loamy and clayey wet | 6204 | 1101 | 197 | 7502 |
| Type 8 | Wet loamy and sandy, peaty surface | 1015 | 744 | 848 | 2607 |
3.2 Neural Network Architectures
For this study, we choose ResNet-50, EfficientNet B4 and Swin-B as the representative architectures for the benchmarks. They are detailed in Table 4. ResNet [34] introduced residual learning by incorporating skip connections, enabling the training of very deep neural networks. Despite being the oldest of the architectures, it is still widely used, due to its training efficiency and accuracy. EfficientNet [77] improved image classification on ImageNet by optimizing for network size and computational efficiency using a neural architecture search approach. This was selected as another popular choice of CNN architecture but more explicitly designed for computational efficiency than ResNet. Given, the recent interest in transformers for machine vision, we chose the Swin Transformer [46] which improved on Vision Transformer (ViT) by introducing a hierarchical architecture that processes images at multiple scales in an efficient manner. This hierarchical design facilitated capturing both local and global features effectively, addressing the limitations of the single-level processing in ViT.
| Model | Params | GFLOPS | ImageNet Acc@1 | ImageNet Acc@5 |
| Resnet 50 | 25.6M | 4.09 | 76.13 | 92.86 |
| Efficient Net B4 | 19.3M | 4.39 | 83.38 | 96.59 |
| Swin B | 87.8M | 15.43 | 83.58 | 96.64 |
3.3 Experiments
Using these models, we perform the following experiments on our dataset:
-
•
Baseline Models We establish baseline results for our dataset on our selected models. Furthermore, we examine the performance on each of the separate fields in the test to understand the strengths and weaknesses of the models in different environments.
-
•
Spectral Band Importance To gain insight into the role of each spectral band, the models were trained on all the combinations of spectral bands in the dataset.
-
•
Training Data Quantity Experiment To assess the significance of the training data quantity for each tested model, we evaluated them on subsets containing 25%, 50%, and 75% of the training data. These subsets were generated through random sampling from all training images across fields; maintaining the original proportion of positive and negative samples from the entire dataset.
3.4 Training Settings
The models were trained on an Nvidia GeForce RTX 2020 Ti. The initial weights for each model were taken from Pytorch’s version of the models pretrained on ImageNet. Since these models were trained on RGB input, the NIR and red edge channels were set to the pretrained weights for the red channel from these models. Each model was trained for 50 epochs. The model with the highest accuracy on the validation set is selected. The optimizer was stochastic gradient descent (SGD) [64]. The initial learning rate was 0.001 and this was decayed to 0.0001 using cosine annealing. The batch size used was 4. Cross entropy loss, also known as log loss, was used as the objective function to train the models. The training settings outlined were determined empirically.
3.5 Evaluation
In order to give a comprehensive overview of evaluation of a classification model’s performance, we use accuracy, precision, recall and MCC. Since the dataset is mostly balanced, accuracy gives a general overview of the quality of predictions. Accuracy represents that total fraction of correct predictions made by the model and is calculated as follows:
| (1) |
where is the total number of true positives, is the total true negatives, is the total false positives and is the total false negatives.
Additionally, precision and recall with respect to the blackgrass class offers insights into the model’s ability to correctly identify positive instances and capture all relevant positive instances, respectively. Precision is the fraction of positive predictions that are correctly predicted and is calculated as follows:
| (2) |
While recall is the fraction of the positive class present in the dataset correctly predicted by the model and is calculated as follows:
| (3) |
Matthews Correlation Coefficient (MCC) is another way to assess if the quality of binary classification predictions is robust to class inbalances in the dataset. While our dataset is mostly balanced, this metric allows us to account for the slight difference in class balance. Additionally, it will enable a comparison with work published on unbalanced datasets. MCC produces values between -1 and 1 where 1 indicates perfect prediction, 0 indicates a random prediction and -1 means a perfectly inverse prediction. MCC is calculated as follows:
| (4) |
For each of these metrics, we report the mean and 2 standard deviations of 5 training runs each with different random seeds.
4 Results
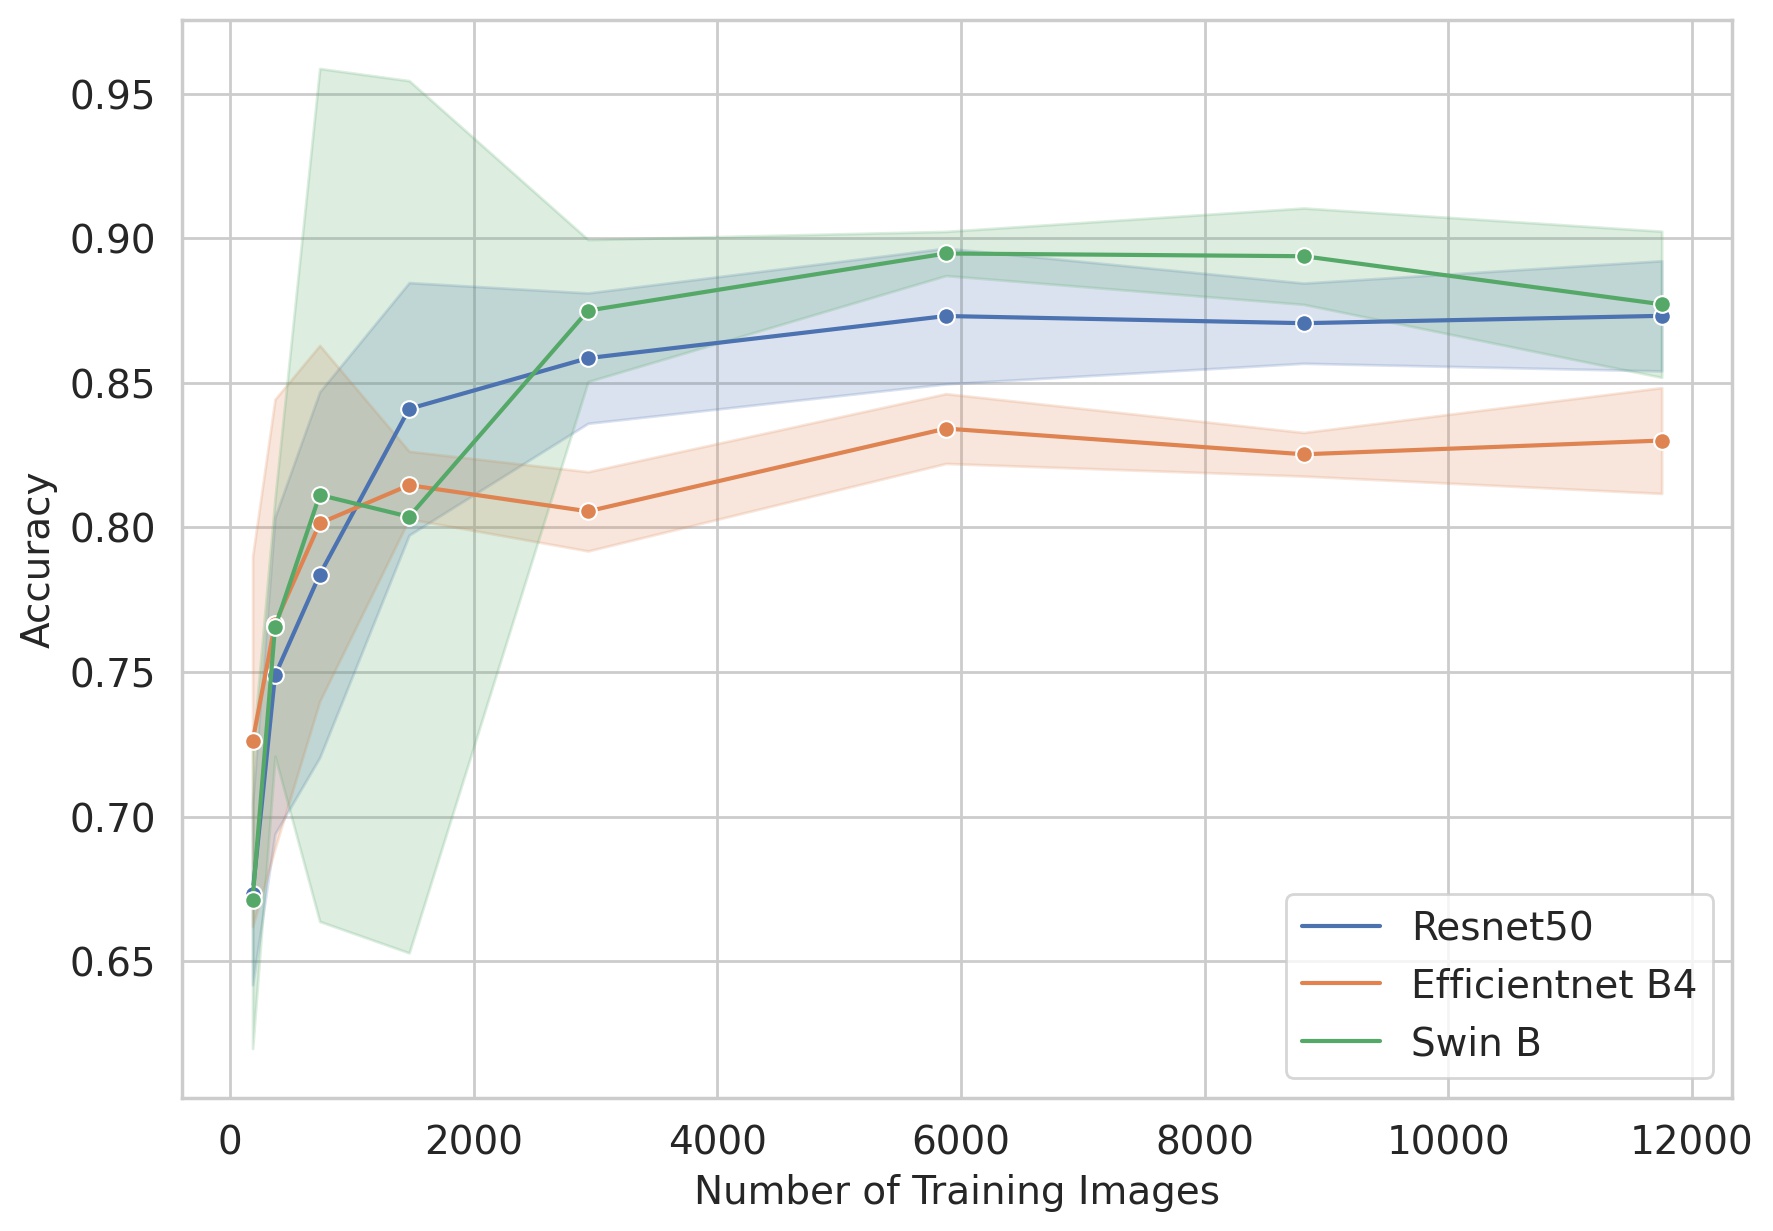
Table 5 shows the accuracy, MCC, precision and recall. Figure 4 shows the accuracy for each model on each of the different fields in the test sets. Figure 5 shows the accuracy of ResNet-50 trained on every combination of spectral band. Figure 6 shows the how the accuracy changes as the number of training images increases.
| Model | Accuracy | MCC | Precision | Recall |
|---|---|---|---|---|
| ResNet 50 | ||||
| Efficient B4 | ||||
| Swin B |
Table 5 shows that all models achieved an accuracy greater than 0.8. Swin B has the highest accuracy with 0.877, however, ResNet 50 performs only slightly worse with 0.873. EfficientNet B4 performs less well than the other two models with only 0.83. The models rank the same according to MCC.
Figure 4 shows that the performance of the models varied considerably between the different fields. Mostly, models performed worse on barley compared with wheat and worse on midseason crops compared to late season crops.
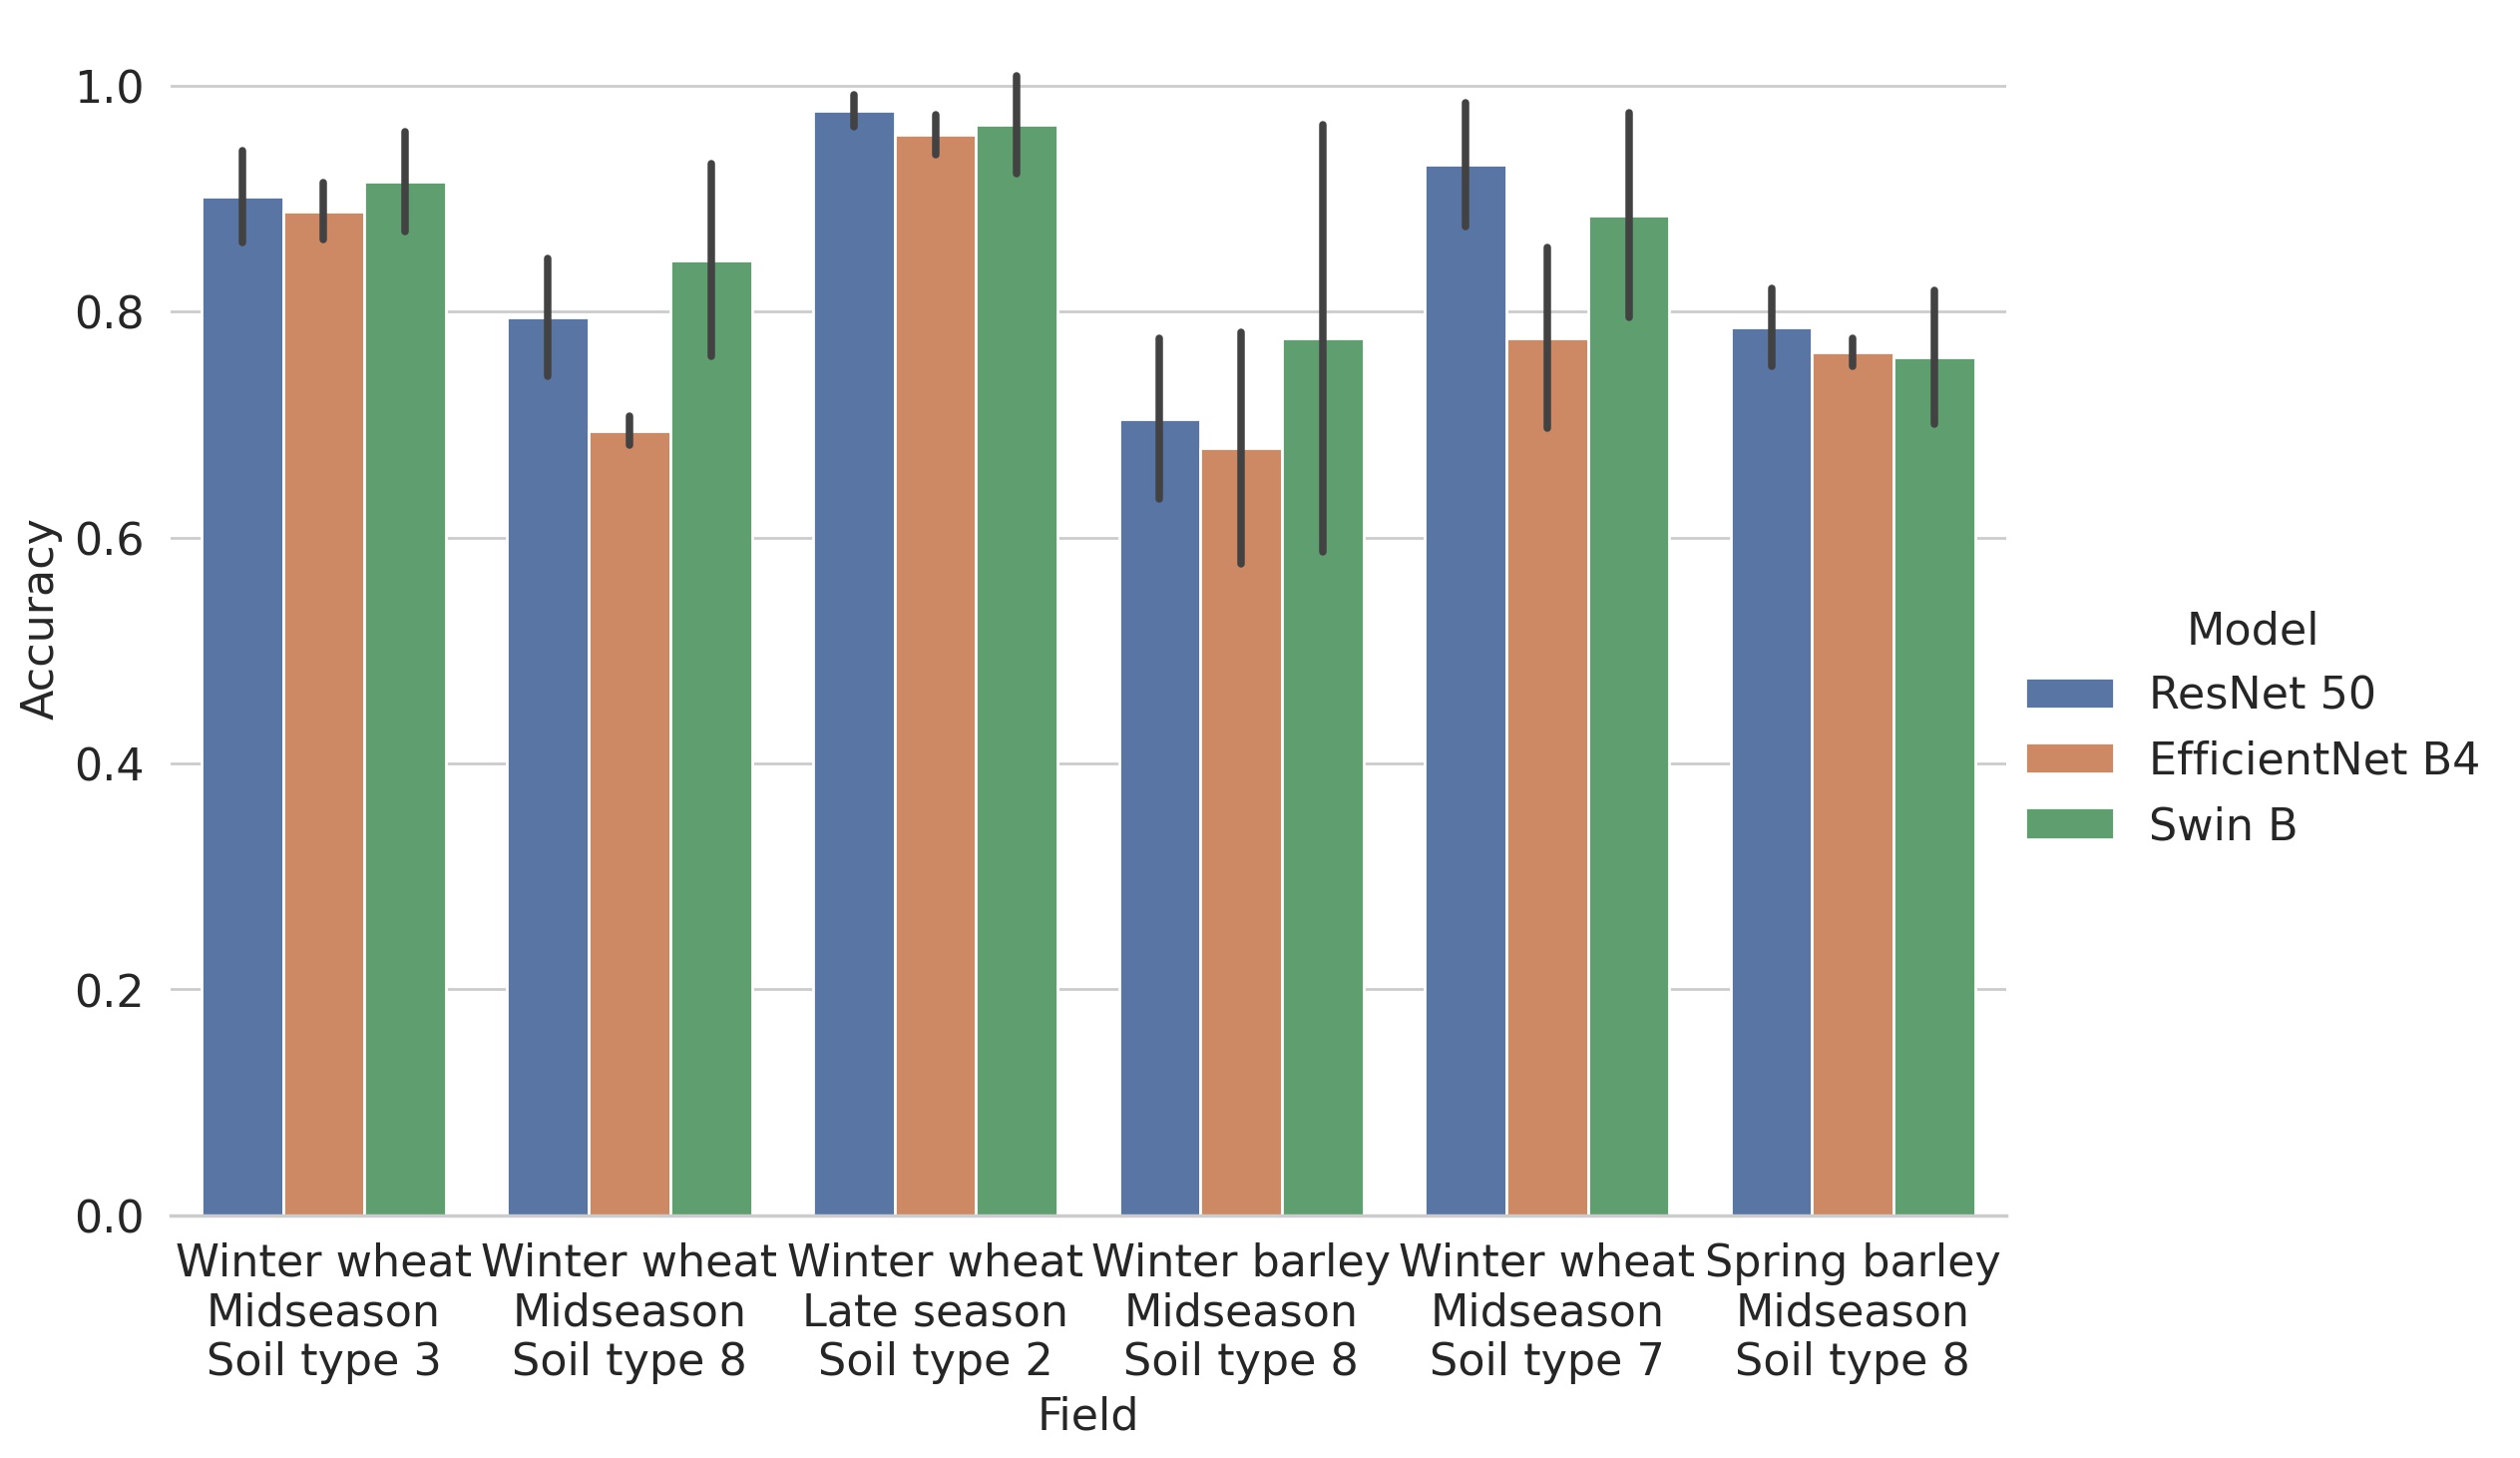
Figure 5 highlights the importance of NIR in the discrimination of wheat and blackgrass. NIR alone outperforms RGB and RGB + NIR. However, using all spectral bands yields the highest accuracy.
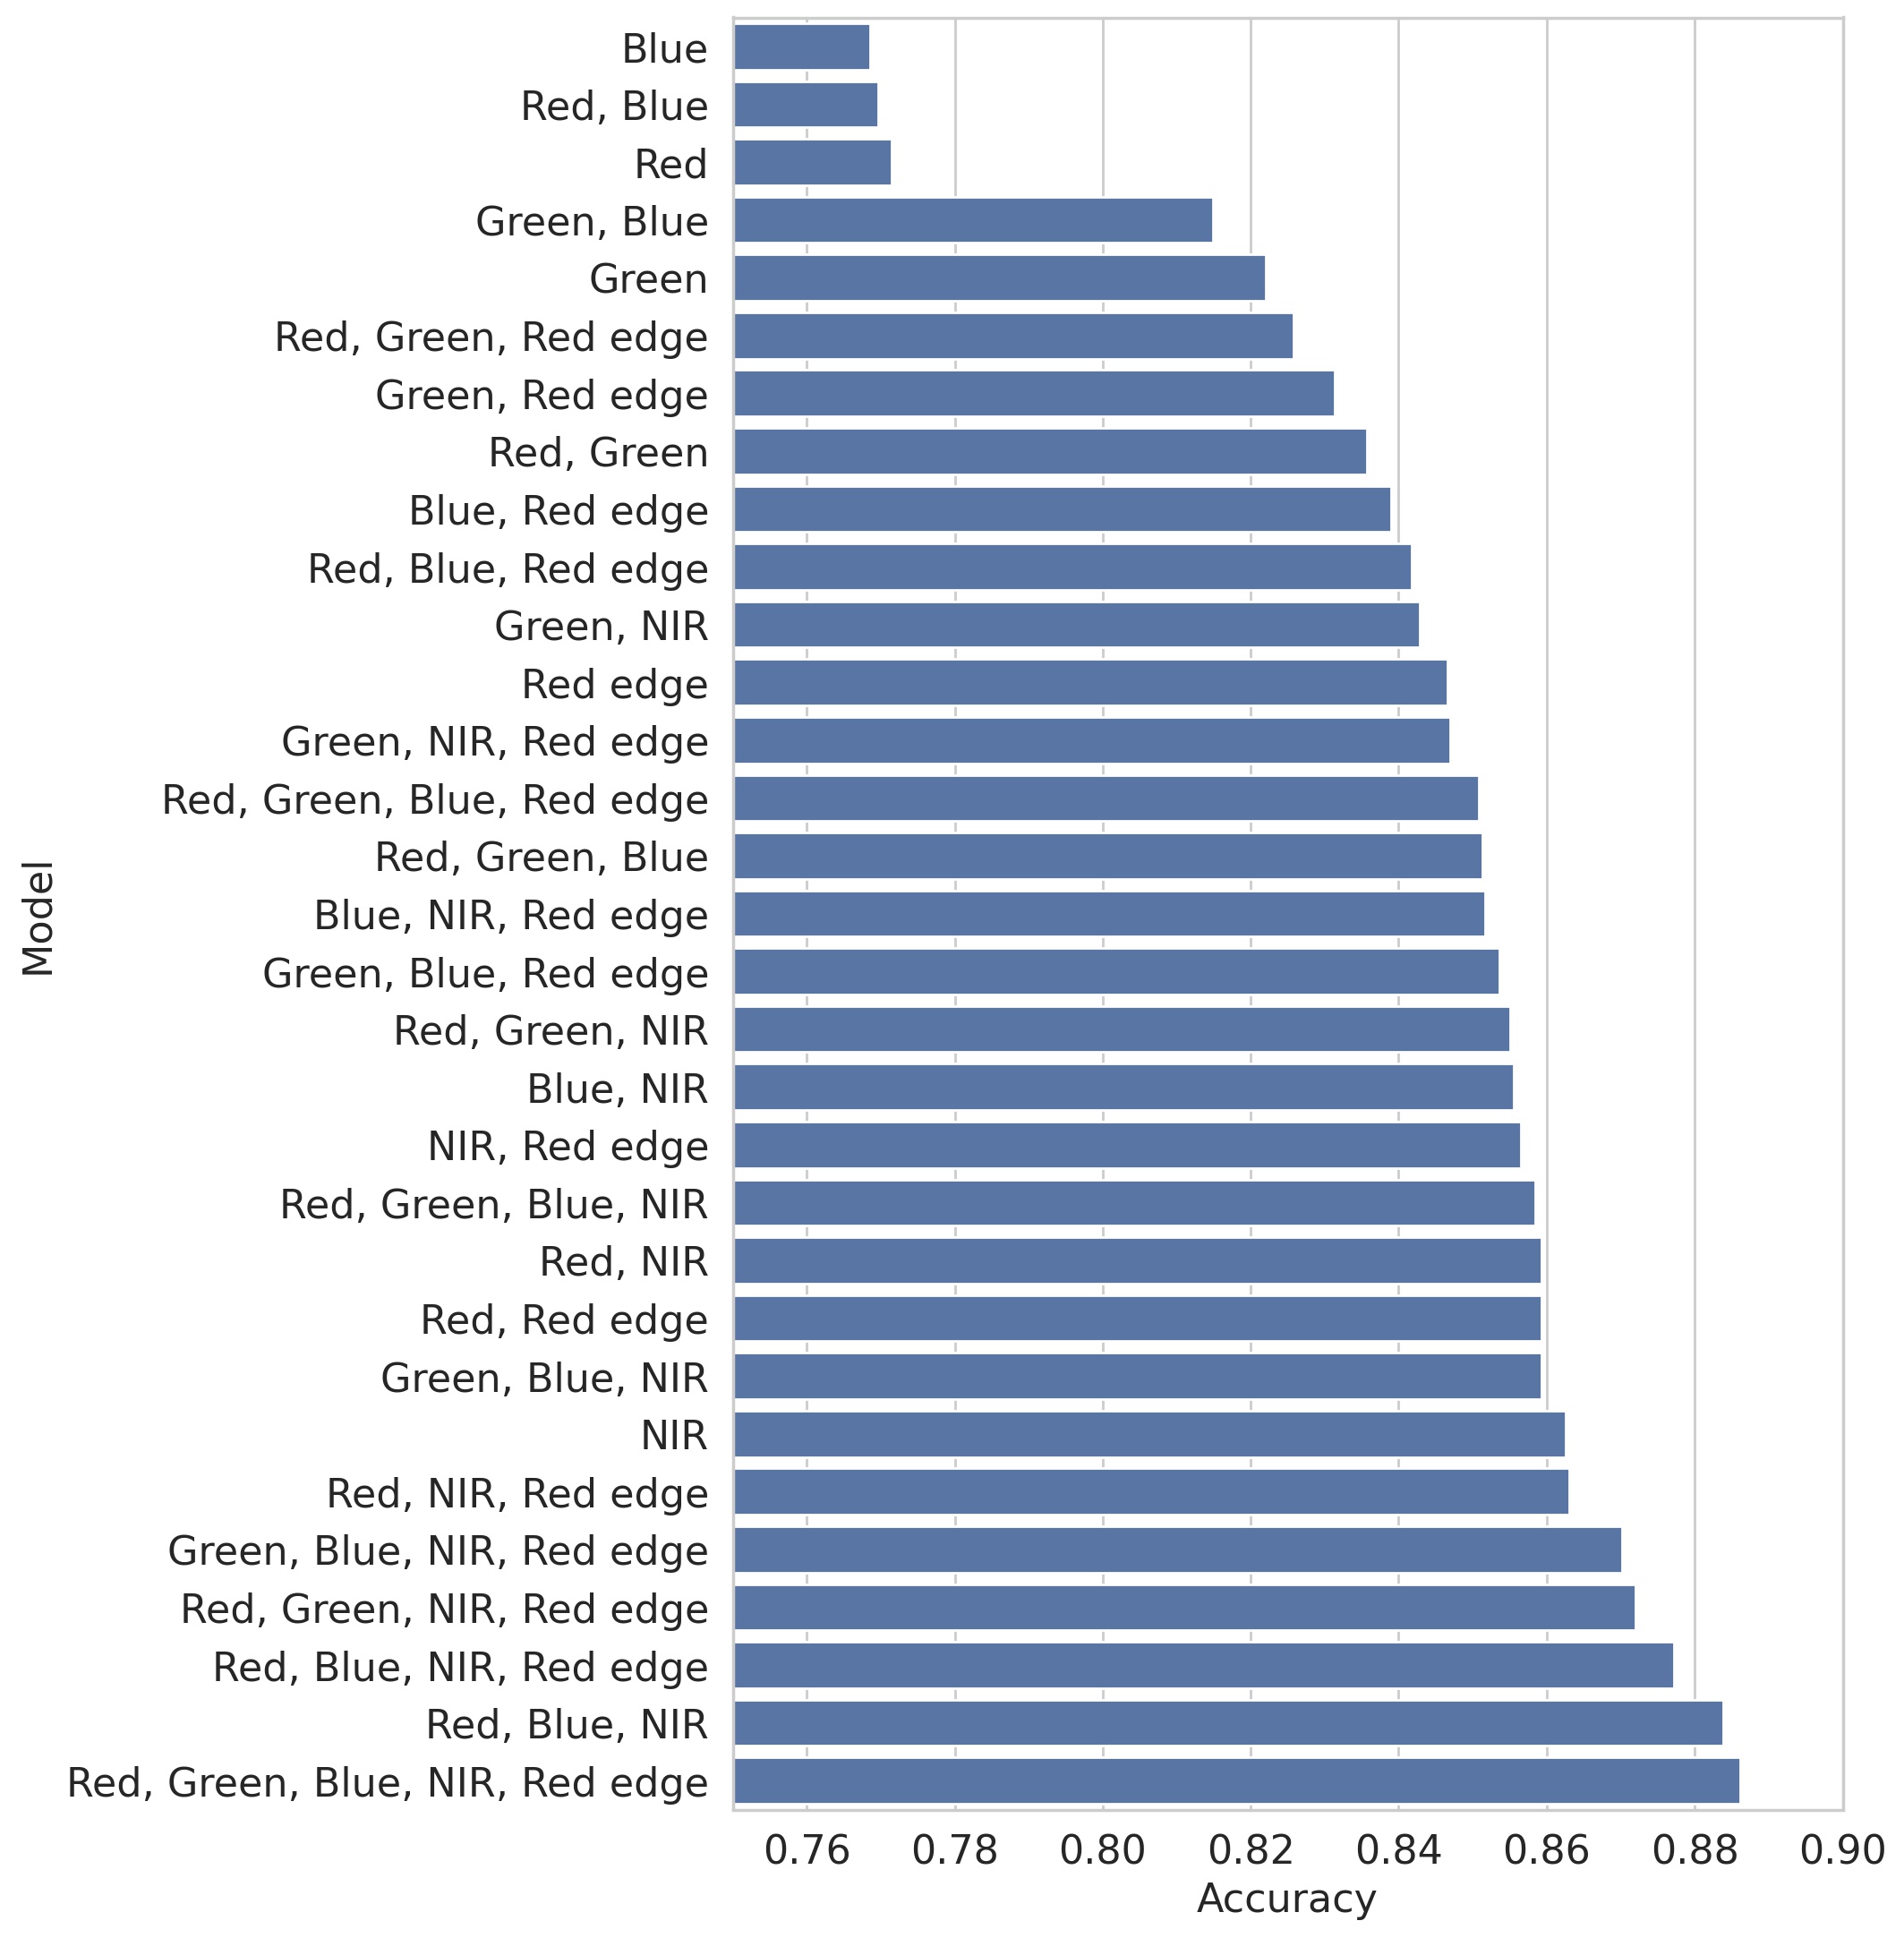
Figure 6 shows that increasing the number training images improves performance up to the first 6000 images. From there, performance does not improve. Swin-B shows more variability in performance with a small number of images than the other models.
5 Discussion
Our study shows the need for more research into the challenging visual recognition task of detecting grass weeds in grass crops. The dataset we provide aims to offer an opportunity for further research in this area. Given the scale of the dataset, we hope it offers an opportunity to learn generalised solutions. In order to test a models ability to generalise, the validation and test set are made up of images from unseen fields — that is images from fields not in the training dataset.
Overall, the results in Table 5 show that all models achieve an average accuracy of over 80% using all the training data across all the test fields. We can conclude Swin B is the best performing on average but it is subject to more variability in performance. ResNet 50 is only slightly worse on average while EfficientNet B4 performs worse overall. The precision and recall for all models are similar, with recall only slightly higher for all models, suggesting they are quite balanced, capturing most true positives without too many false positives. By investigating the performance on each field in the test set, we find blackgrass classification accuracy improves as the crops and weeds mature in the late season.
5.1 Fields
In general, Figure 4, all models performed worse on barley crops compared with wheat crops. This could be the result of fewer images of barley crops being in the dataset. Additionally, all models performed best on the fields where images were taken during the late season. Despite fewer images in the training data of late season crops, these were more accurately classified. This suggests that as the crop and blackgrass mature they become easier to discriminate.
5.2 Channels
Moreover, the dataset is comprised of multispectral images, and allowed us to test the role different spectral bands could play in discriminating between cereal crops and blackgrass. In line with other research, we find that the addition of NIR reliably improves classification accuracy, shown in Figure 5. For example, Red on its own has an accuracy of 0.772 while Red and NIR has an accuracy of 0.860. Similarly, Red and Blue together have an accuracy of 0.770 but with NIR the accuracy is 0.884. Additionally, we find certain powerful combinations of spectral bands, Red, Blue and NIR being one such example, suggesting that particular discriminating features are present in a subset of spectral bands and that in some cases the addition of other spectral bands adds noise to the classification process. This is also shown by combinations that prove detrimental, like Green, NIR and Red Edge, that performs worse than NIR and Red Edge, and NIR alone. This indicates the features in the other colour channels contribute noise to the detection process. However, it is still the case that using all spectral bands in combination is the most accurate.
5.3 Training Data Size
Finally, since our dataset is unusually large for an agricultural classification dataset we wanted to determine whether this larger dataset conferred any benefits. We found that up to 6000 images there was an improvement in performance but beyond that there was no performance improvement, as shown in Figure 6. It could be that the variation in the 37 fields in the training set was well represented by the 6000 randomly sampled images and provided no additional discriminating information. While EfficientNet has the lowest accuracy of the approaches tried, it performs the best on a very restricted dataset size.
6 Conclusion
The problem of grass weed recognition in grass crops, including in major cereal crops, is under-represented in the research to date. To address this, we provide a large dataset of labelled images of blackgrass in wheat and barley crops and show the performance of a representative set of deep classification models in distinguishing between images with and without blackgrass. We demonstrate the performance of state-of-the-art machine vision techniques on unseen fields. We explore the usefulness of additional spectral bands in the classification as well as the importance of additional training data for different popular training models. We find NIR is important for blackgrass classification which concurs with other work that has shown it is useful for weed recognition tasks. Additionally, we establish that for our dataset and this task, there is an upper limit on the number of images that yield improvements in accuracy.
Acknowledgement
This research was partially supported by a PhD studentship from the University of Lincoln, and by Lincoln Agri-Robotics as part of the Expanding Excellence in England (E3) Programme.
Author Contributions
Madeleine Darbyshire: Conceptualization, Investigation, Methodology, Software, Visualization, Writing – original draft. Shaun Coutts: Conceptualization, Funding acquisition, Investigation, Supervision, Writing – review & editing. Eleanor Hammond: Investigation. Fazilet Gokbudak: Investigation. Cengiz Ozterli: Funding acquisition, Supervision. Petra Bosilj: Conceptualization, Funding acquisition, Methodology, Writing – review & editing. Junfeng Gao: Investigation. Elizabeth Sklar: Supervision, Writing – review & editing. Simon Parsons: Supervision, Writing – review & editing.
Appendix A Full List of Wheat and Barley Papers by Weed Species
| Latin Name | Common Name | Total | Publications |
| Aethusa cynapium | 1 | [6] | |
| Alchemilla arvensis | Parsley Piert | 2 | [6, 90] |
| Alopecurus aequalis | Shortawn Foxtail | 1 | [87] |
| Alopecurus myosuroides | Blackgrass | 32 | [17, 76, 10, 8, 20, 39, 23, 30, 57, 72, 80, 22, 24, 26, 38, 50, 70, 81, 14, 28, 42, 43, 52, 63, 74, 78, 7, 15, 32, 49, 53, 58] |
| Amaranthus retroflexus | Redroot Pigweed | 4 | [89, 65, 87, 90] |
| Apera spica-venti | Loose Silky-bent | 30 | [17, 10, 8, 20, 39, 23, 30, 57, 72, 80, 22, 24, 26, 50, 70, 81, 14, 42, 43, 52, 63, 74, 78, 6, 7, 15, 32, 49, 53, 58] |
| Arctotheca calendula | Cape Dandelion | 1 | [44] |
| Avena fatua | Wild Oat | 1 | [69] |
| Bromus japonicus | Japanese brome | 2 | [87, 90] |
| Capsella bursa-pastoris | Shepherd’s Purse | 36 | [17, 18, 10, 19, 8, 20, 39, 23, 30, 57, 72, 80, 89, 22, 24, 26, 50, 70, 81, 14, 42, 43, 52, 63, 74, 78, 87, 93, 6, 7, 15, 32, 45, 49, 53, 58] |
| Centaurea cyanus | Cornflower | 1 | [6] |
| Chenopodium album | Fat Hen | 35 | [17, 18, 10, 19, 86, 8, 20, 39, 23, 30, 57, 72, 80, 85, 22, 24, 26, 50, 70, 81, 14, 42, 43, 52, 63, 74, 78, 1, 6, 7, 15, 32, 49, 53, 58] |
| Cerastium fontanum | Common Mouse Ear Chickweed | 1 | [6] |
| Chloris cucullata | Hooded Windmill Grass | 1 | [68] |
| Cirsium arvense | Creeping Thistle | 5 | [29, 60, 61, 33, 68, 79] |
| Consolida regalis | Forking Larkspur | 3 | [4, 2, 3] |
| Convolvulus arvensis | Field Bindweed | 3 | [59, 6, 68] |
| Dactylis glomerata | Cat Grass | 1 | [68] |
| Echinochloa crus-galli | Cockspur Grass | 2 | [87, 90] |
| Elymus repens | Common Couch | 1 | [79] |
| Equisetum arvense | Horsetail | 1 | [94] |
| Eschscholzia californica | California poppy | 1 | [68] |
| Fallopia convolvulus | Black Bindweed | 1 | [6] |
| Fumaria officinalis | Common fumitory | 1 | [6] |
| Galium aparine | Cleavers | 34 | [17, 18, 10, 19, 8, 20, 39, 23, 30, 57, 72, 80, 22, 24, 26, 50, 70, 81, 14, 42, 43, 52, 63, 74, 78, 93, 6, 7, 15, 32, 45, 49, 53, 58] |
| Galium odoratum | Sweet Woodruff | 1 | [45] |
| Geranium pusillum | Small-flowered Cranesbill | 30 | [18, 10, 19, 8, 20, 39, 23, 30, 57, 72, 80, 22, 24, 26, 50, 70, 81, 14, 42, 43, 52, 63, 74, 78, 7, 15, 32, 49, 53, 58] |
| Humulus japonicus | Japanese Hops | 2 | [86, 85] |
| Lamium purpureum | Red Deadnettle | 2 | [1, 6] |
| Lolium multiflorum | Italian Ryegrass | 2 | [38, 6] |
| Lolium perenne | Perennial Ryegrass | 3 | [18, 19, 68] |
| Lipandra polysperma | Manyseed Goosefoot | 1 | [6] |
| Lithospermum arvense | Corn Gromwell | 1 | [1] |
| Matricaria chamomilla | Chamomile | 1 | [6] |
| Matricaria discoidea | Pineappleweed | 2 | [76, 55] |
| Myosotis arvensis | Field Forget-Me-Not | 3 | [18, 19, 6] |
| Papaver rhoeas | Common Poppy | 3 | [55, 6, 54] |
| Persicaria maculosa | Redshank | 3 | [18, 19, 6] |
| Phalaris paradoxa | Awned Canarygrass | 1 | [37] |
| Poa annua | Annual Bluegrass | 3 | [89, 87, 6] |
| Poa pratensis | Kentucky bluegrass | 1 | [90] |
| Polygonum aviculare | Common Knotweed | 1 | [6] |
| Portulaca oleracea | Purslane | 1 | [59] |
| Raphanus raphanistrum | Wild Radish | 2 | [44, 69] |
| Rumex crispus | Curly Dock | 2 | [40, 56] |
| Rumex obtusifolius | Broadleaf Dock | 2 | [40, 56] |
| Setaria adhaerens | 1 | [65] | |
| Setaria viridis | Green Foxtail | 1 | [94] |
| Sinapis arvensis | Charlock | 31 | [17, 18, 10, 19, 8, 20, 39, 23, 30, 57, 72, 80, 22, 24, 26, 50, 70, 81, 14, 42, 43, 52, 63, 74, 78, 7, 15, 32, 49, 53, 58] |
| Sorghum halepense | Johnson grass | 1 | [59] |
| Solanum nigrum | Black Nightshade | 4 | [18, 19, 65, 6] |
| Spergula arvensis | Corn Spurry | 1 | [1] |
| Stellaria media | Common Chickweed | 35 | [17, 18, 10, 19, 8, 20, 39, 23, 30, 57, 72, 80, 22, 24, 26, 50, 70, 81, 14, 42, 43, 52, 63, 74, 78, 93, 1, 6, 7, 15, 32, 45, 49, 53, 58] |
| Taraxacum officinale | Common Dandelion | 1 | [6] |
| Trifolium pratense | Red Clover | 2 | [18, 19] |
| Tripleurospermum inodorum | Scentless Mayweed | 32 | [17, 18, 10, 19, 8, 20, 39, 23, 30, 57, 72, 80, 22, 24, 26, 50, 70, 81, 14, 42, 43, 52, 63, 74, 78, 7, 15, 32, 49, 53, 58, 79] |
| Urtica urens | Small Nettle | 2 | [18, 19] |
| Veronica hederifolia | Ivy-leaved Speedwell | 2 | [55, 6] |
| Veronica persica | Common field-speedwell | 5 | [76, 18, 19, 6, 45] |
| Viola arvensis | Field Pansy | 4 | [18, 19, 55, 6] |
| Vulpia myuros | Rattail Fescue | 1 | [38] |
| Xanthium strumarium | 2 | [86, 85] |
References
- [1] Pendar Alirezazadeh, Michael Schirrmann and Frieder Stolzenburg “A comparative analysis of deep learning methods for weed classification of high-resolution UAV images” In Journal of Plant Diseases and Protection Springer, 2023, pp. 1–10
- [2] Abeer M Almalky and Khaled R Ahmed “Deep Learning for Detecting and Classifying the Growth Stages of Consolida regalis Weeds on Fields” In Agronomy 13.3 MDPI, 2023, pp. 934
- [3] Abeer M Almalky and Khaled R Ahmed “Real Time Deep Learning Algorithm for Counting Weed’s Growth Stages” In 2023 IEEE 15th International Symposium on Autonomous Decentralized System (ISADS), 2023, pp. 1–6 IEEE
- [4] Abeer M Almalky, Khaled R Ahmed, Mustafa Guzel and Bulent Turan “An Efficient Deep Learning Technique for Detecting and Classifying the Growth of Weeds on Fields” In Proceedings of the Future Technologies Conference, 2022, pp. 818–835 Springer
- [5] Anis Amziane et al. “Weed detection by analysis of multispectral images acquired under uncontrolled illumination conditions” In Fifteenth International Conference on Quality Control by Artificial Vision 11794, 2021, pp. 286–293 SPIE
- [6] Jonas Anderegg et al. “On-farm evaluation of UAV-based aerial imagery for season-long weed monitoring under contrasting management and pedoclimatic conditions in wheat” In Computers and Electronics in Agriculture 204 Elsevier, 2023, pp. 107558
- [7] G Bharathi et al. “Plant and Weed Seedlings Classification Using Deep Learning Techniques” In International Conference on Information and Communication Technology for Intelligent Systems, 2023, pp. 283–302 Springer
- [8] Abdel-Aziz Binguitcha-Fare and Prince Sharma “Crops and weeds classification using convolutional neural networks via optimization of transfer learning parameters” In Int J Eng Adv Technol (IJEAT) 8.5, 2019, pp. 2249–8958
- [9] Roberto Busi, Stephen B Powles, Hugh J Beckie and Michael Renton “Rotations and mixtures of soil-applied herbicides delay resistance” In Pest Management Science 76.2 Wiley Online Library, 2020, pp. 487–496
- [10] Trupti R Chavan and Abhijeet V Nandedkar “AgroAVNET for crops and weeds classification: A step forward in automatic farming” In Computers and electronics in agriculture 154 Elsevier, 2018, pp. 361–372
- [11] Rajender Singh Chhokar, Ramesh Kumar Sharma and Indu Sharma “Weed management strategies in wheat-A review” In Journal of Wheat Research 4.2, 2012, pp. 1–21
- [12] Thomas Cover and Peter Hart “Nearest neighbor pattern classification” In IEEE transactions on information theory 13.1 IEEE, 1967, pp. 21–27
- [13] Nello Cristianini and John Shawe-Taylor “An introduction to support vector machines and other kernel-based learning methods” Cambridge university press, 2000
- [14] Samuel Damilare, Chika Yinka-Banjo and Olasupo Ajayi “Weed Identification in Plant Seedlings Using Convolutional Neural Networks” In International Conference on Emerging Technologies for Developing Countries, 2022, pp. 206–224 Springer
- [15] Akshay Dheeraj and Satish Chand “Using Deep Learning Models for Crop and Weed Classification at Early Stage” In Sentiment Analysis and Deep Learning: Proceedings of ICSADL 2022 Springer, 2023, pp. 931–942
- [16] Alexey Dosovitskiy et al. “An image is worth 16x16 words: Transformers for image recognition at scale” In arXiv preprint arXiv:2010.11929, 2020
- [17] Mads Dyrmann and Rasmus Nyholm Jørgensen “RoboWeedSupport: weed recognition for reduction of herbicide consumption” In Precision agriculture’15 Wageningen Academic Publishers, 2015, pp. 259–269
- [18] Mads Dyrmann, Rasmus Nyholm Jørgensen and Henrik Skov Midtiby “RoboWeedSupport-Detection of weed locations in leaf occluded cereal crops using a fully convolutional neural network” In Advances in Animal Biosciences 8.2 Cambridge University Press, 2017, pp. 842–847
- [19] Mads Dyrmann, Søren Skovsen, Morten Stigaard Laursen and Rasmus Nyholm Jørgensen “Using a fully convolutional neural network for detecting locations of weeds in images from cereal fields” In The 14th International Conference on Precision Agriculture, 2018, pp. 1–7 International Society of Precision Agriculture
- [20] Heba A Elnemr “Convolutional neural network architecture for plant seedling classification” In International Journal of Advanced Computer Science and Applications 10.8 ScienceInformation (SAI) Organization Limited, 2019
- [21] Olaf Erenstein et al. “Global Trends in Wheat Production, Consumption and Trade” In Wheat Improvement Springer, 2022
- [22] Borja Espejo-Garcia et al. “Combining generative adversarial networks and agricultural transfer learning for weeds identification” In Biosystems Engineering 204 Elsevier, 2021, pp. 79–89
- [23] Borja Espejo-Garcia, Nikolaos Mylonas, Loukas Athanasakos and Spyros Fountas “Improving weeds identification with a repository of agricultural pre-trained deep neural networks” In Computers and Electronics in Agriculture 175 Elsevier, 2020, pp. 105593
- [24] Borja Espejo-Garcia, Ioannis Malounas, Eleanna Vali and Spyros Fountas “Testing the Suitability of Automated Machine Learning for Weeds Identification” In Ai 2.1 MDPI, 2021, pp. 34–47
- [25] “FAOSTAT” Accessed: 2023-11-03, https://www.fao.org/faostat
- [26] Sadaf Farkhani et al. “Weed classification using explainable multi-resolution slot attention” In Sensors 21.20 MDPI, 2021, pp. 6705
- [27] Adnan Farooq, Jiankun Hu and Xiuping Jia “Analysis of spectral bands and spatial resolutions for weed classification via deep convolutional neural network” IEEE, 2018
- [28] Paolo Fraccaro et al. “A Deep Learning Application to Map Weed Spatial Extent from Unmanned Aerial Vehicles Imagery” In Remote Sensing 14.17 MDPI, 2022, pp. 4197
- [29] Camilo Franco et al. “Automatic detection of thistle-weeds in cereal crops from aerial RGB images” In Information Processing and Management of Uncertainty in Knowledge-Based Systems. Applications: 17th International Conference, IPMU 2018, Cádiz, Spain, June 11-15, 2018, Proceedings, Part III 17, 2018, pp. 441–452 Springer
- [30] Lifang Fu, Xingchen Lv, Qiufeng Wu and Chengyan Pei “Field weed recognition based on an improved VGG with Inception module” In International Journal of Agricultural and Environmental Information Systems (IJAEIS) 11.2 IGI Global, 2020, pp. 1–13
- [31] Thomas Mosgaard Giselsson et al. “A public image database for benchmark of plant seedling classification algorithms” In arXiv preprint arXiv:1711.05458, 2017
- [32] Xiaoqin Guo, Yujuan Ge, Feiqi Liu and Jingjing Yang “Identification of maize and wheat seedlings and weeds based on deep learning” In Frontiers in Earth Science 11 Frontiers, 2023, pp. 1146558
- [33] Syed Ijaz Ul Haq, Muhammad Naveed Tahir and Yubin Lan “Weed Detection in Wheat Crops Using Image Analysis and Artificial Intelligence (AI)” In Applied Sciences 13.15 MDPI, 2023, pp. 8840
- [34] Kaiming He, Xiangyu Zhang, Shaoqing Ren and Jian Sun “Deep residual learning for image recognition” In Proceedings of the IEEE conference on computer vision and pattern recognition, 2016, pp. 770–778
- [35] Helen L Hicks et al. “The factors driving evolved herbicide resistance at a national scale” In Nature ecology & evolution 2.3 Nature Publishing Group, 2018
- [36] Andrew Howard et al. “Searching for mobilenetv3” In Proceedings of the IEEE/CVF international conference on computer vision, 2019, pp. 1314–1324
- [37] Brahim Jabir, Noureddine Falih and Khalid Rahmani “Accuracy and efficiency comparison of object detection open-source models.” In International Journal of Online & Biomedical Engineering 17.5, 2021
- [38] Signe M Jensen, Muhammad Javaid Akhter, Saiful Azim and Jesper Rasmussen “The predictive power of regression models to determine grass weed infestations in cereals based on drone imagery—Statistical and practical aspects” In Agronomy 11.11 MDPI, 2021, pp. 2277
- [39] Zichao Jiang “A novel crop weed recognition method based on transfer learning from VGG16 implemented by keras” In IOP Conference Series: Materials Science and Engineering 677.3, 2019, pp. 032073 IOP Publishing
- [40] El-Sayed M El-Kenawy et al. “Metaheuristic optimization for improving weed detection in wheat images captured by drones” In Mathematics 10.23 MDPI, 2022, pp. 4421
- [41] Alex Krizhevsky, Ilya Sutskever and Geoffrey E Hinton “Imagenet classification with deep convolutional neural networks” In Advances in neural information processing systems 25, 2012
- [42] Atishek Kumar, Rishabh Jain and Rudresh Dwivedi “Weed Detection in Crops Using Lightweight EfficientNets” In International Conference on Communication and Intelligent Systems, 2022, pp. 149–162 Springer
- [43] Niranjan C Kundur and PB Mallikarjuna “Deep Convolutional Neural Network Architecture for Plant Seedling Classification” In Engineering, Technology & Applied Science Research 12.6, 2022, pp. 9464–9470
- [44] Vi Nguyen Thanh Le, Giang Truong and Kamal Alameh “Detecting weeds from crops under complex field environments based on Faster RCNN” In 2020 IEEE eighth international conference on communications and electronics (ICCE), 2021, pp. 350–355 IEEE
- [45] Teng Liu et al. “Semi-supervised learning and attention mechanism for weed detection in wheat” In Crop Protection 174 Elsevier, 2023, pp. 106389
- [46] Ze Liu et al. “Swin transformer: Hierarchical vision transformer using shifted windows” In Proceedings of the IEEE/CVF international conference on computer vision, 2021, pp. 10012–10022
- [47] Congying Ma and Yuhan Pu “Research Progress of Fine-grained Visual Classification: Basic Framework, Challenges, and Future Development” In 2021 3rd International Academic Exchange Conference on Science and Technology Innovation (IAECST), 2021, pp. 413–419 IEEE
- [48] Sachin Mehta and Mohammad Rastegari “Mobilevit: light-weight, general-purpose, and mobile-friendly vision transformer” In arXiv preprint arXiv:2110.02178, 2021
- [49] Naman Mishra, Ishrat Jahan, Md Raghib Nadeem and Vandana Sharma “A Comparative Study of ResNet50, EfficientNetB7, InceptionV3, VGG16 models in Crop and Weed classification” In 2023 4th International Conference on Intelligent Engineering and Management (ICIEM), 2023, pp. 1–5 IEEE
- [50] JP Mounashree et al. “AUTOMATED WEED REMOVAL SYSTEM USING CONVOLUTIONAL NEURAL NETWORK” In International Journal of Engineering Applied Sciences and Technology. 6, 2021, pp. 231–235
- [51] JR Moyer, ES Roman, CW Lindwall and RE Blackshaw “Weed management in conservation tillage systems for wheat production in North and South America” In Crop Protection 13.4 Elsevier, 1994, pp. 243–259
- [52] Ye Mu et al. “A Faster R-CNN-Based Model for the Identification of Weed Seedling” In Agronomy 12.11 MDPI, 2022, pp. 2867
- [53] Ye Mu et al. “DenseNet weed recognition model combining local variance preprocessing and attention mechanism” In Frontiers in Plant Science 13 Frontiers, 2023, pp. 1041510
- [54] Fernando J Pérez-Porras, Jorge Torres-Sánchez, Francisca López-Granados and Francisco J Mesas-Carrascosa “Early and on-ground image-based detection of poppy (Papaver rhoeas) in wheat using YOLO architectures” In Weed Science 71.1 Cambridge University Press, 2023, pp. 50–58
- [55] Michael Pflanz, Henning Nordmeyer and Michael Schirrmann “Weed mapping with UAS imagery and a bag of visual words based image classifier” In Remote Sensing 10.10 MDPI, 2018, pp. 1530
- [56] Fathimathul Rajeena PP, Walaa N Ismail and Mona AS Ali “A Metaheuristic Harris Hawks Optimization Algorithm for Weed Detection Using Drone Images” In Applied Sciences 13.12 MDPI, 2023, pp. 7083
- [57] Nawmee Razia Rahman, Md Al Mehedi Hasan and Jungpil Shin “Performance comparison of different convolutional neural network architectures for plant seedling classification” In 2020 2nd International Conference on Advanced Information and Communication Technology (ICAICT), 2020, pp. 146–150 IEEE
- [58] Nawmee Razia Rahman and Md Nazrul Islam Mondal “A New Approach Using a Convolutional Neural Network for Crop and Weed Classification” In Computer Vision and Image Analysis for Industry 4.0 ChapmanHall/CRC, 2023, pp. 17–27
- [59] Emmanuel K Raptis et al. “Multimodal data collection system for UAV-based precision agriculture applications” In 2022 Sixth IEEE International Conference on Robotic Computing (IRC), 2022, pp. 1–7 IEEE
- [60] J Rasmussen et al. “Pre-harvest weed mapping of Cirsium arvense in wheat and barley with off-the-shelf UAVs” In Precision Agriculture 20 Springer, 2019, pp. 983–999
- [61] Jesper Rasmussen, Saiful Azim and Jon Nielsen “Pre-harvest weed mapping of Cirsium arvense L. based on free satellite imagery–The importance of weed aggregation and image resolution” In European Journal of Agronomy 130 Elsevier, 2021, pp. 126373
- [62] Manzoor Razaak et al. “An integrated precision farming application based on 5G, UAV and deep learning technologies” In Computer Analysis of Images and Patterns: CAIP 2019 International Workshops, ViMaBi and DL-UAV, Salerno, Italy, September 6, 2019, Proceedings 18, 2019, pp. 109–119 Springer
- [63] L Uday Kumar Reddy, S Rohitharun and S Sujana “Weed Detection Using AlexNet Architecture In The Farming Fields” In 2022 3rd International Conference for Emerging Technology (INCET), 2022, pp. 1–6 IEEE
- [64] Herbert Robbins and Sutton Monro “A stochastic approximation method” In The annals of mathematical statistics JSTOR, 1951, pp. 400–407
- [65] Inbal Ronay, Fadi Kizel and Ran Lati “The effect of spectral mixtures on weed species classification” In ISPRS Annals of the Photogrammetry, Remote Sensing and Spatial Information Sciences 3 Copernicus GmbH, 2022, pp. 477–484
- [66] John Wilson Rouse, Rüdiger H Haas, John A Schell and Donald W Deering “Monitoring vegetation systems in the Great Plains with ERTS” In NASA Spec. Publ 351.1, 1974, pp. 309
- [67] I. Sa et al. “weedNet: Dense Semantic Weed Classification Using Multispectral Images and MAV for Smart Farming” In IEEE Robotics and Automation Letters 3.1, 2018 DOI: 10.1109/LRA.2017.2774979
- [68] Muhammad Ali Saqib, Muhammad Aqib, Muhammad Naveed Tahir and Yaser Hafeez “Towards deep learning based smart farming for intelligent weeds management in crops” In Frontiers in Plant Science 14 Frontiers Media SA, 2023
- [69] Nooshin Shahbazi et al. “Assessing the capability and potential of LiDAR for weed detection” In Sensors 21.7 MDPI, 2021, pp. 2328
- [70] Salman Ahmad Siddiqui, Neda Fatima and Anwar Ahmad “Neural Network based Smart Weed Detection System” In 2021 International Conference on Communication, Control and Information Sciences (ICCISc) 1, 2021, pp. 1–5 IEEE
- [71] Karen Simonyan and Andrew Zisserman “Very deep convolutional networks for large-scale image recognition” In arXiv preprint arXiv:1409.1556, 2014
- [72] Hristo Skacev et al. “On the development of the automatic weed detection tool” In 2020 Zooming Innovation in Consumer Technologies Conference (ZINC), 2020, pp. 123–126 IEEE
- [73] “Soilscapes by The Cranfield Soil and AgriFood Institute (CSAFI)”, https://www.landis.org.uk/soilscapes
- [74] Kavita Srivastava “Role of Deep Learning in Weed Detection” In Artificial Intelligence Applications in Agriculture and Food Quality Improvement IGI Global, 2022, pp. 95–111
- [75] Daobilige Su, Yongliang Qiao, He Kong and Salah Sukkarieh “Real time detection of inter-row ryegrass in wheat farms using deep learning” In Biosystems Engineering 204 Elsevier, 2021, pp. 198–211
- [76] P Sukumar and Dr S Ravi “Weed detection using image processing by clustering analysis” In International Journal of Emerging Technologies in Engineering Research (IJETER) 4.5, 2016, pp. 14–18
- [77] Mingxing Tan and Quoc Le “Efficientnet: Rethinking model scaling for convolutional neural networks” In International conference on machine learning, 2019, pp. 6105–6114 PMLR
- [78] Saikumar Tara “Machine Learning-Based Approach for Classification of Weed Images” In Innovations in Signal Processing and Embedded Systems: Proceedings of ICISPES 2021 Springer, 2022, pp. 253–261
- [79] Leon-Friedrich Thomas, Mikael Änäkkälä and Antti Lajunen “Weakly Supervised Perennial Weed Detection in a Barley Field” In Remote Sensing 15.11 MDPI, 2023, pp. 2877
- [80] Vo Hoang Trong, Yu Gwang-hyun, Dang Thanh Vu and Kim Jin-young “Late fusion of multimodal deep neural networks for weeds classification” In Computers and Electronics in Agriculture 175 Elsevier, 2020, pp. 105506
- [81] Vo Hoang Trong, Yu Gwang Hyun, Kim Jin Young and Pham The Bao “Yielding multi-fold training strategy for image classification of imbalanced weeds” In Applied Sciences 11.8 MDPI, 2021, pp. 3331
- [82] Alexa Varah et al. In Nature Sustainability 3.1 Nature Publishing Group, 2020
- [83] Ashish Vaswani et al. “Attention is all you need” In Advances in neural information processing systems 30, 2017
- [84] Aichen Wang, Yifei Xu, Xinhua Wei and Bingbo Cui “Semantic segmentation of crop and weed using an encoder-decoder network and image enhancement method under uncontrolled outdoor illumination” In Ieee Access 8 IEEE, 2020, pp. 81724–81734
- [85] Shubo Wang et al. “A transfer-learning-based feature classification algorithm for UAV imagery in crop risk management” In Desalin. Water Treat 181, 2020, pp. 330–337
- [86] Shubo Wang et al. “Low-altitude remote sensing based on convolutional neural network for weed classification in ecological irrigation area” In IFAC-PapersOnLine 51.17 Elsevier, 2018, pp. 298–303
- [87] Ke Xu et al. “Multi-modal and multi-view image dataset for weeds detection in wheat field” In Frontiers in Plant Science 13 Frontiers, 2022, pp. 936748
- [88] Ke Xu et al. “Multi-modal deep learning for weeds detection in wheat field based on RGB-D images” In Frontiers in Plant Science 12 Frontiers, 2021, pp. 732968
- [89] Ke Xu et al. “Recognition of weeds in wheat fields based on the fusion of RGB images and depth images” In IEEE Access 8 IEEE, 2020, pp. 110362–110370
- [90] Ke Xu et al. “WeedsNet: a dual attention network with RGB-D image for weed detection in natural wheat field” In Precision Agriculture Springer, 2023, pp. 1–26
- [91] Frank L Young et al. “Weed management for crop production in the Northwest wheat (Triticum aestivum) region” In Weed science 44.2 Cambridge University Press, 1996, pp. 429–436
- [92] Alex Rogers Aguiar Zanin et al. “Reduction of pesticide application via real-time precision spraying” In Scientific reports 12.1 Nature Publishing Group UK London, 2022, pp. 5638
- [93] Jiayao Zhuang et al. “Evaluation of different deep convolutional neural networks for detection of broadleaf weed seedlings in wheat” In Pest Management Science 78.2 Wiley Online Library, 2022, pp. 521–529
- [94] Kunlin Zou et al. “A modified U-Net with a specific data argumentation method for semantic segmentation of weed images in the field” In Computers and Electronics in Agriculture 187 Elsevier, 2021, pp. 106242