Towards Consistent Object Detection via LiDAR-Camera Synergy
Abstract
As human-machine interaction continues to evolve, the capacity for environmental perception is becoming increasingly crucial. Integrating the two most common types of sensory data, images, and point clouds, can enhance detection accuracy. However, currently, no model exists that can simultaneously detect an object’s position in both point clouds and images and ascertain their corresponding relationship. This information is invaluable for human-machine interactions, offering new possibilities for their enhancement. In light of this, this paper introduces an end-to-end Consistency Object Detection (COD) algorithm framework that requires only a single forward inference to simultaneously obtain an object’s position in both point clouds and images and establish their correlation. Furthermore, to assess the accuracy of the object correlation between point clouds and images, this paper proposes a new evaluation metric, Consistency Precision (CP). To verify the effectiveness of the proposed framework, an extensive set of experiments has been conducted on the KITTI and DAIR-V2X datasets. The study also explored how the proposed consistency detection method performs on images when the calibration parameters between images and point clouds are disturbed, compared to existing post-processing methods. The experimental results demonstrate that the proposed method exhibits excellent detection performance and robustness, achieving end-to-end consistency detection. The source code will be made publicly available at https://github.com/xifen523/COD.
I Introduction
Human-machine interaction necessitates the perception of the surrounding environment, and object detection is one of the most commonly employed methods of perception. The task of object detection [1, 2], a classic endeavor in computer vision, has historically garnered extensive interest from numerous researchers. Depending on the data type, object detection can be categorized into 2D object detection [3] based on images and 3D object detection [4] based on point clouds, each with broad applications. For certain specialized tasks aimed at achieving higher detection accuracy or robustness, there is also 3D object detection [5] that integrates both images and point clouds.
Although existing detectors [6, 7] are powerful, they struggle to establish the correspondence of targets across multiple modalities. Even when the input data consists of images and point clouds, the final detection result is the object’s bounding box in the 3D point cloud, without a corresponding bounding box in the 2D image. To simultaneously obtain the target’s location in the 3D point cloud and in the image, further post-processing steps are required. There are typically two implementation methods. The first method utilizes the calibration matrix between the point cloud and the camera to calculate the positions of the eight corners of the 3D bounding box in the image and then infers the largest bounding box based on these eight corners [8]. The second method involves using a 2D image detector to match the 2D detection results of the image with the 3D detection results, thereby obtaining both 2D and 3D detection outcomes for the object.
To our knowledge, currently, no detector has achieved the capability of obtaining both 2D and 3D detection results in a single inference while ensuring that both results correspond to the same target. To address this gap, this paper proposes the task of consistency detection, which involves simultaneously detecting the bounding boxes of an object in different modalities, while ensuring that the detection results represent the same object and are not disordered or confused. In addition to existing evaluation methods, this paper introduces the metric of Consistency Precision (CP) to assess the performance of the detector. This metric is used to evaluate whether the objects detected across multiple modalities are indeed the same.
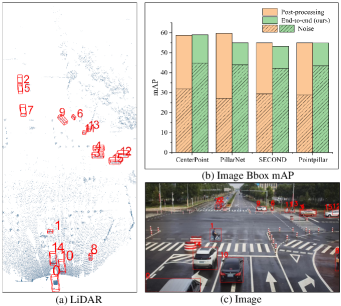
Furthermore, this paper proposes an end-to-end consistency object detection framework based on point clouds and images. It comprises two components: a 3D point cloud detector and a 2D image detector, with the point cloud detector being arbitrary and the image detector specified as a DETR [9] paradigm detector. In the consistency detection method, the core approach involves using the 3D detection boxes to provide proposals for initializing the queries of the 2D detector, thereby ensuring that the detections by the 2D detector correspond to the proposals from the 3D boxes. The framework has been verified on the KITTI [10] and DAIR-V2X [11] datasets, and the results indicate that our method possesses greater robustness compared to existing post-processing methods that calculate 2D bounding boxes using calibration matrices, as shown in Figure 1(b). Additionally, this paper establishes benchmarks for consistency detection on the KITTI [10] and DAIR-V2X [11] datasets, facilitating research by other researchers in the future.
The main contributions of this paper can be summarized in three aspects:
-
•
The task of consistency detection is introduced to exploit LiDAR-camera synergy, along with the metric of consistency precision, for driving scene understanding.
-
•
An end-to-end framework for consistency detection is proposed, and benchmarks have been established on the KITTI and DAIR-V2X datasets.
-
•
The effectiveness of the proposed framework is verified, showing that it possesses greater robustness across several existing 3D algorithms. This offers a new solution approach for calibration parameter inaccuracies.
II Related Work
II-A Visual Object Detection
Visual object detection has been developed for a long time, and traditional object detection techniques use manual feature extraction with poor robustness and high computational time complexity, which limits the improvement of object detection algorithms. With the continuous emergence of deep learning methods, Fast R-CNN [12], Faster R-CNN [13], and their related improved algorithms [14, 15] have achieved excellent results as two-stage object detection approach effect. The single-stage object detector predicts the object category and location directly from the image, which has the advantages of fast speed and fewer computational resources.
SSD [16] is the first single-stage object detection method that achieves similar detection accuracy to Faster R-CNN in real-time performance. Subsequently, a series of YOLO-based methods [17, 18, 19] are proposed to further optimize and improve the performance of single-stage object detection methods.
Recent research work has also proposed the use of end-to-end prediction methods to directly predict the bounding box of each object. Among them, DETR [9] is the most representative end-to-end prediction method, which directly predicts the location as well as the category of an object by decoding a learnable query. Since then, a series of improved DETR-based methods [20, 21, 22] keeps emerging. End-to-end prediction is gradually becoming the dominant paradigm in the field of object detection due to the removal of the complex post-processing process.
II-B Point Cloud Object Detection
LiDAR sensors can obtain accurate and complete spatial information, but unlike images, they do not yield regular data. VoxelNet [23] first proposes an end-to-end training network, which is a pioneering work in 3D object detection based on deep learning work. SECOND [24] proposed sparse convolution methods to reduce memory consumption and increase computational speed. Subsequently, PointPillars [25] proposed the idea of encoding point clouds into vertical columns based on VoxelNet to achieve 3D object detection using a 2D object detection framework. HVNet [26] uses multi-scale voxelization for point cloud processing, by aggregating information from each point within a voxel to compute voxel features and achieve better detection performance on the KITTI [10] test benchmark.
In addition, the point-based processing is closer to the original LiDAR data and does not lose the original geometric information due to quantization errors. PointNet++ [27] applies PointNet [28] in a hierarchical recursive manner to improve the detection performance by adaptively capturing the structure and fine-grained features of the point cloud. fine-grained features to improve detection performance. Point RCNN [29] proposes a point-based two-stage detection framework that extends the classical 2D object detection framework, Faster R-CNN, to 3D object detection. 3DSSD [30] proposes a lightweight framework that achieves a balance between detection accuracy and speed.
II-C Fusion-based Object Detection
The fusion of point clouds and images can compensate for their respective deficiencies and improve perceptual accuracy. They can be categorized into three types according to the fusion period: early fusion, intermediate fusion, and late fusion.
Early-fusion methods fuse data from different modalities during data preprocessing and typically rely on hard correlations brought about by the transform matrix between the LiDAR and the camera for semantic alignment. PointPainting [31] is representative of this type of approach, which projects the original point cloud as input to the output of a pure image semantic segmentation network and attaches a category score to each point. MVP [32] utilizes multiple 2D detection networks to generate dense 3D virtual point clouds to augment an otherwise sparse point cloud. However, the sparsity of the points can severely affect the quality of the fusion, so early fusion is not commonly used and a small amount of research work has been done in the early stages of the development of multimodal methods.
Mid-term fusion, which occurs after data preprocessing has been completed and before final detection results are generated, is currently the method with the most potential for development. TransFusion [33] defines object queries in 3D space and fuses image features into these proposal boxes. MMF [34] utilizes multiple related subtasks (e.g., ground estimation, depth completion, 2D object detection, etc.) to enhance cross-modal fusion learning. DeepFusion [35] proposes InverseAug inverse rotation and other geometrically relevant data enhancements to achieve precise geometric alignment between LiDAR points and image pixels. SFD [36] enhances LiDAR-generated sparse point clouds using a dense pseudo-point cloud generated by depth complementation, which fuses 3D RoI features from different point clouds into a 3D mesh. 4D-Net [36] places the fusion module in the point cloud feature extractor to allow the point cloud features to be dynamically focused on image features.
Post-fusion is also known as decision-level fusion, which focuses on fusing the predictions of different modalities during the decision-making period. CLOCs [37] is a typical post-fusion method that utilizes maximum suppression (NMS) to post-process the predictions of all modalities. This fusion strategy is based on manual handwritten rules and the post-processing is associated with cumbersome.
In summary, no existing method can simultaneously detect an object’s position in both point clouds and images and establish their corresponding relationship.
III Methodology
III-A Network Architecture
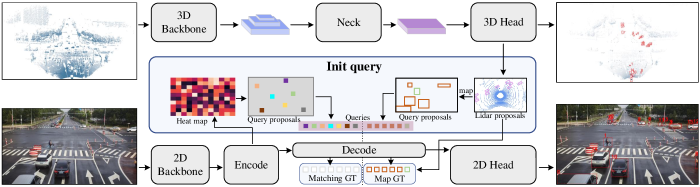
The consistency detection framework proposed in this article integrates a point cloud detection network architecture with the RT-DETR [3] image detection network, as depicted in Figure 2. It imposes no constraints on the point cloud detection network, which may either be a single-stage or a two-stage detection network. The image detection network exclusively employs RT-DETR, chosen for its efficiency and speed, as well as its support for end-to-end image detection. Notably, the architecture achieves target detection in both point clouds and images with a single forward inference, assigning the same ID to the same target. Such end-to-end consistency detection is scarcely achievable using traditional detection methods with NMS post-processing. The essence of consistency detection lies in utilizing the outcomes of point cloud detection as proposals for queries in image object detection, thereby aligning the targets identified in the point clouds with those in the images, as depicted in Figure 1.
III-B Learnable Query Initialization
In the framework proposed in this paper, a learnable query is utilized, which comprises two components: the bounding box (Bbox) position and the category embedding. Initially, a distance calculation is performed between all detected objects from the point cloud and all ground truths to construct a cost matrix. Subsequently, based on this cost matrix, the Hungarian algorithm is employed to associate detected objects with their corresponding ground truths one-to-one. Next, point cloud detections not associated with a ground truth are discarded. The target positions and size from the point cloud detections are then used, along with the calibration matrix between the point cloud and the image, to compute the initial positions of targets in the image. Similarly, the category detected by the point cloud serves as the initial input for the embedding. Notably, the initialized queries here correspond to actual ground truths. These queries can be understood as noisy derivatives of the ground truths, and the subsequent decoder process involves denoising these queries. The initialization of queries based on LiDAR proposals can be represented by the following five equations:
Here, represents the distance cost matrix. denotes the distance calculation function. refers to the bounding boxes predicted based on LiDAR data. stands for the ground truth values. This matrix is used to assess the disparity between each predicted bounding box from LiDAR data and the actual ground truth, facilitating the optimal matching process.
Here, represents the indices between the bounding boxes predicted by the LiDAR and the ground truths. denotes the Hungarian matching algorithm. This equation indicates that the Hungarian algorithm is applied to the distance cost matrix to find the best match indices, ensuring that each predicted Bbox from LiDAR is optimally paired with a ground truth entity.
Here, denotes the bounding boxes as projected onto the image space. is the mapping function used to translate bounding boxes from the LiDAR coordinate system to the image coordinate system. refers to the bounding boxes predicted by the LiDAR that have been successfully matched with ground truth values. This equation illustrates how the bounding boxes, after being matched to ground truths using indices (), are converted from the LiDAR coordinates to image coordinates, effectively mapping them onto the corresponding positions in the image space.
Here, is a function used to transform categorical data into a vector representation. refers to the category associated with each bounding box that has been matched to the ground truths. The represents the learnable information derived from the category embeddings. This equation describes how the category associated with each indexed bounding box is transformed into a learnable vector (content) through the embedding function, providing a richer, more informative representation suitable for further processing or learning tasks.
Here, the thus formed is precisely the initialized query required for subsequent processing. Following the steps outlined above, we can successfully generate queries initialized based on LiDAR proposals.
Additionally, we retain queries generated from the heat map, consistent with RT-DETR, due to the potential for point cloud omissions that could result in the corresponding targets not being detected in the image. Another advantage of this approach is that the model can still detect targets in the image even without initialization from the point cloud, ensuring it remains functional and robust even in the absence of point cloud inputs. Finally, initializing more queries facilitates rapid model convergence and enhances training efficiency. This is akin to training a parameter-shared network with the same architecture, introducing more supervision, thereby improving DETR training.
| Detector Modality | Modal | Car (AP@0.7) | Pedestrian (AP@0.5) | Cyclist (AP@0.5) | mAP | ||||||||
|---|---|---|---|---|---|---|---|---|---|---|---|---|---|
| easy | mod. | hard | easy | mod. | hard | easy | mod. | hard | easy | mod. | hard | ||
| CenterPoint [38] | 3D | 72.06 | 64.50 | 64.60 | 46.40 | 41.51 | 35.62 | 54.46 | 38.61 | 32.61 | 57.64 | 48.20 | 44.28 |
| COD (CenterPoint+RT-DETR) | 72.15 | 69.76 | 64.64 | 46.84 | 42.22 | 41.36 | 52.94 | 36.37 | 30.52 | 57.31 | 49.45 | 45.51 | |
| PillarNet [39] | 58.46 | 58.21 | 53.78 | 38.66 | 32.85 | 31.29 | 56.27 | 37.94 | 33.06 | 51.13 | 43.00 | 39.38 | |
| COD (PillarNet+RT-DETR) | 58.29 | 59.12 | 54.32 | 38.30 | 32.80 | 31.60 | 56.16 | 38.90 | 37.54 | 50.92 | 43.60 | 41.16 | |
| SECOND [24] | 72.97 | 64.70 | 64.18 | 44.85 | 39.10 | 34.36 | 54.39 | 37.21 | 32.21 | 57.40 | 47.00 | 43.58 | |
| COD (SECOND+RT-DETR) | 75.28 | 65.29 | 64.44 | 44.48 | 38.64 | 33.30 | 51.48 | 35.70 | 34.99 | 57.08 | 46.55 | 44.24 | |
| PointPillar [25] | 65.08 | 61.01 | 55.72 | 35.25 | 30.78 | 25.66 | 52.73 | 37.43 | 36.19 | 51.02 | 43.07 | 39.19 | |
| COD (PointPillar+RT-DETRs) | 64.91 | 60.94 | 55.52 | 36.87 | 31.77 | 27.53 | 50.78 | 34.84 | 31.27 | 50.85 | 42.52 | 38.11 | |
| CenterPoint [38] | Bbox | 87.33 | 78.50 | 78.42 | 62.51 | 55.43 | 48.44 | 58.99 | 42.02 | 41.81 | 69.61 | 58.65 | 56.22 |
| COD (CenterPoint+RT-DETR) | 79.39 | 80.78 | 74.78 | 61.79 | 54.96 | 53.44 | 58.89 | 41.24 | 40.95 | 66.69 | 58.99 | 56.39 | |
| PillarNet [39] | 84.76 | 76.48 | 76.14 | 51.97 | 44.58 | 43.68 | 57.50 | 39.60 | 39.00 | 64.75 | 53.55 | 52.94 | |
| COD (PillarNet+RT-DETR) | 79.64 | 80.97 | 75.26 | 59.67 | 51.88 | 45.46 | 48.46 | 32.31 | 31.97 | 62.59 | 55.05 | 50.90 | |
| SECOND [24] | 88.63 | 86.14 | 79.45 | 58.49 | 52.13 | 45.90 | 64.11 | 40.76 | 39.88 | 70.41 | 59.67 | 55.08 | |
| COD (SECOND+RT-DETR) | 79.14 | 79.60 | 74.05 | 50.40 | 43.46 | 41.73 | 52.75 | 36.78 | 35.94 | 60.77 | 53.28 | 50.57 | |
| PointPillar [25] | 88.02 | 78.66 | 78.06 | 53.12 | 46.00 | 44.49 | 56.74 | 40.24 | 39.43 | 65.96 | 54.97 | 53.99 | |
| COD (PointPillar+RT-DETR) | 84.80 | 83.40 | 76.80 | 55.05 | 46.55 | 44.85 | 50.88 | 34.70 | 34.27 | 63.57 | 54.89 | 51.97 | |
| Detector Modality | Modal | Car (AP@0.7) | Pedestrian (AP@0.5) | Cyclist (AP@0.5) | mAP | ||||||||
|---|---|---|---|---|---|---|---|---|---|---|---|---|---|
| easy | mod. | hard | easy | mod. | hard | easy | mod. | hard | easy | mod. | hard | ||
| CenterPoint [38] | 3D | 71.18 | 62.25 | 62.24 | 13.64 | 13.52 | 13.52 | 42.43 | 41.57 | 41.34 | 42.42 | 39.11 | 39.03 |
| COD (CenterPoint+RT-DETR) | 71.39 | 62.48 | 62.46 | 20.81 | 15.06 | 15.15 | 42.93 | 41.59 | 41.46 | 45.04 | 39.71 | 39.69 | |
| PillarNet [39] | 69.85 | 61.28 | 61.24 | 14.46 | 14.22 | 14.22 | 39.40 | 33.00 | 32.90 | 41.24 | 36.16 | 36.12 | |
| COD (PillarNet+RT-DETR) | 69.75 | 61.36 | 61.32 | 10.03 | 8.89 | 8.89 | 38.64 | 32.68 | 32.53 | 39.48 | 34.31 | 34.25 | |
| SECOND [24] | 70.39 | 61.87 | 61.87 | 15.00 | 15.05 | 15.05 | 42.64 | 41.87 | 41.76 | 42.67 | 39.60 | 39.56 | |
| COD (SECOND+RT-DETR) | 71.02 | 62.26 | 62.24 | 15.70 | 16.00 | 16.00 | 43.14 | 42.09 | 42.05 | 43.28 | 40.12 | 40.10 | |
| PointPillar [25] | 70.52 | 61.66 | 61.59 | 12.05 | 12.47 | 12.47 | 38.48 | 33.18 | 33.10 | 40.35 | 35.77 | 35.72 | |
| COD (PointPillar+RT-DETR) | 70.16 | 61.50 | 61.42 | 9.38 | 9.66 | 9.66 | 40.02 | 34.22 | 34.16 | 39.85 | 35.12 | 35.08 | |
| CenterPoint [38] | Bbox | 20.09 | 17.51 | 17.50 | 24.56 | 22.74 | 22.70 | 39.84 | 38.89 | 38.91 | 28.16 | 26.38 | 26.37 |
| COD (CenterPoint+RT-DETR) | 63.61 | 56.12 | 56.07 | 35.01 | 27.27 | 27.27 | 51.13 | 44.27 | 44.22 | 49.92 | 42.56 | 42.52 | |
| PillarNet [39] | 19.64 | 17.11 | 17.13 | 26.60 | 17.87 | 17.87 | 39.24 | 32.80 | 32.82 | 28.49 | 22.59 | 22.61 | |
| COD (PillarNet+RT-DETR) | 60.13 | 54.51 | 54.50 | 27.27 | 25.79 | 25.79 | 44.22 | 43.66 | 43.63 | 43.87 | 41.32 | 41.31 | |
| SECOND [24] | 19.27 | 17.01 | 17.06 | 25.90 | 24.96 | 24.96 | 39.44 | 39.68 | 39.58 | 28.20 | 27.22 | 27.20 | |
| COD (SECOND+RT-DETR) | 60.52 | 54.29 | 54.30 | 35.48 | 27.27 | 27.27 | 52.69 | 44.70 | 44.69 | 49.56 | 42.09 | 42.09 | |
| PointPillar [25] | 20.19 | 17.55 | 17.56 | 25.80 | 17.73 | 17.73 | 30.73 | 32.19 | 32.10 | 25.57 | 22.49 | 22.46 | |
| COD (PointPillar+RT-DETR) | 69.47 | 61.12 | 61.11 | 27.27 | 27.27 | 27.27 | 44.57 | 43.82 | 43.74 | 47.10 | 44.07 | 44.04 | |
III-C Positive Samples Matching
In this article, although two sets of queries are concurrently processed through the decoder’s attention mechanism, their outputs from the decoder are distinct. Queries initialized based on the heatmap require matching with the ground truth to determine whether they are positive or negative samples. In contrast, queries initialized from point cloud proposals do not require further matching since they are associated with corresponding ground truth from the outset and align with the predicted bounding boxes from the point cloud. This ensures that the targets decoded from the queries correspond to the same targets detected in the point cloud.
III-D Training Losses
The loss function comprises two parts: one from the point cloud detection network and another from the image detection network. To preserve the network’s simplicity, we eschew any bells and whistles, simply adding the loss from the point cloud detection to the RT-DETR loss to derive the final loss for optimization.
Here, the term represents the loss for the point cloud network, primarily comprising classification and localization losses. Similarly, denotes the loss for the image network, consistent with that of RT-DETR. The parameter serves as a balancing factor between these two losses, and in this study, is set to .
IV Experiments
IV-A Experimental Setup
IV-A1 Datasets
We primarily evaluated and analyzed our proposed method on KITTI [10] and DAIR-V2X [11]. The KITTI dataset, a classic object detection dataset, is collected from real traffic scenarios and is particularly valuable because it annotates the spatial positions of objects in both point clouds and image pixels. This dual annotation is advantageous for the training and evaluation of our proposed algorithm. Additionally, the DAIR-V2X dataset, also derived from real scenarios, is used in this study. Specifically, we utilize the infrastructure data from this dataset, which similarly annotates the positions of objects in both point clouds and images. It is noteworthy that the original methods compared in this article are capable only of inferring the position of objects within 3D bounding box point clouds. The bounding boxes in images are calculated based on a calibration matrix between the point cloud and the image, utilizing the 3D bounding boxes.
IV-A2 Metrics
We evaluate the detection performance by the mean Average Precision under recall thresholds (mAP@R11) the same as the official benchmark and evaluation for classes including Pedestrian, Cyclist, and Car. In the evaluation criteria, if the overlap ratio (Intersection over Union, IoU) of a car’s bounding box with the ground truth exceeds , it is considered a True Positive (TP). For pedestrians and cyclists, an overlap ratio of is deemed sufficient to classify a detection as TP. This standard aligns with the official evaluation protocols of the KITTI dataset.
Additionally, this paper introduces a metric for consistency detection called Consistency Precision (CP), which is calculated using the formula:
Here, , or True Consistent Detection, represents the number of 3D detections that correspond to the same target as their 2D detection results, and is the number of ground truth samples in 3D detection. The value ranges between and , with higher values indicating better performance of the consistency detection.
| Detector Modality | KITTI | DAIR-V2X | ||||||||||
|---|---|---|---|---|---|---|---|---|---|---|---|---|
| Vehicle CP | Pedestrian CP | Bicycle CP | Vehicle CP | Pedestrian CP | Bicycle CP | |||||||
| noise-free | noise | noise-free | noise | noise-free | noise | noise-free | noise | noise-free | noise | noise-free | noise | |
| CenterPoint [38] & RT-DETR [3] | 66.45 | 54.3 | 22.11 | 20.2 | 17.36 | 14.33 | 21.34 | 17.55 | 11.85 | 7.47 | 4.73 | 3.69 |
| COD (CenterPoint+RT-DETR) | 75.06 | 68.76 | 49.87 | 43.51 | 42.22 | 34.94 | 55.67 | 49.02 | 25.25 | 15.97 | 43.46 | 25.75 |
| PillarNet [39] & RT-DETR [3] | 64.87 | 54.2 | 17.72 | 16.62 | 14.56 | 12.71 | 20.64 | 16.8 | 9.79 | 7.98 | 6.15 | 4.97 |
| COD (PillarNet+RT-DETR) | 79.17 | 73.88 | 42.72 | 38.29 | 33.59 | 29.68 | 55.46 | 48.28 | 20.1 | 15.97 | 39.77 | 24.24 |
| SECOND [24] & RT-DETR [3] | 68.63 | 57.00 | 20.13 | 18.60 | 15.90 | 13.55 | 19.92 | 16.37 | 10.3 | 9.02 | 6.25 | 5.63 |
| COD (SECOND+RT-DETR) | 76.21 | 69.98 | 40.00 | 34.61 | 38.75 | 33.59 | 56.26 | 48.28 | 23.71 | 17.01 | 43.65 | 29.82 |
| PointPillar [25] & RT-DETR [3] | 66.08 | 54.89 | 19.82 | 18.44 | 16.01 | 13.89 | 20.52 | 16.66 | 10.82 | 8.76 | 6.53 | 5.2 |
| COD (PointPillar+RT-DETR) | 80.22 | 71.88 | 39.82 | 36.62 | 37.51 | 32.7 | 64.25 | 57.39 | 19.58 | 15.46 | 39.58 | 24.24 |
-
1
“3D Detector & RT-DETR” is a post-processing method where 3D detects 3D boxes and RT-DETR detects 2D boxes. Through matching post-processing techniques, the
correspondence between the 3D and 2D boxes is established.
-
2
“COD (3D Detector+RT-DETR)” is an end-to-end consistency detection method that we have proposed.
| Detector Modality | Training Noise | Car (Bbox AP@0.7) | Pedestrian (Bbox AP@0.5) | Cyclist (Bbox AP@0.5) | Bbox mAP | ||||||||
|---|---|---|---|---|---|---|---|---|---|---|---|---|---|
| easy | mod. | hard | easy | mod. | hard | easy | mod. | hard | easy | mod. | hard | ||
| CenterPoint [38] | - | 37.14 | 29.55 | 30.52 | 44.59 | 39.42 | 34.62 | 38.69 | 26.35 | 26.57 | 40.14 | 31.77 | 30.57 |
| COD (CenterPoint+RT-DETR) | ✗ | 59.80 | 54.47 | 50.48 | 52.24 | 50.01 | 43.88 | 52.39 | 29.98 | 30.21 | 54.81 | 44.82 | 41.52 |
| COD (CenterPoint+RT-DETR) | ✓ | 70.46 | 68.60 | 62.95 | 49.39 | 43.03 | 41.45 | 51.98 | 35.91 | 30.12 | 57.28 | 49.18 | 44.84 |
| PillarNet [39] | - | 28.19 | 22.7 | 24.8 | 38.53 | 32.64 | 31.98 | 40.49 | 25.81 | 25.79 | 35.74 | 27.05 | 27.52 |
| COD (PillarNet+RT-DETR) | ✗ | 67.24 | 58.73 | 58.84 | 51.82 | 43.98 | 42.25 | 44.26 | 28.94 | 28.32 | 54.44 | 43.88 | 43.14 |
| COD (PillarNet+RT-DETR) | ✓ | 79.74 | 80.95 | 75.26 | 59.93 | 52.07 | 45.63 | 48.55 | 32.31 | 31.97 | 62.74 | 55.11 | 50.95 |
| SECOND [24] | - | 34.62 | 26.59 | 27.63 | 38.35 | 33.55 | 32.69 | 42.07 | 27.97 | 27.7 | 38.35 | 29.37 | 29.34 |
| COD (SECOND+RT-DETR) | ✗ | 63.35 | 57.63 | 57.25 | 45.94 | 39.34 | 34.01 | 48.52 | 29.28 | 28.97 | 52.60 | 42.08 | 40.08 |
| COD (SECOND+RT-DETR) | ✓ | 75.69 | 77.73 | 72.87 | 52.35 | 44.92 | 43.21 | 42.64 | 26.8 | 26.18 | 56.89 | 49.82 | 47.42 |
| PointPillar [25] | - | 35.89 | 28.98 | 29.68 | 36.74 | 31.44 | 30.29 | 38.93 | 25.91 | 25.62 | 37.19 | 28.78 | 28.53 |
| COD (PointPillar+RT-DETR) | ✗ | 66.59 | 58.72 | 53.6 | 52.59 | 43.93 | 37.83 | 42.02 | 27.57 | 26.33 | 53.73 | 43.41 | 39.25 |
| COD (PointPillar+RT-DETR) | ✓ | 81.20 | 81.73 | 75.82 | 58.65 | 50.45 | 44.22 | 55.50 | 37.16 | 35.43 | 65.12 | 56.45 | 51.82 |
IV-A3 Implementation Details
In this study, the 3D object detection networks—CenterPoint [38], PillarNet [39], SECOND [24], and PointPillar [25]—were trained using the original models from the open-source OpenPCDet [8] repository, with the standard configuration files and trained over epochs. For the 2D detection, the RT-DETR [3] code from the open-source YOLOV8 [40] project was employed. The consistency detection architecture involved integrating the RT-DETR code from YOLOV8 into OpenPCDet. In all of our experiments, whether conducted on the KITTI or DAIR-V2X datasets, we configured the point cloud and image consistency detection algorithm training parameters as follows: the network input image size scaling was set to , and the range of the point cloud was from the current to the meter position, meters from left to right, and from to meter from top to bottom.
All experiments were conducted on a system running Ubuntu 20.04, equipped with two GeForce RTX 3090 GPUs. The experiments ran for epochs using the “Adam+onecycle” optimizer. The learning rate was set at , weight decay at , and momentum at . Additionally, the batch size was configured to , with all other settings remaining at their default values. Unless specified otherwise, the noise referred to in the experiments pertains to the addition of noise to the extrinsic matrix between the point cloud and image data. Specifically, this noise consists of random rotational disturbances around the X, Y, and Z axes with a mean of and a variance of degrees, accompanied by random translational disturbances along the X, Y, and Z axes with a mean of and a variance of meters. Additionally, the DAIR-V2X dataset can be converted into the KITTI dataset format using its own scripts, allowing it to maintain the same settings and utilize the same tools as the KITTI dataset. It is worth noting that the Bbox mAP of the evaluated 3D detectors [38, 25, 39, 24] in this paper is derived using post-processing methods from the detected 3D bounding boxes.
| Detector Modality | Noise | Car (Bbox AP@0.7) | Pedestrian (Bbox AP@0.5) | Cyclist (Bbox AP@0.5) | Bbox mAP | |||||||||
|---|---|---|---|---|---|---|---|---|---|---|---|---|---|---|
| rot. | trans. | easy | mod. | hard | easy | mod. | hard | easy | mod. | hard | easy | mod. | hard | |
| CenterPoint [38] | ✓ | ✓ | 36.53 | 28.78 | 29.97 | 47.63 | 42.00 | 41.08 | 41.04 | 28.16 | 27.84 | 41.74 | 32.98 | 32.96 |
| COD (CenterPoint+RT-DETR) | 60.23 | 54.67 | 50.72 | 58.08 | 51.55 | 45.36 | 52.69 | 36.41 | 31.00 | 57.00 | 47.54 | 42.36 | ||
| CenterPoint [38] | ✗ | ✓ | 86.78 | 77.89 | 78.04 | 62.03 | 54.89 | 53.73 | 67.02 | 49.70 | 42.50 | 71.94 | 60.83 | 58.09 |
| COD (CenterPoint+RT-DETR) | 79.44 | 80.81 | 74.80 | 61.63 | 54.82 | 53.31 | 58.89 | 41.24 | 40.95 | 66.65 | 58.96 | 56.35 | ||
| CenterPoint [38] | ✓ | ✗ | 37.40 | 29.32 | 30.49 | 45.45 | 40.78 | 40.28 | 39.36 | 26.32 | 26.56 | 40.74 | 32.14 | 32.44 |
| COD (CenterPoint+RT-DETR) | 60.25 | 54.87 | 50.88 | 56.83 | 50.52 | 44.32 | 51.13 | 30.10 | 29.85 | 56.07 | 45.17 | 41.68 | ||
IV-B Main Results
IV-B1 Overall Performances
The consistency detection method proposed in this article is capable of simultaneously detecting the positions of objects in both point clouds and images through a single forward inference, assigning the same ID to the same object across both modalities. In traditional 3D detection algorithms, the detection of image bounding boxes (Bbox) is calculated using a calibration matrix between the point cloud and the image, rather than being directly inferred by the network, making the precision of image Bbox highly dependent on the accuracy of the calibration matrix. The accuracy comparisons for 3D and 2D detections between traditional methods and the proposed consistency detection approach are presented in Table I and Table II. From Table I, it is evident that the method proposed in this article demonstrates performance comparable to traditional methods in terms of both 3D detection accuracy and 2D Bbox precision. However, as depicted in Table II, in the context of DAIR-V2X data, the precision of traditional methods’ Bbox, which relies heavily on the accuracy of the calibration matrix between point clouds and images, degrades significantly when the matrix is imprecise. This trend is further confirmed by the subsequent Table V. In contrast, the Bbox precision inferred by the proposed method remains high, achieving double the accuracy of the traditional methods. This illustrates the robustness of the proposed method against calibration errors in real-world scenarios.
IV-B2 Consistency Precision Analysis
We have evaluated the accuracy of target correspondence within the consistency method between images and point clouds and compared it to traditional match-based methods for determining correspondences. These traditional methods first use separate 3D and 2D detectors to identify targets and then employ the calibration matrix between point clouds and images to match 3D detection boxes with 2D detection boxes. In this study, the 2D detector employed was RT-DETR [3] from YOLOV8 [40].
The results of the consistency detection are displayed in Table III. Here, “3D detection & RT-DETR” describes the approach where the 3D detector and RT-DETR function independently to identify objects, which is followed by a post-processing phase that aligns the 2D and 3D detection outcomes. Conversely, “3D detection+RT-DETR” represents the consistency detection method introduced in this paper. The table distinctly illustrates that the consistency precision of the proposed method surpasses traditional methods, demonstrating enhanced performance even under noisy conditions. This underscores the robustness of the proposed consistency detection approach, particularly its capability to sustain high accuracy across diverse modalities in sub-optimal conditions.
IV-C Ablation Studies
IV-C1 Noise Resistance of Different Methods
Noise ablation experiments were conducted to evaluate the performance of the method proposed in this paper for image bounding box detection when the calibration matrix is inaccurate. These experiments compared traditional methods, the consistency detection method proposed in the paper, and the consistency detection method with noise introduced during training. In Table IV, “-” indicates that the training process is unaffected by calibration matrix noise, “✗” denotes training without calibration matrix noise, and “✓” signifies training with noise in the calibration matrix.
The final results, tested under conditions where the calibration matrix contained noise as shown in Table IV, demonstrate that compared to traditional computational methods, the proposed method exhibits superior resistance to interference. Additionally, introducing noise during the training phase further enhances this interference resistance, demonstrating the effectiveness of noise-augmented training in improving the robustness of the detection system under conditions of calibration matrix inaccuracies.
IV-C2 Different Noise Effects
Different types of noise were introduced to compare our method with traditional methods in terms of image detection accuracy, further exploring the robustness of our approach under conditions of inaccurate camera parameters. In Table V, ‘rot.’ and ‘trans.’ represent rotational and translational noise, respectively, each with a mean value of zero and variances of and , expressed in degrees and meters, respectively.
In Table V, we observe that the post-processing method is less resilient to translational interference compared to rotational interference. Specifically, our method performs excellently in the presence of combined noise and individual rotational noise, while exhibiting slightly inferior performance compared to traditional methods in the presence of translational noise. This is because the translational variance set by us is minimal, resulting in only slight shifts in the bounding boxes calculated using traditional methods, thereby minimally impacting the mean Average Precision (mAP). In contrast, rotational noise can cause significant deformation to the calculated bounding boxes, thus having a larger impact on mAP. Our method maintains better performance under both types of noise, demonstrating stronger robustness.
IV-D Visualisation Results
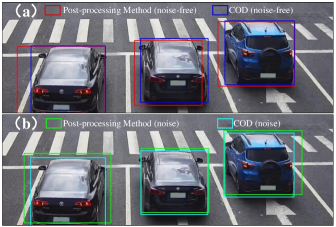
We have visually compared the traditional method of calculating image bounding boxes (Bbox) from 3D Bbox data with our proposed method, as presented in Figure 3. The comparison also examines the performance of both methods under conditions with and without noise. As depicted in Figure 3 (b), despite the presence of noise, the detection boxes of the COD method continue to align closely with the objects, thus reinforcing the viability of our COD approach in noisy environments. Additionally, contrasting Figure 3 (a) with Figure 3 (b) reveals that while post-processing-based methods experience considerable displacement of bounding boxes following noise introduction, our COD method consistently maintains tightly fitted detection boxes around the targets, irrespective of noise, thereby demonstrating superior robustness.
V Conclusion
This paper has introduced the task of consistency detection and proposes a method to address it. Moreover, to measure the accuracy of consistency, a specific metric, Consistency Precision (CP), is introduced. Extensive experiments were conducted to demonstrate the effectiveness and robustness of the proposed method, thereby establishing a benchmark for consistency detection. Consistency detectors are instrumental in locating the same target across different modalities, which is of significant importance for human-machine interaction and environmental perception. It is anticipated that such technology will find widespread applications in various interactive fields in the future.
References
- [1] Z. Ge, S. Liu, F. Wang, Z. Li, and J. Sun, “YOLOX: Exceeding YOLO series in 2021,” arXiv preprint arXiv:2107.08430, 2021.
- [2] J. Redmon, S. Divvala, R. Girshick, and A. Farhadi, “You only look once: Unified, real-time object detection,” in Proc. CVPR, 2016, pp. 779–788.
- [3] Y. Zhao et al., “DETRs beat YOLOs on real-time object detection,” arXiv preprint arXiv:2304.08069, 2023.
- [4] C. He, H. Zeng, J. Huang, X.-S. Hua, and L. Zhang, “Structure aware single-stage 3D object detection from point cloud,” in Proc. CVPR, 2020, pp. 11 870–11 879.
- [5] Y. Chen et al., “FocalFormer3D: Focusing on hard instance for 3D object detection,” in Proc. ICCV, 2023, pp. 8360–8371.
- [6] H. Hu, F. Wang, J. Su, Y. Wang, L. Hu, W. Fang, J. Xu, and Z. Zhang, “Ea-lss: Edge-aware lift-splat-shot framework for 3d bev object detection,” arXiv preprint arXiv:2303.17895, 2023.
- [7] Z. Liu, H. Tang, A. Amini, X. Yang, H. Mao, D. Rus, and S. Han, “Bevfusion: Multi-task multi-sensor fusion with unified bird’s-eye view representation,” in IEEE International Conference on Robotics and Automation (ICRA), 2023.
- [8] O. D. Team, “Openpcdet: An open-source toolbox for 3d object detection from point clouds,” https://github.com/open-mmlab/OpenPCDet, 2020.
- [9] N. Carion, F. Massa, G. Synnaeve, N. Usunier, A. Kirillov, and S. Zagoruyko, “End-to-end object detection with transformers,” in Proc. ECCV, vol. 12346, 2020, pp. 213–229.
- [10] A. Geiger, P. Lenz, and R. Urtasun, “Are we ready for autonomous driving? The KITTI vision benchmark suite,” in Proc. CVPR, 2012, pp. 3354–3361.
- [11] H. Yu et al., “DAIR-V2X: A large-scale dataset for vehicle-infrastructure cooperative 3D object detection,” in Proc. CVPR, 2022, pp. 21 329–21 338.
- [12] R. Girshick, “Fast R-CNN,” in Proc. ICCV, 2015, pp. 1440–1448.
- [13] S. Ren, K. He, R. B. Girshick, and J. Sun, “Faster R-CNN: Towards real-time object detection with region proposal networks,” IEEE Transactions on Pattern Analysis and Machine Intelligence, vol. 39, no. 6, pp. 1137–1149, 2017.
- [14] T.-Y. Lin, P. Dollár, R. Girshick, K. He, B. Hariharan, and S. Belongie, “Feature pyramid networks for object detection,” in Proc. CVPR, 2017, pp. 936–944.
- [15] K. He, G. Gkioxari, P. Dollár, and R. Girshick, “Mask R-CNN,” in Proc. ICCV, 2017, pp. 2980–2988.
- [16] W. Liu et al., “SSD: Single shot multibox detector,” in Proc. ECCV, vol. 9905, 2015, pp. 21–37.
- [17] J. Redmon and A. Farhadi, “YOLOv3: An incremental improvement,” arXiv preprint arXiv:1804.02767, 2018.
- [18] C.-Y. Wang, A. Bochkovskiy, and H.-Y. M. Liao, “YOLOv7: Trainable bag-of-freebies sets new state-of-the-art for real-time object detectors,” Proc. CVPR, pp. 7464–7475, 2022.
- [19] T. Cheng, L. Song, Y. Ge, W. Liu, X. Wang, and Y. Shan, “YOLO-World: Real-time open-vocabulary object detection,” in Proc. CVPR, 2024.
- [20] Z. Yao, J. Ai, B. Li, and C. Zhang, “Efficient DETR: Improving end-to-end object detector with dense prior,” arXiv preprint arXiv:2104.01318, 2021.
- [21] F. Li, H. Zhang, S. guang Liu, J. Guo, L. M. shuan Ni, and L. Zhang, “DN-DETR: Accelerate DETR training by introducing query denoising,” Proc. CVPR, pp. 13 609–13 617, 2022.
- [22] H. Zhang et al., “DINO: DETR with improved denoising anchor boxes for end-to-end object detection,” in Proc. ICLR, 2023.
- [23] Y. Zhou and O. Tuzel, “VoxelNet: End-to-end learning for point cloud based 3D object detection,” Proc. CVPR, pp. 4490–4499, 2017.
- [24] Y. Yan, Y. Mao, and B. Li, “SECOND: Sparsely embedded convolutional detection,” Sensors, vol. 18, no. 10, p. 3337, 2018.
- [25] A. H. Lang, S. Vora, H. Caesar, L. Zhou, J. Yang, and O. Beijbom, “PointPillars: Fast encoders for object detection from point clouds,” in Proc. CVPR, 2019, pp. 12 697–12 705.
- [26] M. Ye, S. Xu, and T. Cao, “HVNet: Hybrid voxel network for LiDAR based 3D object detection,” Proc. CVPR, pp. 1628–1637, 2020.
- [27] C. R. Qi, L. Yi, H. Su, and L. J. Guibas, “PointNet++: Deep hierarchical feature learning on point sets in a metric space,” in Proc. NeurIPS, vol. 30, 2017, pp. 5099–5108.
- [28] C. R. Qi, H. Su, K. Mo, and L. J. Guibas, “PointNet: Deep learning on point sets for 3D classification and segmentation,” Proc. CVPR, pp. 77–85, 2016.
- [29] A. H. Lang, S. Vora, H. Caesar, L. Zhou, J. Yang, and O. Beijbom, “PointPillars: Fast encoders for object detection from point clouds,” in Proc. CVPR, 2018, pp. 12 697–12 705.
- [30] Z. Yang, Y. Sun, S. Liu, and J. Jia, “3DSSD: Point-based 3D single stage object detector,” Proc. CVPR, pp. 11 037–11 045, 2020.
- [31] S. Vora, A. H. Lang, B. Helou, and O. Beijbom, “PointPainting: Sequential fusion for 3D object detection,” Proc. CVPR, pp. 4603–4611, 2019.
- [32] L. Pan et al., “Variational relational point completion network,” in Proc. CVPR, 2021, pp. 8524–8533.
- [33] X. Bai et al., “TransFusion: Robust LiDAR-camera fusion for 3D object detection with transformers,” Proc. CVPR, pp. 1080–1089, 2022.
- [34] M. Liang, B. Yang, Y. Chen, R. Hu, and R. Urtasun, “Multi-task multi-sensor fusion for 3D object detection,” Proc. CVPR, pp. 7345–7353, 2019.
- [35] Y. Li et al., “DeepFusion: Lidar-camera deep fusion for multi-modal 3D object detection,” Proc. CVPR, pp. 17 161–17 170, 2022.
- [36] X. Wu et al., “Sparse fuse dense: Towards high quality 3D detection with depth completion,” Proc. CVPR, pp. 5408–5417, 2022.
- [37] S. Pang, D. Morris, and H. Radha, “CLOCs: Camera-LiDAR object candidates fusion for 3D object detection,” Proc. IROS, pp. 10 386–10 393, 2020.
- [38] T. Yin, X. Zhou, and P. Krähenbühl, “Center-based 3D object detection and tracking,” in Proc. CVPR, 2021, pp. 11 784–11 793.
- [39] C. M. Guangsheng Shi, Ruifeng Li, “PillarNet: Real-time and high-performance pillar-based 3D object detection,” in Proc. ECCV, vol. 13670, 2022, pp. 35–52.
- [40] G. Jocher, A. Chaurasia, and J. Qiu, “Ultralytics YOLO,” Jan. 2023. [Online]. Available: https://github.com/ultralytics/ultralytics