Probing the nova shock physics with future gamma-ray observations of the upcoming outburst from T Coronae Borealis
Abstract
Nova shocks behave like scaled-down supernova remnant shocks with a lifetime of only a few weeks or months, thereby providing a unique opportunity to study the dynamics of non-relativistic shocks as well as the shock acceleration physics. Recently, GeV and TeV gamma-ray emissions from an outburst of the recurrent nova RS Ophiuchi have been observed. The light curves of the gamma-ray emissions suggest that they arise from an external shock, which is formed as the nova ejecta interacts with the ambient medium. The shock is thought to transit from an adiabatic shock to a radiative one at later times, but no such later observations are available for RS Ophiuchi. In addition, the spectral evolution of the gamma-ray outburst of RS Ophiuchi was not well measured, and hence the related particle acceleration mechanisms are not well understood. T Coronae Borealis (T CrB) is another recurrent nova in Milky Way and its last outburst was nearly ten times brighter than RS Ophiuichi. Recently the optical light curve of T CrB displayed a state transition behavior before the eruption, and it was predicted that T CrB will undergo an outburst in the near future. By performing a theoretical investigation, we find that Fermi-LAT could capture the transition of the shock from the adiabatic phase to the radiative phase at the GeV band, thanks to a longer detectable time than that of RS Ophiuchi. Due to its higher brightness, we also find that imaging atmospheric Cherenkov telescopes (IACTs) such as MAGIC and VERITAS, and extensive air shower experiments such as LHAASO could detect the nova outburst and measure the gamma-ray spectrum in the very-high-energy (VHE, energy above 0.1 TeV) band more precisely. This can be used to constrain the high-energy cutoff index in the accelerated proton spectrum and the acceleration efficiency, which will shed light on the particle acceleration physics in nova shocks.
keywords:
nova , gamma-ray astronomy , cosmic-ray[1]organization=School of Astronomy and Space Science, Nanjing University,city=Nanjing, postcode=210093, country=China \affiliation[2]organization=Key Laboratory of Modern Astronomy and Astrophysics (Nanjing University), city=Nanjing, postcode=210093, country=China \affiliation[3]organization=Institute of High Energy Physics, Chinese Academy of Sciences, city=Beijing, postcode=100049, country=China \affiliation[4]organization=University of Chinese Academy of Sciences, city= Beijing , postcode=100049, country=China \affiliation[5] organization= Tianfu Cosmic Ray Research Center, city= Chengdu , postcode=610000, country=China
1 Introduction
Novae are energetic explosions that take place in binary star systems in which white dwarfs (WD) accrete matter from their companion stars. Accreted materials accumulate on the surface of the WD, leading to the rise of the temperature, which finally results in a thermonuclear runaway when the layer reaches the critical mass (e.g. Townsley and Bildsten, 2004). Novae are usually classified into two categories based on the nature of companion stars: classical novae and novae in the symbiotic systems. Classical novae are binary systems comprising of a main sequence star while binary systems with a red giant (RG) companion are novae in symbiotic systems (Chomiuk et al., 2021).
After the launch of Fermi Large Area Telescope (LAT), a dozen of novae were discovered in the GeV gamma-ray band, confirming that nova outbursts can produce strong shocks and accelerate relativistic particles (e.g. Fermi LAT Collaboration, 2010; Cheung et al., 2016). In classical novae, gamma-ray emissions are thought to arise from internal shocks that occur as a result of internal collisions between distinct components of the nova ejecta. So far, multiwavelength observations from radio to X-rays have shown that internal shocks are common in classical novae (e.g. Chomiuk et al., 2014; Nelson et al., 2019). The GeV light curves of classical novae usually exhibit clear fluctuations.
On the other hand, if the companion star is a red giant star, the WD is embedded in a dense wind from the RG. Ejecta from nova outburst collides with the dense wind, generating an expanding external shock which accelerates relativistic particles. Unlike internal shocks, the light curve of the gamma-ray emission from external shocks is expected to be very smooth.
The first gamma-ray detected nova V407 Cygni (V407 Cyg) was found to be embedded in a stellar wind from a Mira-like red giant. The gamma-ray emission started around the optical peak and lasted a half month (Fermi LAT Collaboration, 2010). The radiation mechanism and the nature of the shocks are still debated. Non-thermal emission from protons and electrons can both explain the spectra of the gamma-ray emission (Fermi LAT Collaboration, 2010). Although an external shock expanding in the dense wind is a natural explanation for V407 Cyg (e.g. Martin and Dubus, 2013), the internal shock model is also suggested to be able to explain the gamma-ray data (Martin et al., 2018).
In 2021, the recurrent nova RS Ophiuchi (RS Oph) erupted and was soon discovered in optical, X-ray and gamma-rays (Munari and Valisa, 2021, 2022; Page et al., 2022; Cheung et al., 2022). Atmospheric Cherenkov telescopes MAGIC and H.E.S.S. successfully measured the time-resolved energy spectra, which reveals the temporal evolution of the maximum particle energy (MAGIC Collaboration, 2022; H. E. S. S. Collaboration, 2022). Interestingly, the peak of the TeV gamma-ray light curve is delayed by two days relative to the peak of the GeV gamma-ray light curve. After the peak, both TeV and GeV gamma-ray emissions decay smoothly in a power-law shape and the decay slopes are roughly consistent with each other (H. E. S. S. Collaboration, 2022).
The power-law decaying light curves support the external shock scenario, where shocks are produced via interactions between the nova ejecta and dense wind from RG. Zheng et al. (2022) interpreted the temporal decay behavior of the gamma-ray emission with an adiabatic external shock expanding in the red giant wind. The argument of adiabatic shock was confirmed by other independent modelings (Diesing et al., 2023; De Sarkar et al., 2023). However, radiative loss may become more important at later times and an adiabatic shock may transit to a radiative shock (Metzger et al., 2014; Chomiuk et al., 2021). A general modeling of shocks including radiative loss is needed to understand the long-term behavior of the light curve.
The discovery of TeV gamma-rays in nova outbursts opened a new window to study the particle acceleration mechanism, especially the maximum energy of accelerated protons. It is found that a single power plus a sub-exponential cutoff for the proton spectrum, , can roughly explain the gamma-ray spectra of the outburst of RS Oph from GeV to TeV band (H. E. S. S. Collaboration, 2022; Zheng et al., 2022). The more common cutoff shape, , would, however, require some additional components to explain the GeV-TeV gamma-ray emission, such as multiple shocks (Diesing et al., 2023) or leptonic processes (De Sarkar et al., 2023).
In 2015, American Association of Variable Star Observers (AAVSO) found that the B-band light curve of T CrB had a transition to a different state, whose curve shape in the B and V bands are similar to the pre-erupton phase around 1938. Munari et al. (2016) confirmed the state transition photometrically and spectroscopically and called attention to this as being similar to the transition in 1938. Based on the similarity, Schaefer (2019) predicted that the next eruption may occur in 2023.61.0. With follow-up observations, Luna et al. (2020) predicted that the eruption will occur in 2023–2026. Currently, the B-band light curve of T CrB is in the pre-eruption dip, which predicts that the eruption date is in 2024 (Schaefer et al., 2023).
In Section 2, we first introduce our model for studying the shock evolution by including the radiative loss of the shock. Then, we apply this model to T CrB in Section 2.2 and study the observation signature for the transition from the adiabatic phase to the radiative phase. We then compute the GeV-TeV emission spectra and compare them with the sensitivity of MAGIC, VERITAS and LHAASO. We discuss the constraints on the particle acceleration physics that could be obtained with future TeV observations. A final conclusion and discussion are given in Section 4.
2 An External shock model for nova outbursts and application to T CrB
2.1 External shock model
The total energy of the shock includes the kinetic energy and the internal energy (e.g. Ostriker and McKee, 1988; Padmanabhan, 2001). If the radiative loss is negligible, the energy of the shock can be expressed by
| (1) |
where is the initial mass of the ejecta, is the velocity of the shock. The factor in the term of the internal energy is derived from the shock jumping conditions.
As the nova expands into the ambient medium, new material is swept into the shock and the shock velocity gradually decreases after the swept-up matter has a mass comparable to that of the initial ejecta. If initial radiative loss is small, the shock is adiabatic at early times. Its dynamics is identical to the Sedov phase of supernova remnants (SNRs). At later times, the radiative losses from the shock become significant and this stage is identical to the pressure-driven snowplow phase of SNRs.
Considering the thin-shell approximation where the nova ejecta and the swept-up matter are confined to a thin layer behind the shock, the energy loss rate of a fully radiative shock is (see Eq. 6.8 in Ostriker and McKee (1988))
| (2) |
where is the density of ambient environment, and is the energy flux density across the shock. In this stage, all of the energy of the swept-up material is radiated away. In reality, between the adiabatic phase and radiative phase, only a portion of energy flux radiates, where is defined as the radiation efficiency. Therefore, the shock energy after considering the radiative loss is given by
| (3) |
Considering the energy loss rate , we derive the dynamic equation of shock evolution, which is
| (4) |
The increasing rate of swept-up mass is . This dynamic equation can smoothly model the shock transition between the adiabatic phase and the radiative phase. It is difficult to obtain an analytical solution of the equation because the shock velocity and swept-up are both time-dependent. To analyse the self-similar solution of the shock, we re-write the Eq. (4) as
| (5) |
In the adiabatic phase, the radiation efficiency is zero (), then the solution of Eq. (5) is , leading to in the self-similar phase. For a ambient medium with a density , the shock velocity evolves as , resulting in and . In the fully radiative phase (), the solution is . So the shock velocity and radius evolve with time as and . In a wind medium environment , the shock dynamics is described by and for an adiabatic shock, while for a radiative shock, and .
We use the cooling timescale to calculate the radiation efficiency , where is the dynamic timescale and is the radiative cooling timescale. In nova ejecta, the main cooling channels are free-free emission with and line emission with (Schure et al., 2009), where is the cooling function. The shock temperature is
| (6) |
where is the Boltzmann constant, and is the mean molecular weight for nova ejecta. Hereafter, we adopt the convention that subscript numbers indicate normalization by in cgs units.
The transition of two cooling mechanisms occurs around K, corresponding to the shock velocity . The cooling time of the shock is , where is the post-shock density. We use the accurate line emission cooling function given by plasma simulations (see Fig.1 in Schure et al. (2009)). For novae with high initial velocities (), free-free emission is dominant in the early epoch, so the radiative efficiency is . The shock is roughly adiabatic if the ambient density is small, . At later times, as the shock decelerates, the shock will gradually transit to the radiative phase, which could be observed if the detectable time is sufficiently long.
2.2 Probing shock dynamics with GeV observations
There are only eleven recurrent novae discovered in our galaxy (Schaefer, 2010; Schaefer et al., 2022). Four of them have a red giant companion (V745 Sco,V3890 Sgr,RS Oph and T CrB). Among them, three novae in symbiotic systems (except for T CrB) have been detected in gamma-rays. These novae all have long orbital periods ( days) and massive WD () (Schaefer, 2010; Shara et al., 2018), suggesting similarities in their ambient environments and explosion mechanisms.
T CrB is the brightest novae in the optical band. Previous outbursts that occurred in 1866 and 1946 have the peak magnitude V=2.0 (Schaefer, 2023), which is nearly ten times brighter than RS Oph (V=5.0) (MAGIC Collaboration, 2022). This is due to that the distance of T CrB (=887pc) is smaller than that of RS Oph (=2.45kpc) (Rupen et al., 2008; Bailer-Jones et al., 2021). This advantage would make the predicted GeV-TeV outburst brighter than that of RS Oph, which will enable the current gamma-ray telescopes to observe its gamma-ray emissions for a longer time and with better precision. In this section, we will show how the GeV-TeV observations of T CrB can be used to study the shock dynamics and probe particle acceleration physics.
T CrB is embedded in the dense wind of a red giant, so the density far from the WD is approximately described by , where We define as the density corresponding to a mass loss rate of and a wind velocity of .
For an initial adiabatic shock, the self-similar solution is and after the deceleration. At the beginning, free-free emission is the dominated cooling channel of the shock, . Noting that and , we have . Because the dynamic timescale also increases with time , the cooling efficiency is constant in this stage, where the reference value of is .
The adiabatic phase ends at when the line emission dominates the cooling. Adopting the deceleration timescale as the beginning of the self similar evolution , we obtain the transit time
| (7) |
After transiting to the line emission dominated cooling phase, the cooling time is . During this phase, the radiative efficiency increases with time , and thus the shock will become fully radiative at a critic time , which is given by
| (8) |
The starting time of the fully radiative phase is sensitive to the nova parameters and the ambient environment. In the 2021 outburst of RS Oph, the initial velocity and ejecta mass are km/s and , so the shock becomes radiative at days.
The gamma-ray emission from nova outbursts are likely produced by the hadronic process (e.g. Li et al., 2017; Chomiuk et al., 2021; H. E. S. S. Collaboration, 2022), where relativistic protons accelerated by nova shocks collide with circum-stellar wind (i.e., interaction), producing pions that decay into gamma-rays. In the adiabatic phase, gamma-ray emissions decline as . The decline gradually transits to when the radiative loss is important (Zheng et al., 2022). Fermi-LAT detected significant GeV signals from RS Oph only in the first month of its outburst. The decay slope agrees with (H. E. S. S. Collaboration, 2022; Zheng et al., 2022). At later times, the source becomes undetectable, so the transition between the radiative phase and the adiabatic phase could not be tested.
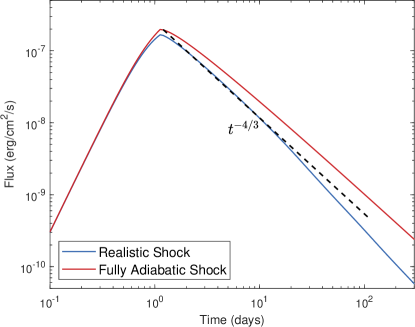
Since T CrB is an order of magnitude brighter than RS Oph, the detectable time by Fermi-LAT could potentially last for up to 170 days, assuming the same decaying slope of . The extended observation period could probably enable us to capture the transition of shock evolution if the wind density is not too small. We compute the gamma-ray emission (0.1-10 GeV) light curve from a realistic shock, which takes into account the time-dependent radiative loss, for the predicted outburst of T CrB. We assume that, similar to RS Oph, the density profile is a broken power-law shape where the density is nearly a constant at small radii while at large radii the density approaches the wind profile (Zheng et al., 2022). The transition occurs at where cm is the semi-major axis for T CrB (Schaefer, 2010). we use the shock parameters , , and .
The light curve of GeV gamma-ray emission is shown in Figure 1. The GeV gamma-ray emission deviates from at days and declines faster at later times, reflecting that radiative loss becomes important at later times. According to Eq. 8, the beginning time of the fully radiative phase is 100 days after the eruption. At 200 days, the difference in the predicted GeV flux between the adiabatic shock model and the realistic shock model is a factor of 4-5, so we expect that Fermi-LAT could distinguish between the two models.
In the calculation, we assume a power-law proton spectrum with a high-energy cutoff, which is
| (9) |
We use the equipartition factor representing a fraction of energy is transferred to accelerated protons and the normalization factor is given by . We adopt and for non-thermal protons. To avoid the influence from the unknown maximum proton energy, we fix the GeV in the computation of Figure 1. Since high-energy cutoff does not affect the 0.1-10 GeV emission, the value of is unimportant for GeV emission.
3 Probing particle acceleration physics with TeV observations
T CrB locates in the northern sky (Dec=), offering favorable conditions for observations by TeV telescopes in the northern hemisphere (e.g. MAGIC, VERITAS, LHAASO). Imaging Atmospheric Cherenkov Telescopes (IACTs) have better sensitivity in the TeV band for short-period observations, but they could be affected by moonlight. Acting as a wide-aperture and high-duty-cycle gamma-ray detector in VHE gamma-rays, LHAASO has advantages of capturing the early stage evolution and continuously observing the long-term evolution of T CrB. The latitude of LHAASO site is about , which means the smallest zenith angle for T CrB is nearly zero, so the observation time in low zenith angle () is more than four hours in one day.
The detectability of TeV gamma-ray emission is sensitive to the cutoff index (see Eq.9) in the proton spectrum. Previous modelings of the nova outbursts used different cutoff index in the spectrum of injected protons (H. E. S. S. Collaboration, 2022; Zheng et al., 2022; Diesing et al., 2023). The cutoff index is determined by the particle transport mechanism inside the shock. Caprioli et al. (2009) derived a stationary solution for the transportation equation, which shows that the cutoff index results from the diffusion coefficient of particles, (see their Eq. 4). The exponential cutoff corresponds to the Bohm diffusion while the sub-exponential cutoff suggests a different diffusion process in the shock. Therefore, one can test the different diffusion processes in the shock if a precise gamma-ray spectrum near the cutoff can be measured.
TeV gamma-ray spectra are also sensitive to the maximum accelerated proton energy. By equating the Lamour radius with the shock radius, one obtains (the Hillas condition)
| (10) |
where is the acceleration efficiency, is the speed of light and is the magnetic field in the post-shocked medium. Assuming that the magnetic energy density behind the shock is proportional to the shock internal energy density, we get the magnetic field , where is the equipartition factor of magnetic field. Observations for SNRs suggest that is within (see Table 3 in Helder et al. (2012)), so we use the medium value in our calculation.
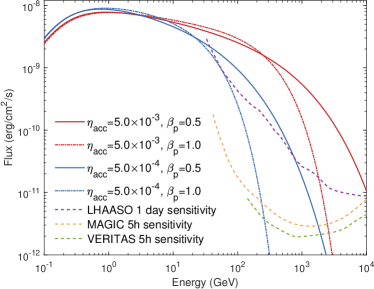
The maximum accelerated energy is then . Here we use the parameter values (, , and ) of RS Oph as the reference values to calculate the gamma-ray emissions of T CrB (Zheng et al., 2022) . For these parameter values, TeV emissions peak at days, and the gamma-ray spectra for two different acceleration efficiencies ( and ) at the peak time are shown in the upper panel of Fig. 2. The sensitivity curves of MAGIC and VERITAS are taken from MAGIC Collaboration (2016) and VERITAS Collaboration (2009). We also show the spectra of gamma-rays with two different cutoff indices ( and ). The gamma-ray spectra for two different cutoff indices have substantial differences because of the different cutoff behaviors in the proton spectrum.
In the case of and , the maximum proton energy is nearly 300 GeV, which is close to the inferred maximum proton energy for RS Oph from TeV observations (Zheng et al., 2022). The flux at 300 GeV is comparable to that of the Crab nebula, , which means IACTs such as VERITAS can collect significant signals within about 5 minutes (VERITAS Collaboration, 2009). For an exponential cutoff spectrum with , IACTs can still detect enough signals in 100-300 GeV if . The observation energy band covers the entire cutoff shape of the photon spectra, which is crucial for identifying the cutoff index of the proton spectra.
The number of photons detected by LHAASO is estimated to be
| (11) |
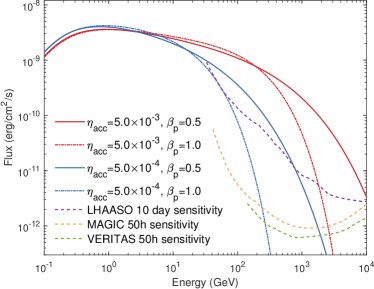
where is the zenith angle of the source, is the effective area of the detector, depending on the zenith angle and photon energies. We used the effective area of WCDA and KM2A provided by LHAASO Collaboration (2022) and LHAASO Collaboration (2021a), respectively. In the RS Oph-like case ( and ), We expect there are more than 1800 photons with energies greater than 300 GeV detected by LHAASO-WCDA from T CrB outburst during the peak day, which would result in a significant detection. However, for an exponential cutoff with and the same acceleration efficiency , the gamma-ray signal is only marginal for detection because of the sharp cutoff of the photon spectra around 30 GeV. LHAASO-WCDA detection would require in the case for a significant detection. We also show the average spectra in the first ten days in the lower panel of Fig. 2. During this longer period, photons collected by WCDA are expected to be more than 7000 in the RS Oph-like case. Conclusions about the detectability for IACTs and LHAASO remain the same.
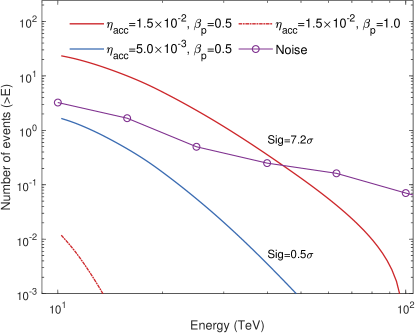
Above 10 TeV, LHAASO-KM2A is more sensitive than IACTs. The cosmic-ray background of LHAASO-KM2A in a cone of was given in the work of LHAASO Collaboration (2021b). Because the Point Spread Function (PSF) of LHAASO-KM2A is , the CR background could be reduced by an additional factor of . However, downsizing the aperture also reduces the strength of signals. To maximize the signal to noise ratio, we use the aperture in the calculations, which covers signals. The significance of the signal is calculated by . We found that the signal is lower than the noise when the zenith angle of the source is larger than because the effective area of LHAASO-KM2A significantly decreases above this angle. Hence, the effective observing time for T CrB is only 4 hours per day.
We calculate the detectability of T CrB outburst at the peak day by LHAASO-KM2A for various values and , which is shown in Fig.3. The three lines represent the photon numbers greater than a specific energy . The background events above 10 TeV are approximately 11 events within 4 hours. To reach the threshold of significance (), the signal photons should be greater than , which requires the acceleration efficiency to be when , corresponding to the maximum proton energy TeV. For an exponential cutoff spectrum with , a very high acceleration efficiency would be required for a significant detection by LHAASO-KM2A.
4 Conclusions and Discussions
We proposed a dynamic model for nova external shocks that includes the radiative loss of the shock. This model produces a smooth transition between the adiabatic phase and radiative phase for the nova shocks. The line emission plays an important role in the late shock evolution, resulting in a fully radiative shock occurring at . The phase transition of the shock manifests itself in the decay slope of the GeV light curve, changing from to , which may be observed in the upcoming outburst of the recurrent nova T CrB.
As a bright nova, T CrB offers a unique opportunity for studying the particle acceleration mechanism by measuring the spectra of VHE gamma-rays. The cutoff shape of the photon spectra reflects the cutoff index of the proton spectra (see Eq. 9). We calculate the gamma-ray flux by using our shock dynamic model and find that the peak flux at 300 GeV is comparable to that of the Crab Nebula, , if the parameters of T CrB are close to those of RS Oph (i.e., and ). The VHE emissions are expected to be detectable by IACTs and LHAASO, as shown in Fig. 2. For an exponential cutoff proton spectrum with , IACTs can still detect T CrB around 100 GeV in the case of , while LHAASO-WCDA requires for a significant detection. Above 10 TeV, T CrB could be detected by LHAASO-KM2A at a significance level of 5 In the case of and . For an exponential cutoff , the required acceleration efficiency for the detection is , which seems to be too extreme. Thus, measurements of VHE gamma-rays from the upcoming outburst of T CrB could constrain the cutoff index in the proton spectrum and the acceleration efficiency, and hence constrain the particle acceleration mechanism in nova shocks.
We assumed in our calculation as it is the medium value obtained from SNR observations (Helder et al., 2012). Noting that some SNRs have relatively high magnetic fields with (e.g. SN 1993J, Helder et al., 2012), the aforementioned constraints on could be relaxed by a factor of three.
In addition, the density of the ambient environment around T CrB is not well-known. Although companion stars of RS Oph and T CrB are both M type red giants, the different orbital periods could lead to different ambient environment. The flux of gamma-ray emission is sensitive to the ambient density because it affects both the shock dynamics and the interaction efficiency. A lower-density environment is unfavorable for detecting the shock transition with GeV gamma-rays.
Since novae are scaled-down supernovae, constraints on the proton spectra and the maximum energy in novae are important for us to test whether young supernova remnants are PeV cosmic-ray accelerators (PeVatrons). Noting that novae in symbiotic systems have similar wind environment to that in core collapsed supernovae (CCSNe), novae are particularly useful to study particle acceleration in the remnants of CCSN. For a mass loss rate from the progenitor of CCSN (Vink, 2020), the maximum proton energy is . A PeVatron would require that the acceleration efficiency is .
Acknowledgements
The authors thank Zhen Cao, Yong Huang and Shi-Cong Hu for useful discussions. The work is supported by the NSFC under grants Nos. 12333006, 12121003, 12393852.
References
- Bailer-Jones et al. (2021) Bailer-Jones, C.A.L., Rybizki, J., Fouesneau, M., Demleitner, M., Andrae, R., 2021. Estimating Distances from Parallaxes. V. Geometric and Photogeometric Distances to 1.47 Billion Stars in Gaia Early Data Release 3. Astron. J. 161, 147. doi:10.3847/1538-3881/abd806, arXiv:2012.05220.
- Caprioli et al. (2009) Caprioli, D., Blasi, P., Amato, E., 2009. On the escape of particles from cosmic ray modified shocks. Mon. Not. R. Astron. Soc. 396, 2065–2073. doi:10.1111/j.1365-2966.2008.14298.x, arXiv:0807.4259.
- Cheung et al. (2016) Cheung, C.C., Jean, P., Shore, S.N., Stawarz, Ł., Corbet, R.H.D., Knödlseder, J., Starrfield, S., Wood, D.L., Desiante, R., Longo, F., Pivato, G., Wood, K.S., 2016. Fermi-LAT Gamma-Ray Detections of Classical Novae V1369 Centauri 2013 and V5668 Sagittarii 2015. Astrophys. J. 826, 142. doi:10.3847/0004-637X/826/2/142, arXiv:1605.04216.
- Cheung et al. (2022) Cheung, C.C., Johnson, T.J., Jean, P., Kerr, M., Page, K.L., Osborne, J.P., Beardmore, A.P., Sokolovsky, K.V., Teyssier, F., Ciprini, S., Martí-Devesa, G., Mereu, I., Razzaque, S., Wood, K.S., Shore, S.N., Korotkiy, S., Levina, A., Blumenzweig, A., 2022. Fermi LAT Gamma-ray Detection of the Recurrent Nova RS Ophiuchi during its 2021 Outburst. Astrophys. J. 935, 44. doi:10.3847/1538-4357/ac7eb7, arXiv:2207.02921.
- Chomiuk et al. (2014) Chomiuk, L., Linford, J.D., Yang, J., O’Brien, T.J., Paragi, Z., Mioduszewski, A.J., Beswick, R.J., Cheung, C.C., Mukai, K., Nelson, T., Ribeiro, V.A.R.M., Rupen, M.P., Sokoloski, J.L., Weston, J., Zheng, Y., Bode, M.F., Eyres, S., Roy, N., Taylor, G.B., 2014. Binary orbits as the driver of -ray emission and mass ejection in classical novae. Nature 514, 339–342. doi:10.1038/nature13773, arXiv:1410.3473.
- Chomiuk et al. (2021) Chomiuk, L., Metzger, B.D., Shen, K.J., 2021. New Insights into Classical Novae. Ann. Rev. Astron. Astrophys. 59, 391–444. doi:10.1146/annurev-astro-112420-114502, arXiv:2011.08751.
- De Sarkar et al. (2023) De Sarkar, A., Nayana, A.J., Roy, N., Razzaque, S., Anupama, G.C., 2023. Lepto-hadronic Interpretation of 2021 RS Ophiuchi Nova Outburst. Astrophys. J. 951, 62. doi:10.3847/1538-4357/acd6ed, arXiv:2305.10735.
- Diesing et al. (2023) Diesing, R., Metzger, B.D., Aydi, E., Chomiuk, L., Vurm, I., Gupta, S., Caprioli, D., 2023. Evidence for Multiple Shocks from the -Ray Emission of RS Ophiuchi. Astrophys. J. 947, 70. doi:10.3847/1538-4357/acc105, arXiv:2211.02059.
- Fermi LAT Collaboration (2010) Fermi LAT Collaboration, 2010. Gamma-Ray Emission Concurrent with the Nova in the Symbiotic Binary V407 Cygni. Science 329, 817–821. doi:10.1126/science.1192537, arXiv:1008.3912.
- H. E. S. S. Collaboration (2022) H. E. S. S. Collaboration, 2022. Time-resolved hadronic particle acceleration in the recurrent nova RS Ophiuchi. Science 376, 77–80. doi:10.1126/science.abn0567, arXiv:2202.08201.
- Helder et al. (2012) Helder, E.A., Vink, J., Bykov, A.M., Ohira, Y., Raymond, J.C., Terrier, R., 2012. Observational Signatures of Particle Acceleration in Supernova Remnants. Space Science Reviews 173, 369–431. doi:10.1007/s11214-012-9919-8, arXiv:1206.1593.
- LHAASO Collaboration (2021a) LHAASO Collaboration, 2021a. Observation of the Crab Nebula with LHAASO-KM2A - a performance study. Chinese Physics C 45, 025002. doi:10.1088/1674-1137/abd01b, arXiv:2010.06205.
- LHAASO Collaboration (2021b) LHAASO Collaboration, 2021b. Peta-electron volt gamma-ray emission from the Crab Nebula. Science 373, 425–430. doi:10.1126/science.abg5137, arXiv:2111.06545.
- LHAASO Collaboration (2022) LHAASO Collaboration, 2022. The Large High Altitude Air Shower Observatory (LHAASO) Science Book (2021 Edition). Chinese Physics C 46, 035001. URL: cpc.ihep.ac.cn/article/2022/3, arXiv:1905.02773.
- Li et al. (2017) Li, K.L., Metzger, B.D., Chomiuk, L., Vurm, I., Strader, J., Finzell, T., Beloborodov, A.M., Nelson, T., Shappee, B.J., Kochanek, C.S., Prieto, J.L., Kafka, S., Holoien, T.W.S., Thompson, T.A., Luckas, P.J., Itoh, H., 2017. A nova outburst powered by shocks. Nature Astronomy 1, 697–702. doi:10.1038/s41550-017-0222-1, arXiv:1709.00763.
- Luna et al. (2020) Luna, G.J.M., Sokoloski, J.L., Mukai, K., M. Kuin, N.P., 2020. Increasing Activity in T CrB Suggests Nova Eruption Is Impending. Astrophys. J. Lett. 902, L14. doi:10.3847/2041-8213/abbb2c, arXiv:2009.11902.
- MAGIC Collaboration (2016) MAGIC Collaboration, 2016. The major upgrade of the MAGIC telescopes, Part II: A performance study using observations of the Crab Nebula. Astroparticle Physics 72, 76–94. doi:10.1016/j.astropartphys.2015.02.005, arXiv:1409.5594.
- MAGIC Collaboration (2022) MAGIC Collaboration, 2022. Proton acceleration in thermonuclear nova explosions revealed by gamma rays. Nature Astronomy 6, 689–697. doi:10.1038/s41550-022-01640-z, arXiv:2202.07681.
- Martin and Dubus (2013) Martin, P., Dubus, G., 2013. Particle acceleration and non-thermal emission during the V407 Cygni nova outburst. Astron. & Astrophys. 551, A37. doi:10.1051/0004-6361/201220289, arXiv:1209.0625.
- Martin et al. (2018) Martin, P., Dubus, G., Jean, P., Tatischeff, V., Dosne, C., 2018. Gamma-ray emission from internal shocks in novae. Astron. & Astrophys. 612, A38. doi:10.1051/0004-6361/201731692, arXiv:1710.05515.
- Metzger et al. (2014) Metzger, B.D., Hascoët, R., Vurm, I., Beloborodov, A.M., Chomiuk, L., Sokoloski, J.L., Nelson, T., 2014. Shocks in nova outflows - I. Thermal emission. Mon. Not. R. Astron. Soc. 442, 713–731. doi:10.1093/mnras/stu844, arXiv:1403.1579.
- Munari et al. (2016) Munari, U., Dallaporta, S., Cherini, G., 2016. The 2015 super-active state of recurrent nova T CrB and the long term evolution after the 1946 outburst. New Astronomy 47, 7–15. doi:10.1016/j.newast.2016.01.002, arXiv:1602.07470.
- Munari and Valisa (2021) Munari, U., Valisa, P., 2021. The 2021 outburst of RS Oph. A pictorial atlas of the spectroscopic evolution: the first 18 days. arXiv e-prints , arXiv:2109.01101doi:10.48550/arXiv.2109.01101, arXiv:2109.01101.
- Munari and Valisa (2022) Munari, U., Valisa, P., 2022. The 2021 outburst of RS Oph: a pictorial atlas of the spectroscopic evolution. II. From day 19 to 102 (solar conjunction). arXiv e-prints , arXiv:2203.01378doi:10.48550/arXiv.2203.01378, arXiv:2203.01378.
- Nelson et al. (2019) Nelson, T., Mukai, K., Li, K.L., Vurm, I., Metzger, B.D., Chomiuk, L., Sokoloski, J.L., Linford, J.D., Bohlsen, T., Luckas, P., 2019. NuSTAR Detection of X-Rays Concurrent with Gamma-Rays in the Nova V5855 Sgr. Astrophys. J. 872, 86. doi:10.3847/1538-4357/aafb6d, arXiv:1901.00030.
- Ostriker and McKee (1988) Ostriker, J.P., McKee, C.F., 1988. Astrophysical blastwaves. Reviews of Modern Physics 60, 1–68. doi:10.1103/RevModPhys.60.1.
- Padmanabhan (2001) Padmanabhan, T., 2001. Theoretical Astrophysics - Volume 2, Stars and Stellar Systems. volume 2. doi:10.2277/0521562414.
- Page et al. (2022) Page, K.L., Beardmore, A.P., Osborne, J.P., Munari, U., Ness, J.U., Evans, P.A., Bode, M.F., Darnley, M.J., Drake, J.J., Kuin, N.P.M., O’Brien, T.J., Orio, M., Shore, S.N., Starrfield, S., Woodward, C.E., 2022. The 2021 outburst of the recurrent nova RS Ophiuchi observed in X-rays by the Neil Gehrels Swift Observatory: a comparative study. Mon. Not. R. Astron. Soc. 514, 1557–1574. doi:10.1093/mnras/stac1295, arXiv:2205.03232.
- Rupen et al. (2008) Rupen, M.P., Mioduszewski, A.J., Sokoloski, J.L., 2008. An Expanding Shell and Synchrotron Jet in RS Ophiuchi. Astrophys. J. 688, 559–567. doi:10.1086/525555, arXiv:0711.1142.
- Schaefer (2010) Schaefer, B.E., 2010. Comprehensive Photometric Histories of All Known Galactic Recurrent Novae. Astrophys. J. Suppl. Ser. 187, 275–373. doi:10.1088/0067-0049/187/2/275, arXiv:0912.4426.
- Schaefer (2019) Schaefer, B.E., 2019. Predictions for Upcoming Recurrent Novae Eruptions; T CrB in 2023.61.0, U Sco in 2020.00.7, RS Oph in 20216, and more, in: American Astronomical Society Meeting Abstracts #234, p. 122.07.
- Schaefer (2023) Schaefer, B.E., 2023. The B & V light curves for recurrent nova T CrB from 1842-2022, the unique pre- and post-eruption high-states, the complex period changes, and the upcoming eruption in 2025.5 1.3. Mon. Not. R. Astron. Soc. 524, 3146–3165. doi:10.1093/mnras/stad735, arXiv:2303.04933.
- Schaefer et al. (2023) Schaefer, B.E., Kloppenborg, B., Waagen, E.O., Observers, T.A., 2023. Recurrent nova T CrB has just started its Pre-eruption Dip in March/April 2023, so the eruption should occur around 2024.4 +- 0.3. The Astronomer’s Telegram 16107, 1.
- Schaefer et al. (2022) Schaefer, B.E., Walter, F.M., Hounsell, R., Hillman, Y., 2022. The nova KT Eri Is a recurrent nova with a recurrence time-scale of 40-50 yr. Mon. Not. R. Astron. Soc. 517, 3864–3880. doi:10.1093/mnras/stac2923, arXiv:2210.10448.
- Schure et al. (2009) Schure, K.M., Kosenko, D., Kaastra, J.S., Keppens, R., Vink, J., 2009. A new radiative cooling curve based on an up-to-date plasma emission code. Astron. & Astrophys. 508, 751–757. doi:10.1051/0004-6361/200912495, arXiv:0909.5204.
- Shara et al. (2018) Shara, M.M., Prialnik, D., Hillman, Y., Kovetz, A., 2018. The Masses and Accretion Rates of White Dwarfs in Classical and Recurrent Novae. Astrophys. J. 860, 110. doi:10.3847/1538-4357/aabfbd, arXiv:1804.06880.
- Townsley and Bildsten (2004) Townsley, D.M., Bildsten, L., 2004. Theoretical Modeling of the Thermal State of Accreting White Dwarfs Undergoing Classical Nova Cycles. Astrophys. J. 600, 390–403. doi:10.1086/379647, arXiv:astro-ph/0306080.
- VERITAS Collaboration (2009) VERITAS Collaboration, 2009. VERITAS Specifications. URL: https://veritas.sao.arizona.edu/about-veritas/veritas-specifications.
- Vink (2020) Vink, J., 2020. Physics and Evolution of Supernova Remnants. doi:10.1007/978-3-030-55231-2.
- Zheng et al. (2022) Zheng, J.H., Huang, Y.Y., Zhang, Z.L., Zhang, H.M., Liu, R.Y., Wang, X.Y., 2022. Interpretation of the light curve of gamma-ray emission from the 2021 outburst of the recurrent nova RS Ophiuchi. Phys. Rev. D 106, 103011. doi:10.1103/PhysRevD.106.103011, arXiv:2203.16404.