Hydrodynamical simulations of merging galaxy clusters:
giant dark matter particle colliders, powered by gravity
Abstract
Terrestrial particle accelerators collide charged particles, then watch the trajectory of outgoing debris – but they cannot manipulate dark matter. Fortunately, dark matter is the main component of galaxy clusters, which are continuously pulled together by gravity. We show that galaxy cluster mergers can be exploited as enormous, natural dark matter colliders. We analyse hydrodynamical simulations of a universe containing self-interacting dark matter (SIDM) in which all particles interact via gravity, and dark matter particles can also scatter off each other via a massive mediator. During cluster collisions, SIDM spreads out and lags behind cluster member galaxies. Individual systems can have quirky dynamics that makes them difficult to interpret. Statistically, however, we find that the mean or median of dark matter’s spatial offset in many collisions can be robustly modelled, and is independent of our viewing angle and halo mass even in collisions between unequal-mass systems. If the SIDM cross-section were cm2 g-1 0.18 barn GeV-1, the ‘bulleticity’ lag would be 5 per cent that of gas due to ram pressure, and could be detected at 95 per cent confidence in weak lensing observations of 100 well-chosen clusters.
keywords:
galaxies: clusters: general — dark matter — cosmology: theory1 Introduction
Galaxy clusters grow by merging with each other. During a merger, their three major constituents behave differently. Galaxies are point-like on this scale and act as collisionless test particles affected only by gravity. Diffuse gas experiences ram pressure, so is decelerated and disassociated from the galaxies. Dark matter (DM) follows a trajectory determined by whichever fundamental forces act on it. If DM interacts only via gravity, it should remain with the cluster galaxies. However, if it has a non-zero cross-section for collision with other DM particles, this self-interacting DM (SIDM) can also lag behind the galaxies (Clowe et al., 2006; Robertson et al., 2017a). Observationally, galaxies are visible in (a smoothed map of their) optical emission, while the diffuse gas is visible in X-ray emission or via the Sunyaev-Zel’dovich (1970) effect. The DM can be mapped via gravitational lensing.
The Bullet Cluster (1E0657-558) is the best known example of colliding clusters. The ‘Bullet’ refers to the smaller cluster, which has passed through and is now moving away from the main cluster. Early weak lensing measurements of the offset between its galaxies and DM implied a self-interaction cross-section per unit mass , when calibrated against an analytic model of SIDM dynamics (Markevitch et al., 2004). This was improved by Randall et al. (2008) who ran SIDM-only simulations of Bullet Cluster-like systems. Combined with higher precision strong lensing measurements, Bradač et al. (2008) found . Including ordinary matter in simulations of SIDM reduces its effect, by steepening the gravitational potential well at the cluster core (e.g. Mastromarino et al., 2023), and fully hydrodynamic simulations of the Bullet Cluster relaxed the constraint to (Robertson et al., 2017a).
Particle colliders do not stop collecting data after one event. Astrophysical constraints should improve with statistical measurements from a large sample of merging clusters (Massey et al., 2011). Furthermore, because the average velocity of DM particles increases with halo mass, measurements of collisions between galaxy clusters, galaxy groups, or individual galaxies could also characterise any velocity-dependence of the interaction: this would constrain the mass of the force mediator particle (Adhikari et al., 2022). In a first attempt at this measurement, Harvey et al. (2015) adopted a strategy of analysing as many cluster mergers as possible, all with equal weight. When calibrated against an analytical model, the 30 mergers in the Hubble Space Telescope (HST) archive at the time yielded a constraint on the cross-section of at km s-1. In the future, this strategy can be easily extended to all-sky, monochromatic lensing surveys like Euclid. With additional telescope time, Wittman et al. (2018) showed that multi-colour imaging can be used to reduce noise by better identifying components of clusters that entered a merger together. Some systems give anomalously high measurements; some anomalously low. Simultaneously re-weighting to account for the fact that some have more statistical power than others, the constraint changed to .
To calibrate future observations, this paper uses hydrodynamical simulations of galaxy clusters with both SIDM and ordinary matter, in a cosmologically expanding volume. We study merging clusters in simulated universes with different DM interaction strengths (always with a massive mediator particle; Fischer et al., 2022), and test whether an observable offset between DM and stars could indeed be used to measure the interaction cross-section between DM particles.
| Simulation | Number of clusters with number of subhaloes | Mean mass | Mean separation between stars and gas | |||||||
|---|---|---|---|---|---|---|---|---|---|---|
| [] | [] | [kpc] | [kpc] | |||||||
| CDM | 107 | 82 | 20 | 4 | 1 | 138 | ||||
| SIDM0.1 | 103 | 79 | 19 | 2 | 3 | 135 | ||||
| SIDM0.3 | 102 | 76 | 23 | 2 | 1 | 132 | ||||
| SIDM1 | 105 | 83 | 17 | 3 | 2 | 134 | ||||
The value of the SIDM cross-section is unconstrained across many orders of magnitude (Kusenko & Steinhardt, 2001; Duffy & van Bibber, 2009; Loeb & Weiner, 2011; Kamada et al., 2020). A ‘natural’ scale for models invoking a dark-sector analogue of the strong force (e.g. Mohapatra et al., 2002; Foot, 2014; Hochberg et al., 2015) is the same order of magnitude as nuclear interactions, barn GeV-1. A particularly meaningful and potentially achievable goal is to test whether is significantly more or less than . If it is greater than this, DM particles that scatter off of each other are gradually ejected from dense regions of the Universe, reducing the density in the centres of haloes and slowing their gravitational collapse (Peter et al., 2013; Vogelsberger et al., 2016; Tulin & Yu, 2018). From the perspective of Occam’s razor, this effect would then be sufficient to solve the seemingly unrelated ‘small-scale crisis’ in the standard model of cosmology – that simulations produce too much substructure that is too dense (Zavala et al., 2013; Vogelsberger et al., 2014; Elbert et al., 2015). The long time that it takes for scattering to fully erode a DM cusp would also provide a natural mechanism (Creasey et al., 2017) to explain the observed diversity of DM density profiles (Oman et al., 2015; Oldham & Auger, 2018). For full reviews of SIDM, see Adhikari et al. (2022) or Tulin & Yu (2018).
2 Data
2.1 The BAHAMAS simulations
We use the BAHAMAS suite of cosmological simulations (McCarthy et al., 2017). These use a modified version of the GADGET-3 code to model DM and baryonic physics including radiative cooling, star formation, chemical evolution, and stellar and AGN feedback. Each simulation volume is a periodic box, 400 Mpc on a side. This contains particles, with DM particles of mass , gas particles initially of mass , and gravitational softening length that is fixed in comoving coordinates at then constant at physical kpc thereafter. They assume the WMAP 9-year cosmology (, , , , and ; Hinshaw et al., 2013).
SIDM with velocity-independent interaction cross sections per unit mass of is implemented in resimulations from identical initial conditions (hereafter ‘CDM’, ‘SIDM0.1’, ‘SIDM0.3’ and ‘SIDM1’ runs; Robertson et al., 2019). These values span the range of empirically-allowed cross-sections. SIDM particle scattering is infrequent, elastic, isotropic, and happens during each simulation time-step , with neighbours inside radius with probability
| (1) |
where is the particles’ relative velocity. For more details about our implementation of scattering, see Robertson et al. (2017b).
2.2 Colliding cluster sample selection
In each simulation volume we identify the 300 most massive clusters in the simulation snapshot at redshift , then select those with one or more subhaloes of per cent the total mass within 4 Mpc. This yields 100 clusters and 135 subhaloes in each simulation (Table 1). To investigate the effects of DM self-interactions on both scales, we shall analyse both the main cluster haloes and subhaloes.
A similarly inclusive selection strategy could be employed by a future analysis of all-sky surveys. Without having selected simulated systems based on their dynamics, we find relatively small separations between their components of matter. Denoting the 3D distance between galaxies (‘stars’) and gas as , our sample has mean component separation kpc, with rms scatter 49 kpc (which will later be needed as variance kpc2). We also find that more subhaloes have yet to reach first pericentre within their host cluster than have passed it.
Previous studies with finite telescope time have instead preferentially observed systems with high (because these turn out to be most sensitive to DM interactions: see Section 3.3). For example, Harvey et al. (2015) selected clusters with bimodal distributions of X-ray emission and the largest separations between galaxies and gas that fitted within the field of view of the Hubble Space Telescope (HST). Their observed sample had 2D separations with mean kpc with rms 114 kpc or variance kpc2 (alternatively, at mean redshift , arcsec with rms 25 arcsec or variance arcsec2). Future studies adopting a similar selection strategy should easily be able to maintain or increase these values, because new clusters with large separations between galaxies and gas continue to be found in X-ray or SZ surveys (Kubo et al., 2009; Okabe et al., 2010; Tempel et al., 2017; Haines et al., 2018; Zenteno et al., 2020; Fu et al., 2024). Notably, this includes nearby clusters whose separations appear huge on the sky but whose gravitational lensing signal is spread over an area too large to be observed easily by HST (e.g. McCleary et al., 2020). Nearby clusters are particularly promising for our test. Unlike weak lensing measurements of DM mass (where signal-to-noise follows lensing sensitivity in peaking at redshift ), weak lensing measurements of DM position (in kpc) are optimal at so long as the telescope has a sufficiently large field of view to capture the broader (in arcminutes) shear field (Kubo et al., 2007; Massey et al., 2011).
3 Method
It is possible to quantify the offset between a cluster’s different components using their position (Massey et al., 2011) or quadrupole moments (McDonald et al., 2022). We choose the former, and first need a definition of position. In observational studies, the methods to find the positions of the gas, galaxies and DM all differ. In simulations, we can split the particles by type and access their distributions directly.
3.1 Measuring the location of components of matter
We use the shrinking-spheres method to determine the 3D location of each (star, gas, DM) component (see e.g. Power et al., 2003). A first sphere is constructed at the centre of potential returned by subfind (Springel et al., 2001; Dolag et al., 2009), with initial radius for each halo or its equivalent for each subhalo111We use an initial radius for subhaloes , where is the mass of the subhalo as determined by subfind, is the critical density, and the overdensity constant .. The centre is then moved to the centre of mass of particles of a given type within the current sphere, and the radius is shrunk by a factor . This process is repeated until the sphere would contain fewer than 100 particles of that type. The recorded position is the centre of mass of all particles of that type within the final sphere.
The shrinking-spheres method occasionally fails, by meandering to an incorrect local peak. Failures happen most frequently for gas particles, and more often in main haloes than subhaloes. The effect creates what appears to be either a mismatch between stellar and gas clumps that were not together at the start of infall, or the misidentificiation of a centroid analogous to that found by George et al. (2012) for real observations of stellar light. Such failures lead to a 3D separation between stars and gas much larger than the typical values (of order 50 kpc), and we mitigate them by excluding from all further analysis the 1 halo per simulation box for which we measure kpc. The precise value of this cut is fairly arbitrary and does not affect our results.
In observational studies, only 2D projected positions can be measured. We project the measured 3D positions along , and -axes by discarding one coordinate in turn, then record three independent configurations for each system. If we instead use a shrinking-circles measurement as specified by Robertson et al. (2017a), we find results with consistent mean and uncertainty, but which move around within the full extent of 68 per cent error bars. This suggests that the two measurements are effectively independent, with noise that is dominated by chance projection of substructures. We shall carry out analyses in both 3D and different implementations of 2D, but no such choices affect our final conclusions.
3.2 Measuring spatial offsets between components of matter
Consider a triangle (Fig. 1) with vertices at the centre of mass of stellar matter (S for ‘stars’), gas (G), and DM (D). The vector from the gas to the stars, , defines the system’s expected direction of motion, and the ‘base’ of the triangle. Whether the locations are defined in 3D or 2D, the spatial offset from the stars to the gas is merely the length of this vector,
| (2) |
which is positive-definite and has measurement uncertainty
| (3) |
due to uncertainty and in the locations of stellar and gaseous material along a coordinate direction (we assume this to be isotropic).
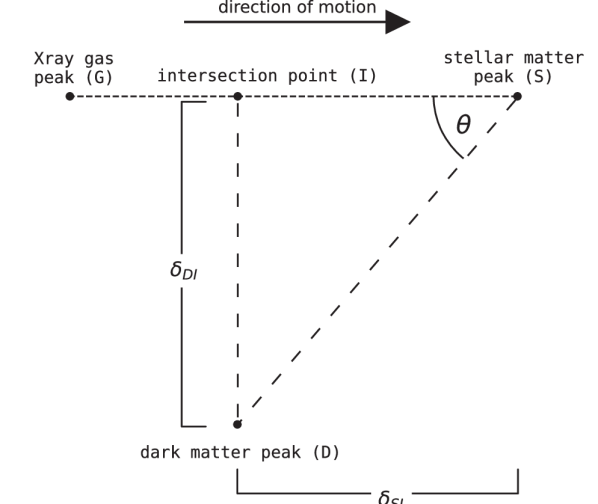
The location of DM is offset from the location of stars, with components in the direction of motion
| (4) |
and perpendicular to it
| (5) |
where (I) is the point at which a perpendicular from (D) passes through the base of the triangle. Both equation (4) and (5) can be either positive or negative. In 2D, we take the sign of to be the sign of the cross-product of and (numerator in equation (5)), resulting in a positive in Fig. 1. In 3D, we use the sign of the cross-product of and , dotted with .
Through standard error propagation, these offsets have measurement uncertainty
| (6) |
and
| (7) |
It is informative to calculate the fractional offset of DM, or ‘bulleticity’
| (8) |
This dimensionless ratio has two advantages. First, even though we can observe only the projection of a 3D offset onto the plane of the sky, this quantity is independent of the 3D orientation. Second, an approximate, analytic model of SIDM dynamics suggests that although offsets of each component gradually increase after a merger (see fig. 6 of Robertson et al., 2017a), the ratio should be constant for all merger configurations, at all times during the merger. This implies that measurements of from different systems can be averaged (Harvey et al., 2015, we shall discuss this model in more detail in Section 4). Measurement noise for individual systems (which may produce or even ) propagates to uncertainty on of
| (9) | ||||
| (10) |
where our equation (9) recovers equation (1) of Wittman et al. (2018).
As a control test, we also renormalise the perpendicular offset of DM,
| (11) |
which should be consistent with zero on average, if the Universe does not have a handedness (and in the absence of systematics). Measurement uncertainty propagates into uncertainty on of
| (12) | ||||
| (13) |
3.3 Combining measurements from many collisions
If is universal, it should be possible to measure and interpret the average value from a large number of merging haloes. Assuming that a given survey will have approximately constant measurement uncertainty and , the standard error on the mean of equation (8) is
| (14) |
Some merging systems have more discriminating power than others (Wittman et al., 2018). A measurement of is a calibration of the location of DM, some distance along a ruler of length . If measurement precision is constant, systems with a long ruler offer high dynamic range and high signal-to-noise. Measurement precision is roughly constant in terms of angle on the sky, so systems with the longest rulers are those near the viewer, those with a collision aligned in the plane of the sky, and those with timing such that the separation is maximised. When analysing observations, Wittman et al. (2018) found it helpful to average systems using an inverse-variance weight
| (15) |
which is obtained from equation (14) while ignoring terms both because they are small, and to avoid biasing the measurement of itself. The error on the weighted mean then becomes
| (16) |
In this paper, we shall use neither means nor weighted means. We shall instead quote measurements of using a median, and ‘-like’ uncertainties (separation between the and percentiles of the distribution). The median is similar to the mean within scatter, but in simulations rather than observations, our automated methods produce unstable scatter in the mean – and even more scatter in the weighted mean. A small fraction of the time this is because the shrinking spheres method failed catastrophically (see Section 3.1); it is difficult to exclude failed measurements via cuts on , because those cuts would exclude haloes with the highest signal to noise – and the weight becomes strongly dominated by the system with the largest that survives the cut. For example, a single subhalo with large in our sample increases the weighted mean by a factor of nearly 10 compared to the value if it is excluded. A weighted mean might be more suitable when clean measurements are available, i.e. when random statistical errors dominate over systematic errors. Curiously, we find that our results are stable when using weight (see Appendix A). This is not motivated mathematically, but empirically we find that it would be worth investigating in the future.
4 Results
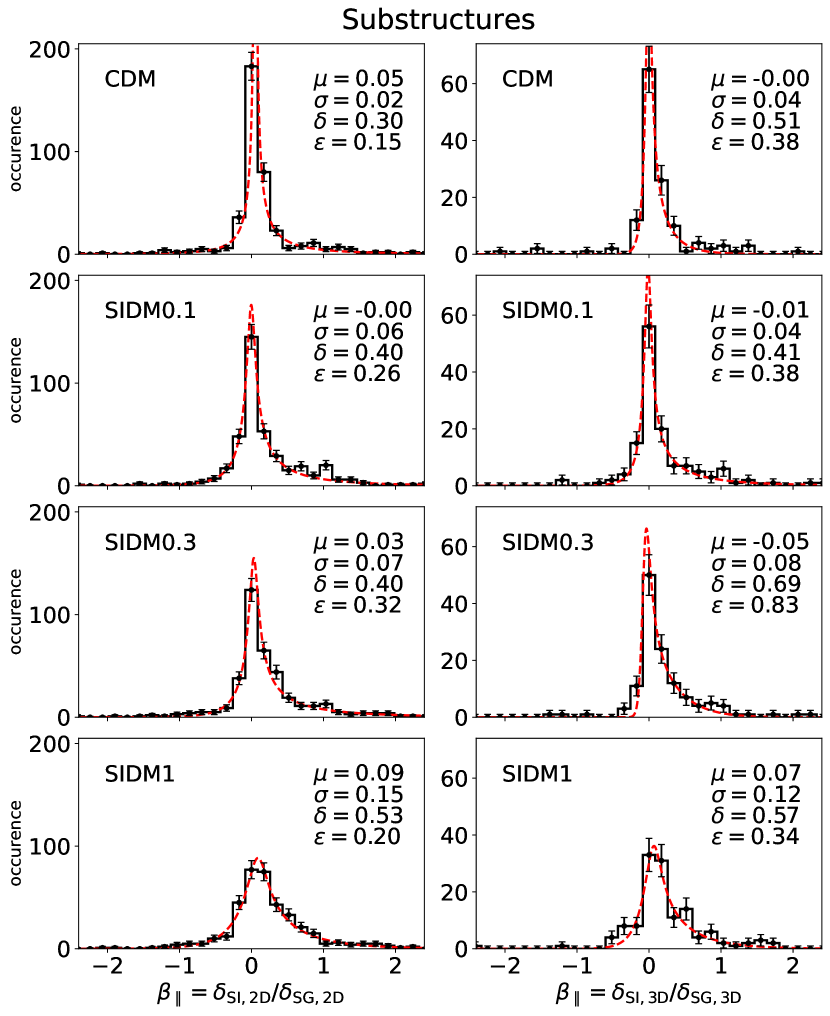
Measurements of from simulated merging clusters follow an approximately Gaussian distribution with an asymmetric tail to positive values (see Fig. 2, and Appendix B for measurements of individual components), aside from the outliers discussed above. Measurements of are similar but without the tail. Distributions of are remarkably consistent between subhaloes (leftmost two columns in Fig. 2) and main haloes (rightmost two columns), and almost indistinguishable whether measured in 2D (first and third columns) or 3D (second and fourth columns). We fit a Gaussian perturbed with skewness and kurtosis (the sinh-arcsinh normal distribution, Jones & Pewsey, 2009)
| (17) |
to all of these profiles, where and . When and , this reduces to the normal distribution with mean and standard deviation . We average this analytic function in the same bins as the data (30 bins of equal width between -2.5 and 2.5), then use the Markov Chain Monte Carlo (MCMC) sampler emcee (Foreman-Mackey et al., 2013) to obtain the maximum-likelihood values and posterior PDFs of the free parameters.
4.1 Scatter of DM offsets
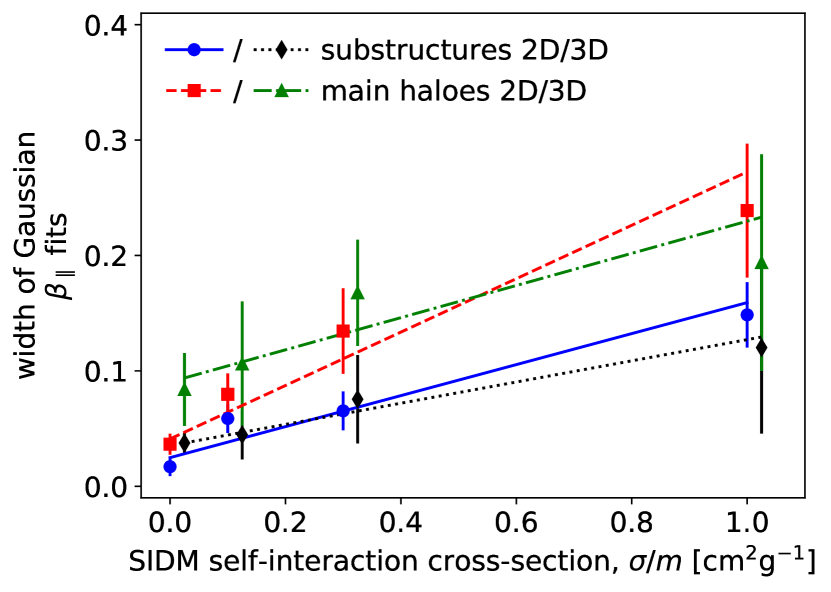
We first recover the result noticed by Kim et al. (2017) and Harvey et al. (2017, 2019) that scatter in measurements of increases with SIDM cross-section (see Fig. 3; the same is true for ). This is likely due to the collision giving an impulse to the BCG that sets it oscillating. Since it oscillates within a gravitational potential that is dominated by DM, and SIDM clusters have a ‘core’ of constant density, the BCG is less tightly bound and its oscillations have a larger amplitude. The observed scatter in offsets samples random phases of oscillation at the moment when it is measured.
We discover that the scatter of and in subhaloes also increases with SIDM cross-section , although less than that in main haloes. This may be simply because subhaloes are tidally disrupted before their offsets increase to the same extent as main haloes. Scatter in offsets could be used to measure the SIDM cross-section in the real Universe (Harvey et al., 2019). However, there is no null test for CDM, and no control test for systematics – so its interpretation will rely entirely on calibration via simulations. We shall not consider it further in this paper.
4.2 Typical DM offset
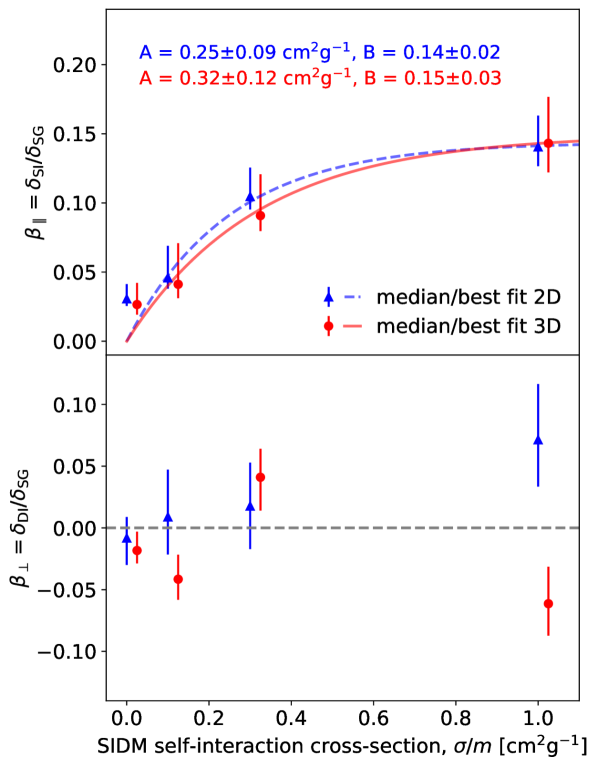
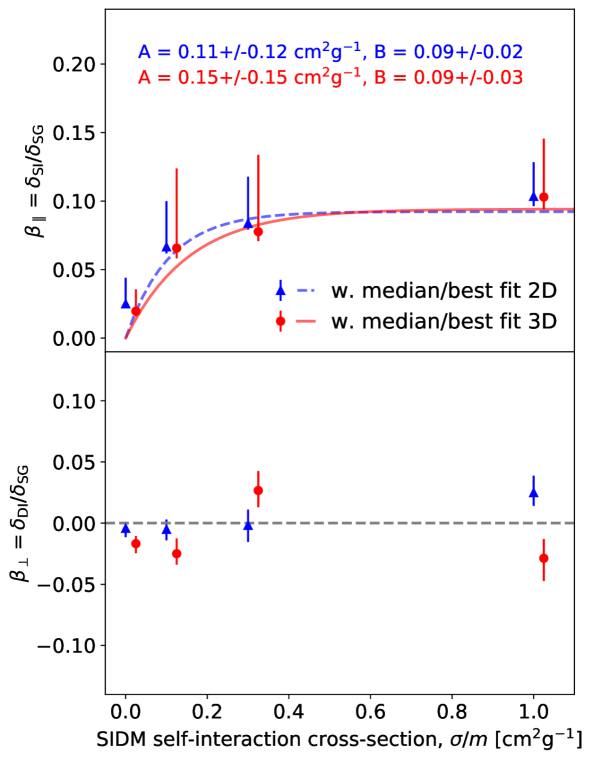
The median value of increases with SIDM cross-section . Measurements are generally consistent for both main haloes and subhaloes, so we show the median of the combined sample (Fig. 4). Measurements of the perpendicular control test, , are consistent with zero as expected. Importantly, results are virtually indistinguishable whether quantities are calculated in 3D after projection into 2D. In this sense, the measurement should therefore be as accessible to observations as it is to simulations.
Our measurements are remarkably well fit by the model
| (18) |
predicted by Harvey et al. (2014, see their equation 33 and fig. 2). This model interpolates between two well-understood extremes. At low , the halo is optically thin, and the effective drag force grows linearly with the interaction cross-section. The constant of proportionality reflects the relative interaction strengths of DM and gas (or the characteristic cross-section at which a halo becomes optically thick). At high , DM particles at the front of the halo always scatter incoming DM and shield particles behind, so the halo becomes optically thick. The drag then becomes a constant, with parameter that depends on the geometry of the halo. The model predicts that is notably independent of infall velocity, impact parameter, and time. We fit free parameters and to our data using the Python function scipy.optimize.minimize and an asymmetric loss function to account for asymmetric errors bars (Table 2, with best-fitting models overlaid in Fig. 4).
Our only measurement not well fit by model (18) is that, for subhaloes in CDM () simulations, we measure median at 95 per cent confidence level. That we would not expect CDM to be offset from galaxies is particularly important as a null test. With our present sample size, we tentatively ascribe this as a statistical fluke or a limitation of simulation resolution (for kpc, a value represents a measurement of to 12 per cent of the BAHAMAS softening length). We believe this because our measurements of higher mass CDM main haloes (not shown by themselves) are consistent with zero offset, and Schaller et al. (2015)’s measurements of lower mass individual galaxies also show zero offset in CDM simulations with better resolution. Furthermore, the mean (rather than median) value of happens to be slightly positive for main haloes and slightly negative for subhaloes. Nonetheless, this should be re-measured in future work. Robertson et al. (2017a) measured no offset in idealised simulations, so it is feasible that this is a new effect particular to fully cosmological simulations, caused by the varied impact parameters, ongoing star formation, or chance projection of substructures (which dominate measurement noise; see Section 3.1).
Finally, it is interesting to note that Robertson et al. (2017a) report a small bias when measuring the position of one halo in the outskirts of another, because the second halo contributes a gradient of particles across the shrinking circle. We confirm this, by comparing positions measured (by default) using all particles, with positions measured using only bound particles. We find that positions move by a comparable amount in the same direction, such that the effect on is negligible. Using angle brackets to denote medians, we measure in CDM simulations a decrease from to , and an increase from to .
| 2D | 3D | |||
| [] | [] | |||
| All haloes | 0.250.09 | 0.140.02 | 0.320.12 | 0.150.03 |
| Main haloes | 0.280.13 | 0.140.03 | 0.270.09 | 0.140.02 |
| Substructures | 0.360.16 | 0.150.03 | 0.420.19 | 0.160.04 |
| Approaching | 0.110.14 | 0.120.13 | 0.130.04 | 0.240.13 |
| Receding | 0.190.11 | 0.360.38 | 0.140.05 | 0.100.09 |
4.3 Selection effects
Our interpretation of the average measurement from many colliding systems presupposes that is universal (see the start of Section 3.3). The components of our simulated mergers are typically closer than those in observations (see Section 2.2). Furthermore, the offsets of individual components of matter vary with time since collision (Robertson et al., 2017a). If also varies with time, it matters whether clusters are observed before or after pericentric passage.
Unfortunately, the BAHAMAS simulations do not include enough cluster mergers to reach discriminating statistics if we split our sample, nor enough snapshots to measure them at different times since collision. Indeed, it is not always clear from the single snapshot available whether clusters have already reached pericentre. For systems with only two haloes, splitting by whether the net velocity of their particles is approaching or receding yields unstable measurements of parameter and much larger uncertainties in parameter (Table 2). For two-halo systems in SIDM1 simulations analysed in 2D (using angle brackets to denote medians, and propagating 16/84 percentile uncertainties like standard deviations), we find (or split further into main haloes, and for subhaloes). Future investigation of this would be interesting with larger simulations. If it makes a significant difference to predictions of , the selection of simulated clusters should be matched to selection biases in observational samples. Alternatively, observational samples could be selected carefully, inferring the direction of motion using a combination of optical and X-ray data, or shock fronts in e.g. radio emission.
4.4 Future prospects
Measurements of are a promising way to test the interaction cross-section of DM. Symmetries are expected to provide a null result in the case of CDM () and a perpendicular test for systematics, . Future surveys may be able to combine measurements of and from a large number of observed merging galaxy clusters.
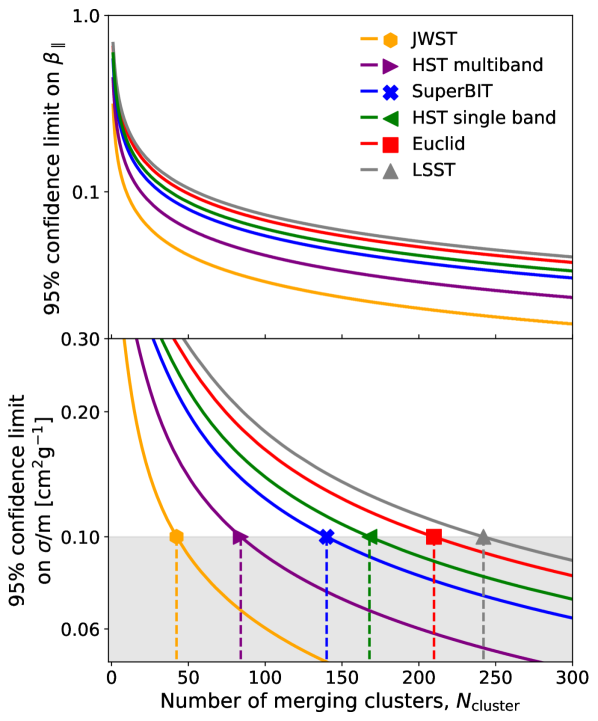
To forecast a future survey’s ability to rule out the null hypothesis , we first consider the expected uncertainty on (equation 16), setting , and bootstrapping the other parameters from observational experience with single-band HST data (Harvey et al., 2015). A large sample of merging clusters should at least maintain Harvey et al. (2015)’s sample mean222The relevant quantity for unweighted averages (equation 14) is arcsec-2, although we do not use it here. of arcsec-2 (as discussed in Section 2.2, but converting the number into angular units), with . The observationally achieved uncertainty on the location of stellar material, arcsec, is both subdominant and unlikely to change significantly because it depends on astrophysical effects such as confusion between multiple BCGs (George et al., 2012). Analysis of mock images suggests the achieved uncertainty on the location of DM, arcsec, is reduced by approximately 30 per cent by perfect separation between galaxies in front of or behind the cluster using multicolour photometry, and falls proportionally to , the density of resolved background galaxies (Harvey et al., 2013). Table 3 collates expectations of for the James Webb Space Telescope (JWST, Gardner et al., 2006; Casey et al., 2023), Super-Pressure Balloon-borne Imaging Telescope (SuperBIT, Romualdez et al., 2016; Shaaban et al., 2022), Euclid (Laureijs et al., 2011; Euclid Collaboration et al., 2022) and the Vera C. Rubin Observatory (LSST, Chang et al., 2013; Ivezić et al., 2019).
For each future survey we calculate the single-tailed 95 per cent confidence limit on
| (19) |
using the values in Table 3 and assuming a Gaussian error distribution (which Fig. 3B of Harvey et al., 2015, suggests to be reasonable).We estimate the standard error on the median by multiplying the standard error of the mean by a factor of (for details see chapter 4 of Maindonald & Braun, 2010). We finally convert this to a single-tailed 95 per cent confidence limit on using equation (18) with parameter values from Table 2 (all haloes, 2D). These two confidence limits are shown, as a function of the number of observed systems, in Fig. 5. The number of typical merging clusters that must be observed by any telescope to reach the target particle physics sensitivity of 0.1 can be read from the bottom panel of Fig. 5, and is listed in Table 3. Indeed, SuperBIT’s design characteristics were optimised to meet this goal as its primary science driver (McCleary et al., 2023).
| Telescope | Required | |||||
|---|---|---|---|---|---|---|
| [arcmin-2] | [arcsec] | [arcsec] | | |||
| JWST | 5. | 7 | 42 | |||
| HST (multi-band) | 8. | 1 | 84 | |||
| (single band) | 11. | 4 | 168 | |||
| SuperBIT | 10. | 4 | 140 | |||
| Euclid | 12. | 7 | 210 | |||
| LSST | 13. | 7 | 242 | |||
This forecast is valid for surveys measuring (or placing upper limits on) SIDM cross-section . At lower cross-sections, either simulation resolution, noise, or cosmological effects (see Section 4.2) inhibit simulated values of reaching zero. Such tight constraints would require observations of approximately three times more clusters than listed in Table 3. At higher cross-sections, the limited number of simulated clusters leads to measurement uncertainty such that sometimes , which is incompatible with equation (18). That model cannot be used to map onto , until sufficient clusters have been observed such that (in this case) 95 per cent of the posterior probability is at values of .
5 Conclusions
Terrestrial particle physics experiments have established that DM interacts very weakly, if at all, with Standard Model particles. However, terrestrial experiments are unable to test whether DM particles interact with each other – as predicted for many proposed models of self-interacting DM (SIDM, e.g. Kusenko & Steinhardt, 2001; Duffy & van Bibber, 2009; Loeb & Weiner, 2011; Kamada et al., 2020), including a large class containing a dark-sector analogue of the strong force (Mohapatra et al., 2002; Foot, 2014; Hochberg et al., 2015). In the latter models, the natural scale of the interaction cross-section is the same order as for nuclear interactions, cm2 g-1.
Using cosmological simulations, we have measured the effect of DM self-interactions on the major mergers of galaxy clusters. We find that the offset between DM and galaxies (as a fraction of that between gas and galaxies) is a promising test of SIDM. This ‘bulleticity’, , increases with cross-section in a way that matches the predictions from an analytic model (equation 18) originally proposed by Harvey et al. (2014). Because it is a fractional offset, the same measurements can be accessed using either 3D or 2D projected data. Symmetries provide a null test for non-interacting DM, and an orthogonal test for systematics or to measure scatter.
Three challenges remain with theoretical predictions. First, because of instabilities in our identification of peak positions, we find the median offset of DM haloes to be more robust than the mean. It would be interesting to repeat this analysis with methods for peak finding that are closer to those used with observational data. These may differently weight the distribution of matter close to a peak or at distance from it, which is important if the distribution is skewed. Second, we find that the median (and mean) is slightly positive for all values of interaction cross-section, even (Fig. 4). This implies that it is more likely for DM to be found between the stars and gas, rather than leading the stars. Other CDM simulations (Schaller et al., 2015; Robertson et al., 2017a), and an analytic model (equation 18) predicted to be consistent with zero when . Our measurement of an offset in the non-interacting CDM case might be a statistical anomaly, might be caused by the matching of DM to galaxy and gas peaks when starting shrinking spheres from subfind positions, or it might be a symptom of more complex dynamical processes. Third, our simulated survey volume is too small to contain sufficient systems for the sample to be usefully split by e.g. mass ratio, impact speed, or time before/after first pericentric passage. It will be important to test whether is a universal function of for a range of these parameters, as predicted. We have no evidence from BAHAMAS to indicate that it is not, but are running larger simulation volumes precisely to test this. In future simulations, it will also be interesting to measure the produced by SIDM interactions mediated by low-mass particles that produce more frequent but smaller momentum exchange scattering events, which manifests on macroscopic scales as something closer to a drag force (Fischer et al., 2022).
Finally, we made predictions for limits on the DM self-interaction cross-section that could be ascertained by future telescopes. The test is promising, with astronomical observations of merging clusters yielding constraints relevant to particle physics. If is not perfectly universal, larger simulations will also be important to interpret observations, by reproducing sample selection effects – e.g. with larger values of and more systems just after first pericentric passage. Reproducing selection effects would be even more important if averaging samples with a mean or weighted mean rather than a median, because these are so strongly dominated by a small number of systems.
Acknowledgements
We thank Adam Amara and Mathilde Jauzac for encouraging feedback on an early draft of this paper, Ian McCarthy for sharing his CDM simulation runs, and the anonymous referee for helpful suggestions that improved our analysis. ELS was supported by the Australian Government through the Australian Research Council Centre of Excellence for Dark Matter Particle Physics (CDM, CE200100008) and by the Royal Society. RJM was supported by the Royal Society. KAO acknowledges support support by STFC through grant ST/T000244/1. KAO and CSF were supported by the European Research Council (ERC) through Advanced Investigator grant DMIDAS (GA 786910). This work used the DiRAC@Durham facility managed by the Institute for Computational Cosmology on behalf of the STFC DiRAC HPC Facility (www.dirac.ac.uk). The equipment was funded by BEIS via STFC capital grants ST/K00042X/1, ST/P002293/1, ST/R002371/1 and ST/S002502/1, Durham University and STFC operations grant ST/R000832/1. DiRAC is part of the UK National e-Infrastructure.
Data Availability
References
- Adhikari et al. (2022) Adhikari S., et al., 2022, preprint, (arXiv:2207.10638)
- Bradač et al. (2008) Bradač M., Allen S. W., Treu T., Ebeling H., Massey R., Morris R. G., von der Linden A., Applegate D., 2008, ApJ, 687, 959
- Casey et al. (2023) Casey C. M., et al., 2023, ApJ, 954, 31
- Chang et al. (2013) Chang C., et al., 2013, MNRAS, 434, 2121
- Clowe et al. (2006) Clowe Bradač M., Gonzalez A. H., Markevitch M., Randall S. W., Jones C., Zaritsky D., 2006, ApJ, 648, L109
- Creasey et al. (2017) Creasey Sameie O., Sales L. V., Yu H.-B., Vogelsberger M., Zavala J., 2017, MNRAS, 468, 2283
- Dolag et al. (2009) Dolag K., Borgani S., Murante G., Springel V., 2009, MNRAS, 399, 497
- Duffy & van Bibber (2009) Duffy L., van Bibber K., 2009, NJP, 11, 105008
- Elbert et al. (2015) Elbert Bullock J. S., Garrison-Kimmel S., Rocha M., Oñorbe J., Peter A. H. G., 2015, MNRAS, 453, 29
- Euclid Collaboration et al. (2022) Euclid Collaboration et al., 2022, A&A, 662, A112
- Fischer et al. (2022) Fischer M. S., Brüggen M., Schmidt-Hoberg K., Dolag K., Kahlhoefer F., Ragagnin A., Robertson A., 2022, MNRAS, 516, 1923
- Foot (2014) Foot 2014, IJMPA, 29, 1430013
- Foreman-Mackey et al. (2013) Foreman-Mackey D., Hogg D., Lang D., Goodman J., 2013, PASP, 125, 306
- Fu et al. (2024) Fu S., et al., 2024, preprint, (arXiv:2402.10337)
- Gardner et al. (2006) Gardner J. P., et al., 2006, Space Sci. Rev., 123, 485
- George et al. (2012) George M. R., et al., 2012, ApJ, 757, 2
- Haines et al. (2018) Haines C. P., et al., 2018, MNRAS, 477, 4931
- Harvey et al. (2013) Harvey D., Massey R., Kitching T., Taylor A., Jullo E., Kneib J.-P., Tittley E., Marshall P. J., 2013, MNRAS, 433, 1517
- Harvey et al. (2014) Harvey D., et al., 2014, MNRAS, 441, 404
- Harvey et al. (2015) Harvey D., Massey R., Kitching T., Taylor A., Tittley E., 2015, Science, 347, 1462
- Harvey et al. (2017) Harvey D., Courbin F., Kneib J.-P., McCarthy I., 2017, MNRAS, 472, 1972
- Harvey et al. (2019) Harvey D., Robertson A., Massey R., McCarthy I., 2019, MNRAS, 488, 1572
- Hinshaw et al. (2013) Hinshaw G., et al., 2013, ApJS, 208, 19
- Hochberg et al. (2015) Hochberg Kuflik E., Murayama H., Volansky T., Wacker J. G., 2015, PRL, 115, 021301
- Ivezić et al. (2019) Ivezić Ž., et al., 2019, ApJ, 873, 111
- Jones & Pewsey (2009) Jones M. C., Pewsey A., 2009, Biometrika, 96, 761
- Kamada et al. (2020) Kamada A., Kim H. J., Kuwahara T., 2020, JHEP, 2020, 202
- Kim et al. (2017) Kim S. Y., Peter A. H. G., Wittman D., 2017, MNRAS, 469, 1414
- Kubo et al. (2007) Kubo J. M., Stebbins A., Annis J., Dell’Antonio I. P., Lin H., Khiabanian H., Frieman J. A., 2007, ApJ, 671, 1466
- Kubo et al. (2009) Kubo J. M., et al., 2009, ApJ, 702, L110
- Kusenko & Steinhardt (2001) Kusenko A., Steinhardt P., 2001, PRL, 87, 141301
- Laureijs et al. (2011) Laureijs R., et al., 2011, preprint, (arXiv:1110.3193)
- Loeb & Weiner (2011) Loeb A., Weiner N., 2011, PRL, 106, 171302
- Maindonald & Braun (2010) Maindonald J., Braun W. J., 2010, Data Analysis and Graphics Using R: An Example-Based Approach, 3 edn. Cambridge Series in Statistical and Probabilistic Mathematics, Cambridge University Press
- Markevitch et al. (2004) Markevitch M., Gonzalez A. H., Clowe D., Vikhlinin A., Forman W., Jones C., Murray S., Tucker W., 2004, ApJ, 606, 819
- Massey et al. (2011) Massey R., Kitching T., Nagai D., 2011, MNRAS, 413, 1709
- Mastromarino et al. (2023) Mastromarino C., Despali G., Moscardini L., Robertson A., Meneghetti M., Maturi M., 2023, MNRAS, 524, 1515
- McCarthy et al. (2017) McCarthy I. G., Schaye J., Bird S., Le Brun A., 2017, MNRAS, 465, 2936
- McCleary et al. (2020) McCleary J., dell’Antonio I., von der Linden A., 2020, ApJ, 893, 8
- McCleary et al. (2023) McCleary J. E., et al., 2023, AJ, 166, 134
- McDonald et al. (2022) McDonald W., Obreschkow D., Garratt-Smithson L., 2022, MNRAS, 516, 5289
- Mohapatra et al. (2002) Mohapatra Nussinov S., Teplitz V. L., 2002, PRD, 66, 063002
- Okabe et al. (2010) Okabe N., Takada M., Umetsu K., Futamase T., Smith G., 2010, PASJ, 62, 811
- Oldham & Auger (2018) Oldham Auger 2018, MNRAS, 476, 133
- Oman et al. (2015) Oman et al., 2015, MNRAS, 452, 3650
- Peter et al. (2013) Peter Rocha M., Bullock J. S., Kaplinghat M., 2013, MNRAS, 430, 105
- Power et al. (2003) Power C., Navarro J. F., Jenkins A., Frenk C. S., White S. D. M., Springel V., Stadel J., Quinn T., 2003, MNRAS, 338, 14
- Randall et al. (2008) Randall S. W., Markevitch M., Clowe D., Gonzalez A. H., Bradač M., 2008, ApJ, 679, 1173
- Robertson et al. (2017a) Robertson A., Massey R., Eke V., 2017a, MNRAS, 465, 569
- Robertson et al. (2017b) Robertson A., Massey R., Eke V., 2017b, MNRAS, 467, 4719
- Robertson et al. (2019) Robertson A., Harvey D., Massey R., Eke V., McCarthy I. G., Jauzac M., Li B., Schaye J., 2019, MNRAS, 488, 3646
- Romualdez et al. (2016) Romualdez L. J., et al., 2016, preprint, (arXiv:1608.02502)
- Schaller et al. (2015) Schaller et al., 2015, MNRAS, 452, 343
- Shaaban et al. (2022) Shaaban M. M., et al., 2022, AJ, 164, 245
- Springel et al. (2001) Springel V., White S. D. M., Tormen G., Kauffmann G., 2001, MNRAS, 328, 726
- Sunyaev & Zel’dovich (1970) Sunyaev R. A., Zel’dovich Y. B., 1970, Ap&SS, 7, 3
- Tempel et al. (2017) Tempel E., Tuvikene T., Kipper R., Libeskind N. I., 2017, A&A, 602, A100
- Tulin & Yu (2018) Tulin S., Yu H.-B., 2018, Phys. Rep., 730, 1
- Vogelsberger et al. (2014) Vogelsberger M., Zavala J., Simpson C., Jenkins A., 2014, MNRAS, 444, 3684
- Vogelsberger et al. (2016) Vogelsberger M., Zavala J., Cyr-Racine F.-Y., Pfrommer C., Bringmann T., Sigurdson K., 2016, MNRAS, 460, 1399
- Wittman et al. (2018) Wittman D., Golovich N., Dawson W. A., 2018, ApJ, 869, 104
- Zavala et al. (2013) Zavala J., Vogelsberger M., Walker M. G., 2013, MNRAS, 431, L20
- Zenteno et al. (2020) Zenteno A., et al., 2020, MNRAS, 495, 705
Appendix A Weighted median of ensemble
We here investigate the weighted median of . The weighted median is equal to the weighted 50th percentile, where the weighted 100 percentile () is calculated by sorting the data and finding the smallest set of data for which the weights sum to a fraction of the total weight.
Using inverse variance weights (Equation 15), we found that the median becomes highly unstable. Curiously, it is stable with weight (Fig. 6 and Table 4). This is because it calculates the median of . This scheme is unjustified mathematically, but would be worth considering in future analyses.
| 2D | 3D | |||
| [] | [] | |||
| All haloes | 0.110.12 | 0.090.02 | 0.150.15 | 0.090.03 |
| Main haloes | 0.020.05 | 0.090.01 | 0.050.02 | 0.090.01 |
| Substructures | 0.480.19 | 0.160.04 | 0.630.38 | 0.160.06 |
Appendix B Offsets of individual components
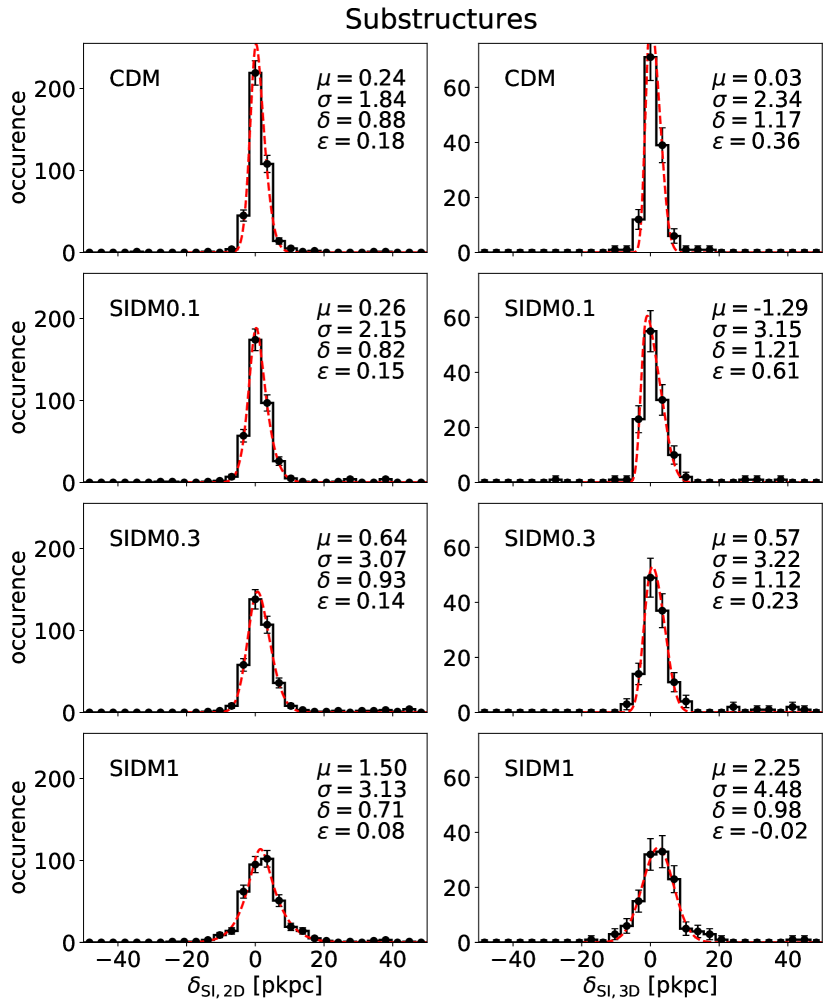
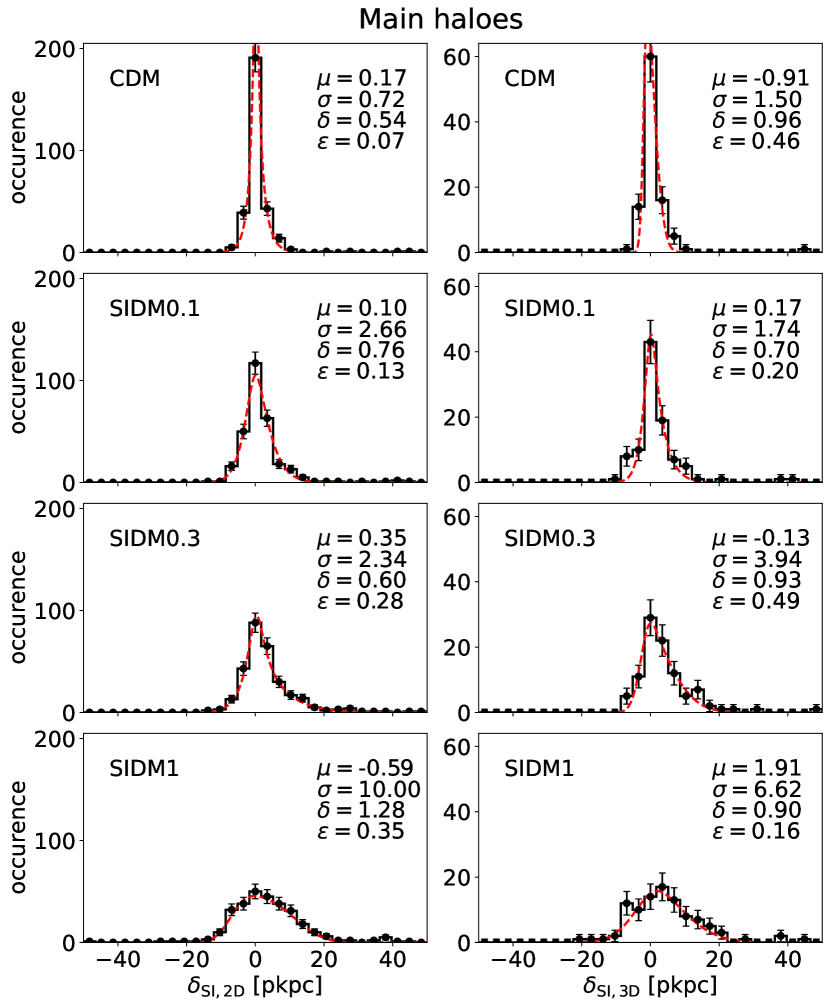
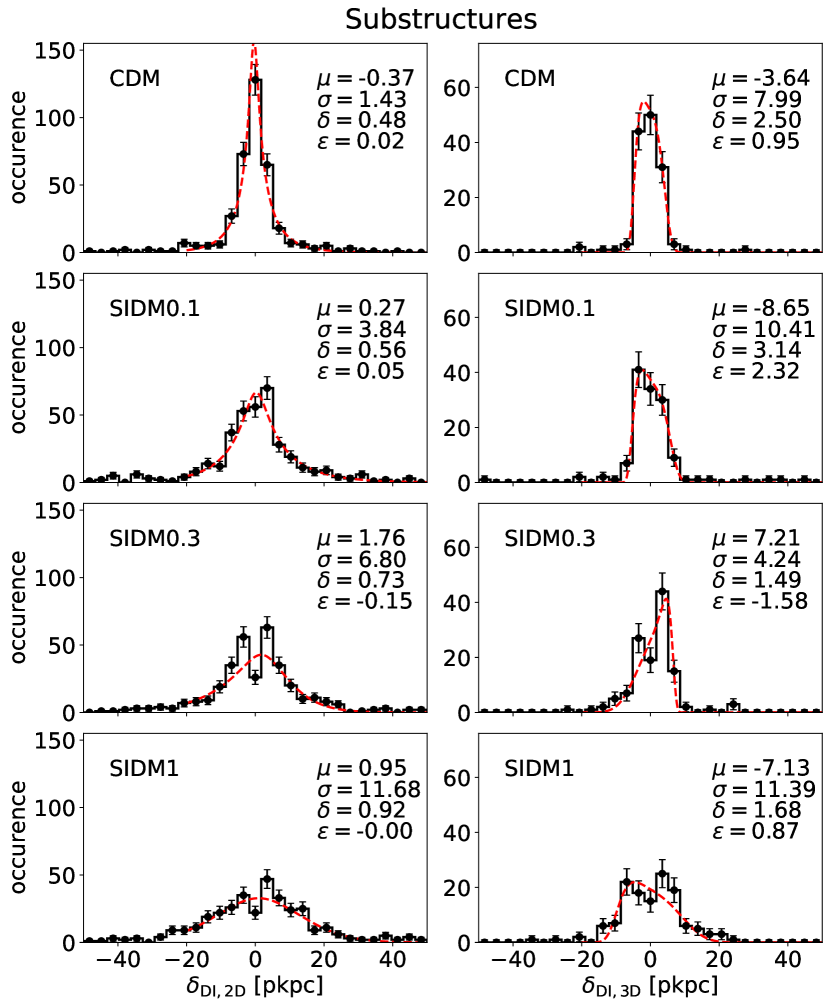
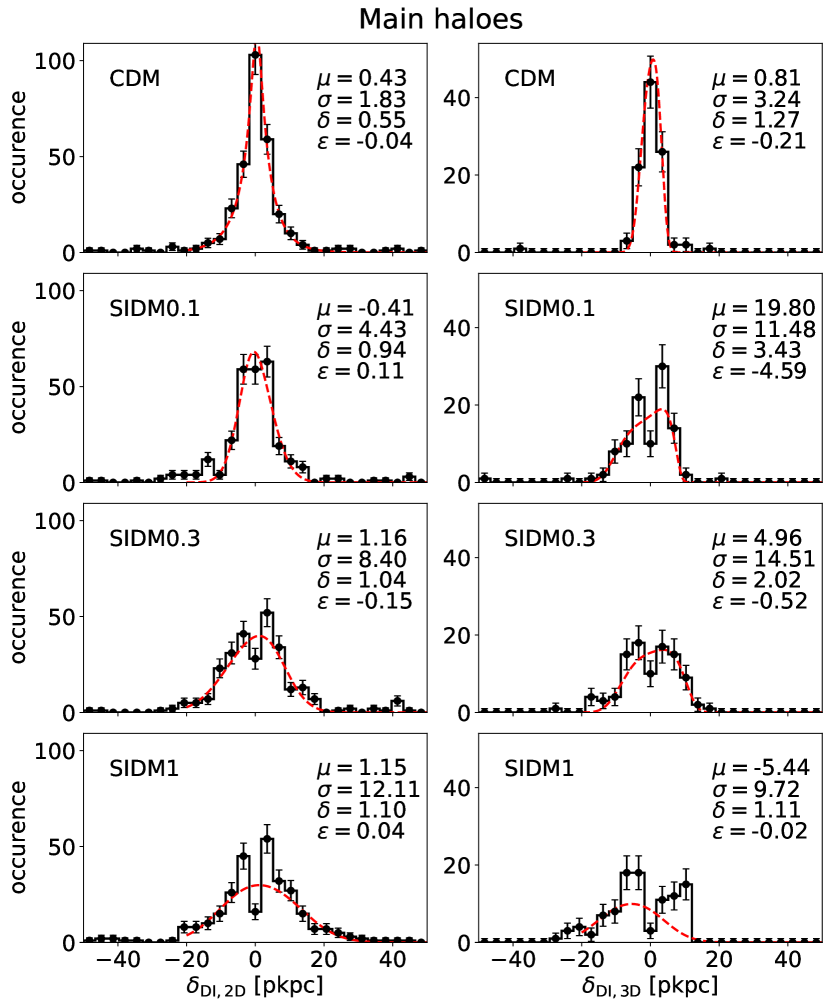
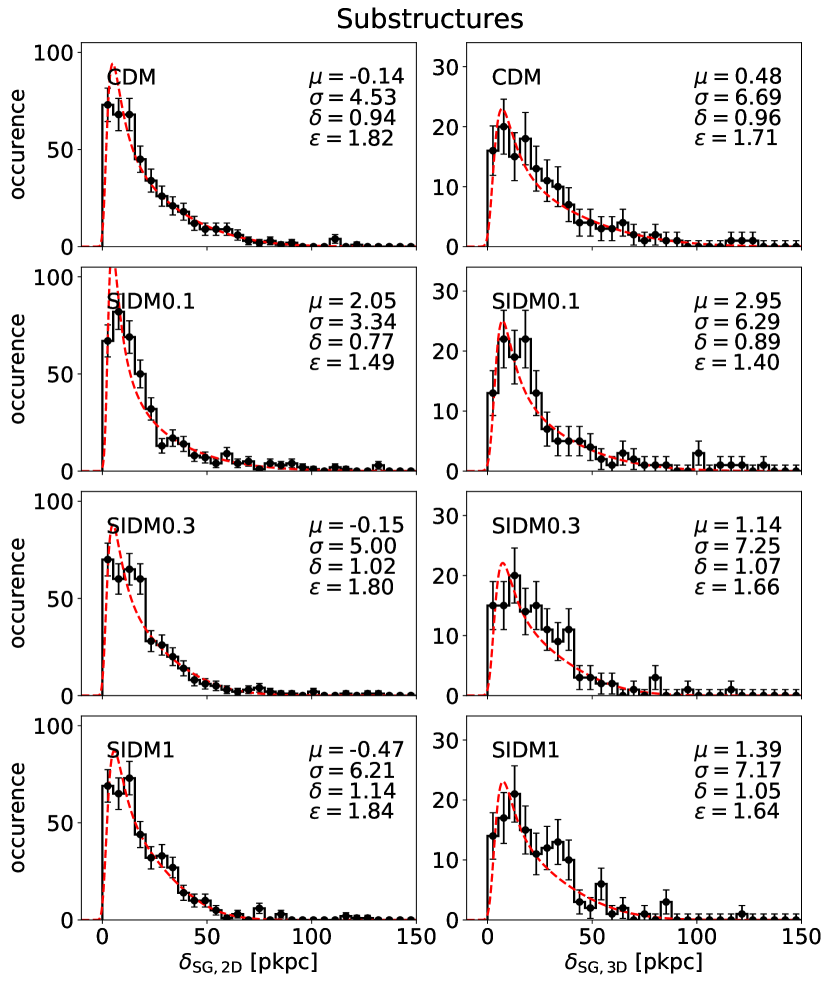
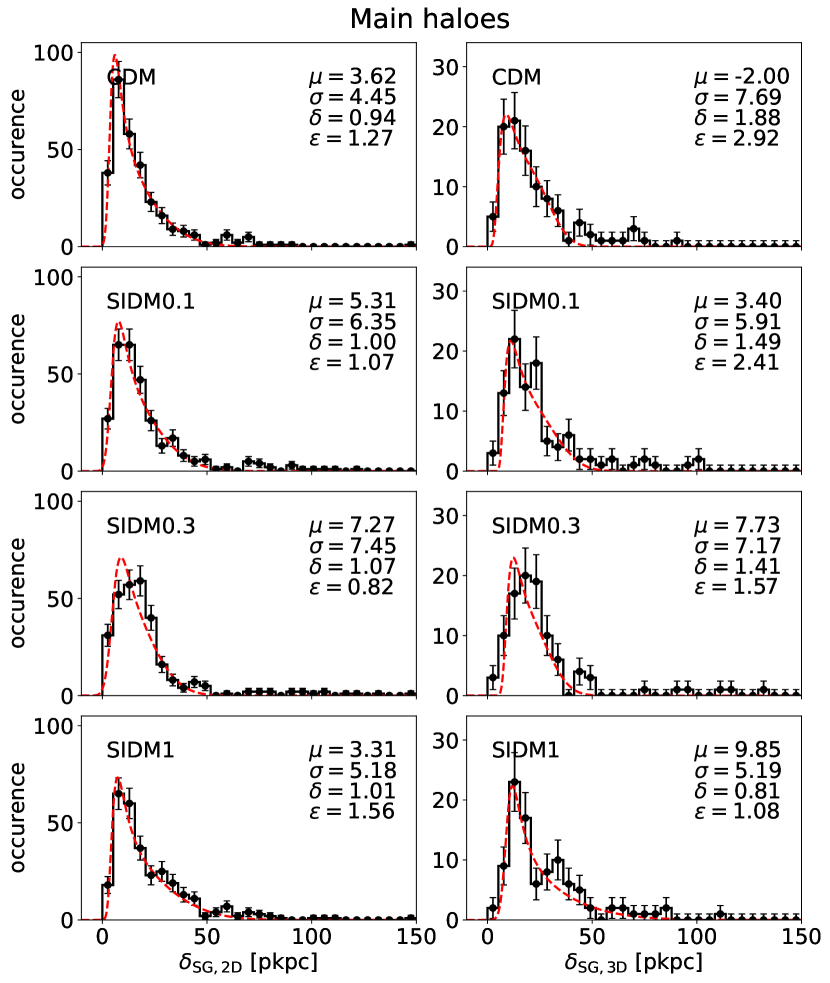
Figures 7, 8 and 9 show the distributions of distances used to calculate the distance ratios and (which are themselves shown in Figures 2 and 4). Uncertainties on the number of counts in each bin are assumed to be the square root of the counts plus one. One unexplained curiosity is that anomalously few systems have in SIDM simulations. We cannot explain this, and merely speculate that the galaxies may be oscillating within the DM halo on a radial orbit, and thus spend very little time at pericentre.