[1]This document is the results of the research project funded by Quantum Corporation and TÜBİTAK.
[type=editor, auid=000,bioid=1, orcid= 0000-0003-3779-0731 ]
[1]
[1]
url]www.mit.edu/ sarslan
Conceptualization of this study, Methodology, Software
1]organization=Massachusetts Institute of Technology, addressline=77 Mass. Ave., city=Cambridge, postcode=02139, MA, country=USA
[role=, suffix=, ] \fnmark[1]
2]organization=MEF University, addressline=Huzur Mah., Maslak, city=Istanbul, country=Türkiye
3]organization=Quantum Corporation, city=Irvine, postcode=, state=CA, country=USA
[cor1]Corresponding author.
[fn1]Both the first and the second authors eqaully contributed to the development of the software.
TALICS3: Tape Library Cloud Storage System Simulator
Abstract
High performance computing data is surging fast into the exabyte-scale world, where tape libraries are the main platform for long-term durable data storage besides high-cost DNA. Tape libraries are extremely hard to model, but accurate modeling is critical for system administrators to obtain valid performance estimates for their designs. This research introduces a discrete event tape simulation platform that realistically models tape library behavior in a networked cloud environment, by incorporating real-world phenomena and effects. The platform addresses several challenges, including precise estimation of data access latency, rates of robot exchange, data collocation, deduplication/compression ratio, and attainment of durability goals through replication or erasure coding. The suggested simulator has the capability to compare the single enterprise configuration with multiple commodity library (RAIL) configurations, making it a useful tool for system administrators and reliability engineers. They can use the simulator to obtain practical and reliable performance estimates for their long-term, durable, and cost-effective cold data storage architecture designs.
keywords:
HPC Storage \sepFault Tolerance \sepErasure Coding \sepDistributed Systems \sepTape libraries \sepCloud storage \sepSimulators1 Introduction
As the demand for data has never been so great in history, we face explosive growth in our digital content storage requirements, including exponentially growing volumes of occasionally accessed data with exceedingly long retention periods. International Data Corporation (IDC) had accurately estimated that 161 exabytes of digital information were produced in 2006 and recently projected the production of nearly 175 zettabyte new data in 2025 (Reinsel et al., 2018). It should not be surprising to anticipate that the same trends will dominate the aggregate data growth in the world, there is enough evidence that we will soon be dealing with few hundreds of zettabytes (Gantz et al., 2011), particularly in the Internet of Things (IoT) era (Arslan et al., 2020a; Jiang et al., 2014) where blockchain-based digital identities will likely dominate the data storage landscape (Preukschat and Reed, 2021).
As it becomes evident that consistent trends will continue to govern the overall expansion of global data, ample evidence suggests an imminent handling of several hundred zettabytes (Gantz et al., 2011). This is especially noteworthy in the context of the Internet of Things (IoT) era (Arslan et al., 2020a; Jiang et al., 2014), wherein the prevalence of blockchain-based digital identities is anticipated to significantly shape the data storage landscape (Zeydan et al., 2023, 2024). Consequently, addressing the associated challenges of scalability, security, and interoperability becomes imperative for efficiently managing and harnessing the vast volumes of data generated in this evolving digital world. Moreover, understanding the implications of this data surge is crucial for policymaking and infrastructure planning, as it not only transforms the technological landscape but also poses challenges in terms of privacy, data governance, and ethical considerations. Developing adaptive and resilient simulation frameworks that go beyond the conventional paradigms becomes essential to fully exploit the potential benefits of this data-driven era and ensure responsible and sustainable data practices (van Ooijen et al., 2019).
With this observation in mind, it becomes important to consider cost issues associated with long term and durable voluminous data storage whereby the tape technology is no doubt a cost-effective nearline option providing one of the lowest cost of ownerships. For instance, tape is estimated to be three times cheaper than HDDs in popular data centers (Moore et al., 2007) and it is way cheaper compared to today’s high density DNA storage technology due to the high cost of read/write processes of DNA using expensive synthesis and sequencing operations (Mardis, 2011; Appuswamy et al., 2019; Bornholt et al., 2016).
Conversely, domains characterized by intensive data demands, such as High Performance Computing (HPC), serve as primary sources for the rapid generation of substantial datasets, commonly stored using Hard Disk Drives (HDDs) at present (Welch and Noer, 2013; Zeydan and Arslan, 2020). Depending on the application111These applications include earth observations, radio astronomy, nuclear physics and medicine-related research., scientific domains may differ widely with respect to data access patterns, storage capacity and requirements. For instance, active archives require the data to be online all the time whereas in static archives, written bulk data is only rarely accessed and modified (Gupta et al., 2012). The decision-making process for selecting the appropriate media, robot technologies, library configurations, drives, communication links, and software can be heavily influenced by the specific requirements of the application at hand. Hence, there can be significant variations in the chosen components and their configurations depending on the nature and demands of the task to be performed. Recently, several cloud service providers have started offering cold-storage-as-a-service (CSaaS) with varying access and storage capacity options to address the requirements of long-term scientific data retention (Memishi et al., 2019).
Tape systems are typically sold in the form of libraries which include a master server, tape drives, robots and a set of cartridges which are made of magnetic tapes with capacity MBs each. The library contains many cartridges organized in a particular 2D/3D geometry and constitute the main medium of bulk data storage. Drives are responsible for writing and reading of tape cartridges according to a specific format. The robots are responsible for moving cartridges between drives and library shelves or the so called racks. Robots may be of different quality and exhibit different types of speed performances, usually expressed in terms of exchanges per hour (xph) (Huang et al., 2005). For example, enterprise robots are costly but they operate at better actuation speeds. Robots usually count only few in tape libraries due to their high cost of manufacturing and maintenance. Finally, the server acts as a gateway for the system and provides a cloud interface (usually with a REST command set) to outside and translates the data format to be suitable for tape storage. It also manages the internal details of object allocation, load balancing, compression, collocation and data protection (Cancio et al., 2015).
Tape is a highly sequential media i.e., its performance is usually unacceptable for random reads and writes (Pease et al., 2010). Although random reads/writes may be served, posititoning the heads (particularly for small size data objects), loading the cartridge etc. may leave the system in a livelock state intermittently. Some examples of tape systems include IBM TS3500 Series (as used in MICC data storage (Baginyan et al., 2021)), Oracle StorageTek SL8500 (as used in the storage facility of INFN (Italian Institute for Nuclear Physics) to support the Petabytes of data produced by the LHC (Large Hadron Collider) experiments at CERN (Cavalli et al., 2023)), Spectralogic TFinity (as used in the information system PANGAEA (Felden et al., 2023)) and Quantum Scalar i6000 (as used in INFN along with IBM TS4500 and Oracle SL8500 (Brunengo et al., 2020)). Each of these tape library products possesses distinct characteristics and module configurations, which can manifest varying degrees of performance based on the parameter selections and data request patterns of the user. Nevertheless, while the operational characteristics and constituent components of these systems may differ, they can be represented through a shared numerical framework.
1.1 Motivation
Today, tape comes with very compelling features such as low acquisition cost, backwards compatibility, scalability, high performance, longevity, high capacity and portability. The Linear Tape File System (LTFS) (Pease et al., 2010) open tape format and backward compatibility with earlier Linear Tape Open (LTO) versions, ensure that you will be able to read and restore data in the future without the need for proprietary applications. Tape can also provide an eventual defense mechanism against malware, hacking attacks and data corruption that may affect copies of data objects stored on disk in the cloud (Szor, 2005). As companies begin to migrate data to cloud, tape is seriously being considered for the archival backend for the future of web and decentralized applications such as Inter Planetary File System (IPFS), a content addressable peer-to-peer distributed file system (Benet, 2014) or distributed ledger-powered surveillance applications (Arslan and Goker, 2022) or under various internet of things contexts (Goodwin, 2019; Arslan et al., 2020a). Yet another relevant example is the earth observations data (a.k.a. D-SDA) which is operated by the Earth Observation Center (EOC) of the German Aerospace Center. The data is stored in a vast, geo-replicated cold storage data archive facility, which heavily relies on a tape library systems (Kiemle et al., 2016).
Notwithstanding their usefulness, tape library systems are complex and incorporate diverse electronics and actuation devices, giving rise to sophisticated error processes that may pose a challenge for modeling (Iliadis et al., 2016; Arslan et al., 2014, 2013). They need to be adequately modeled in order to estimate its overall cost to the system designers for serving the current cloud application needs. Henceforth, the primary objective of this study is to develop a pertinent and concise framework designed to quantify performance metrics of paramount importance within the domain of hierarchical storage system design. Special attention is devoted to delineating the crucial role occupied by Tape as a foundational archival backend in this context. Enumerated herewith are a selection of fundamental motivations underlying the development of this tape simulation model.
-
The intricate interplay of multiple interdependent factors within the internal architecture of real-world tape systems renders their accurate representation through Queuing Theory and Statistics exceedingly challenging (Kalashnikov, 1993). As the complexity of the model increases with the incorporation of additional components, it becomes analytically intractable, precluding the availability of closed-form expressions for crucial performance indicators (e.g. average access latency).
-
It is easier with a simulation platform to apply modifications and add extra features (ex: collocation, multiple libraries to simulate RAIL (Ford et al., 1996)) for next generation cloud-based tape systems. This would also expedite the overall decision process.
-
By constructing an accurate mathematical model, we can effectively parameterize the comprehensive system dynamics and facilitate the exploration of diverse scenarios across a spectrum of conditions. This endeavor will enable us to quantitatively assess an array of system performance metrics that would otherwise remain elusive in practical settings using standard reliability modelling (Hafner and Rao, 2006; Arslan, 2023), thus unlocking valuable insights that can inform decision-making and optimization processes (e.g. robot exchange rate as a function of time).
-
Our study aims to gain a deeper understanding of the inner workings of real-world complex library systems. This includes examining the stability of robots, the impact of queuing, the role of the number of drives, and other factors that influence the final latency performance and hence the user satisfaction.
-
By employing the proposed simulation framework, we will also be equipped with the capability to comprehensively simulate and analyze a multitude of unrealistic and impractical scenarios. This effort will yield profound operational insights and aid in formulating a comprehensive set of precautionary measures for optimal system configuration and operation. Furthermore, the simulation will facilitate the identification of genuine root causes of problems, enabling prompt and decisive action to be taken as a response.
1.2 Previous work and Methodology
In the past literature, few modeling attempts have been made such as (Zeng et al., 2006) that are either hard to configure and complex to compute, or they do not take all mechanical effects of library systems into account (Iliadis et al., 2016) and resolve the correlated library-robot-cartridge relationship. Creating a universal tape library model is challenging due to the difficulty in anticipating inaccuracies in the model. Although Markov models may be used to represent isolated and stationary failure patterns just like HDD systems (Arslan, 2019), extending them to actual usage scenarios may not be directly feasible (Arslan et al., 2020b). Another alternative is proposed in (Lüttgau, 2016) that uses graph theory. However, the proposed scheme in that study is hard to configure and too complex to obtain useful results. Furthermore, it has been observed that these reliability assessments exhibit a robust correlation with data allocation strategies, thereby presenting opportunities for optimizing data placements (Leong et al., 2012; Perez et al., 2003; Arslan, 2022). There are also 2D/3D topology models from which our model will take advantage while modeling the physical constraints of the library geometry. Although topologically correct, such models fail to address queuing requests (and capture queue delays) which is the main source of latency in tape library systems, particularly under heavy load (Lavenberg and Slutz, 1975).
Discrete-event simulation (DES) (Pokhodzei, 1981) is perhaps one of the most effective ways to model and simulate a wide variety of problems. In each discrete time instance (step) of DES, only and only one event can happen. Since such steps can arbitrarily be small, we can simulate concurrent events almost simultaneously. This is predicated on the presumption that as the temporal increments diminish further (an adjustable parameter within the simulation), the likelihood of observing multiple events within a single simulation step diminishes, thus enabling DES to approximate concurrency more effectively. This is particularly significant when modeling a cold archival storage system compared to hot storage models. In our model, our objective was to integrate all significant factors to generate the most realistic simulation output achievable, while simultaneously minimizing complexities through suitable approximations that have negligible impact on the final outcome. Our model adopts a 2D topology and incorporates the inherent “double queuing phenomenon”. However, for the sake of simplicity, we do not account for data communication occurring between the tape server system and the host, as well as any associated software architectures in between, within our proposed model.
2 Double-Queue Discrete-Event Simulation Model
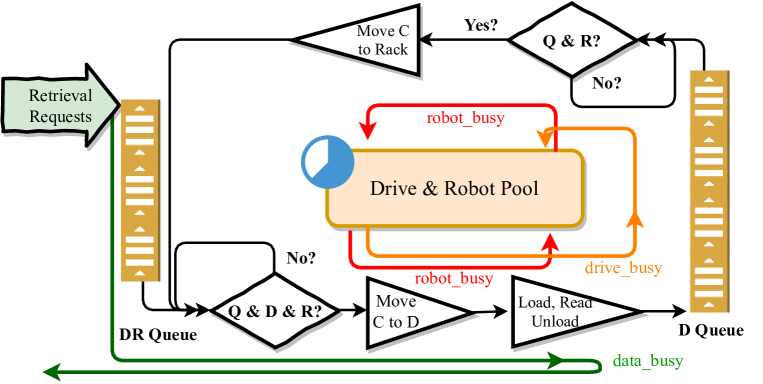
As previously stated, the modeling of a tape system presents a formidable challenge due to the intricate interplay of system components and dynamics, which may often be at odds with one another. For instance, the collocation process, while capable of mitigating the robot exchange rate, introduces complexities in controller design and results in an increase in data retrieval latency. We use DES and simplify our model as shown in Fig. 1. In this double-queue model, Data Request (DR) queue is used to place the data (file/object/fragment) requests for subsequent library service. Any data request in the DR queue is immediately processed once both a drive and a replacing robot are available in the library system configured as a pool. This is checked in every simulation step (through polling the pool).
2.0.1 The life cycle of a robot
The robots support cartridge movements in an operation cycle and this is repeated until there are no robots available to serve. There are three states of a library robot. Initially, the robot moves next to the drive to pick up the cartridge and replaces its original location in the library. Next, it travels for the cartridge to be inserted into the available drive. Once the new cartridge is inserted into the drive, we consider one full exchange has occurred. The robots that complete a full exchange get into an idle state and are recycled/returned to the available pool of drives and robots (PDRs). The drive on the other hand first loads the cartridge positions the heads for the right location and finally reads the data to its internal buffer. The buffer is emptied once full to address the host’s/client’s data read request (a similar process can be described for write requests) with the help of the managing server. Once the reading process is over, the drive re-positions, unloads the cartridge, and places itself in the Drive Queue (D Queue) to be serviced by an available robot. It also frees itself from the busy state and rejoins the available PDRs once it is serviced by a robot. D Queue is serviced by available robots which move the cartridges to their respective library locations. Once done, the robots turn idle again and rejoins the available PDRs, and awaits the next job. In case there is no drive or robot available at the time of the data request, the system stalls and polls for availability in the following discrete simulation step. All queues in our simulation model are First-In-First-Out (FIFO) and positioning/re-positioning actions are assumed to be of the same stochastic nature.
2.0.2 The life cycle of a drive
Similar to robots, drives can also be in three different states. In a busy state, drives are assigned for a service and logically reserved until they are serviced by a robot. Once the drive completes the assigned task (a reading or a subsequent writing operation), they get into an idle state where they are queued in the D Queue to be serviced by a robot. Once the drive becomes available again it changes state to free and is returned back to PDRs.
Data write or read requests are populated in the DR queue according to a Poisson distribution with rate . This rate can either be directly set or can be tied to library fill ratio () and Annual Object Touch Rates (AOTR) which might be readily available from the past usage patterns of the library222In fact, past data can be used in association with a learning module to predict the future data access patterns.. In our model, we can define three important measurable metrics that heavily have an impact on the performance of a library system:
-
data_busy: This is the time between the data gets placed on DR-Queue and the time it is served by the system after the drive completes reading.
-
robot_busy: This is the total time robot spends moving cartridges. This may involve multiple but consecutive short movements as will be detailed later.
-
drive_busy: This is the time the drive is released from PDRs, positions, loads, reads, unloads and re-positions the heads. In fact it also includes cartridge to cartridge and cartridge to drive robot movements as well. Once a drive is assigned for a service, it is logically reserved, stays idle and waits for the assigned job. No drive reserved for a job can be assigned another job.
2.1 Parameters of the System
There are several important parameters of the system such as library geometry, robot exchange, drive dynamics and object size which shall have direct impact on the performance of the library system.
2.1.1 Library Geometry
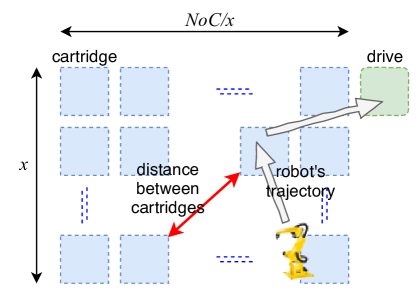
A tape library is a three-dimensional system in which drives and cartridges are placed according to a geometry. Geometry directly affects the time it takes a robot to move a cartridge from location to location inside the library. For simplicity, we consider a two dimensional rack topology shown in rectangle shape in Fig. 2 which can be extended to 3D. The number of cartridges (NoC), the vertical dimension (x) as well as the locations of drives are the parameters of the 2D library geometry model. In general, the number and orientation of cartridges, drives and robot movement trajectories directly affect the performance of a library. For instance, a 2D library of size where a single drive is located top right and robots moving to their destination using the smallest Euclidean distance is given in Fig. 2.
Considering that the probability of being near one of the cartridges is equally likely, the library geometry defines the distribution of travelling distance for a robot. Hence, considering a unit distance for cartridges and drives, calculation of pairwise distances can be performed. The mean value is configured/managed by the user to make the geometry resemble to the real library system topology. Finally, we emphasize that the same approach can be applied to 3D Euclidean geometry (a generic rectangular prism - cuboid) and similar mean statistics can be obtained.
Robot exchange count is defined as the number of times the robot completes a full exchange motion as defined above. Robot exchange rate is the ratio of robot exchange count to total number of discrete simulation steps for a given period of time (e.g. an hour). In fact, maximum robot exchange rate is a wear parameter associated with each robot and usually expressed in terms of exchanges per hour (xph). From this metric, the minimum exchange time can be calculated to be used in our simulation platform. In large enterprise library systems for instance, there may be more than one robot. In order to balance the wear, we pseudorandomly choose one of the robots if more than one is housed in the corresponding PDRs. One of the performance metrics that is directly tied to exchange count is the number of objects touched (NoT) in the tape cartridges. Everytime a robot moves from cartridge to an empty drive, we increment NoT count.
2.1.2 Object Size
It is reported in various past studies that the data object size (stored or communicated as objects with an average size of ) tend to possess heavy-tailed distribution such as Pareto (Satyanarayanan, 1981). On the other hand, there are also studies demonstrating that other heavy-tail distributions might be possible for local file systems (Downey, 2001), hard disk data (Arslan and Zeydan, 2020) and world wide web (Gong et al., 2001). In our study, we assume a Weibull distribution with configurable shape and scale parameters such that we can model both fixed and exponential object sizes by adjusting these parameters.
2.1.3 Loading and Positioning
Media load time is defined as the amount of time between the cartridge insertion into a drive and the drive firmware become ready to listen for host system commands. We assume the media load time to exhibit only little variation as the drive system is an enclosed system and therefore least affected by external changes. After the cartridge is loaded into the drive, the head is being positioned on the location of the data laid on the magnetic tape. Depending on the exact data location on tape, the loading time may dramatically vary. We model the location of the data object to be uniformly distributed across the tape surface.
2.1.4 Robot Exchange Count
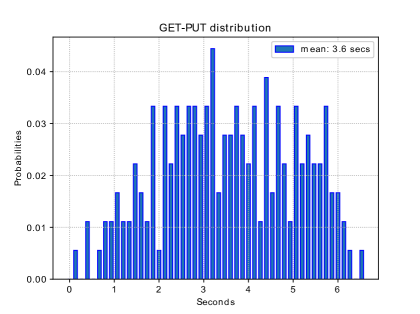
In our model, an exchange consists of four motions that can be sequenced as GET-PUT-GET-PUT. To visualize that, suppose we would like to switch to a different cartridge in a drive. Initially we assume that robot is situated at an arbitrary point in the library and reserved for an exchange. The first motion (r2d) consists of moving near to the drive to pick up (GET) the unloaded cartridge. In the second motion (d2c), robot carries the cartridge to its respective location (PUT) inside the library to empty the drive for an incoming (target) one. The third motion (c2c) of the robot is to move beside the target cartridge to pick it up (GET). The final motion (c2d) is to carry it to the drive (PUT) for read/write operation. The robots when being used stick to these four essential motions in the order presented. The total exchange time is defined to be the sum of these four motions. The distributions of r2d, d2c, c2c and c2d are determined by the geometry of the library system, robot motion statistics and a mean value provided by the user. A sample distribution is provided in Fig. 2 for a 2D library in which drives are placed in the center with a robot operating at a mean exchange rate of xph. Note that for this exchange rate, the mean motion time is secs.
Robot exchange count is defined as the number of times the robot completes a full exchange motion as defined above. Robot exchange rate is the ratio of robot exchange count to total number of discrete simulation steps for a given period of time (e.g. an hour). In fact, maximum robot exchange rate is a wear parameter associated with each robot and usually expressed in terms of exchanges per hour (xph). From this metric, the minimum exchange time can be calculated to be used in our simulation platform. In large enterprise library systems for instance, there may be more than one robot. In order to balance the wear, we pseudorandomly choose one of the robots if more than one is housed in the corresponding PDRs. One of the performance metrics that is directly tied to exchange count is the number of objects touched (NoT) in the tape cartridges. Everytime a robot moves from cartridge to an empty drive, we increment NoT count.
2.1.5 Object Size
It is reported in various past studies that the data object size (stored or communicated as objects with an average size of ) tend to possess heavy-tailed distribution such as Pareto (Satyanarayanan, 1981). On the other hand, there are also studies demonstrating that other heavy-tail distributions might be possible for local file systems (Downey, 2001), hard disk data (Arslan and Zeydan, 2020) and world wide web (Gong et al., 2001). In our study, we assume a Weibull distribution with configurable shape and scale parameters such that we can model fixed and exponential object sizes by adjusting these parameters.
2.1.6 Loading and Positioning
Media load time is defined as the amount of time between the cartridge insertion into a drive and the drive firmware become ready to listen for host system commands. We assume the media load time to exhibit only little variation as the drive system is an enclosed system and therefore least affected by external changes. After the cartridge is loaded into the drive, the head is being positioned on the location of the data laid on the magnetic tape. Depending on the exact data location on tape, the loading time may dramatically vary. We model the location of the data object to be uniformly distributed across the tape surface.
2.2 Advanced System Features
In this subsection, we shall detail the advanced features of the library simulation model which includes collocation, data redundancy and protection support, protocol types while retrieving data from the library.
2.2.1 Collocation
Collocation is a technique that involves collecting numerous small-sized data requests and assembling them into a larger chunk of request within a buffer. The objective of this technique is to decrease internal system traffic and alleviate queue load, which ultimately enhances access times. In other words, incoming data requests from a specific user are accumulated in the server RAM till the total size exceeds a threshold value. If we let be the mean size of the requested data by user , and threshold where threshold is a common collocation parameter. Then, the arrival rate of collocated requests of user will be another Poisson process with rate . Collocation between different users can happen only if their data content have some sections in common i.e., deduplication is possible.
2.2.2 Redundancy for Reliability
Replication is a technique to maintain data reliability by storing multiple copies of the same exact data object in different failure domains. The number of copies is known as the replication factor of the system. In the library model, different failure domains may mean different cartridges or different libraries depending on the single or multiple library (ML) contexts. For instance, if it is a single Enterprise library simulation it would mean different and independent cartridges assuming that cartridge wear or failures are relatively independent of each other. On the other hand in a RAIL environment, it would mean different and independent libraries. Let us take the cartridge-level failure tolerance as an example. A user can request his data object without knowing the existence of the replicas. However, having multiple copies available can help reduce the access latency performance. There are two protocols our library system model supports to deal with the retrieval and post services. We detail these protocols in the next subsection.
On the other hand, replication leads to an inefficient storage resource utilization. In other words, the maximum usable raw data storage of the library system decreases proportional to an increase in the replication factor. An obvious solution to this is the use of erasure coding in which a data is first partitioned into equal size smaller objects (also known as fragments) and gets encoded into distinct objects of the same size. The group of all these objects is named as a codeword. These objects (also referred as the symbols of the codeword) are placed in the DR-queue for service just like before. In case of any failed cartridges or libraries, we would still be able to recover the data object from the remaining objects scattered across different failure zones. If , the erasure codes are deemed to be storage-optimal and belong to the class of Maximum Distance Seperable (MDS) codes (Wicker and Bhargava, 1999). If raw data objects are part of the codeword, the erasure codes are called systematic. Otherwise, they are named non-systematic. Since data object reconstruction requires only fragments for MDS codes, one needs to put fragment requests on respective DR queue/s. The ways these fragments are requested are tied to a set of rules known as protocols. Depending on the protocol we use, the latency performance with erasure code redundancy may vary.
2.2.3 Redundant and Failure Protocols
One of the most distinctive features of the proposed simulation model is the utilization of two different protocols under two different redundancy schemes, namely, redundant v.s. failure and replication v.s. erasure coding. We shall detail these protocols for replication and erasure codes in separate subsections.
Redundant Protocol with Replication:
In this case, we place multiple copies inside the same library on different cartridges (failure zones). This protocol dispatches multiple calls of the same data (depending on the replication factor) and places these requests sequentially on the DR queue.
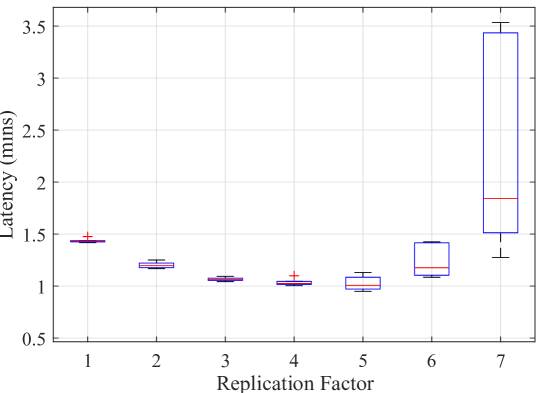
In various events of failure, e.g., cartridges may be unreadable due to aging or aggregated debris, and drives may require a lot of retires, the system dispatches as many copies as can be placed (not more than the replication factor) on the DR queue 333We assume no catastrophic failures i.e., data comes back almost certainly (as long as an enough number of retries are used) though at the expense of increased latency. In other words, dead cartridge and permanent data inaccessibility is ignored throughout this study.. These copies share the same timestamp but different message IDs for later processing. The system does not wait for any copy request to successfully return to take any further action. In other words, the system operation is completely asynchronous. The earliest copy service completion (arrival) shall be served to the user who initiated the request. The disadvantage of replication is two fold. First, it consumes a lot of storage space in the library resulting in inefficient utilization of cartridge capacity. Secondly, due to multiple dispatches, the rest of the replies are simply ignored and will create internal bus/link and queue traffic. Asynchronous multiple dispatches can help with the latency performance of the system. This is due to libraries have multiple robots i.e., enterprise libraries, drives and other resources that operate independent of each other. However, both library queues are inherently sequential. We can place two requests of the same data one after another (with different IDs) and the library system will allocate resources for these copies in a first come first serve fashion.
Indeed, there is a trade-off between the replication factor and access latency as shown in an example run for geometry in Fig. 3. As can be observed, having more independent copies stored in different cartridges help improve the latency performance till we reach up to 4 copies for this particular geometry. Beyond that, latency performance is adversely effected due to increased traffic inside the library queues. This simple demonstration also advocates that using the proposed simulation model, access-latency-optimal number of copies can be determined for a given set of system parameters.
Failure Protocol with Replication:
In case of failures, the system dispatches only one copy request (randomly444In fact closest copy inside the library based on the geometry might be preferable in terms of data access latency performance. However, this would require extra logic implemented in the server as well as a database (or a computation framework) to access the locations of the stored content.) and places it on the DR queue. The system attempts to bring the data object back while it blocks other requests for the same data. If the placed data request never comes back within a certain time threshold, other copy requests are subsequently placed in the queue until the user’s request is succesfully served. If none of the copy requests return within the allotted threshold time, the data is considered lost or temporarily unavailable which results in system halt.
One of the reasons for a failed response of requested data may be due to a failure that drives attempts to solve with repeated re-tries. In case the drive is unable to read the data object (which happens with some non-zero probability), it is capable of retrying the data read sessions by repositioning the drive heads. We assume that the number of retries follows a binomial distribution. Also, since the drive systems are enclosed stable devices operating at around 300MBs/sec.555This parameter is also configurable for the future generation of LTO drives., each re-try is assumed to take almost the same time. We do not allow each copy service time to take forever by thresholding the maximum wait time. If the re-positioning and read operations do not terminate successfully within that time period, the next copy request is placed on the DR-queue. In case of success, we no longer place any more data requests on the queue and help create less congestion on the DR and R queues and eventually obtain better access latency performance.
Protocols with Erasure Coding:
Choosing the redundancy scheme as erasure coding is the generalization of the replication approach with and being the replication factor. However, if , we use erasure coding as the special name to characterize the redundancy scheme.
Redundant protocol dispatches a subset of size of the data fragments and places these requests sequentially on the DR queue to be served by robot/s. These fragment requests share the same timestamp and message ID. The server system waits until earliest of these fragments are serviced successfully. If the number of returned fragment requests is less than , then the system throws an “unable to retrieve the data object” error. Otherwise, the requested object is reconstructed using the collected fragments by a subsequent decoding operation.
In order to describe the Failure protocol, let us introduce some notation. Let to represent the fragment indexes. Failure protocol dispatches only a -size subset of the data fragments and awaits for a response. If all of these requests return successfully, the data is served to the user. Suppose fragment requests never arrive (i.e., the service time exceeds a given time threshold for these fragment requests). In that case, the system places any of the fragments from the set on the DR queue. Note that we implicitly assume . Otherwise, the system throws “unable to retrieve the data object” error. If system uses systematic MDS code, then fragments are data fragments themselves and only in case of failure, decoder is run. On the other hand, if system uses a non-systematic MDS code, the decoder needs to run all the time which shall prolong the total service time. Note that if there is no failure, Failure protocol leads to less congestion on the DR and D queues.
2.2.4 The life cycle of a data retrieval request
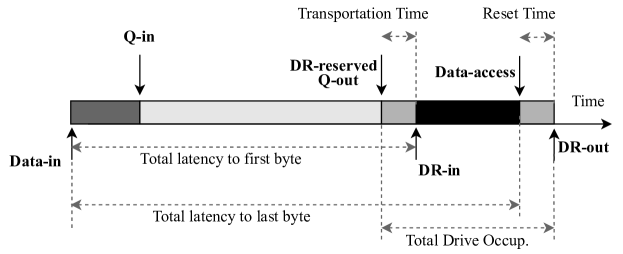
In Fig. 4, we demonstrate several check points in the life cycle of a data request. Data-in represents the time instant where a particular data request meets the library system for the first time. Q-in denotes the time when that request is put in the DR queue. Whenever a drive and a robot are reserved, the request is pulled out of the DR queue at Q-out and after some transportation time, the cartridge is inserted into the drive at DR-in and the request receives service. The transportation time includes c2c, d2c, c2d. The drive is loaded with the cartridge and the tape is rolled to the exact location where the data is stored. After reading data, the retrieval service terminates at Data-access. Thus, the sum of loading and read times is given by the difference between Data-access and DR-in. Right after the completion of the requested task, the drive is reset and becomes available again to serve the next request. This reset time includes repositioning, unloading and r2d. Similarly, the total latency to the first and the last bytes are given by DR-in Data-in and Data-access Data-in, respectively. The total drive occupation time is also given by DR-out Q-out. With this checkpoint definitions, various other performance metrics can be defined in similar fashion.
We also have to note that Data-in and Q-in need not be identical depending on the choice of the protocol we use. In the failure protocol for instance, the first copy request may never go through due to read failures and hence a second request might be inserted into the DR queue for the same exact data. In this case, the time Q-in characterizes the second request being placed in the DR queue which is not necessarily equal to Data-in time for the same data request.
2.2.5 Rate of Object Request
The data object request rate can be determined either by manually by setting to an appropriate value or based on the raw data stored on the library system. Given the parameters of the system and time period , we can compute the rate of the Poisson arrival rate within as
| (1) |
where AOTR stands for Annual Object Touch Rate (AOTR) and is the library fill ratio. The aggregate rate of request needs to be modified accordingly as the simulation settings change. For instance in a RAIL-type ML simulation setting under different protocols and the number of users, aggregate rate of request arrivals are distributed among different independent libraries reducing the rate of request rate per library.
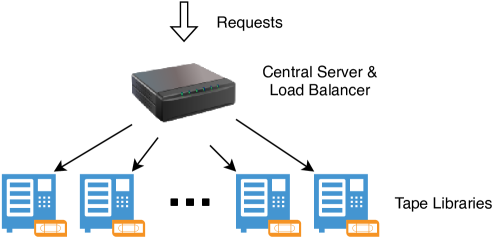
3 Multiple User/Library Simulations
A depiction of the ML system can be seen in Fig. 5. The ML system comprises a central server that performs several tasks, including dispatching and load balancing. The load balancer duplicates and allocates suitable requests, totaling at least , across the DR queues of multiple independent tape libraries.
In ML, each library has their own unique queues. When a data object request arrives, we place the same request to at least DR queues at the exact same time. Libraries are assumed to be homogeneous and share the same parameter list. Due to this assumption, we adapt code re-use to simulate the concurrency by utilizing the software developed for single Enterprise library 666By playing with the configuration parameters, these independent libraries become no longer Enterprise.. We further assume that each independent library confronts with the same data request patterns. To regenerate the data request arrivals for each distinct library, we apply selective seeding for the random number generators. Although each library will run sequentially, the output files shall be generated as if we run multiple concurrent libraries loaded with identical data object request patterns. This is possible due to selective seeding which makes sure that the random number generators create the exact same sequences for each independent library run.
In case of ML, contrary to single Enterprise, both Redundant and Failure protocols place the data object (fragment) requests on different DR-queues. This is due to libraries are in different failure zones. With respect to Redundant protocol, similar to single enterprise library scenario the earliest data service arrivals shall be used to decode and serve the user data store/retrieval request. In the Failure protocol however, when a request is delayed, an appropriate selection of a library is made to serve in place of the delayed request. However, this would lead to dependent simulation of inexpensive libraries. In other words, failures in one library (due to absence of redundancy within a library) will lead to a change on the request patterns of another library. The way we resolve this issue and allow independent simulations of multiple libraries is to use averaging arguments. In other words, the additional data object requests due to potential failures in other libraries can stochastically be modeled into a random variable and the data request patterns can accordingly be adjusted to compensate for these additional requests due to potential failures. Additionally, library systems typically serve more than one user and since the load balancer dispatches user requests in a pseudo random fashion, the total number of requests in a library DR-queue would become random.
Suppose we have users and library nodes, and the th user has AOTR ATORi. Let be the random variable characterizing the number of user fragment requests for library node . We assume to be binomially distributed given by
| (2) |
for . Let us suppose that represents the data access (to first or last byte) latency of the th library for the th data object retrieval and to be the total number of requests in the th library DR-queue. Also, denote to be the th minimum of all s. The overall data access latency of the ML system is approximated by where is the -th minimum. Here, the fragments that belong to the same codeword stored on different libraries are identifed based on their message IDs.
Although parallel processing would enable RAIL-type ML systems to demonstrate better service quality, the constituent libraries are typically selected to be less capable and economical (inexpensive). On the other hand, single libraries are usually enterprise-level and equipped with multiple high quality robots and drives. One of the structural differences of RAIL-type ML case compared to single Enterprise library is the distinct queues although both systems may have the same (or similar) number of drives and robots overall. This allows ML to process requests in a highly parallel fashion resulting in increased latency performance.
In Failure protocol, we take a probabilistic approach for RAIL-type ML simulations. First off, the rate of the arrival for each library node is given by . However since some requests will return error due to wait times are larger than the predetermined threshold, central server will dispatch new requests to other distinct libraries. This will increase the total request rate on each library to . In fact, in each read failure, AOTR would be increased by a factor of . In other words, with the drive failure probability , we can calculate using equation (1) based on averaging arguments. In that case, the updated average annual object touch rate would be given by ATOR.
4 Read Latency Analysis
The basic tool to use for the analysis is based on Queuing theory. First, we realize that although the arrivals are Poisson, service time is a function of the library geometry and is nowhere near one of the familiar distributions. There are two queues DR and D which are highly dependent on the availability of the library resources. Hence queuing times as well as the services times are directly affected by each other. Clearly, service time is not exponentially distributed. On the other hand, assuming each drive retry takes exponential time, and sum of exponentially distributed retries shall give us a Gamma distribution.
To recall Kendall’s notation for queuing systems, we use the notation . This refers to a queuing system where represents the probability distribution of inter-arrival times, represents the probability distribution of service times, represents the number of servers, represents the queue capacity, represents the size of the population, and represents the service discipline. For instance would characterize Poisson request arrivals, exponential service times and there is only single robot/drive as a server. In our approximate analysis, we typically assume large size queues. Thus, our queues in the library system can be assumed to act as a (or in short) system where represents the number robot/drives. Unfortunately, most performance metrics for this queuing system are not known. Plus, our model consists of two-phase dependent queues (DR and D) and use of two different protocols which would complicate the overall operation model. Thus, there seems to exist no easy mathematical resolution for the proposed system.
Let us focus on a single queue for simplicity. Without considering the interaction between the queues (treating them independently) and using redundant protocol along with large number () of robots/drives, the mean number of requests waiting in the queues can be approximated by (Ross, 2006)
| (3) |
where and is the probability that there are no requests waiting in the queue and it can be approximated by
| (4) |
Finally, using Little’s law, we can find the wait time in the queue to be approximated by . Furthermore, to find for queue model, we can use the following approximation (Ross, 2006)
| (5) |
where and are the coefficients of variation of the inter-arrival and service times, respectively. In case of exponential inter-arrival and service times, we have . To be able to find the data access time, we focus on the DR queue. However, for service we would need both a drive and a robot.
For a very rough approximation, we decouple the service time of Robot+Drive by introducing a fictitious queue (queue B) and combine two separate robot services in another fictitious queue (queue A) to model the overall behaviour. In fact, assuming robots, and drives, the queue A can be modeled as whereas queue B can be modeled as due to arrivals would no longer be according to Poisson. Assuming average robot and drive service times to be and , the average access time to data would be given by . Note that robot and drive service times are functions of robot-to-drive, drive-to-robot distributions, geometry, positioning and load time distributions and the protocol we use.
5 Numerical Results
In this section, we present selected simulation outcomes from our tape simulation platform. We assume no collocation throughout this section to emphasize the resource utilization performance under the worst-case scenario. The results reported are unitless and/or relative to demonstrate statistical and comparative performance instead of raw performance.
We begin by simulating a single Enterprise library system containing (a total of ) cartridges each with capacity 12TBs, two high-quality robots (operating at 150xph each) to serve both queues and 80 independent drives each with an average of 300MB/s streaming data rate. We also assume for all our simulations 18 secs and 50 secs average drive load and positioning times, respectively, each one uniformly distributed with support starting at 0. The data object size is assumed to be fixed at 5GB (non-random). We used erasure code, i.e., 6-copy system with both Redundant and Failure protocols using 600 objects touched on average per day (which is manually set) by 40 users. The Failure protocol would be using 100 simulation steps as the decision threshold unless otherwise stated. Assuming drive read failures occur, with a maximum of 10 drive re-tries, we have simulated the single tape library system for 3 days time period (72 hours) and obtained the average queue lengths as well as the data access latency to the last byte as a function of time (in hourly discrete steps).
In Fig. 6 and Fig. 7, DR and D queue waiting times as well as data access latency are shown all in terms of the same unit of time as a function of day time in hours for Redundant and Failure protocols, respectively. Accordingly, with the given parameter selections, the simulation result indicates that it takes on average % 48 more time to retrieve data from the library system using Redundant protocol relative to Failure protocol. As expected, Failure protocol also touches objects a little more than one-sixth of the total number of objects touched using Redundant protocol. This feature allows better utilization of the library resources and hence better latency performance at the expense of more complex implementation and more data access.
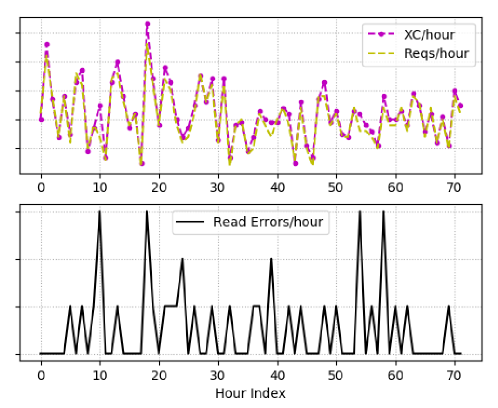
In Fig. 8, one of the other simulation outputs is shown which demonstrates when and how many read errors have happened during the single library simulation while using Failure protocol. In our context, a read error happens when the drive executes all possible re-tries (10 for this simulation) and fail to retrieve the data within a threshold time (100 steps for this simulation). As a consequence of this, by playing with the threshold parameter the read errors can be increased or decreased at the expense of better or worse access latency performance. In addition, the total number of exchanges per hour (XC/hour) as well as incoming requests per hour (Reqs/hour) are also plotted on top of each other which clearly demonstrates that the load on robots is proportional to the incoming data retrieval requests. This is mainly due to the use of Failure protocol and relatively small drive read failure rates. If we had used Redundant protocol instead, the system would have generated three times more requests and accordingly increased robot exchanges. Such a plot might be important for monitoring the health of the system and thanks to the multiple copies, the library would still be able to respond to the various data object requests originated by the users.
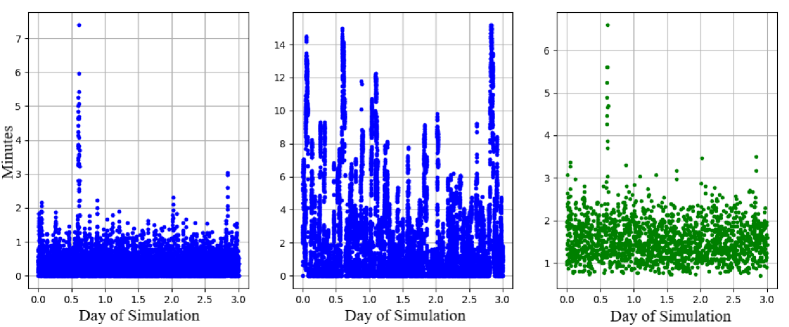
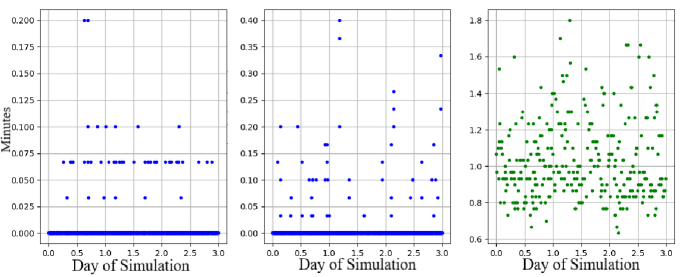
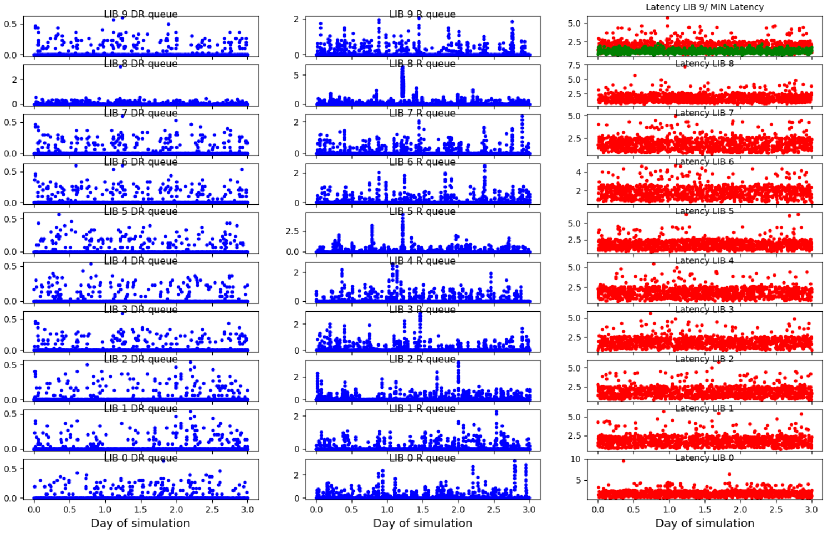
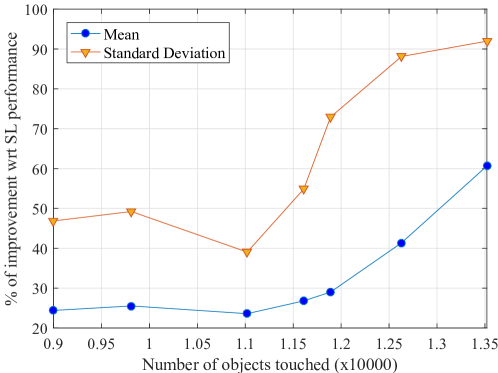
In order to compare an Enterprise scale-up and a RAIL-type scale-out library configurations, we have also simulated a multiple-library distributed tape system. In this case, the component libraries are selected to be of a geometry (a total of 672) each cartridge with 12TBs capacity. To be able to fix the system size and the number of drives, we used 10 libraries, each is equipped with 1 low quality robot (operating at 100xph) and 8 same-quality drives. Note that with this configuration, the library size is set to be 80.64TB which is identical to that of the single Enterprise case. The rest of the simulation parameters are assumed to be the same. The results are plotted in Fig. 9. We realize from the results that with the RAIL-type scale-out setting the queue loads are considerably decreased providing a mean latency improvement of 25% of relative to single enterprise library. We also note that both systems use Redundant protocol and similar number of objects are touched, which is mainly characterized by 600 objects touched on average per day. This parameter of the system determines the average traffic that is imposed upon the library system/s. In order to clearly demonstrate the main benefit of the RAIL-type ML system, we gradually varied this parameter to change the total actual number of objects touched in our 3-day simulation. We run several simulations with different traffic conditions and plotted the results for both Enterprise and RAIL-type ML cases in Fig. 10. As can be observed from the plotted results in a relative manner. In other words, we have plotted improvement of single Enterprise library mean access time and its standard deviation as compared to the performance of RAIL-type multi library. As can be clearly seen, ML approach not only helps us get better average latency performance but also helps with the standard deviation of the data access latency. Results also show that as the number of objects touched goes beyond around 11500, the average access time/standard deviation of single Enterprise library begins to grow more rapidly. This is seen to be due to the library going unstable due to increased request rate.
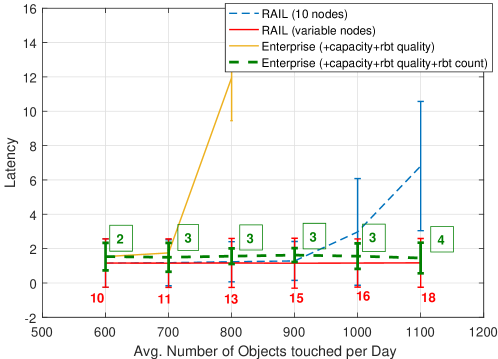
In Fig. 11, we have presented the latency performance and the potential of the RAIL-type setting with increasing demand from the system. This demand is quantified in terms of number of objects touched set manually. In one case, we assumed the number of nodes to be fixed to 10 and use 6-copy for redundancy in all schemes. As the demand increases, the system does not adaquately generate response on time and hence the latency performance degrades. However, if we let the number of nodes increase gradually such that 60 objects touches per node is observed, we obtained the RAIL system with variable nodes. In other words, the number of nodes is set to number of objects touched/60. As can be observed, the scale-out RAIL system addresses the increased demand and keeps the latency performance at an acceptable level.
To be able to compare this adaptive RAIL system against the enterprise, we first considered a single scale-up system with the number of cartridges, drives and the quality of constituent robots (2 robots) in terms of xph scale all together as the number of nodes increase in order to maintain the same level of capacity and service quality. What we have observed with this setting is the unstable system operation after 700 object touches on average per day. We have figured that in order to resolve this, we needed to incorporate more robots in to the scale-up system. Those numbers are provided within boxes for each data point in Fig. 11. As can be seen even with this adaptation RAIL system exhibits better performance compared to the Enterprise due mainly to independent queues serving the incoming independent requests more flexibly and efficiently with reduced quality robots and drives i.e., at a reduced state of cost.
6 Conclusion and Discussions
A discrete event tape simulation platform is developed and presented with realistic system-level assumptions, allowing for the accurate estimation of numerous key performance indicators (KPIs) for Enterprise and RAIL-type ML system configurations. The study employs two forms of redundancy—namely, replication and erasure coding—to ensure reliable data storage in a networked tape cloud setting. Despite limited sampling from the parameter space, the comparison between scale-up (single large Enterprise-grade) and scale-out (RAIL-type, featuring multiple smaller and less expensive) libraries reveals the advantages of scale-out libraries. This advantage is attributed to efficient traffic sharding and optimal resource utilization due to inherent parallelism. Given the intricate mechanics and complex system operations inherent in tape systems, conventional queue theory fundamentals are insufficient for their analysis. Therefore, the introduced simulation platform serves as a valuable design tool for reliability engineering. It is particularly useful for system administrators seeking to employ tape libraries as a long-term archive and data retention option. One notable advantage of the simulation platform is its flexibility for accommodating additional features in future generations of tape libraries. This flexibility allows for straightforward implementation and incorporation of novel changes into the simulation framework without necessitating a reconsideration of the statistical characterization of the theoretical model. This adaptability enhances the efficiency and speed of accessing results, making the simulation platform a valuable tool for promptly assessing the impact of technological advancements on tape library systems.
References
- Appuswamy et al. (2019) Appuswamy, R., Le Brigand, K., Barbry, P., Antonini, M., Madderson, O., Freemont, P., McDonald, J., Heinis, T., 2019. Oligoarchive: Using dna in the dbms storage hierarchy., in: CIDR.
- Arslan (2019) Arslan, S.S., 2019. A reliability model for dependent and distributed mds disk array units. IEEE Transactions on Reliability 68, 133–148. doi:10.1109/TR.2018.2878503.
- Arslan (2022) Arslan, S.S., 2022. Optimal data decoding strategies for product-coded sequential media recording via latin squares. IEEE Transactions on Magnetics 59, 1–11.
- Arslan (2023) Arslan, S.S., 2023. Durability and availability of erasure-coded storage systems with concurrent maintenance. arXiv preprint arXiv:2301.09057 .
- Arslan and Goker (2022) Arslan, S.S., Goker, T., 2022. Compress-store on blockchain: a decentralized data processing and immutable storage for multimedia streaming. Cluster Computing 25, 1957–1968.
- Arslan et al. (2020a) Arslan, S.S., Jurdak, R., Jelitto, J., Krishnamachari, B., 2020a. Advancements in distributed ledger technology for internet of things. Internet of Things 9, 100114. URL: https://www.sciencedirect.com/science/article/pii/S2542660519302318, doi:https://doi.org/10.1016/j.iot.2019.100114.
- Arslan et al. (2013) Arslan, S.S., Lee, J., Goker, T., 2013. Cycle slip detection and correction through classification of modulation code failures. IEEE transactions on magnetics 49, 4988–4998.
- Arslan et al. (2014) Arslan, S.S., Lee, J., Hodges, J., Peng, J., Le, H., Goker, T., 2014. Mds product code performance estimations under header crc check failures and missing syncs. IEEE Transactions on Device and Materials Reliability 14, 921–930.
- Arslan et al. (2020b) Arslan, S.S., Peng, J., Goker, T., 2020b. A data-assisted reliability model for carrier-assisted cold data storage systems. Reliability Engineering & System Safety 196, 106708.
- Arslan and Zeydan (2020) Arslan, S.S., Zeydan, E., 2020. On the distribution modeling of heavy-tailed disk failure lifetime in big data centers. IEEE Transactions on Reliability 70, 507–524.
- Baginyan et al. (2021) Baginyan, A., Balandin, A., Balashov, N., Dolbilov, A., Gavrish, A., Golunov, A., Gromova, N., Kashunin, I., Korenkov, V., Kutovskiy, N., et al., 2021. Current status of the micc: an overview, in: CEUR Workshop Proceedings, pp. 1–8.
- Benet (2014) Benet, J., 2014. Ipfs-content addressed, versioned, p2p file system. arXiv preprint arXiv:1407.3561 .
- Bornholt et al. (2016) Bornholt, J., Lopez, R., Carmean, D.M., Ceze, L., Seelig, G., Strauss, K., 2016. A dna-based archival storage system, in: Proceedings of the Twenty-First International Conference on Architectural Support for Programming Languages and Operating Systems, pp. 637–649.
- Brunengo et al. (2020) Brunengo, A., Carlino, G., Chierici, A., Dell’Agnello, L., De Salvo, A., Fantinel, S., Maron, G., Mazzoni, E., Michelotto, M., Sapunenko, V., et al., 2020. Analisi della evoluzione delle tecnologie hardware per il calcolo scientifico .
- Cancio et al. (2015) Cancio, G., Bahyl, V., Kruse, D.F., Leduc, J., Cano, E., Murray, S., 2015. Experiences and challenges running cern’s high capacity tape archive, in: Journal of Physics: Conference Series, IOP Publishing. p. 042006.
- Cavalli et al. (2023) Cavalli, A., Cesini, D., Falabella, A., Fattibene, E., Fornari, F., Morganti, L., Prosperini, A., Sapunenko, V., 2023. Experience in dynamic tape drive allocation to manage scientific data, in: Journal of Physics: Conference Series, IOP Publishing. p. 012037.
- Downey (2001) Downey, A.B., 2001. The structural cause of file size distributions, in: MASCOTS 2001, Proceedings Ninth International Symposium on Modeling, Analysis and Simulation of Computer and Telecommunication Systems, IEEE. pp. 361–370.
- Felden et al. (2023) Felden, J., Möller, L., Schindler, U., Huber, R., Schumacher, S., Koppe, R., Diepenbroek, M., Glöckner, F.O., 2023. Pangaea-data publisher for earth & environmental science. Scientific Data 10, 347.
- Ford et al. (1996) Ford, D.A., Morris, R.J., Bell, A.E., 1996. Redundant arrays of independent libraries (rail): a tertiary storage system, in: COMPCON’96. Technologies for the Information Superhighway Digest of Papers, IEEE. pp. 280–285.
- Gantz et al. (2011) Gantz, J., Reinsel, D., et al., 2011. Extracting value from chaos. IDC iview 1142, 1–12.
- Gong et al. (2001) Gong, W., Liu, Y., Misra, V., Towsley, D., 2001. On the tails of web file size distributions, in: Proceedings of the annual allerton conference on communication control and computing, The University; 1998. pp. 192–201.
- Goodwin (2019) Goodwin, P., 2019. Tape and cloud: Solving storage problems in the zettabyte era o f data. IDC Corporate, Massachusetts, United States .
- Gupta et al. (2012) Gupta, R., Gupta, H., Nambiar, U., Mohania, M., 2012. Enabling active data archival over cloud, in: 2012 IEEE Ninth International Conference on Services Computing, IEEE. pp. 98–105.
- Hafner and Rao (2006) Hafner, J.L., Rao, K., 2006. Notes on reliability models for non-mds erasure codes. IBM Res. rep. RJ10391 .
- Huang et al. (2005) Huang, T.J., Kennedy, R.D., Kulyavtsev, A., Moibenko, A., Perelmutov, T., Petravick, D., Podstavkov, V., Szmuksta, G., Zalokar, M., 2005. Fermilab’s multi-petabyte scalable mass storage system, in: Proceedings, IEEE Computer Society Press. p. 73.
- Iliadis et al. (2016) Iliadis, I., Kim, Y., Sarafijanovic, S., Venkatesan, V., 2016. Performance evaluation of a tape library system, in: 2016 IEEE 24th International Symposium on Modeling, Analysis and Simulation of Computer and Telecommunication Systems (MASCOTS), IEEE. pp. 59–68.
- Iliadis et al. (2016) Iliadis, I., Kim, Y., Sarafijanovic, S., Venkatesan, V., 2016. Performance evaluation of a tape library system, in: 2016 IEEE 24th International Symposium on Modeling, Analysis and Simulation of Computer and Telecommunication Systems (MASCOTS), pp. 59–68. doi:10.1109/MASCOTS.2016.37.
- Jiang et al. (2014) Jiang, L., Da Xu, L., Cai, H., Jiang, Z., Bu, F., Xu, B., 2014. An iot-oriented data storage framework in cloud computing platform. IEEE transactions on industrial informatics 10, 1443–1451.
- Kalashnikov (1993) Kalashnikov, V.V., 1993. Mathematical methods in queuing theory. volume 271. Springer Science & Business Media.
- Kiemle et al. (2016) Kiemle, S., Molch, K., Schropp, S., Weiland, N., Mikusch, E., 2016. Big data management in earth observation: The german satellite data archive at the german aerospace center. IEEE Geoscience and remote sensing magazine 4, 51–58.
- Lavenberg and Slutz (1975) Lavenberg, S.S., Slutz, D.R., 1975. Regenerative simulation of a queuing model of an automated tape library. IBM Journal of Research and Development 19, 463–475.
- Leong et al. (2012) Leong, D., Dimakis, A.G., Ho, T., 2012. Distributed storage allocations. IEEE Transactions on Information Theory 58, 4733–4752.
- Lüttgau (2016) Lüttgau, J., 2016. Modeling and Simulation of Tape Libraries for Hierarchical Storage Mangement Systems. Ph.D. thesis. Universität Hamburg, Fachbereich Informatik.
- Mardis (2011) Mardis, E.R., 2011. A decade’s perspective on dna sequencing technology. Nature 470, 198–203.
- Memishi et al. (2019) Memishi, B., Appuswamy, R., Paradies, M., 2019. Cold storage data archives: More than just a bunch of tapes, in: Proceedings of the 15th International Workshop on Data Management on New Hardware, pp. 1–7.
- Moore et al. (2007) Moore, R.L., D’Aoust, J., McDonald, R.H., Minor, D., 2007. Disk and tape storage cost models, in: Archiving Conference, Society for Imaging Science and Technology. pp. 29–32.
- van Ooijen et al. (2019) van Ooijen, C., Ubaldi, B., Welby, B., 2019. A data-driven public sector: Enabling the strategic use of data for productive, inclusive and trustworthy governance .
- Pease et al. (2010) Pease, D., Amir, A., Real, L.V., Biskeborn, B., Richmond, M., Abe, A., 2010. The linear tape file system, in: 2010 IEEE 26th Symposium on Mass Storage Systems and Technologies (MSST), IEEE. pp. 1–8.
- Perez et al. (2003) Perez, J.M., Garcia, F., Carretero, J., Calderon, A., Sanchez, L.M., 2003. Data allocation and load balancing for heterogeneous cluster storage systems, in: CCGrid 2003. 3rd IEEE/ACM International Symposium on Cluster Computing and the Grid, 2003. Proceedings., IEEE. pp. 718–723.
- Pokhodzei (1981) Pokhodzei, B., 1981. Principles of discrete event simulation: Gs fishman. xviii+ 514 p. wiley-interscience, new york, 1978.
- Preukschat and Reed (2021) Preukschat, A., Reed, D., 2021. Self-sovereign identity. Manning Publications.
- Reinsel et al. (2018) Reinsel, D., Gantz, J., Rydning, J., 2018. White Paper: The Digitization of the World-From Edge to Core. Technical Report. Technical Report US44413318, International Data Corporation, Framingham ….
- Ross (2006) Ross, S.M., 2006. Introduction to Probability Models, ISE. Academic press.
- Satyanarayanan (1981) Satyanarayanan, M., 1981. A study of file sizes and functional lifetimes. ACM SIGOPS Operating Systems Review 15, 96–108.
- Szor (2005) Szor, P., 2005. The art of computer virus research and defense: Art comp virus res defense _p1. Pearson Education.
- Welch and Noer (2013) Welch, B., Noer, G., 2013. Optimizing a hybrid ssd/hdd hpc storage system based on file size distributions, in: 2013 IEEE 29th Symposium on Mass Storage Systems and Technologies (MSST), IEEE. pp. 1–12.
- Wicker and Bhargava (1999) Wicker, S.B., Bhargava, V.K., 1999. Reed-Solomon codes and their applications. John Wiley & Sons.
- Zeng et al. (2006) Zeng, L., Feng, D., Wang, F., Cheng, Z., Zou, Q., 2006. Creation of a java-based interactive modeling environment with tape library model example, in: 2006 International Workshop on Networking, Architecture, and Storages (IWNAS’06), IEEE. pp. 8–pp.
- Zeydan and Arslan (2020) Zeydan, E., Arslan, S.S., 2020. Cloud 2 hdd: large-scale hdd data analysis on cloud for cloud datacenters, in: 2020 23rd Conference on Innovation in Clouds, Internet and Networks and Workshops (ICIN), IEEE. pp. 243–249.
- Zeydan et al. (2023) Zeydan, E., Mangues, J., Arslan, S., Turk, Y., 2023. Blockchain-based self-sovereign identity solution for vehicular networks, in: 2023 19th International Conference on the Design of Reliable Communication Networks (DRCN), pp. 1–7. doi:10.1109/DRCN57075.2023.10108183.
- Zeydan et al. (2024) Zeydan, E., Mangues, J., Arslan, S.S., Turk, Y., 2024. Blockchain-based self-sovereign identity for routing in inter-domain networks. IEEE Communications Magazine 62, 96–102. doi:10.1109/MCOM.004.2300244.
Appendix: Artifact Description/Evaluation
Summary of the experiments reported
In our experiments, we extensively explored different parameter settings (1) to investigate normal library operations as well as libraries under heavy load and (2) limitations of library systems, where they can go unstable upon the unsupervised selections of parameters. A simple way to simulate unstable system operation is to manually change the rate of user requests (), names as p_lam_per_day. Our simulation platform produces multiple plots including latency of libraries (in mins) and user data requests and robot exchanges both as a function of simulation time (in terms of days). We also plot read errors as a function of hourly time steps.
The baseline inputs to the simulator include library fill rate (percent), total number of cartridges per library, total number of robots per library, total number of drives per library, robot to drive time (secs), total annual touch rate, average object size (MB) and distribution, simulation time (months), simulation step size (secs), cartridge capacity (TB), ECC code used (k/n), number of libraries, Drive read failure probability, collocation parameter (MB), protocol used and whether robots (if more than one exists) are used in balanced fashion or not. The outputs of the simulator include total capacity of the system in simulation (PB), total number of objects touched, actual robot exchange rate, maximum, minimum and average of data access (both for the first byte or the last byte) latency (mins), user object request rate, distribution of robot movements, distributions and average of queue lengths for both DR and R queues.
Our software consists of two parts. The first part generates a csv file such as simQ.csv. The csv file is processed separately after the main body of the simulation is over by the second part. The content of csv file includes columns QID , Q_in, D_in, Q_out, D_out, Q_len and Data_out whereas each row corresponds to a event stored in one of the queues. The time step index is recorded in each one of the columns to indicate when a particular event starts and ends. Here Q_in, D_in, Q_out values correspond to checkpoints Q-in, Data-in, Q-out as mentioned in subsection 2.2.4. In addition, Q_len keeps the queue length and D_out corresponds to Data-access checkpoint.
While executing the simulator with a redundancy mechanism such as replication or erasure coding, we also need to keep track of message IDs (MID) to be able to differentiate between different copies of different fragments of the same data block. For instance 2nd copy of the the block 312 is recorded as 312.2.
In the case of RAIL-type ML simulations, we run multiple and concurrent instances of the software and record csv files with the following naming conventions simQ0.csv, simQ1.csv, simQ2.csv, . The correlations are driven between multiple files by processing them based on the message IDs and recorded time stamps.
Implementation
Talics3 simulator is implemented in Python 2.7.15. We run our experiments both on Windows and Linux operating systems (OS). For windows OS, we have used PyCharm community edition 2016.3.2. Java Runtime Environment is selected to be 1.8.0_112-release-408-b6 and the OpenJDK java virtual machine by JetBrains is supported. We have also tested the same software on Ubuntu LTS 20.4 OS. We have run both OSes on Intel i5-5300 CPU with four cores operating at 2.3GHZ each. In addition, for a proper compilation and runtime, the current version may require a Linux runtime environment and a C compiler (e.g. gcc version ).
Our software utilizes many Python packages as dependencies: beautifulsoup4 4.9.0, gspread 3.4.2, httplib2 0.17.2, kiwisolver 1.0.1, lxml 4.5.0, matplotlib 2.2.2, numpy 1.14.5, pandas 0.24.2, pip 9.0.3, python-dateutil 2.7.3, requests 2.23.0, scipy 1.2.2, setuptools 44.1.0, urllib3 1.25.8.