Morphodynamics of chloroplast network control light-avoidance response
in the non-motile dinoflagellate Pyrocystis lunula
Photosynthetic algae play a significant role in oceanic carbon capture. Their performance, however, is constantly challenged by fluctuations in environmental light conditions. Here, we show that the non-motile single-celled marine dinoflagellate Pyrocystis lunula can internally contract its chloroplast network in response to light. By exposing the cell to various physiological light conditions and applying temporal illumination sequences, we find that network morphodynamics follows simple rules, as established in a mathematical model. Our analysis of the chloroplast structure reveals that its unusual reticulated morphology constitutes properties similar to auxetic metamaterials, facilitating drastic deformations for light-avoidance, while confined by the cell wall. Our study shows how the topologically complex network of chloroplasts is crucial in supporting the dinoflagellate’s adaptation to varying light conditions, thereby facilitating essential life-sustaining processes.
Light is fundamental for life, yet excessive exposure can be detrimental for biological processes. Photosynthetic organisms have developed multiple strategies across scales to cope with fluctuations of light, from molecular adaptation responses such as Non-Photochemical Quenching (NPQ) to the biased growth towards light (phototropism) on organismal scale [1, 2, 3]. Photoadaptation in the form of increased thermal dissipation of photo-excited chlorophyll, which displays a major component of NPQ, occurs within tens of seconds to minutes [4], while plant tropism takes longer time scales of hours to days [5, 3]. Another photoadaptation mechanism, at a single-cell level, includes the motion and rearrangement of chloroplasts to optimize light absorption or to avoid photo-damage [6, 7, 8, 2, 9, 10].
Such strategies are fundamental for survival in fluctuating environments,
displaying interesting features such as computation and integration in the context of plant phototropism [11, 12, 13], and dynamical phase transitions of chloroplast motion [10].
In land plants, the collective motion of individually sensing and moving disk-shaped chloroplasts [9, 14] leads to large-scale re-arrangements inside leaf cells, aiming to optimize for light uptake while avoiding strong light.
However, a vast amount of photosynthesis happens in aquatic environments, especially the oceans
[15, 16, 17].
Some single-celled algae can actively swim away from or towards light [18, 19, 20, 21] and even less complex organisms such as cyanobacteria, like Trichodesmium [22] and Synechocystis [23, 24], can move collectively or individually as a response to light.
Non-motile photosynthetic organisms, nonetheless, have adopted different strategies by moving their chloroplasts within their cell bodies [25, 26].
Here, we study the light adaptation strategy of a non-motile marine dinoflagellate.
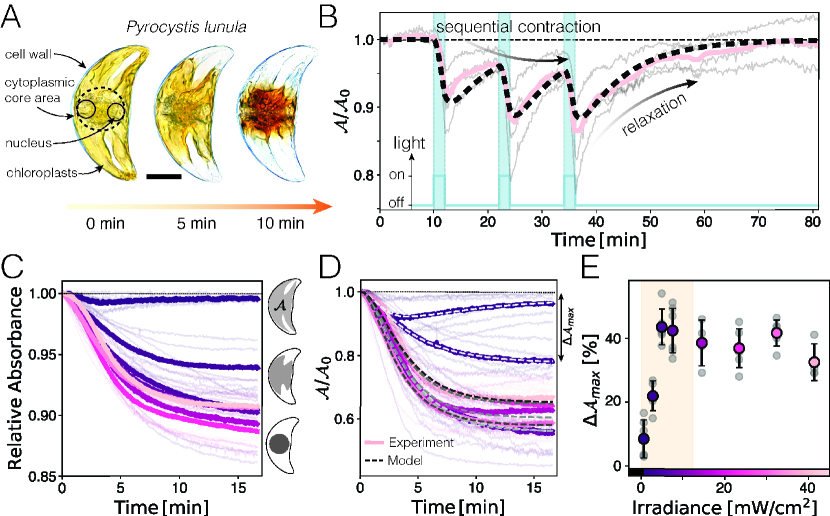
Dinoflagellates are a large and distinct group of photosynthetic and mixotrophic algae [27, 28] that, unlike most other photosynthetic organisms, underwent tertiary endosymbiosis by engulfing algae containing a secondary plastid [29, 30, 31, 32]. This process led to chloroplasts with three membranes [33]. Mostly known for their bioluminescence [34, 35, 36], the non-motile, -sized dinoflagellate Pyrocystis lunula, native to warm waters worldwide, can reorganize its internal architecture to switch from a photosynthetic day-phase to a bioluminescent night-phase. This reorganization is orchestrated by actively moving their chloroplasts and bioluminescent organelles (scintillons) towards and away from the cell center, following a circadian rhythm [37, 38, 39].
Interestingly, it has been observed that the same intracellular motion can be triggered by strong light [40], leading to a compression of the chloroplast within just a couple of minutes, without deformation of the thick cell wall [41].
This observation raises the question of how this drastic intracellular rearrangement can be coordinated under confinement and within such a short time frame.
Here, we study the dynamics of chloroplast motion as a light adaptation mechanism in P. lunula and report that it features an active reticulated chloroplast network, capable of fast morphological changes. This enables the organelle to undergo significant deformations for efficient photo-avoidance motion in response to environmental changes.
Cytoplasmic space contracts under strong light
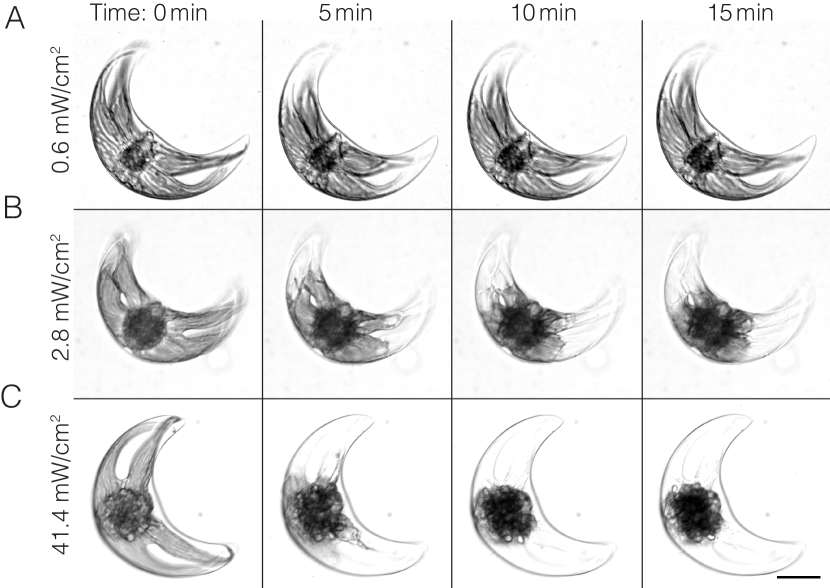
We studied the adaptation of the chloroplast area of individual Pyrocystis lunula cells to white-light exposure under physiologically relevant light conditions of its natural habitat at depth of [42] (Supplementary Text Section I). Upon white-light stimulation, chloroplasts move towards the cytoplasmic core area within approximately (Fig. 1A) [40].
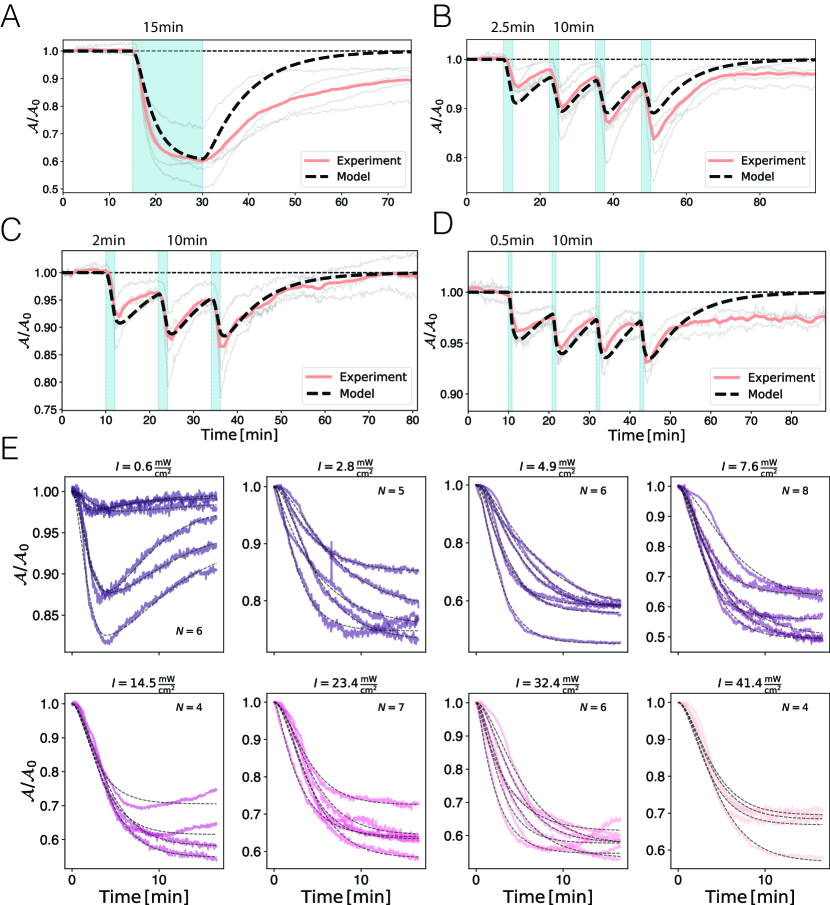
During this process, the relative absorbed light (Fig. 1C) and the projected area of the chloroplast (Fig. 1D) exhibit similar dynamics for various light irradiances ranging from to (fig. S1, Movie S1). After a short time of approximately , characterized by a positive curvature, both the projected area and the absorbed light follow an exponential decay, eventually reaching saturation at levels dependent on the light intensity. These measurements are correlated: as the chloroplast retracts, more light can pass through the cell, leading to reduced absorption of up to .
Contrary to the contraction scenario described above, exposure to dim white light () triggers a transient response wherein the chloroplast initially contracts towards the cell center but eventually expands again (Fig. 1D).
These observations share similarities with terrestrial plants’ transient photo-response at the intermediate light intensity [43, 44].
Large stimulation-irradiances, which exceed both the estimated ecologically relevant light conditions of (Supplementary Text Section I) and the culturing conditions (Materials and Methods) lead to maximal contraction of , corresponding to the size of the cytoplasmic core area (Fig. 1A,E).
Dynamical testing and mathematical model of chloroplast contraction
Alternating white- (on) and red-light (off) irradiation controls the chloroplast contraction and relaxation dynamics towards and away from the cytoplasmic core area (Fig. 1B, Movie S2,S3): the chloroplast network rapidly responds to white-light and slowly relaxes upon red-light exposure. Long-time illumination with weak red light () leads to a complete expansion of the chloroplasts over the entire cell (Fig. 1B, Time).
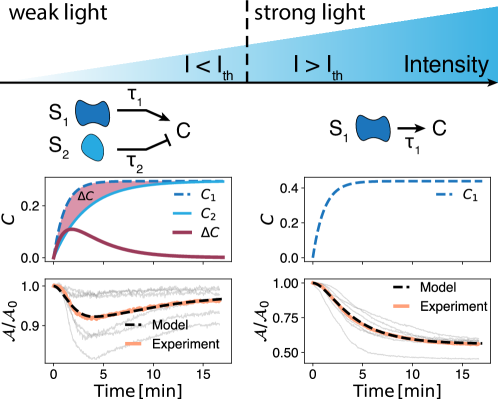
The dynamical tests verify a mathematical model (dotted lines Fig. 1B,D, 3G, 4C,D) (Materials and Methods, Supplementary Text Section II), based on two chemical species that control a light-avoidant and a light-accumulation response (contraction or expansion), respectively (fig. S2).
The model enables the extraction of two relevant chemical signaling timescales, and , along with a timescale for active contraction and expansion .
We find that the chemical signaling of a photo-avoidance response occurs at a time scale of (mean SD, ), while a photo-attractive signal leading to a transient response is noted at ().
The timescales and emerge from the dynamics of the driving mechanism, relying on actin, microtubules, and molecular motors such as myosin [39] (also see Supplementary Text Section III for inhibitory treatment), and found to be () for contraction and () for expansion of the chloroplast. Notably, our model can be interpreted as a filter for environmental stimuli (Supplementary Text Section II), effectively filtering out high-frequency noise (with short time scales) such as the light fluctuations of surface waves (Supplementary Text Section I).
Topologically complex chloroplast network allows efficient contraction
The contraction of the projected area reaches up to of the cell area, necessitating a remarkably large deformation of the cytoplasmic material. Such deformations within hard confinement, in this case, constituted by the cell wall of P. lunula [41], are subject to physical constraints. To elucidate these constraints, we draw analogies to the compression of fluids and solids: an incompressible fluid cannot “contract” uniformly towards the center under confinement, as its volume must be conserved. Similarly, an elastic solid, when compressed from one direction, will expand in orthogonal directions, a behavior characterized by a positive Poisson ratio ( for isotropic incompressible elastic materials in three dimensions). Under confinement, this property () leads to effective strain-stiffening, as the expansion into orthogonal directions is prevented and therefore internal stresses redirect.
.
However, structured metamaterials defy positive Poisson ratios by allowing non-linear deformations such as buckling or the action of rotating hinges [45, 46]. Auxetic behavior, characterized by , naturally arises in polymer networks [47], foams [48], and poro-elastic materials such as cork () [49], enabling uni- or multi-directional contraction, and thus facilitating efficient deformations even within confined spaces.
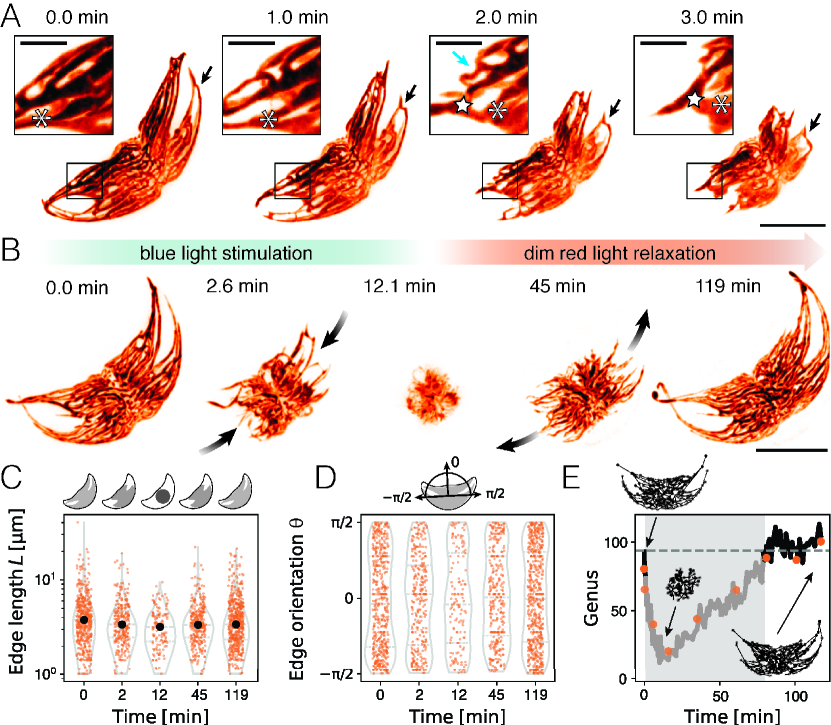
Using confocal auto-fluorescence imaging of the chloroplasts (Materials and Methods) we uncover the chloroplast reticulum (Fig. 2A). This intricate network structure shows similarities to observations made in the context of spontaneous diurnal chloroplast relocations [38, 39] and rapid changes of buoyancy in the related species Pyrocystis noctiluca [50].
Continuous blue light stimulation () of the cell, induces contraction of the chloroplast network over time.
We uncover two mechanisms which choreograph this chloroplast photo-adaptaion motion: cytoplasmic strands move towards the center while they simultaneously contract in a manner reminiscent of buckling (Fig. 2A, Movie S4-S6).
Buckling, or inward-folding, allows the structure to compact into the space between the cytoplasmic strands (), circumventing strain-stiffening typically expected from uniform bulk contractions under confinement (). Moreover, we observe a notable thickening of some strands during contraction, indicating a flow of material within the structure (Fig. 2A, Movie S4-S6).
Under dim red light, the chloroplast expands again over a longer time scale (Fig. 2B, Movie S6). Although the chloroplast network appears slightly different before and after the contraction and expansion, the main geometrical features remain unchanged: when fully spread, the network is characterized by a few very long cytoplasmic strands (Fig. 2C), which extend outwards along the cell’s long body axis (Fig. 2D).
During contraction, these distinctive features are lost as the chloroplast reticulum obtains a more spherical shape.
Remarkably, despite these morphological changes, the network topology remains largely unchanged before contraction and after expansion, suggesting a permanent connection among nodes without dynamic rewiring of the network (Fig. 2E). The apparent loss of holes, as indicated by the decline in Genus, can be attributed to the increased contact between strands, which complicates the identification of individual strands.
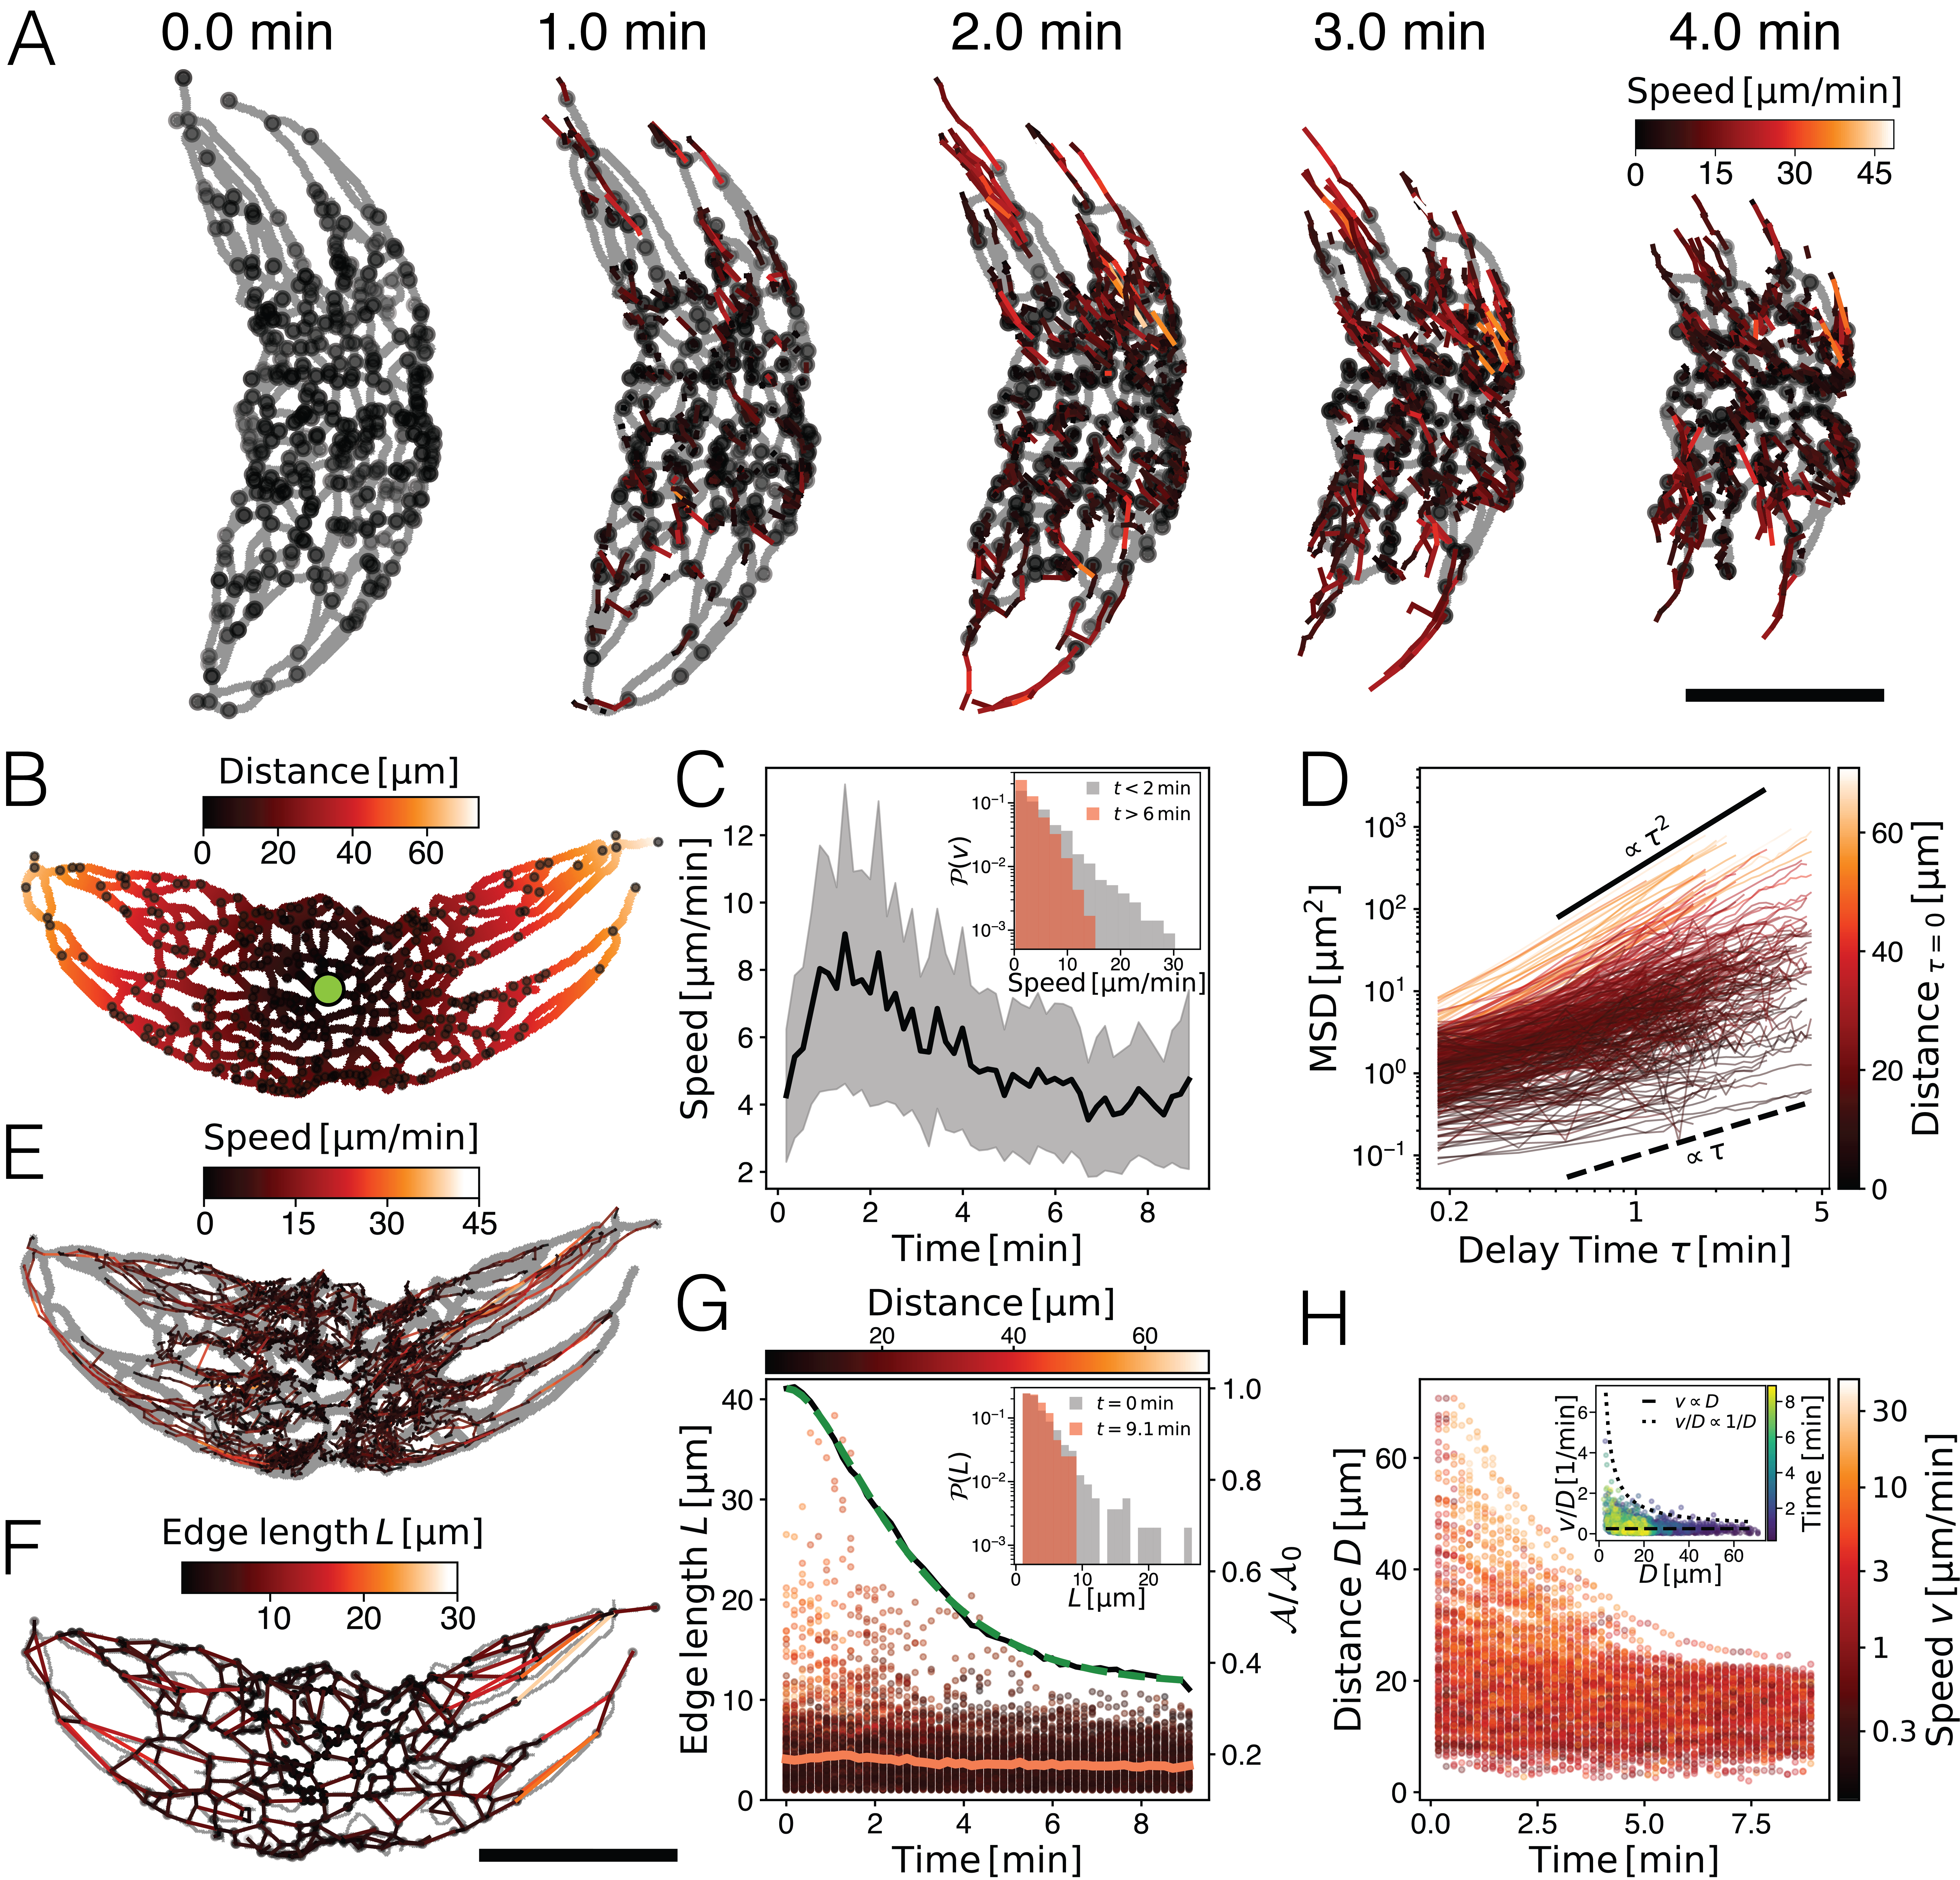
We analyze the spatiotemporal dynamics of the networks’ nodes over time (Fig. 3A,B,E, Materials and Methods, Movie S7) to quantify the
contraction process. Our findings reveal a wide distribution in node speeds, which vary over time (Fig. 3A,C). Predominantly, nodes close to the cytoplasmic core area exhibit slow, diffusive motion characterized by a time-linear mean-squared displacement (). Conversely, nodes located farther from the cell center move ballistically () (Fig. 3D).
Thus, longer strands, initially located far from the cytoplasmic core area, move rapidly towards the center (Fig. 3E,H), while reducing their length, resulting in the reduction of chloroplast’s 2D-projected area (Fig. 3G).
Interestingly, the strands follow along their initial configuration, as indicated by the overlay of trajectories on the network’s 2D projection at in figure 3A,E. This may reflect a signature of their actin- and microtubule-mediated driving mechanism [39] and a co-alignment to those networks.
Further analysis of the network, demonstrates that the speed of the nodes scales with their distance from the center, , aligning with the expected behavior from the one-dimensional contraction of an elastic material under a constant strain rate (Fig. 3H, inset). This observation confirms that the complex topology of the network enables the material to contract, dominantly, along one dimension in a manner similar to an elastic material (). These findings have been valuable in developing the mathematical model (Supplementary Text Section II).
Chloroplast contraction shows local and global responses to local stimulation
To further shine light on the sensing mechanism, we locally stimulate the cell (Materials and Methods) with a blue low-power laser (, ). Although this power level
may seem weak compared to the full-spectrum irradiance of white-light stimulation used in other experiments, it closely matches the optimal absorption peak of phototropins [51]. Phototropins, crucial photosensors for chloroplast positioning in terrestrial plants [52, 53, 9], are also present in Pyrocystis lunula [54], potentially accounting for the observed strong response.
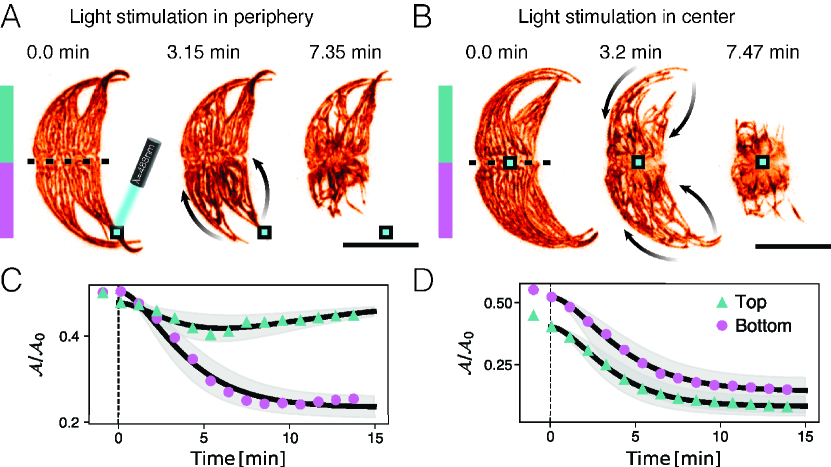
We illuminate a region at both the center and periphery of the algae, respectively (Fig. 4A,B, Movies S8-S10). Peripheral stimulation leads to a localized contraction of one side of the chloroplast network towards the cytoplasmic core area. The opposite side of the chloroplast network moves less pronounced, but within the temporal resolution limit of .
This rapid onset suggests that a fast diffusing signal triggers a long-range response across the cell of within after light-stimulation begins, implying a diffusion coefficient on the order of .
Interestingly, the chloroplast retraction on the not-stimulated region is transient or less pronounced, as observed in small light intensity stimulation (Fig. 1D, Movie S8,S9), suggesting that the transmitted signal is depleted, as expected for diffusive signaling.
Surprisingly, upon central stimulation in the cytoplasmic core area, all chloroplast strands contract towards the cell center, within similar time scales (Fig. 1B,D, Fig. 3A,G). This outcome reveals a symmetry-broken response: under peripheral stimulation, the chloroplast network contracts to move away from the light source, whereas central stimulation induces movement towards it. This pattern suggests that the chloroplast network’s contraction mechanism is inherently directed inward in response to strong light, regardless of the signal’s location.
Discussion
In our experiments, we show that the chloroplasts of Pyrocystis lunula retract towards the cell’s center under strong white or blue light conditions and expand under weak red light conditions. This bidirectional movement of chloroplasts towards and away from light, mirrors the chloroplast photo-relocation motion seen in leaves of green plants [6, 2, 9, 3], nonetheless, using a fundamentally different dynamics.
The significant light-induced retraction of chloroplasts leads to increased light transmission through the cells (Fig. 1C), suggesting that, similar to green plants, Pyrocystis lunula employs this mechanism as a means of light avoidance [6, 7, 2, 9].
Notably, under low white light conditions, we observe a transient response in the chloroplasts – initial fast contraction followed by slow expansion – suggesting a timescale-separated competition between these processes.
This shows similarities with the observed counteraction of phototropin 1 and 2-mediated chloroplast motion [43, 55].
In fact, the transcriptome of P. lunula bears various phototropin 1 and phototropin 2-like sequences and LOV domains [54], pointing towards potential similarities in light sensation. The similarity of this organism’s light response to green plants is surprising, as the origin of chloroplasts in dinoflagellates is very distinct [27, 32].
At light intensities exceeding the natural physiological conditions of dinoflagellates,
chloroplasts contract fully towards the cell center. Under such extreme conditions, the crowding of the chloroplast strands poses a mechanical limit for contraction, and consequently for this photo-avoidance mechanism.
However, within their native physiological light conditions, Pyrocystis lunula responds via light-dependent chloroplast compaction, indicating a gradual adaptation response to various light conditions.
Furthermore, we find that the relaxation phase following strong light-induced contraction occurs over a longer time scale, suggesting a different driving mechanism for the expansion of the chloroplasts.
The large-scale transport of organelles observed likely depends on the coordinated action of the actin and microtubule networks, together with molecular motors such as myosin, as has been demonstrated in the context of the diurnal intracellular reorganization between the photosynthetic phase during the day and bioluminescent phase at night [39], in line with pharmacological perturbation experiments for light-adaptation (Supplementary Text III, fig. S3) in which we confirm that actin is necessary for bi-directional chloroplast motion.
However, the exact driving mechanism of the chloroplast relocation in P. lunula remains unidentified and may differ from that of green plants, where chloroplast movement is primarily driven by the assembly of short actin (cp-actin) filaments and the transmission of polymerization forces towards the plasma membrane [9, 14, 55].
We elucidate the details of the reticulated morphology of chloroplasts and show that such a structural “design” offers mechanical advantages. Structured metamaterials, like this chloroplast morphology, facilitate buckling and other complex deformations [45, 46], enabling efficient chloroplast contraction under the confinement of the cell wall.
Pyrocystis noctiluca, another species within the Pyrocystis genus, was found to have a reticulated cytoplasm, assisting with the
vertical migration [50], showing another intricate link between the morphology of cytoplasmic space and its function in dinoflagellates.
We also showed that the dynamics of chloroplast contraction can be effectively modeled using a “visco-elastic” framework with chemically controlled stress applications.
Although our coarse-grained model does not pinpoint the precise origins of observed elasticity and viscosity – whether from passive or active cellular components – it importantly enabled us to identify adaptation time scales and compare them with the ecologically relevant fluctuations.
These time scales suggest that chloroplast motion serves as a feasible light adaptation strategy for environmental light variations persisting longer than . Indeed, such fluctuations notably exceed the duration of second-long light changes induced by waves but are in line with the motion of clouds obscuring the sun [56] and might complement NPQ.
Our experiments have also shown that chloroplast contraction is driven by local sensing, with directed relocation observed when chloroplasts are locally stimulated (Fig. 4). However, even though locally stimulated, the chloroplast network on the opposite side of the cell contract within , indicating a long-ranged signal transfer via fast diffusive signals (), such as calcium, recognized for its important roles in photosensory downstream signaling [53] and in P. lunula bioluminescence [57].
Interestingly, stimulation in the cytoplasmic core prompts chloroplasts to move towards rather than away from the center. This counter-intuitive behavior might result from the network’s topologically conserved structure and a photo movement that is inherently biased towards the cell center. This hypothesis, however, needs further investigation.
Moreover, the intricate relationship between the chloroplast and nucleus, with the latter hosting a significant portion of the chloroplast genome [58, 2], suggests that chloroplast movement towards the nucleus in the cytoplasmic core [38] could also serve a photoprotective function, shielding genetic material from intense light damage.
Our study provides the first evidence for such a mechanism in dinoflagellates, however, a comprehensive examination of the chloroplast-nucleus relationship is necessary to fully understand these dynamics.
Overall, the complex relationship between the geometry and topology of chloroplast structure and its dynamics provides a fertile ground for exploring intriguing physical dynamics with significant physiological implications, in the context of light-life interactions.
Acknowledgements
We thank Ronald Breedijk for help with confocal imaging and localized light stimulation. We thank Joachim Goedhart, Mark Hink, Yuri Z. Sinzato, Jonas Veenstra, Corentin Coulais and Friedrich Kleiner for fruitful discussions. Confocal imaging was supported by the van Leeuwenhoek Centre for Advanced Microscopy, Section Molecular Cytology, Swammerdam Institute for Life Sciences, University of Amsterdam, a EuroBioImaging-node. MJ acknowledges the ERC grant no. ”2023-StG-101117025, FluMAB”.
Author Contribution
Nico Schramma: Conceptualization (lead); Investigation (equal); Validation (equal); Writing – original draft (lead); Visualization (lead); Formal analysis (lead); Writing – review and editing (equal); Software (lead); Methodology (lead)
Gloria Casas Canales: Conceptualization (supporting); Investigation (equal); Validation (equal) ;Writing – original draft (supporting); Visualization (supporting); Writing – review and editing (equal)
Maziyar Jalaal: Conceptualization (supporting); Writing – original draft (supporting); Visualization (supporting); Writing – review and editing (equal); Methodology (supporting); Supervision (lead); Funding (lead)
Competing interests
The authors declare no competing interests.
Data and materials availability
Data is available upon request at the corresponding author.
Appendix
Materials and Methods
Cell culture
Pyrocystis lunula (Schütt) is cultured in medium in an incubator (Memmert) at and a day-night cycle with light irradiance at .
Brightfield microscopy
We perform bright-field microscopy with a Nikon TI2 E microscope. Images are acquired using a Photometrics BSI Express camera at a frame rate of . We use a PLAN Apochromat objective and simultaneously measure different positions using a motorized xy-stage totaling cells for every light intensity setting (). To allow for chloroplast expansion, imaging was performed using a red filter with a cut-on wavelength of , at light intensities of . Periodic white () and red light () stimulation was controlled through a custom script in microManager [59].
Confocal microscopy
Global simulation experiments are performed with Nikon Ti Eclipse microscope equipped with a /1.49NA or /1.3NA oil objective, a confocal spinning disk unit (Yokogawa CSU-X1) with a microlense array, and an Andor iXonEM+ 897 electron-multiplying charged-coupled device (EMCCD) camera. Chlorophyll autofluorescence is stimulated at wavelength while the emission bandpass filter () is used. By using a piezo z-stage we record z-steps (step size ) within with a excitation time. The brightfield path of the microscope was equipped with a blue filter to stimulate the cell at an intensity of .
Local stimulation
Local stimulation experiments are performed using a PLAN APO IR objective on a Nikon TI body with Nikon A1 resonant scanner. Imaging is performed using a laser line and emission filter at . A whole z-stack consists of - steps of size. The pinhole diameter is fixed to Airy disk diameters. Local stimulation is performed by applying a laser at low irradiance in a small scanning region of . One z-stack takes between and and the stimulation time is for center-stimuli or for peripheral stimuli.
Image processing
Image analysis was performed in Fiji [60] and Python using Napari [61] and scikit-image [62]. In the following paragraphs we will outline the different image processing steps for the different data we acquired.
Measuring chloroplast area from brightfield data
We customized a Fiji macro, which measures brightfield intensity in a hand-annotated region of interest (ROI) for sequential stimulation experiments, or generated ROI for constant illumination experiments. The ROI is generated by Gaussian smoothing of the first frame with a kernel and subsequent thresholding using a triangle filter. Morphological closure with a -diameter disk-shaped mask helps filling holes within the mask. To measure the area we calculate a the mean value of the background, subtract it by one standard deviation and employ it as a threshold value to discriminate the chloroplast material from the background light transmitted through the organism.
Analyzing 3D confocal data
We segment and skeletonize 4d stacks (x,y,z,t) by using a script developed within Napari. The following steps are performed for all time steps. First, we estimate the loss of light intensity deeper within the sample by fitting the Beer-Lambert law and correcting the z-stack accordingly. Next, we blur the x-y plane with a -wide Gaussian and subsequently use a top-hat filter with a kernel. Then, we use the triangle method to threshold and perform binary closing with a kernel. We label the obtained mask with a connected-component method and reject small labels . Three-dimensional graph analysis was performed after skeletonizing the label image [63] and generating a NetworkX graph [64]. Some closely located nodes of the graph are merging over time, hence we coarse-grain nodes that are less than away from each other by deleting them and setting one node in the middle between them. Similarly, we reject end-nodes that have a single edge less than long. The nodes of the graph represent the junctions of the chloroplast reticulum and are tracked using a nearest-velocity tracker in trackpy [65] with a search window and -time step memory (), as well as an adaptive search window to down to of the initial search window size, to enhance the trajectory matching in a dense environment. Trajectories with less than timesteps, corresponding to about , are rejected. We calculate velocities using a Savitzky-Golay Filter using a window to fit 2nd-order polynomials and take a smooth derivative. The mean-squared displacement (MSD) of individual trajectories is calculated by a time average up to a maximal displacement of half the trajectories length (). Features such as Betti numbers and edge lengths are calculated on the graph. The Euler characteristics are calculated from the mask using region properties of scikit-image [62].
Supplementary Text I: Ecology and Light fluctuations
Here we briefly discuss the typical light intensities and fluctuations experienced in the natural habitat of Pyrocystis lunula. Surface waves typically induce light fluctuations at frequencies of [56], while clouds can cause more pronounced changes in light intensity over the course of minutes [66]. Pyrocystis spp. are known to live in the lower eutrophic zone at depths of [42] and undergo strong diurnal vertical migration [50]. The growth of P. lunula reaches full saturation under low light conditions found at approximately depth, equivalent to about [67]. These natural conditions therefore correspond to the regions in which P. lunula adapts its chloroplast extension in response to varying light intensities (Fig. 1D).
Supplementary Text II: Active Kelvin-Voigt model
To mathematically describe light-induced chloroplast contraction and expansion, we employ a one-dimensional visco-elastic model. This choice is grounded on the uni-axial contraction of the chloroplast network, with negligible expansion or contraction occurring in the perpendicular directions (Fig. 2A,B,D, Movie S4-S6). We assume, that stresses are not externally imposed but applied along the chloroplast network itself. This assumption is supported by the observed structural similarity between actin-network and chloroplast structures [39]. However, assuming constant rheological properties along the network and a linear force transmission, the picture of global stress application or local stresses is equivalent. Viscous dissipation dampens the motion. Here, we assume this dissipation results either from a rheological feature (visco-elasticity) of the contracting network itself, the motion of the chloroplast network through the surrounding viscous cytoplasm, or from a combination of both mechanisms. The precise origin of this feature remains unspecified in our model. Experimental measurements indicate that the fluctuations in chloroplast position are small compared to the global motion (Fig. 1B,D, Movie S1-S3). This allows us to neglect noise in this model. Thus, the stress-induced motion can be formalized as a visco-elastic Kelvin-Voigt solid:
| (1) |
Here is a displacement from an equilibrium position and is an equilibrium position of the spring with spring constant forced with . is a visco-elastic relaxation-timescale, where is a viscous damping factor. If light is sensed, the contractile force is gradually increased by a chemical concentration : hence the equilibrium position changes over time, until it reaches an intensity-dependent set-point. We model such a first-order reaction by a process with a timescale (fig. S2):
| (2) |
with such that . Moreover, we allow the relaxation timescale to take two different values and , depending on whether light is “on” () or “off” ()333Here “on” corresponds to blue or white light stimulation and “off” to dim red light in the experiments.. Therefore, contraction and expansion will follow different timescales, which is likely a direct consequence of different rates of the underlying molecular contractile/extensile mechanism. As we measure from the spread-out position we define: and incorporate in for convenience, without loss of generality. These equations can be solved analytically for constant light irradiation starting at (as in our experiments Fig. 1):
| (3) |
For simplicity we denote .
Transient response at low light
At low light intensities, we observe an adaptive response (Fig. 1D). Similarly to models of light adaptation in green algae [19], we postulate that below a threshold intensity when , a second light sensor sends an opposing signal (fig. S2), which controls the chloroplast spreading (accumulation response). The second sensor is modeled as
| (4) |
Here the driving force is defined by the difference: . For times greater than the direction of chloroplast motion reverses (expansion) and thus, as the time-scale of this outward-motion was found to be different, equation (5) will then be used with . The analytical solution for the case of reads:
| (5) |
Dynamic filter-properties of chloroplast response
The main driving factor of the observed behavior is the optimization of photosynthesis, while minimizing photodamage. We interpret such a response as a result of the cells signal-processing mechanism upon light sensing. Assuming there is a cost to such a response, the relevant light fluctuations have to be filtered out from the irrelevant ones. Consequently, our model can be viewed from the perspective of linear filters (if ). We can easily see that the super-threshold dynamic equations (1) and (4) will restore a harmonic oscillator by inserting equation (1) into (2) with (simplifying ):
| (6) |
For any combination of the and this system is over-damped as 444. If our light-input is Fourier-transformable, i.e. exists, we can find a linear response relationship , with a susceptibility , showing that the system essentially behaves as a long-pass filter, cutting off the high frequencies from noisy environmental fluctuations and adapting towards slow trends of light at time scales .
Model fitting
We fit the models to every experiment and report the mean fit parameter and standard deviations. The score consistently exceeds , indicating a reasonably good fit, despite the low complexity of the model and the noisy data. The fitting scheme used is a least-squares fit. The fitting parameters remained notably consistent for all different experiments and physiological conditions::
| Figure | Irradiance | |||||
|---|---|---|---|---|---|---|
| Fig. 1B, S4A-D | 1.1 | - | 3.3 | 9 | 0.33 | |
| Fig. 1D | ||||||
| Fig. 1D | - | - | ||||
| Fig. 1D | - | - | ||||
| Fig. 1D | - | - | ||||
| Fig. 1D | - | - | ||||
| Fig. 1D | - | - | ||||
| Fig. 1D | - | - | ||||
| Fig. 1D | - | - | ||||
| Fig. 3G | - | - | ||||
| Fig. 4C top | - | |||||
| Fig. 4C bottom | - | - | ||||
| Fig. 4D top | - | - | ||||
| Fig. 4D bottom | - | - |
Supplementary Text III: Pharmacological treatment
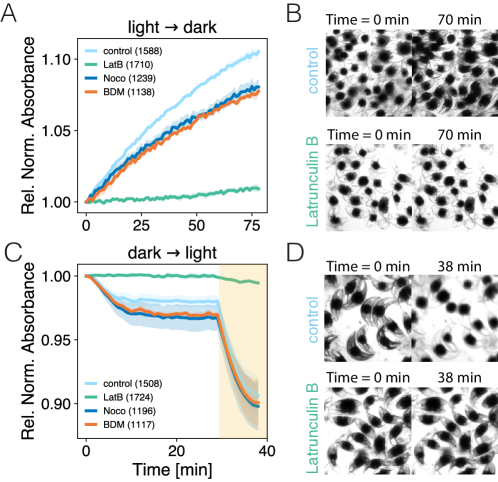
Cells were treated with Nocodazole (microtubule depolimerization), Latrunculin B (actin depolimeization) or BDM (myosin inhibition), all prepared in aqueous f/2 solution. Prior to treatment, cells were adapted to either darkness or bright light conditions (). Following the treatments, the cells were incubated for another in darkness, or bright light conditions ().
Microscopy is performed simultaneously for all treatment groups: first dark- and light-adapted cells are subjected to darkness for . This was followed by exposure to intermediate light levels, with a subsequent increase in light intensity after .
To measure the effect, we count the cells and measure the overall increase or decrease of the average pixel values with respect to the first time point. The data is normalized for the number of cells in the field of view, to account for size effects.
The unperturbed control-group of light adapted cells () expands at dim light conditions within (fig. S3A,B). BDM () and Nocodazole () treated cells do not change and expand as efficiently as the control group. Latrunculin B-treated cells () do not expand their chloroplasts, as confirmed by the vanishing slope of the relative normalized absorbance (fig. S3A) and by visual inspection (fig. S3B).
For the group of dark adapted cells, which are subjected to intermediate light intensities () and strong light intensities (), we find that all groups but the Latrunculin-B treated cells () adapt to the strong light stimulus, as confirmed by the decline in absorbance and visual inspection (fig. S3C,D). Our pharmacological inhibitions clearly suggests that the actin network is used both in chloroplast contraction and expansion. While the role of myosin and microtubules is not fully clear and might be concentration dependent, as suggested in studies on the diurnal chloroplast motion [39].
SI Movies
Movie S1: Chloroplast contraction of P. lunula at different light intensities: (left) , (center) and (right) , corresponding to S1A-C, respectively.
Movie S2: Dynamic light-controlled chloroplast motion with red-light imaging between -lasting white-light stimulation at .
Movie S3: Dynamic light-controlled chloroplast motion with red-light imaging between -lasting white-light stimulation at .
Movie S4: Time series for global stimulation with blue light (. Imaging of chlorophyll auto-fluorescence (red look-up table (LUT)).
Movie S5: Time series for a second global stimulation with blue light (. Imaging of chlorophyll auto-fluorescence (red look-up table (LUT)). Sequential buckling of cytoplasmic strands clearly visible.
Movie S6: Time series for a global stimulation with blue light (. Imaging of chlorophyll auto-fluorescence (red look-up table (LUT)). After blue light is switched off and ambient red light is placed. Chloroplasts spread out within a larger time scale. Note the adjusted time step.
Movie S7: Network analysis of chloroplast autofluorescence signal. Nodes (dots) between the edges of the skeletonized image are tracked over time. Dataset corresponds to Fig. 3 and Movie S4.
Movie S8: Peripheral stimulation -laser (white box). Chloroplast auto fluorescence (red LUT).
Movie S9: Sequential peripheral stimulation -laser (white box). Chloroplast auto fluorescence (red LUT). Chloroplast shrinks first on upper stimulation side, while simultaneously the lower side reacts. Then a second stimulus is applied to the lower side.
Movie S10: Central stimulation with -laser (white box). Chloroplast auto fluorescence (red LUT).
SI Figures
References
- [1] Alexander V. Ruban “Evolution under the sun: Optimizing light harvesting in photosynthesis” In Journal of Experimental Botany 66.1, 2015, pp. 7–23 DOI: 10.1093/jxb/eru400
- [2] Zhirong Li, Setsuko Wakao, Beat B. Fischer and Krishna K. Niyogi “Sensing and responding to excess light” In Annual Review of Plant Biology 60, 2009, pp. 239–260 DOI: 10.1146/annurev.arplant.58.032806.103844
- [3] Emmanuel Liscum et al. “Phototropism: Growing towards an understanding of plant movement” In Plant Cell 26.1, 2014, pp. 38–55 DOI: 10.1105/tpc.113.119727
- [4] G.H. Krause and E. Weis “Chlorophyll fluorescence and photosynthesis” In Annual Review of Plant Physiology and Plant Molecular Biology 42, 1991, pp. 313–349 DOI: 10.1002/9780470122563.ch3
- [5] Charles Darwin and Francis Darwin “The power of movement in plants” John Murray, 1880
- [6] Gustav Senn “Die Gestalts- und Lageveränderung der Pflanzen-Chromatophoren.” In Verlag von Wilhelm Engelmann Wilhelm Engelmann, Leipzig, 1908
- [7] Masahiro Kasahara et al. “Chloroplast avoidance movement reduces photodamage in plants” In Nature 420.6917, 2002, pp. 829–832 DOI: 10.1038/nature01213
- [8] Youn Il Park, Wah Soon Chow and Jan M. Andersen “Chloroplast Movement in the Shade Plant Tradescantia albiflora Helps Protect Photosystem II against Light Stress” In Plant Physiology 111.3, 1996, pp. 867–875 DOI: 10.1104/pp.111.3.867
- [9] Masamitsu Wada “Chloroplast movement” In Plant Science 210 Elsevier Ireland Ltd, 2013, pp. 177–182 DOI: 10.1016/j.plantsci.2013.05.016
- [10] Nico Schramma, Cintia Perugachi Israëls and Maziyar Jalaal “Chloroplasts in plant cells show active glassy behavior under low light conditions” In Proceedings of the National Academy of Sciences 120.3, 2023, pp. 1–9 DOI: 10.1073/pnas.2216497120/-/DCSupplemental.Published
- [11] Yasmine Meroz, Renaud Bastien and L. Mahadevan “Spatio-temporal integration in plant tropisms” In Journal of the Royal Society Interface 16.154, 2019 DOI: 10.1098/rsif.2019.0038
- [12] Derek E. Moulton, Hadrien Oliveri and Alain Goriely “Multiscale integration of environmental stimuli in plant tropism produces complex behaviors” In Proceedings of the National Academy of Sciences of the United States of America 117.51, 2020, pp. 32226–32237 DOI: 10.1073/pnas.2016025117
- [13] Mathieu Rivière and Yasmine Meroz “Plants sum and subtract stimuli over different timescales” In Proceedings of the National Academy of Sciences of the United States of America 120.42, 2023 DOI: 10.1073/pnas.2306655120
- [14] Masamitsu Wada and Sam Geun Kong “Actin-mediated movement of chloroplasts” In Journal of Cell Science 131.2, 2018 DOI: 10.1242/jcs.210310
- [15] Christopher B. Field, Michael J. Behrenfeld, James T. Randerson and Paul Falkowski “Primary production of the biosphere: Integrating terrestrial and oceanic components” In Science 281.5374, 1998, pp. 237–240 DOI: 10.1126/science.281.5374.237
- [16] Michael J. Behrenfeld “Climate-mediated dance of the plankton” In Nature Climate Change 4.10, 2014, pp. 880–887 DOI: 10.1038/nclimate2349
- [17] Ricardo Cavicchioli et al. “Scientists’ warning to humanity: microorganisms and climate change” In Nature Reviews Microbiology 17.9 Springer US, 2019, pp. 569–586 DOI: 10.1038/s41579-019-0222-5
- [18] Gáspár Jékely “Evolution of phototaxis” In Philosophical Transactions of the Royal Society B: Biological Sciences 364.1531, 2009, pp. 2795–2808 DOI: 10.1098/rstb.2009.0072
- [19] Knut Drescher, Raymond E Goldstein and Idan Tuval “Fidelity of adaptive phototaxis”, 2010 DOI: 10.1073/pnas.1000901107
- [20] Di Jin et al. “Diurnal Variations in the Motility of Populations of Biflagellate Microalgae” In Biophysical Journal 119.10 Biophysical Society, 2020, pp. 2055–2062 DOI: 10.1016/j.bpj.2020.10.006
- [21] Hélène De Maleprade, Frédéric Moisy, Takuji Ishikawa and Raymond E Goldstein “Motility and phototaxis of Gonium, the simplest differentiated colonial alga” In Physical Review E 101.2, 2020 DOI: 10.1103/PhysRevE.101.022416
- [22] Ulrike Pfreundt et al. “Controlled motility in the cyanobacterium Trichodesmium regulates aggregate architecture” In Science 380.6647, 2023, pp. 830–835 DOI: 10.1126/science.adf2753
- [23] Nils Schuergers et al. “Cyanobacteria use micro-optics to sense light direction” In eLife 5 eLife Sciences Publications, Ltd, 2016, pp. e12620 DOI: 10.7554/eLife.12620
- [24] Devaki Bhaya “Light matters: Phototaxis and signal transduction in unicellular cyanobacteria” In Molecular Microbiology 53.3, 2004, pp. 745–754 DOI: 10.1111/j.1365-2958.2004.04160.x
- [25] Wolfgang Haupt “Light-mediated movement of chloroplasts” In Ann. Rev. Plant Physiol. 33, 1982, pp. 205–233 URL: https://doi.org/10.1146/annurev.pp.33.060182.001225
- [26] Richard E Williamson “Organelle movements” In Annual Review of Plant Physiology and Plant Molecular Biology 44.1, 1993, pp. 181–202 DOI: 10.1146/annurev.pp.44.060193.001145
- [27] Senjie Lin “Genomic understanding of dinoflagellates” In Research in Microbiology 162.6 Elsevier Masson SAS, 2011, pp. 551–569 DOI: 10.1016/j.resmic.2011.04.006
- [28] “Dinoflagellates alter their carbon and nutrient metabolic strategies across environmental gradients in the central Pacific Ocean” In Nature Microbiology 6.2 Springer US, 2021, pp. 173–186 DOI: 10.1038/s41564-020-00814-7
- [29] Lynn Sagan “On the origin of mitosing cells” In Journal of Theoretical Biology 14.3, 1967, pp. 225–274 DOI: 10.1016/0022-5193(67)90079-3
- [30] Michael W. Gray “The Endosymbiont Hypothesis Revisited” In International Review of Cytology 141.C, 1992, pp. 233–357 DOI: 10.1016/S0074-7696(08)62068-9
- [31] Michael W. Gray “Lynn Margulis and the endosymbiont hypothesis: 50 years later” In Molecular Biology of the Cell 28.10, 2017, pp. 1285–1287 DOI: 10.1091/mbc.E16-07-0509
- [32] Debashish Bhattacharya, Hwan Su Yoon and Jeremiah D. Hackett “Photosynthetic eukaryotes unite: Endosymbiosis connects the dots” In BioEssays 26.1, 2004, pp. 50–60 DOI: 10.1002/bies.10376
- [33] Naomi M. Fast, Jessica C. Kissinger, David S. Roos and Patrick J. Keeling “Nuclear-encoded, plastid-targeted genes suggest a single common origin for apicomplexan and dinoflagellate plastids” In Molecular Biology and Evolution 18.3, 2001, pp. 418–426 DOI: 10.1093/oxfordjournals.molbev.a003818
- [34] W.H. Biggley, E. Swift, R. J. Buchanan and H.H. Seliger “Stimulable and Spontaneous Bioluminescence in the Marine Dinoflagellates , Pyrodinium and Pyrocystis lunula” In The Journal of general physiology 54, 1969, pp. 96–122 DOI: 10.1085/jgp.54.1.96
- [35] Benoit Tesson and Michael I. Latz “Mechanosensitivity of a Rapid Bioluminescence Reporter System Assessed by Atomic Force Microscopy” In Biophysical Journal 108.6, 2015, pp. 1341–1351 DOI: https://doi.org/10.1016/j.bpj.2015.02.009
- [36] Maziyar Jalaal et al. “Stress-Induced Dinoflagellate Bioluminescence at the Single Cell Level” In Phys. Rev. Lett. 125 American Physical Society, 2020, pp. 028102 DOI: 10.1103/PhysRevLett.125.028102
- [37] F. Töpperwien and R. Hardeland “Free‐running circadian rhythm of plastid movements in individual cells of pyrocystis lunula (dinophyta) ” In Journal of Interdisciplinary Cycle Research 11.4, 1980, pp. 325–329 DOI: 10.1080/09291018009359717
- [38] Kyung Suk Seo and Lawrence Fritz “Cell ultrastructural changes correlate with circadian rhythms in Pyrocystis lunula (Pyrrophyta)” In Journal of Phycology 36.2, 2000, pp. 351–358 DOI: 10.1046/j.1529-8817.2000.99196.x
- [39] Kirsten Heimann, Paul L. Klerks and Karl H. Hasenstein “Involvement of actin and microtubules in regulation of bioluminescence and translocation of chloroplasts in the dinoflagellate Pyrocystis lunula” In Botanica Marina 52.2, 2009, pp. 170–177 DOI: 10.1515/BOT.2009.010
- [40] Elijah Swift and W. Rowland Taylor “Bioluminescence and chloroplast movement in the dinoflagellate Pyrocystis lunula” In Journal of Phycology 3.2, 1967, pp. 77–81 DOI: 10.1111/j.1529-8817.1967.tb04634.x
- [41] Elijah Swift and Charles C. Remsen “The cell wall of Pyrocystis SPP (Dinococcales)” In Journal of Phycology 6.1, 1970, pp. 79–86 DOI: https://doi.org/10.1111/j.1529-8817.1970.tb02361.x
- [42] Mahn Bhovichitra and Elijah Swift “Light and dark uptake of nitrate and ammonium by large oceanic dinoflagellates: Pyrocystis noctiluca, Pyrocystis fusiformis, and Dissodinium lunula” In Limnology and Oceanography 22.1, 1977, pp. 73–83 DOI: 10.4319/lo.1977.22.1.0073
- [43] Darron R. Luesse, Stacy L. Deblasio and Roger P. Hangarter “Integration of phot1, phot2, and PhyB signalling in light-induced chloroplast movements” In Journal of Experimental Botany 61.15, 2010, pp. 4387–4397 DOI: 10.1093/jxb/erq242
- [44] Justyna Łabuz, Olga Sztatelman and Paweł Hermanowicz “Molecular insights into the phototropin control of chloroplast movements” In Journal of Experimental Botany 73.18, 2022, pp. 6034–6051 DOI: 10.1093/jxb/erac271
- [45] Bastiaan Florijn, Corentin Coulais and Martin Van Hecke “Programmable mechanical metamaterials” In Physical Review Letters 113.17, 2014, pp. 1–5 DOI: 10.1103/PhysRevLett.113.175503
- [46] Katia Bertoldi, Vincenzo Vitelli, Johan Christensen and Martin Van Hecke “Flexible mechanical metamaterials” In Nature Reviews Materials 2, 2017 DOI: 10.1038/natrevmats.2017.66
- [47] S. Domaschke, A. Morel, G. Fortunato and A. E. Ehret “Random auxetics from buckling fibre networks” In Nature Communications 10.1 Springer US, 2019, pp. 1–8 DOI: 10.1038/s41467-019-12757-7
- [48] Roderic Lakes “Foam Structures with a Negative Poisson’s Ratio” In Science 235.4792, 1987, pp. 1038–1040 DOI: 10.1126/science.235.4792.1038
- [49] M.A. Fortes and M. Teresa Nogueira “The poison effect in cork” In Materials Science and Engineering: A 122.2, 1989, pp. 227–232 DOI: https://doi.org/10.1016/0921-5093(89)90634-5
- [50] Adam G. Larson, Rahul Chajwa, Hongquan Li and Manu Prakash “Inflation induced motility for long-distance vertical migration” In bioRxiv Cold Spring Harbor Laboratory, 2023 DOI: 10.1101/2022.08.19.504465
- [51] Winslow R. Briggs and John M. Christie “Phototropins 1 and 2: Versatile plant blue-light receptors” In Trends in Plant Science 7.5, 2002, pp. 204–210 DOI: 10.1016/S1360-1385(02)02245-8
- [52] Noriyuki Suetsugu and Masamitsu Wada “Chloroplast photorelocation movement mediated by phototropin family proteins in green plants” In Biological Chemistry 388.9, 2007, pp. 927–935 DOI: 10.1515/BC.2007.118
- [53] Akiko Harada and Ken-ichiro Shimazaki “Phototropins and Blue Light-dependent Calcium Signaling in Higher Plants†” In Photochemistry and Photobiology 83.1, 2007, pp. 102–111 DOI: 10.1562/2006-03-08-ir-837
- [54] “De novo transcriptome assembly data of the marine bioluminescent dinoflagellate Pyrocystis lunula” In Data in Brief 37 Elsevier Inc., 2021, pp. 107254 DOI: 10.1016/j.dib.2021.107254
- [55] Agnieszka Katarzyna Banaś et al. “Blue light signalling in chloroplast movements” In Journal of Experimental Botany 63.4, 2012, pp. 1559–1574 DOI: 10.1093/jxb/err429
- [56] Malgorzata Stramska and Tommy D. Dickey “Short-term variability of the underwater light field in the oligotrophic ocean in response to surface waves and clouds” In Deep-Sea Research Part I: Oceanographic Research Papers 45.9, 1998, pp. 1393–1410 DOI: 10.1016/S0967-0637(98)00020-X
- [57] Kelly Jin et al. “Pharmacological investigation of the bioluminescence signaling pathway of the dinoflagellate Lingulodinium polyedrum: Evidence for the role of stretch-activated ion channels” In Journal of Phycology 49.4, 2013, pp. 733–745 DOI: 10.1111/jpy.12084
- [58] Marci Surpin, Robert M. Larkin and Joanne Chory “Signal transduction between the chloroplast and the nucleus” In Plant Cell 14.SUPPL., 2002, pp. 327–338 DOI: 10.1105/tpc.010446
- [59] Arthur D Edelstein et al. “Advanced methods of microscope control using Manager software” In Journal of biological methods 1.2 NIH Public Access, 2014
- [60] Johannes Schindelin et al. “Fiji: an open-source platform for biological-image analysis” In Nature Methods 9.7, 2012, pp. 676–682 DOI: 10.1038/nmeth.2019
- [61] Jannis Ahlers et al. “napari: a multi-dimensional image viewer for Python” Zenodo, 2023 DOI: 10.5281/zenodo.8115575
- [62] Stéfan Walt et al. “scikit-image: image processing in Python” In PeerJ 2, 2014, pp. e453 DOI: 10.7717/peerj.453
- [63] Ta-Chih Lee, Rangasami L Kashyap and Chong-Nam Chu “Building skeleton models via 3-D medial surface axis thinning algorithms” In CVGIP: Graphical Models and Image Processing 56.6 Elsevier, 1994, pp. 462–478
- [64] Aric Hagberg, Pieter J. Swart and Daniel A. Schult “Exploring network structure, dynamics, and function using NetworkX”, 2008 URL: https://www.osti.gov/biblio/960616
- [65] Daniel B. Allan et al. “soft-matter/trackpy: Trackpy v0.5.0” Zenodo, 2021 DOI: 10.5281/zenodo.4682814
- [66] Miroslaw Darecki, Dariusz Stramski and MacIej Sokólski “Measurements of high-frequency light fluctuations induced by sea surface waves with an Underwater Porcupine Radiometer System” In Journal of Geophysical Research: Oceans 116.11, 2011, pp. 1–16 DOI: 10.1029/2011JC007338
- [67] Elijah Swift and Valerie Meunier “Effects of light intensity on division rate, stimulable bioluminescence and cell size of the oceanic dinoflagellates Dissodinium lunula, Pyrocystis fusiformis and P. noctiluca” In Journal of Phycology 12.1, 1976, pp. 14 –22 DOI: 10.1111/j.1529-8817.1976.tb02819.x