RepEval: Effective Text Evaluation with LLM Representation
Abstract
Automatic evaluation metrics for generated texts play an important role in the NLG field, especially with the rapid growth of LLMs. However, existing metrics are often limited to specific scenarios, making it challenging to meet the evaluation requirements of expanding LLM applications. Therefore, there is a demand for new, flexible, and effective metrics. In this study, we introduce RepEval, the first metric leveraging the projection of LLM representations for evaluation. RepEval requires minimal sample pairs for training, and through simple prompt modifications, it can easily transition to various tasks. Results on ten datasets from three tasks demonstrate the high effectiveness of our method, which exhibits stronger correlations with human judgments compared to previous metrics, even outperforming GPT-4. Our work underscores the richness of information regarding text quality embedded within LLM representations, offering insights for the development of new metrics.
\ul
RepEval: Effective Text Evaluation with LLM Representation
Shuqian Sheng1, Yi Xu1, Tianhang Zhang1, Zanwei Shen1, Luoyi Fu1††thanks: * Luoyi Fu is the corresponding author., Jiaxin Ding1, Lei Zhou1, Xinbing Wang1, Chenghu Zhou2 1Shanghai Jiao Tong University, Shanghai, China 2IGSNRR, Chinese Academy of Sciences, Beijing, China {susisheng, yixu98, zhangtianhang, yiluofu}@sjtu.edu.cn
1 Introduction
Automatic evaluation metrics play an important role in the assessment of generated text. However, with the rapid development of Large Language Models (LLM), application scenarios of Natural Language Generation (NLG) tasks have expanded rapidly, introducing new challenges to the evaluation task. Consequently, Previous metrics struggle to meet evolving evaluation requirements. The most commonly used metrics are reference-based, necessitating human-written reference texts as input Papineni et al. (2002); Zhang et al. (2019); Banerjee and Lavie (2005), and requiring great human effort in reference creation. Reference-free metrics are proposed as a supplementary solution but are largely confined to specific application scenarios or evaluation criteria, e.g. consistency in summarization, hindering their effective extension to new tasks Ke et al. (2022); Zhong et al. (2022); Fu et al. (2023).
Applying LLM to evaluation tasks is an emerging trend in developing metrics, utilizing a zero-shot method to generate evaluation results Chiang and Lee ; Gao et al. (2023). However, employing LLM with more parameters is costly, while the outputs are often unsatisfactory Shen et al. (2023). Fortunately, even when models struggle to generate appropriate responses, valuable information can still be obtained from LLM’s representations with linear models Zou et al. (2023). This implies that we can adopt models with fewer parameters, avoiding the excessive consumption of computational resources for better performance. The above discovery leads us to wonder: Do representations of LLM also encapsulate information relevant to text quality? How can we effectively extract and apply this information to evaluation tasks?
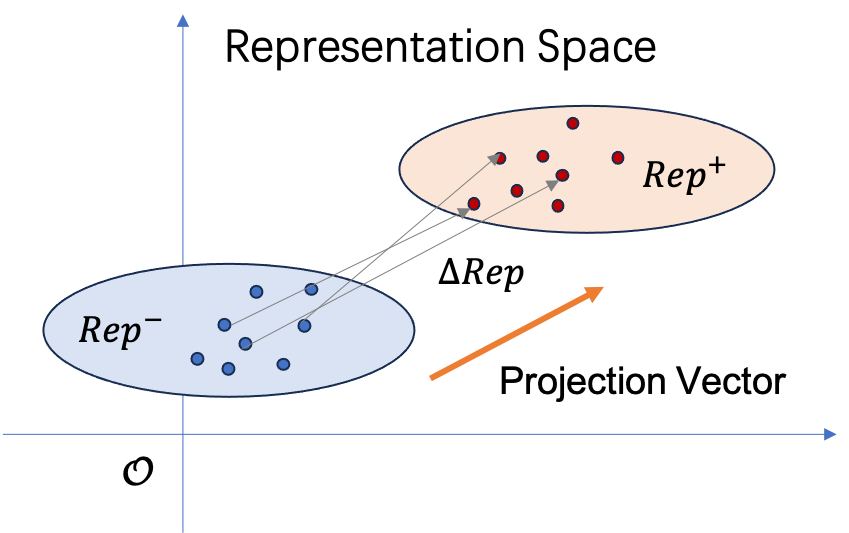
In this study, we introduce RepEval, a metric utilizing the projection of LLM representation(Rep) for evaluation. Our intuition is that Reps of high-quality and low-quality text exhibit distinct distributions. We validate that, in vector space, their projection in a specific direction characterizes the degree of variation in textual properties, as depicted in Figure 1. Experiments on three criteria with ten datasets from three tasks show that our method has better correlations with human judgments than previous metrics, which is flexible and easy to extend to other tasks or criteria. In summary, the key contributions of this work are:
-
•
We introduced the evaluation metric RepEval, surpassing previous metrics on nearly all tasks, even outperforming GPT-4.
-
•
RepEval is easily adaptable to new evaluation scenarios and requires only a few samples for training.
-
•
RepEval offers insights for the introduction of new metrics, demonstrating that LLM representations contain valuable information about text quality.
2 Preliminary
2.1 Standard Evaluation
Denote the text to be evaluated as , the source text used to generate as , and the reference as . For instance, in the summarization task, is the original article, is the summary generated by a language model, and is the reference answer written by human experts.
Consider an automatic metric NLG evaluation, which we denote as , the evaluation result of is generally in the form of a score, which can be described as Equation 1.
| (1) |
Here, and are optional inputs for metric . Metrics can be classified into two types based on whether is required for the evaluation: Ref-based and Ref-free. All Ref-free baselines used in this study require as input, except for UniEval in fluency evaluation. RepEval and LLM-based metrics require as input only, except for consistency, which also needs as inputs.
2.2 Meta-Evaluation
The most common standard to measure the effectiveness of metric is the correlation between human judgments and scores generated by . The calculation is shown in 2.
| (2) |
where is the metric score of the i-th sample in a certain dataset, is the relative human judgment, and is the correlation function. In this study, we use Spearman Correlation Spearman (1987).
3 Methodology
3.1 Collecting Representation
As defined in Section 2.1, to collect the representation , we can simply apply as input. However, this is agnostic to the evaluation scenarios, and constructing task-related prompt templates will help improve the performance.
In the evaluation of fluency and coherence, we apply the following prompt template.
Here, the "{criterion}" could be fluent or coherent, while "{hyp}" is filled by to be evaluated. We also add a control group without the prompt template, using only as inputs.
On evaluating consistency, as we need to measure the consistency between and , both and should be included in the inputs. Therefore, we use the following template.
Suppose we employ the LLM with layers to transform the prompt into a high-dimensional embedding, whose hidden state dimension is . By inputting into LLM, we can obtain representation vectors in the shape of .
The next challenge is the selection of token positions and layer positions. Since we are using a decoder-only model, we only consider the few tokens Zou et al. (2023). During training, we test the performance of different tokens across all layers and select the setting with the best performance, i.e. with the highest human correlations, on the validation set, and apply it to the test set.
3.2 Projection
Denote the representations of good text and bad text as and , respectively. In the experiment, we categorize the quality of texts based on the ratings given by human evaluators. For each pair of , their difference satisfies . Suppose that we have collected pairs of text pairs, and the relevant s form a matrix . According to Figure 1, the projection vector indicates the direction of text quality variations, and the main component of is closely related to .
We therefore adopt Principal Component Analysis (PCA) to obtain the principal components of matrix . Assuming that k main component vectors are collected with PCA, as well as their importance score , we can obtain following Equation 3:
| (3) |
Here, is also a parameter determined by experiment performance on the validation set, similar to the selection of token and layer, as described in Section 3.1. Finally, we can calculate the evaluation score of each following Equation 4:
| (4) |
where is the representation of the .
3.3 SVM
We also add experiments with the Support Vector Machine (SVM) for comparison. With representation as inputs, the SVM method involves training a binary classifier on good-bad text pairs, and we use the probability of a text belonging to good text as the score result. To be specific, consider a specific text, denote the predicted probability of being good text as , the predicted probability of being bad text as , and the score satisfies:
| (5) |
4 Experiments
| RepEval | Baselines | |||||||||||||
| Prompt | Hyp-only | LLM | Ref-free | Ref-based | ||||||||||
| PCA(20) | PCA(5) | SVM | PCA(20) | GPT-4 | GPT-3.5 | Mistral-7b | GPTScore | BARTScore | UniEval | BLEU | Meteor | BertScore | ||
| FLU | BAGEL | 0.330 | 0.236 | 0.358 | 0.060 | 0.325 | 0.222 | 0.156 | 0.152 | 0.241 | 0.309 | 0.193 | 0.109 | 0.247 |
| Newsroom | 0.548 | 0.565 | 0.515 | 0.478 | 0.297 | 0.218 | 0.411 | 0.565 | 0.596 | 0.443 | -0.163 | 0.157 | 0.182 | |
| SFHOT | 0.351 | 0.345 | 0.368 | 0.108 | 0.305 | 0.178 | 0.238 | 0.135 | 0.164 | 0.312 | -0.054 | 0.015 | 0.164 | |
| SFRES | 0.377 | 0.370 | 0.391 | 0.021 | 0.352 | 0.289 | 0.272 | 0.229 | 0.226 | 0.332 | 0.100 | 0.143 | 0.183 | |
| SummEval | 0.447 | 0.424 | 0.419 | 0.324 | 0.245 | 0.120 | 0.285 | 0.288 | 0.285 | 0.451 | -0.015 | 0.090 | 0.194 | |
| USR-P | 0.360 | 0.404 | 0.363 | 0.306 | 0.391 | 0.310 | 0.288 | -0.030 | 0.034 | 0.239 | -0.124 | 0.073 | 0.322 | |
| USR-T | 0.329 | 0.368 | 0.336 | 0.402 | 0.324 | 0.203 | 0.309 | 0.087 | 0.027 | 0.302 | -0.093 | 0.200 | 0.292 | |
| WebNLG | 0.587 | 0.534 | 0.633 | 0.268 | 0.503 | 0.409 | 0.401 | 0.072 | 0.330 | 0.521 | 0.318 | 0.332 | 0.499 | |
| CON | QAGS-CNN | 0.541 | 0.561 | 0.453 | NA | 0.505 | 0.295 | 0.380 | 0.583 | 0.680 | 0.618 | 0.082 | 0.326 | 0.507 |
| QAGS-XSUM | 0.497 | 0.550 | 0.524 | NA | 0.457 | 0.315 | 0.185 | 0.081 | 0.159 | 0.387 | -0.164 | -0.015 | -0.057 | |
| SummEval | 0.426 | 0.421 | 0.342 | NA | 0.436 | 0.269 | 0.210 | 0.355 | 0.334 | 0.435 | 0.048 | 0.152 | 0.200 | |
| COH | Newsroom | 0.444 | 0.392 | 0.273 | 0.373 | 0.274 | 0.207 | 0.421 | 0.595 | 0.623 | 0.458 | -0.201 | 0.198 | 0.221 |
| SummEval | 0.534 | 0.516 | 0.418 | 0.263 | 0.347 | 0.247 | 0.262 | 0.412 | 0.408 | 0.592 | 0.125 | 0.134 | 0.333 | |
4.1 Datasets and Baselines
We focus on three evaluation criteria: fluency, consistency, and coherence, which are widely applied in NLG tasks. We utilize datasets from four tasks: Asset Alva-Manchego et al. (2020) for simplification, SummEval Fabbri et al. (2021) and Newsroom Grusky et al. (2018) for summarization, WebNLG Shimorina et al. (2019), SFRES, and SFHOT Wen et al. (2015) for data-to-text, and USR-Persona (USR-P) and USR-Topic (USR-T) for dialogue Mehri and Eskenazi (2020). All texts in datasets are written in English.
On the selection of baseline metrics, we utilize three reference-based metrics: BLEU Papineni et al. (2002), Meteor Banerjee and Lavie (2005), and BertScore Zhang et al. (2019), along with three reference-free metrics: GPTScore Fu et al. (2023), BARTScore Yuan et al. (2021), and UniEval Zhong et al. (2022). Additionally, we employ the Mistral-7b model111https://huggingface.co/lvkaokao/mistral-7b-finetuned-orca-dpo-v2 and the ChatGPT API (gpt-3.5-turbo and gpt-4) provided by OpenAI to establish baselines by prompting large language models (LLMs) for evaluation, following the approach by Shen et al. (2023). Please refer to Appendix C for more details about datasets and metrics.
4.2 Training Set Construction
During the construction of the training set, we utilized Asset and GCDC. The reason for choosing them is that Asset belongs to the simplification task, which is unrelated to other datasets in this work. GCDC is a real-world text dataset specifically created for coherence evaluation. Creating the training set based on them minimizes bias introduced by tasks, ensuring that the construction of the projection vector is derived from variations in the quality of criteria.
We then need to set up the standard of classification of good text and bad text. The score range of human judgment on datasets Asset and GCDC is the same, between 1 and 3. We define with a score of 3 as high quality and with a score of 1 as low quality. For each pair, we randomly select one from the good text and another from the bad text.
4.2.1 Experiment Settings
When evaluating fluency and consistency, we construct the training dataset using Asset. For coherence evaluation, we utilize GCDC. During the training of the PCA model, the number of training pairs is set to 5 and 20. Additionally, we employ the SVM model for comparison with the PCA method, using 100 pairs for SVM training. As SVM needs more training data, during construction, we ensure the distinctiveness of each pair, though some pairs may contain the same good or bad text. No repeated data is contained in the training set of PCA.
We collected representations with Mistral-7b following the process described in Section 3.1. We employ the Sklearn implementation of PCA and SVM. For SVM, the kernel is set as Radial Basis Function (RBF), gamma = , and the regularization parameter . We utilized Mistral-7b to generate representations using a single NVIDIA GeForce RTX 3090. The training of PCA and SVM models was performed on a CPU. More experiment details can be found in Appendix C.
4.3 Correlation with Human Judgment
Following the description in previous sections, the correlations between human judgments and scores generated by each metric are presented in Table 1.
We observe that RepEval outperforms existing metrics on almost all datasets, even surpassing the performance of GPT-4. With just five text pairs, the PCA method surpasses previous metrics on half of the datasets, and with 20 pairs, it achieves a top-two performance on seven datasets, similar to the results obtained by SVM, while significantly reducing the training cost. The Hyp-only experiment’s outcome indicates that even without the addition of a prompt template, the embeddings in LLM contain information related to evaluation criteria such as fluency and coherence. Another notable point is that RepEval’s performance is evidently better than directly prompting Mistral-7b for evaluation, indicating that even when LLM struggles to generate a satisfying response, their representations can still convey valuable information.
In summary, the projection of representations can efficiently extract information related to the quality of with a few samples. Therefore, in most cases, there’s no need to employ more complex models like SVM. Another advantage is that RepEval only requires as input, whereas traditional metrics depend on or . Compared with directly prompting LLMs like GPT-4, it exhibits better performance while maintaining a relatively low computational and time cost.
4.4 A Good Projection or Not?
Previous experiments show that PCA works effectively in identifying a suitable projection vector, surpassing other non-linear methods such as SVM. However, it remains uncertain whether PCA identifies the "best" projection. To address this question, we conduct the following random experiments.
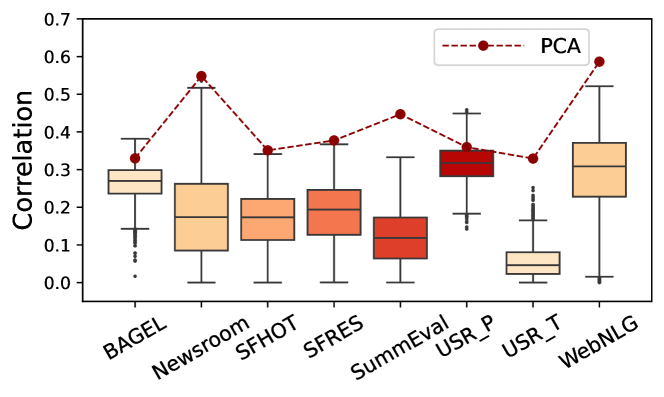
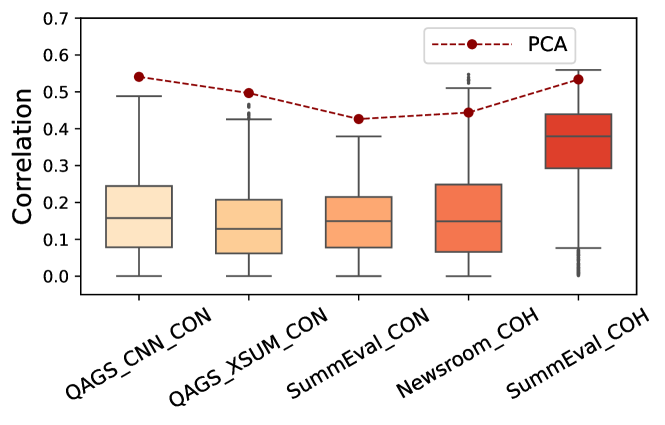
We randomly generated 2000 vectors with the same shape as the vector obtained by PCA. We then collected hypothesis scores using the process outlined in Section 3.1, replacing with . The selection of token and layer positions followed the settings of PCA (20 pairs) outlined in Section 3. The distribution of correlation scores is visualized through a box plot, as shown in Figure 2.
We observe that when employing linear projection for evaluation, obtained through PCA is a relatively optimal result, achieving correlation scores nearly the highest possible when compared to random vectors. To further enhance evaluation effectiveness, additional research should be conducted on aspects such as layer and token selection.
4.5 What Influences the Information Stored in Representation?
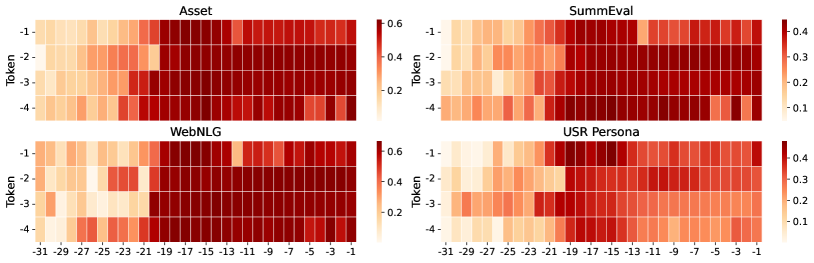
To better utilize RepEval, in this section, we explore the performance of RepEval with different layers and token selections. Limited by space, we take fluency as an example and select four datasets from four tasks. All experiments follow the settings described in Section 4. The results are in Figure 3.
The results show that, surprisingly, the last token is not always the best one. Another observation is that the correlation scores increase sharply in the middle layers and achieve the best result. A possible explanation could be that the next token prediction is conducted based on this token, and it contains more information about the next token rather than the semantic features of the current sentence. A similar statement may be suitable for the change in layers, indicating that the closer a layer is to the output, the more information about the output is encoded in the representation.
This provides us with the following suggestions for improving RepEval. Firstly, we can opt for the token in the last second or third position, instead of the last one token. Secondly, choose embeddings from the second half of the layers. The layer should be far enough from the input to ensure that sufficient information is encoded.
5 Conclusion
We introduced RepEval, an evaluation metric utilizing the projection of LLM representations to obtain evaluation results, which exhibits a stronger correlation with human judgments than previous metrics. RepEval is flexible and is easy to transfer to other evaluation scenarios, requiring only a few sample pairs for training, while avoiding the usage of LLMs with high parameters such as GPT-4. We also provide suggestions on the proper application of RepEval, such as the selection of tokens and layers. Our work provides insights into the development of new metrics.
Limitations
The experiments conducted in this study are limited to three specific tasks due to constraints in the dataset, and the language used is restricted to English. Further research is necessary to validate the identified performance across a broader spectrum of tasks and languages.
The analysis in this study is experimentally driven, we acknowledge the absence of a more comprehensive mathematical analysis explaining the underlying mechanisms of RepEval. Additionally, our evaluation relies solely on correlation as the measurement index. We leave a more detailed analysis for future work.
References
- Alva-Manchego et al. (2020) Fernando Alva-Manchego, Louis Martin, Antoine Bordes, Carolina Scarton, Benoît Sagot, and Lucia Specia. 2020. ASSET: A dataset for tuning and evaluation of sentence simplification models with multiple rewriting transformations. In Proceedings of the 58th Annual Meeting of the Association for Computational Linguistics, pages 4668–4679, Online. Association for Computational Linguistics.
- Banerjee and Lavie (2005) Satanjeev Banerjee and Alon Lavie. 2005. METEOR: An automatic metric for MT evaluation with improved correlation with human judgments. In Proceedings of the ACL Workshop on Intrinsic and Extrinsic Evaluation Measures for Machine Translation and/or Summarization, pages 65–72, Ann Arbor, Michigan. Association for Computational Linguistics.
- Bird et al. (2009) Steven Bird, Ewan Klein, and Edward Loper. 2009. Natural language processing with Python: analyzing text with the natural language toolkit. " O’Reilly Media, Inc.".
- (4) Cheng-Han Chiang and Hung-yi Lee. Can large language models be an alternative to human evaluations? In Proceedings of the 61st Annual Meeting of the Association for Computational Linguistics (Volume 1: Long Papers), pages 15607–15631. Association for Computational Linguistics.
- Dang (2005) Hoa Trang Dang. 2005. Overview of duc 2005. In Proceedings of the document understanding conference, volume 2005, pages 1–12. Citeseer.
- Fabbri et al. (2021) Alexander R. Fabbri, Wojciech Kryściński, Bryan McCann, Caiming Xiong, Richard Socher, and Dragomir Radev. 2021. SummEval: Re-evaluating summarization evaluation. Transactions of the Association for Computational Linguistics, 9:391–409.
- Fu et al. (2023) Jinlan Fu, See-Kiong Ng, Zhengbao Jiang, and Pengfei Liu. 2023. Gptscore: Evaluate as you desire. arXiv preprint arXiv:2302.04166.
- Gao et al. (2023) Mingqi Gao, Jie Ruan, Renliang Sun, Xunjian Yin, Shiping Yang, and Xiaojun Wan. 2023. Human-like summarization evaluation with chatgpt.
- Gehrmann et al. (2023) Sebastian Gehrmann, Elizabeth Clark, and Thibault Sellam. 2023. Repairing the cracked foundation: A survey of obstacles in evaluation practices for generated text. Journal of Artificial Intelligence Research, 77:103–166.
- Grusky et al. (2018) Max Grusky, Mor Naaman, and Yoav Artzi. 2018. Newsroom: A dataset of 1.3 million summaries with diverse extractive strategies. In Proceedings of NAACL-HLT, pages 708–719.
- He et al. (2021) Pengcheng He, Xiaodong Liu, Jianfeng Gao, and Weizhu Chen. 2021. Deberta: Decoding-enhanced bert with disentangled attention. In International Conference on Learning Representations.
- Hermann et al. (2015) Karl Moritz Hermann, Tomas Kocisky, Edward Grefenstette, Lasse Espeholt, Will Kay, Mustafa Suleyman, and Phil Blunsom. 2015. Teaching machines to read and comprehend. Advances in neural information processing systems, 28.
- Honovich et al. (2022) Or Honovich, Roee Aharoni, Jonathan Herzig, Hagai Taitelbaum, Doron Kukliansy, Vered Cohen, Thomas Scialom, Idan Szpektor, Avinatan Hassidim, and Yossi Matias. 2022. TRUE: Re-evaluating factual consistency evaluation. In Proceedings of the 2022 Conference of the North American Chapter of the Association for Computational Linguistics: Human Language Technologies, pages 3905–3920, Seattle, United States. Association for Computational Linguistics.
- Kann et al. (2018) Katharina Kann, Sascha Rothe, and Katja Filippova. 2018. Sentence-level fluency evaluation: References help, but can be spared! In Proceedings of the 22nd Conference on Computational Natural Language Learning, pages 313–323.
- Ke et al. (2022) Pei Ke, Hao Zhou, Yankai Lin, Peng Li, Jie Zhou, Xiaoyan Zhu, and Minlie Huang. 2022. CTRLEval: An unsupervised reference-free metric for evaluating controlled text generation. In Proceedings of the 60th Annual Meeting of the Association for Computational Linguistics (Volume 1: Long Papers), pages 2306–2319, Dublin, Ireland. Association for Computational Linguistics.
- Lai and Tetreault (2018) Alice Lai and Joel Tetreault. 2018. Discourse coherence in the wild: A dataset, evaluation and methods. In Proceedings of the 19th Annual SIGdial Meeting on Discourse and Dialogue, pages 214–223, Melbourne, Australia. Association for Computational Linguistics.
- Lewis et al. (2020) Mike Lewis, Yinhan Liu, Naman Goyal, Marjan Ghazvininejad, Abdelrahman Mohamed, Omer Levy, Veselin Stoyanov, and Luke Zettlemoyer. 2020. Bart: Denoising sequence-to-sequence pre-training for natural language generation, translation, and comprehension. In Proceedings of the 58th Annual Meeting of the Association for Computational Linguistics, pages 7871–7880.
- Mairesse et al. (2010) François Mairesse, Milica Gašić, Filip Jurčíček, Simon Keizer, Blaise Thomson, Kai Yu, and Steve Young. 2010. Phrase-based statistical language generation using graphical models and active learning. In Proceedings of the 48th Annual Meeting of the Association for Computational Linguistics, pages 1552–1561, Uppsala, Sweden. Association for Computational Linguistics.
- Mehri and Eskenazi (2020) Shikib Mehri and Maxine Eskenazi. 2020. USR: An unsupervised and reference free evaluation metric for dialog generation. In Proceedings of the 58th Annual Meeting of the Association for Computational Linguistics, pages 681–707, Online. Association for Computational Linguistics.
- Papineni et al. (2002) Kishore Papineni, Salim Roukos, Todd Ward, and Wei-Jing Zhu. 2002. Bleu: A method for automatic evaluation of machine translation. ACL ’02, page 311–318, USA. Association for Computational Linguistics.
- Radford et al. (2019) Alec Radford, Jeffrey Wu, Rewon Child, David Luan, Dario Amodei, Ilya Sutskever, et al. 2019. Language models are unsupervised multitask learners. OpenAI blog, 1(8):9.
- Scialom and Hill (2021) Thomas Scialom and Felix Hill. 2021. Beametrics: A benchmark for language generation evaluation evaluation. ArXiv, abs/2110.09147.
- Shen et al. (2023) Chenhui Shen, Liying Cheng, Xuan-Phi Nguyen, Yang You, and Lidong Bing. 2023. Large language models are not yet human-level evaluators for abstractive summarization. In Findings of the Association for Computational Linguistics: EMNLP 2023, pages 4215–4233, Singapore. Association for Computational Linguistics.
- Shimorina et al. (2019) Anastasia Shimorina, Claire Gardent, Shashi Narayan, and Laura Perez-Beltrachini. 2019. Webnlg challenge: Human evaluation results.
- Spearman (1987) C. Spearman. 1987. The proof and measurement of association between two things. by c. spearman, 1904. The American journal of psychology, 100 3-4:441–71.
- Wang et al. (2020) Alex Wang, Kyunghyun Cho, and Mike Lewis. 2020. Asking and answering questions to evaluate the factual consistency of summaries. In Proceedings of the 58th Annual Meeting of the Association for Computational Linguistics, pages 5008–5020, Online. Association for Computational Linguistics.
- Wen et al. (2015) Tsung-Hsien Wen, Milica Gašić, Nikola Mrkšić, Pei-Hao Su, David Vandyke, and Steve Young. 2015. Semantically conditioned LSTM-based natural language generation for spoken dialogue systems. In Proceedings of the 2015 Conference on Empirical Methods in Natural Language Processing, pages 1711–1721, Lisbon, Portugal. Association for Computational Linguistics.
- Yuan et al. (2021) Weizhe Yuan, Graham Neubig, and Pengfei Liu. 2021. Bartscore: Evaluating generated text as text generation. In Advances in Neural Information Processing Systems, volume 34, pages 27263–27277. Curran Associates, Inc.
- Zhang et al. (2019) Tianyi Zhang, Varsha Kishore, Felix Wu, Kilian Q Weinberger, and Yoav Artzi. 2019. Bertscore: Evaluating text generation with bert. In International Conference on Learning Representations.
- Zhao et al. (2019) Wei Zhao, Maxime Peyrard, Fei Liu, Yang Gao, Christian M. Meyer, and Steffen Eger. 2019. MoverScore: Text generation evaluating with contextualized embeddings and earth mover distance. In Proceedings of the 2019 Conference on Empirical Methods in Natural Language Processing and the 9th International Joint Conference on Natural Language Processing (EMNLP-IJCNLP), pages 563–578, Hong Kong, China. Association for Computational Linguistics.
- Zhong et al. (2022) Ming Zhong, Yang Liu, Da Yin, Yuning Mao, Yizhu Jiao, Pengfei Liu, Chenguang Zhu, Heng Ji, and Jiawei Han. 2022. Towards a unified multi-dimensional evaluator for text generation. In Proceedings of the 2022 Conference on Empirical Methods in Natural Language Processing, pages 2023–2038, Abu Dhabi, United Arab Emirates. Association for Computational Linguistics.
- Zou et al. (2023) Andy Zou, Long Phan, Sarah Chen, James Campbell, Phillip Guo, Richard Ren, Alexander Pan, Xuwang Yin, Mantas Mazeika, Ann-Kathrin Dombrowski, et al. 2023. Representation engineering: A top-down approach to ai transparency. arXiv preprint arXiv:2310.01405.
Appendix A Evaluation Criteria
Coherence
In accordance with Dang (2005), coherence evaluates whether models generate a well-structured and organized text body that aligns with the given task, steering clear of a mere compilation of related information.
Consistency
Consistency, as per Honovich et al. (2022), assesses whether all factual information in the output text corresponds with the content provided in the input.
Fluency
Fluency, as defined by Kann et al. (2018), gauges the natural perception of a sentence by humans. In certain instances, fluency is also referred to as naturalness, grammaticality, or readability.
Appendix B Related Work
B.1 Reference-based Metrics
Reference-based metrics measure the similarity between and one or multiple s, and a more similar to is considered to be better Gehrmann et al. (2023). Reference-based metrics can be classified into two types: n-gram-based and embedding-based. Popular n-gram-based metrics include BLEU Papineni et al. (2002), METEOR Banerjee and Lavie (2005). Embedding-based metrics include BERTScore Zhang et al. (2019) and MoverScore Zhao et al. (2019). However, the requirement of human-written references limits their applications, as the creation of references is always a serious problem.
B.2 Reference-free Metrics
Reference-free Metrics require and , or only for evaluation, and are widely used in the evaluation process when is not available. For example, BARTSCORE views the evaluation process as a generation problem, measuring how likely a target text can be generated based on the given inputs Yuan et al. (2021). UNIEVAL views the evaluation task as a Boolean Question, providing a unified framework for multi-dimensional evaluation Zhong et al. (2022). GPTScore uses conditional probability to evaluate the quality of given text Fu et al. (2023), where each token is treated equally and a prompt is added to assist the evaluation process.
Appendix C Experiments
C.1 Datasets
ASSET
ASSET is a dataset created for the tuning and evaluation of sentence simplification models Alva-Manchego et al. (2020). In this research, we use the human rating corpus, which contains 100 pairs of original sentences and system simplification as well as the human evaluation results for the system output. For each pair, the rating is done by 15 crowd-sourced workers from 3 aspects: fluency, adequacy, and simplicity.
BAGEL
BAGEL features annotations on data-to-text tasks gathered from a dialogue system, with human annotations covering informativeness and naturalness, according to Mairesse et al. (2010). In this context, informativeness is compared with the gold standard, differing from our defined usage. However, for our purposes, we solely utilize the judgment results related to naturalness.
GCDC
GCDC is created with real-world texts, which is designed for the development of discourse coherence algorithms Lai and Tetreault (2018). Each sample in GCDC contains three evaluation scores of coherence on a 3-point scale from 1 (low coherence) to 3 (high coherence).
NEWSROOM
NEWSROOM gathers 60 articles along with summarization outcomes from 7 models, featuring human-written summaries as references, as documented by Grusky et al. (2018). The evaluation encompasses coherence, fluency, relevance, and informativeness.
QAGS
QAGS encompasses reference texts and annotation results focused on consistency in the context of the summarization task, as outlined by Wang et al. (2020). The approach involves collecting three annotations for each sentence in a generated summary, utilizing a majority vote strategy to determine a consistency score. The final score is obtained by calculating the mean value across all sentences.
SFHOT and SFRES
SFHOT and SFRES deliver evaluation results for the data-to-text task, incorporating annotations of naturalness and informativeness, as detailed by Wen et al. (2015). In this context, informativeness gauges the consistent degree between sources and hypotheses. This dataset is utilized for analyzing consistency, while naturalness serves as a proxy for fluency.
SummEval
SummEval offers a compilation of summarization outcomes produced by language models, as detailed by Fabbri et al. (2021). These models undergo training on the CNN/DailyMail datasets, as described by Hermann et al. (2015), along with their corresponding reference texts. Each generated summary in the dataset includes score results from both expert annotators and crowd-workers, covering four dimensions: coherence, consistency, fluency, and informativeness.
USR
The USR dataset offers evaluation results for the dialogue task across five aspects: fluency, coherence, engagingness, groundedness, and understandability. In alignment with the rephrasing strategy outlined by Zhong et al. (2022), the original aspects "maintains context" and "natural" is renamed as "coherence" and "fluency," respectively.
WebNLG
WebNLG includes human evaluation results from the 2017 WebNLG Challenge, which focuses on the data-to-text task, as described by Shimorina et al. (2019). The candidate text undergoes evaluation based on three aspects: fluency, grammar, and semantics. In this context, fluency assesses whether a text is smooth and natural, and the fluency score is employed for experimentation purposes.
The resources of all datasets we used are listed as follows.
-
•
Newsroom, SummEval, QAGS_cnn, QAGS_XSUM, SFHOT, SFRES are downloaded from source provided by Yuan et al. (2021). The related URL is https://github.com/neulab/BARTScore.
-
•
Asset and WebNLG is downloaded from source provided by Scialom and Hill (2021). The related URL is https://github.com/ThomasScialom/BEAMetrics. We delete empty reference sentences before applying.
-
•
USR_Topical and USR_Persona are created by Mehri and Eskenazi (2020). The related URL is https://github.com/shikib/usr.
-
•
GCDC is created by Lai and Tetreault (2018), and the URL is https://github.com/aylai/GCDC-corpus.
Features contained in each dataset are listed in Table 2. With the exception of GCDC, all datasets include .
| COH | CON | FLU | REF | |
| summarization | ||||
| -Newsroom | ✓ | ✓ | ✓ | |
| -QAGS | ✓ | ✓ | ||
| -SummEval | ✓ | ✓ | ✓ | ✓ |
| data-to-text | ||||
| -BAGEL | ✓ | ✓ | ||
| -SFHOT | ✓ | ✓ | ✓ | |
| -SFRES | ✓ | ✓ | ✓ | |
| -WebNLG | ✓ | ✓ | ||
| dialogue | ||||
| -USR-Persona | ✓ | ✓ | ✓ | |
| -USR-Topical | ✓ | ✓ | ✓ | |
| simplication | ||||
| -Asset | ✓ | |||
| other | ||||
| -GCDC | ✓ | |||
C.2 Implement of Baselines
-
•
BARTScore is downloaded from https://github.com/neulab/BARTScore. We use the faithfulness-based variant based on "facebook/bart-large-cnn"222https://huggingface.co/facebook/bart-large-cnn checkpoint Lewis et al. (2020).
-
•
BERTScore is downloaded from https://github.com/Tiiiger/bert_score. We use the F1 score calculated based on checkpoint "deberta-xlarge-mnli"333https://huggingface.co/microsoft/deberta-xlarge-mnli He et al. (2021).
-
•
GPTScore is downloaded from https://github.com/jinlanfu/GPTScore and we use the checkpoint "gpt2-large"444https://huggingface.co/gpt2-large Radford et al. (2019).
-
•
UniEval is downloaded from https://github.com/maszhongming/UniEval. We use the "summarization" variant developed based on checkpoint "MingZhong/unieval-sum"555https://huggingface.co/MingZhong/unieval-sum Zhong et al. (2022).
-
•
For metric BLEU and Meteor, we use the implementation provided by the python package NLTK Bird et al. (2009).
C.3 Selection of Token and Layer
Here we present the optimal layer and token selections for different RepEval settings and the SVM method, where represents the number of components of PCA.
| criterion | model | pairs | prompt | k | layer | token |
|---|---|---|---|---|---|---|
| FLU | PCA | 20 | yes | 4 | -15 | -4 |
| PCA | 5 | yes | 4 | -15 | -2 | |
| PCA | 20 | no | 3 | -21 | -1 | |
| SVM | 100 | yes | - | -2 | -2 | |
| CON | PCA | 20 | yes | 3 | -16 | -2 |
| PCA | 5 | yes | 3 | -15 | -2 | |
| SVM | 100 | yes | - | -2 | -1 | |
| COH | PCA | 20 | yes | 4 | -9 | -2 |
| PCA | 5 | yes | 2 | -1 | -2 | |
| PCA | 20 | no | 3 | -1 | -2 | |
| SVM | 100 | yes | - | -1 | -3 |
C.4 Prompt of LLM
In this study, we use the gpt-3.5-turbo, gpt-4 API, and mistral-7b for zero-shot baseline. Following the designs of Shen et al. (2023) the prompts we utilized for each criteria are listed as follows: