Spectroscopic Confirmation of an Ultra-Massive Galaxy in a Protocluster at z∗
Abstract
We present spectroscopic confirmation of an ultra-massive galaxy (UMG) with at in the Extended Groth Strip (EGS), based on deep observations of Ly emission with Keck/DEIMOS. The ultra-massive galaxy (UMG-28740) is the most massive member in one of the most significant overdensities in the EGS, with four additional photometric members with within cMpc. Spectral energy distribution (SED) fitting using a large suite of star formation histories and two sets of high-quality photometry from ground- and space-based facilities consistently estimates the mass of this object to be with a small standard deviation between measurements (). While the best-fit SED models agree on stellar mass, we find discrepancies in the estimated star formation rate for UMG-28740, resulting in either a star-forming or quiescent system. JWST/NIRCam photometry of UMG-28740 strongly favors a quiescent scenario, demonstrating the need for high-quality mid-IR observations. Assuming the galaxy to be quiescent, UMG-28740 formed the bulk of its stars at and is quenching at , resulting in a high star formation efficiency at high redshift ( at and at ). As the most massive galaxy in its protocluster environment, UMG-28740 is a unique example of the impossibly early galaxy problem.
keywords:
galaxies:high-redshift – galaxies:evolution – galaxies:clusters1 Introduction
The discovery of extremely massive, passive galaxies at has challenged our understanding of galaxy formation and evolution at early times (Glazebrook et al., 2017; Schreiber et al., 2018; Forrest et al., 2020a, b; Valentino et al., 2020). These quiescent ultra-massive galaxies (UMGs, ) have little to no ongoing star formation, requiring a period of intense, bursty star formation followed by rapid quenching within the first 2 Gyr of the Universe. Such extreme systems are difficult to reproduce in galaxy formation models, with current simulations struggling to form UMGs so early in cosmic time and and often failing to quench these systems by (Forrest et al., 2020a; Valentino et al., 2023; Xie et al., 2024). Thus, although rare, confirmation of UMGs provide powerful constraints on theoretical models of galaxy formation and evolution (e.g. Baugh, 2006; Croton et al., 2006; Nelson et al., 2018).
Intriguingly, the modeled ages and star formation histories of UMGs at suggest that some systems assembled the majority of their mass and subsequently quenched as early as (Forrest et al., 2020b; Schreiber et al., 2018). Overall, there appears to be rapid evolution of the UMG population at , as some of these massive systems transition from highly star-forming to passive. Imaging campaigns that originally uncovered UMGs at also corroborate these findings, yielding samples of photometric UMG candidates at (e.g. Muzzin et al., 2013a, b; Weaver et al., 2023). Meanwhile, measurements of the number density of UMGs find a significant increase in their abundance with cosmic time from to (Stefanon et al., 2015; Davidzon et al., 2017; Marsan et al., 2022; Weibel et al., 2024). Altogether, deep photometric surveys point to not only the existence of these extreme systems at , but also that this epoch is critical for understanding the rapid evolution of this extreme population.
While it is presumed that ultra-massive galaxies should exist at , spectroscopic confirmation of candidate systems has been challenging. Studies searching for UMGs at have encountered difficulty in identifying and detecting these systems via both ground- and space-based spectroscopy (Antwi-Danso et al. 2023; Marsan et al. in prep). The few existing, spectroscopically-confirmed UMGs at represent a biased population of systems with exceptionally high star formation rates () and with relatively poorly-constrained stellar masses (e.g. Xiao et al., 2023, but see also Carnall et al. 2023).
Herein, we present the discovery of a spectroscopically-confirmed, ultra-massive () galaxy at that resides within an extreme overdense region in the Extended Groth Strip (EGS). In §2, we describe our target selection criterion and spectroscopic observations. We present the resulting spectral fitting and characterization of the protocluster environment in §3. We discuss the competing star formation histories (SFH), compare our object to existing simulations, and investigate the mass assembly history of this object in §4. Finally, we summarize our results in §5. Unless otherwise specified, we adopt a CDM cosmology throughout with , , and km s-1 Mpc-1 (Planck Collaboration et al., 2016).
2 Data
2.1 Target Selection and Photometric Measurements
We selected UMG candidates () at in the Extended Groth Strip (EGS) using the multi-wavelength photometric catalog from the Cosmic Assembly Near-infrared Deep Extragalactic Legacy Survey (CANDELS; Grogin et al. 2011; Koekemoer et al. 2011). The CANDELS photometric catalog (Stefanon et al., 2017), which spans m via a suite of ground- and space-based imaging, incorporates photometric redshifts and stellar masses from seven separate photo- codes and/or spectral energy distribution (SED) template sets. For selection purposes, we used the median and reported in the catalog. To increase the likelihood of detection of Ly, we prioritized objects that had an apparent CFHT -band AB magnitude of and star formation rate (SFR) of . To increase our sample size, we included UMG candidates within the given redshift range that had lower SFRs and masses as filler targets.
UMG-28740 ( and ), in particular, was selected as a star-forming candidate, with an estimated SFR of and an apparent CFHT -band magnitude of . Within the Stefanon et al. (2017) catalog, UMG-28740 has a median photometric redshift of and a median stellar mass of . In total, the CANDELS catalog reports photometric measurements of UMG-28740 at and bands from CFHT, F606W, F814W, F125W, F140W, and F160W from HST, as well as all four Spitzer/IRAC channels.
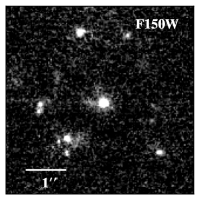
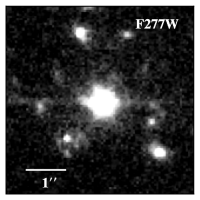
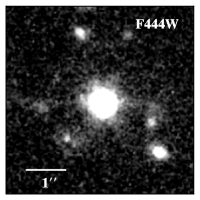
In addition to the photometry from CANDELS, this galaxy was recently observed with JWST/NIRCam (Rieke et al., 2003; Beichman et al., 2012) as part of the Cosmic Evolution Early Release Survey (CEERS, PID 12117; Finkelstein et al. 2023; Bagley et al. 2023). Using JWST/NIRCam (pointing 2), UMG-28740 was observed with the F115W, F150W, F200W, F277W, F356W, F410M, and F444W filters at a depth ranging from AB magnitudes of . While the CEERS photometry was not incorporated in the initial target selection, it is utilized in this work as a supplemental set of photometry in .
2.2 Spectroscopic Observations and Reduction
Using Keck/DEIMOS (Faber et al., 2003), we observed UMG-28740 in March and May of 2023 on three different slitmasks. For all observations, we used the 600 lines mm-1 grating blazed at 7500 Å and tilted to a central wavelength of 7200 Å, with the GG455 order-blocking filter employed and no dithering between exposures. With slit widths of , the spectral resolution (FWHM) for the 600g grating on DEIMOS is Å (Weiner et al., 2006), with a dispersion of Å per pixel. Calibrations for each slitmask included three internal quartz lamp flat-field frames and an arc lamp spectrum (using Kr, Ar, Ne, and Xe lamps). We were able to observe UMG-28740 with the three different slitmasks for a combined exposure time of 6.9 hours. The average seeing for these observations ranged from - with variable transparency.
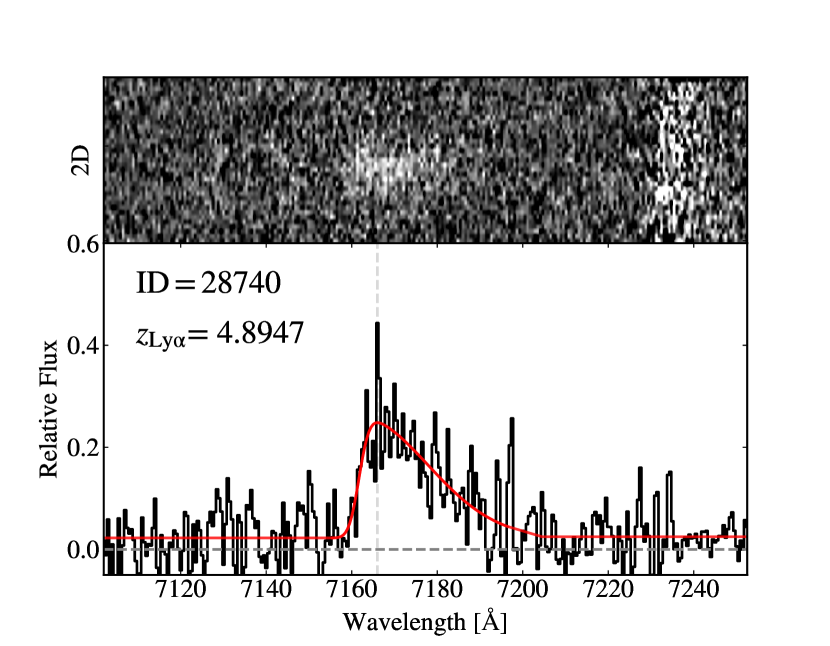
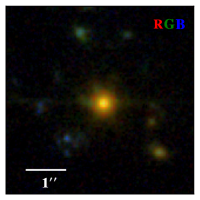
The Keck/DEIMOS observations were reduced using the spec2d111https://sites.uci.edu/spec2d/ DEEP2/DEEP3 DEIMOS data reduction pipeline (Newman et al., 2013; Cooper et al., 2012), yielding sky-subtracted, wavelength-calibrated 1D and 2D spectra for each target. We then combined the three 1D spectra of UMG-28740 from the reduction of each slitmask, creating a final co-added 1D spectrum as shown in Figure 1. For visualization of the line, we also co-added the corresponding 2D spectra, as shown in the top panel of Figure 1.
To measure a best-fit redshift, we utilized a custom template fitter (as used in Urbano Stawinski et al. 2024) that incorporates both an emission-line galaxy template as well as an asymmetric Gaussian profile to probe for a single Ly line. For UMG-28740, we found a single emission line nearby the expected wavelength for Ly given the photometric redshift. Fitting this profile, we find the resulting heliocentric-corrected spectroscopic redshift for UMG-28740 is (best-fit model is shown by the red line in Fig. 1).
While this redshift is determined by the presence of a single emission line, there are multiple arguments consolidating this feature to be Ly. First, the asymmetric profile of the emission line follows the characteristic shape of Ly emitters at (e.g. Verhamme et al., 2008; Martin et al., 2015). Second, the measured redshift is consistent with two sets of photometry from CANDELS and CEERS, including high-quality photometric measurements from HST/WFC3 and JWST/NIRCam (see Fig. 2). Lastly, the location of this galaxy coincides with a large overdense region at (first highlighted by Naidu et al. 2022 and later discussed in §3.2), which further solidifies as the correct redshift.
3 Analysis
3.1 SED Fitting
With our measured spectroscopic redshift (), we re-fit the SED of UMG-28740. Here, we employ both the photometry from CANDELS (Stefanon et al., 2017) and from CEERS (Bagley et al., 2023). From the CANDELS photometric catalog, we exclude the HST/ACS photometry at and due to uncertainties related to sky subtraction, such that the SED fits are made to the photometry at from CFHT, F125W, F140W, and F160W from HST/WFC3-IR, and all four Spitzer/IRAC channels. Meanwhile, the CEERS catalog includes photometric measurements at F606W and F814W from HST/ACS, F125W, F140W, and F160W from HST/WFC3-IR, and finally F115W, F150W, F200W, F277W, F356W, F410M, and F444W from JWST/NIRCam.
The majority of our SED analysis was completed using the SED-fitting code Bayesian Analysis of Galaxies for Physical Inference and Parameter EStimation or BAGPIPES222https://github.com/ACCarnall/bagpipes (Carnall et al., 2018). BAGPIPES assumes Bruzal and Charlot stellar populations (Bruzual & Charlot, 2003), a Kroupa IMF (Kroupa & Boily, 2002), and a Calzetti dust law (Calzetti et al., 2000). Adopting a double-power law star formation history, we measure best-fit model SEDs for each set of photometry (from CANDELS and CEERS). The SEDs are fit to 10 free parameters, allowing for variation in metallicity, age, the slope of the Calzetti dust law, and the ionization parameter. The full set of free parameters used and their allowed distributions are outlined in Table 1.
| Parameter | Unit | Range | Prior |
|---|---|---|---|
| Generala | |||
| Stellar Mass Formed | (1, 15) | Logarithmic | |
| Peak Star Formation | Gyr | (0.3, ) | Logarithmic |
| Age | Gyr | (0.1, 1) | Logarithmic |
| Metallicity | (0.01, 2.5) | Logarithmic | |
| -band attenuation | (0, 8) | Uniform | |
| Deviation from | (-0.3, 0.3) | Gaussianb | |
| Calzetti slope | |||
| 2175Å bump strength | (0, 5) | Uniform | |
| Ionization | (-4, -2) | Logarithmic | |
| Double-power lawc | |||
| double-power law | (0.01, 1000) | Logarithmic | |
| falling slope | |||
| double-power law | (0.01, 1000) | Logarithmic | |
| rising slope | |||
| Burstd | |||
| Stellar Mass Formed | (0, 15) | Logarithmic | |
| Age | Gyr | (0.1, 1) | Logarithmic |
| Metallicity | (0.01, 2.5) | Logarithmic | |
| AGNd | |||
| Continuum Flux at | (0, ) | Uniform | |
| 5100Å | erg/s/cm2/Å | ||
| H Flux | (0, ) | Uniform | |
| erg/s/cm2 | |||
| H Velocity | /km/s | (1000, 5000) | Logarithmic |
| Dispersion | |||
| Power law slope: | |||
| at Å | (-2, 2) | Gaussiane | |
| at Å | (-2, 2) | Gaussianf | |
| aParameters used in all SED fits. | |||
| bThe Gaussian distribution for the Calzetti slope has a mean of | |||
| and a standard deviation of | |||
| cParameters specifically used in the double-power law fits. | |||
| dParameters used in added AGN and burst components. | |||
| eThe Gaussian distribution for the power law slope at at Å | |||
| has a mean of and a standard deviation of | |||
| fThe Gaussian distribution for the power law slope at at Å | |||
| has a mean of and a standard deviation of | |||
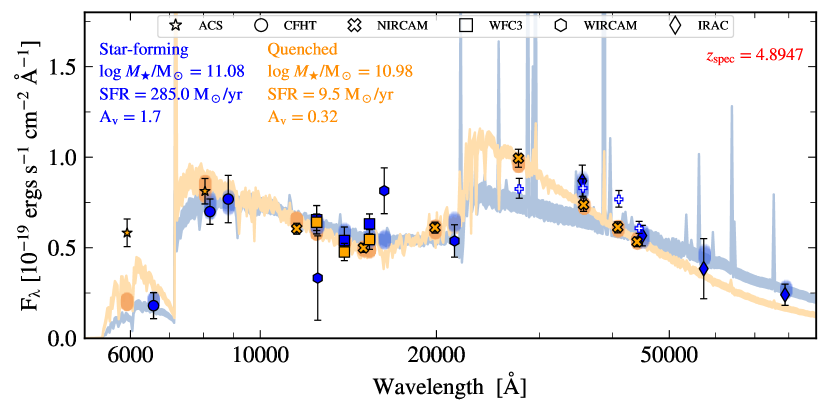
As shown in Figure 2, the resulting SED fits give a stellar mass of using the CEERS photometry and using the CANDELS photometry. While the stellar mass is tightly constrained between the two sets of photometry, we find that the SFR is dependant on the photometric catalog utilized. The CANDELS photometry yields a dusty, highly star-forming galaxy () and the fit to the JWST/NIRCam photometry produces a very low star formation rate () and low dust attenuation. The latter, nearly quenched SED is shown in orange in Figure 2, and is consistent with both sets of photometry within error. On the other hand, the star-forming SED (shown in blue in Fig. 2) has insufficient emission in the rest-frame optical (-Å), so as to under-produce the flux measured in the JWST/NIRCam F277W band. In addition, the star-forming SED overpredicts the observed flux in the JWST/NIRCam F356W, F410M, and F444W bands due to contribution from strong emission lines such as H at . Based on the photometry alone, this favors the quenched scenario for UMG-28740 (see §4.1 for a more detailed discussion of these discrepancies).
To test the robustness of our measurements for mass and SFR, we ran BAGPIPES again using a variety of different models; varying the included free parameters, changing the assumed star formation history, restricting the assumed metallicity to solar, and adding different components such as bursts and an active galactic nucleus (AGN). In summary, we highlight the results from five different models: a double-power law SFH, a double-power law SFH including an AGN, a burst, or fixing the metallicity to solar metallicity, and a delayed- model (see Table 2). Adding an AGN or burst component is of interest to the evolution of massive galaxies in the early Universe, as the spectra of a subset of UMGs have significant AGN contributions (Marsan et al. 2017; Forrest et al. 2020b, Forrest et al. in prep.) and current theoretical models speculate that the rapid formation of such systems require extreme bursts of star formation (Sun et al., 2023).
We also compared the results from BAGPIPES to fits using the C++-adapted SED fitting code FAST++333https://github.com/cschreib/fastpp (Kriek et al., 2009). With FAST++, we adopt the same parameters used in the literature to model UMGs at (Forrest et al., 2020a, b), assuming a Bruzal Charlot stellar population (Bruzual & Charlot, 2003), the Calzetti dust law (Calzetti et al., 2000), and a Chabrier IMF (Chabrier, 2003). The Chabrier IMF is related to the Kroupa IMF used in BAGPIPES by a factor of (Wright et al., 2017), allowing for direct comparison between results of the two SED codes. We allow FAST++ to vary the extinction from with a , the age from age of the Universe at with , and a metallicity of as in Forrest et al. (2020a, b). For the assumed SFH, we adopt a double-exponential SFH as used in Forrest et al. (2020a, b).
Remarkably, regardless of the photometric dataset used, SFH assumed, underlying SED code, or range of free parameters, we find all best-fit SEDs result in a massive galaxy with a stellar mass of . Across the various fits, UMG-28740 has a median mass of with a standard deviation of (see Table 2 for measurements from each SED fit). Hereinafter, we conservatively use this stellar mass and error as our best estimate for UMG-28740. This SED fitting analysis also highlights a discrepancy between SFR and dust extinction – resulting in the two possible scenarios, star-forming or quenched (see §4.1 for a more detailed discussion).
3.2 An Overdense Region around UMG 28740
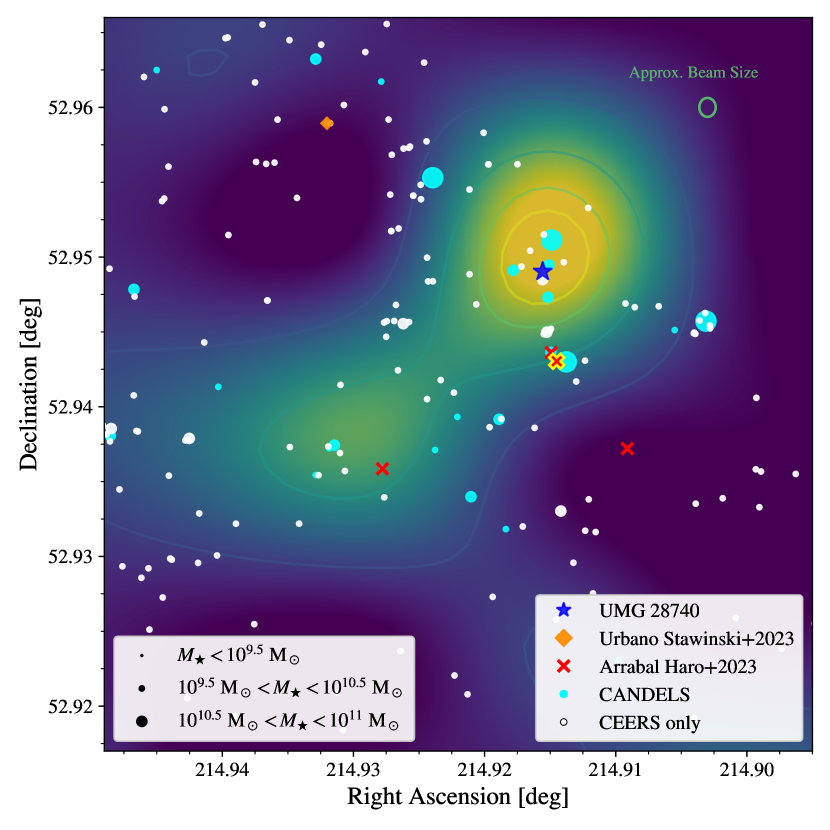
UMG-28740 is embedded within a significant overdensity at , as traced by the surface density of galaxies at in the CANDELS photometric catalog. As shown in Figure 3, UMG-28740 resides near the center of the overdense region and is the most massive member. However, we caution that the observed overdensity is located near the edge of the CANDELS survey area within the EGS, with UMG-28740 only from the edge of the HST/WFC3 imaging footprint, such that the full extent of the structure may be underestimated. Naidu et al. (2022) first identified this particular overdense region, finding that a area centered on a lower-mass photometric neighbor of UMG-28740 contained the average surface density of sources at . However, this lower-mass neighbor (, spectroscopically confirmed by Arrabal Haro et al. 2023b), is located to the south ( at ) of UMG-28740 and outside of the apparent center of the overdense region as traced by the CANDELS photometric catalog (see the highlighted red cross in Fig. 3).
To investigate the extent of the overdense region around UMG-28740, we search for other overdensities across the entire CANDELS footprint within the EGS field by comparing the galaxy surface densities in redshift slices of to the average surface density at each corresponding epoch. We use the CANDELS catalog to identify sources at , as this catalog covers a larger footprint within the EGS (versus CEERS). We limit this analysis to sources with , so as to define a tracer population that is unbiased (complete) over the full redshift range probed. Across the entire field, we compute the galaxy surface density as a function of position on the sky within an aperture of and a depth of . Stepping through redshift from to with a step size of , we identify regions that are overdense compared to the average surface density at the corresponding redshift. We find that the region hosting UMG-28740 is one of the most extreme overdense regions within the EGS at , with a surface density that is higher than the average surface density of the field at .
At , the effective radii of protoclusters are estimated to extend up to cMpc (Chiang et al., 2013). UMG-28740 is positioned nearby the apparent center of the overdense region, such that we can estimate from UMG-28740 to trace the effective radius of the protocluster. However, we caution this region is also near the edge of the EGS field, limiting observed galaxies past cMpc to the north-west and potentially skewing the true center of the overdensity. Nevertheless, within cMpc from UMG-28740, there are 26 photometric protocluster members at and with in the CANDELS photometric catalog along with 160 members identified in the CEERS catalog, pushing down to lower stellar masses (). Additionally, out of all the photometric members there are massive neighbors with within just 29.5′′, or cMpc, of UMG-28740. The closest of these massive members is only separated from UMG-28740 by cMpc. This makes the protocluster surrounding UMG-28740 the most compact overdensity of massive galaxies within the entire EGS at (according to the CANDELS catalog), with only two other compact regions each containing two similarly massive galaxies at a similar spatial scale ( cMpc). Moreover, there are no other instances of massive galaxies within cMpc at this redshift in the CANDELS catalog.
| SFH | Code | Mass | SFR |
| /yr | |||
| CANDELS (Stefanon et al., 2017) | |||
| Double-power lawa | BAGPIPES | 11.08 | 285.0 |
| Double-power law+AGN | BAGPIPES | 10.97 | 8.6 |
| Double-power law+burst | BAGPIPES | 10.98 | 419.6 |
| Double-power law at | BAGPIPES | 11.18 | 299.9 |
| Delayed- | BAGPIPES | 10.92 | 312.1 |
| Double Exponential | FAST++ | 10.95 | 24.5 |
| CEERS (Bagley et al., 2023) | |||
| Double-power lawa | BAGPIPES | 10.98 | 9.5 |
| Double-power law+AGN | BAGPIPES | 10.96 | 0.0 |
| Double-power law+burst | BAGPIPES | 11.17 | 18.1 |
| Double-power law at | BAGPIPES | 11.17 | 21.0 |
| Delayed- | BAGPIPES | 11.05 | 32.2 |
| aSED fit is shown in Fig. 2. | |||
This protocluster also hosts 5 spectroscopically-confirmed galaxies from Keck/DEIMOS (Urbano Stawinski et al., 2024) and JWST/NIRSpec (Arrabal Haro et al., 2023a) spectroscopy within cMpc (see Fig. 3). The measured mass of these spectroscopic members range from and span 0.75 cMpc to 2.10 cMpc from UMG-28740. In summary, all members within cMpc, both spectroscopically confirmed and all photometric candidates, are estimated to be less massive than UMG-28740.
4 Discussion
4.1 Investigation into Competing Star Formation Histories
As mentioned in §3.1, the two sets of photometry yield two different SFH scenarios, one with a highly star-forming and dusty SED versus one with low star formation and little dust extinction. The high-quality JWST/NIRCam photometry favors a nearly quenched, SED. In contrast, the photometry from CANDELS favors a star-forming SED, with the exception of a quenched solution when assuming a double-exponential SFH with FAST++ (as described in §3.1). We show a variety of these SFHs, highlighting the best fit SEDs from the final BAGPIPES run, in Figure 4.
Looking at the SED fits alone, the spread of the orange, quenched SED is consistent with both sets of photometry within the errors. However, there is a clear offset between the JWST/NIRCam photometry and the blue, star-forming SED, with the largest discrepancy at F277W and F410M. To test the consistency between the NIRCam photometry and the star-forming SED, we predict the flux that we would expect from a mock F277W, F356W, F410M, and F444W observation of the star-forming SED fit, using the ‘predict’ function within the BAGPIPES code (see the open blue crosses in Fig. 2). For F277W, the expected flux would be elevated from the continuum due to the emission lines nearby ; however, we find this predicted flux is insufficient to reproduce the observed F277W flux even within . For F356W and F410M, the predicted flux is elevated to a greater extent, due to contributions from strong emission lines such as H at . However, this added emission over-predicts the flux measured by the NIRCam photometry (also seen, to a lesser extent, in the F444W predicted flux). Taken together, this suggests that the quenched scenario is more consistent with the observed photometry from both catalogs, and thus more likely to be the true SFH of UMG-28740.
One argument against a quenched SFH is the detection of Ly emission. However, this may be explained by either AGN contribution or remnant star formation consistent with a post-starburst SED. Assuming no AGN contamination, we again use the ‘predict’ function in BAGPIPES to estimate the equivalent width (EW) of Ly in the various SED fits. For the nearly quenched scenario, the SFR from all models without an AGN component ranges from 9.5 to 32.2 . Measuring the EW of Ly from the model SEDs (using the spread in the quenched models) yields an EWÅ. We then estimate the EW of the observed Ly line from Keck/DEIMOS. We find the continuum level just redward of the line profile and calculate the EW using a custom python code. Because the continuum level is so low, we conservatively call this measurement an upper limit on the true EW. Performing this analysis yields an observed EWÅ, within the range of the predicted values for the post-starburst SED. Hence, we cannot rule out the nearly quenched scenario by detection of Ly emission alone.
We perform the same analysis on the SEDs with AGN contribution. With AGN contribution we find the spread for the quenched SEDs yields EWÅ, which is below the estimated observed Ly EW. This would suggest that AGN contribution alone may not explain the presence of Ly emission seen in the Keck/DEIMOS spectroscopy, and that likely there is some remnant star formation (even with the presence of AGN contamination).
The best-fit SEDs for UMG-28740 yield two different SFH scenarios, a highly star-forming galaxy or a nearly quiescent one. However, due to the flux required by the JWST/NIRCam photometry in the mid-IR (F277W, F356W, F410M, and F444W) and the consistency in the EW of the observed and predicted Ly emission line, we argue that the quenched SED is likely the true SFH of this object.
4.2 Comparison to Simulations
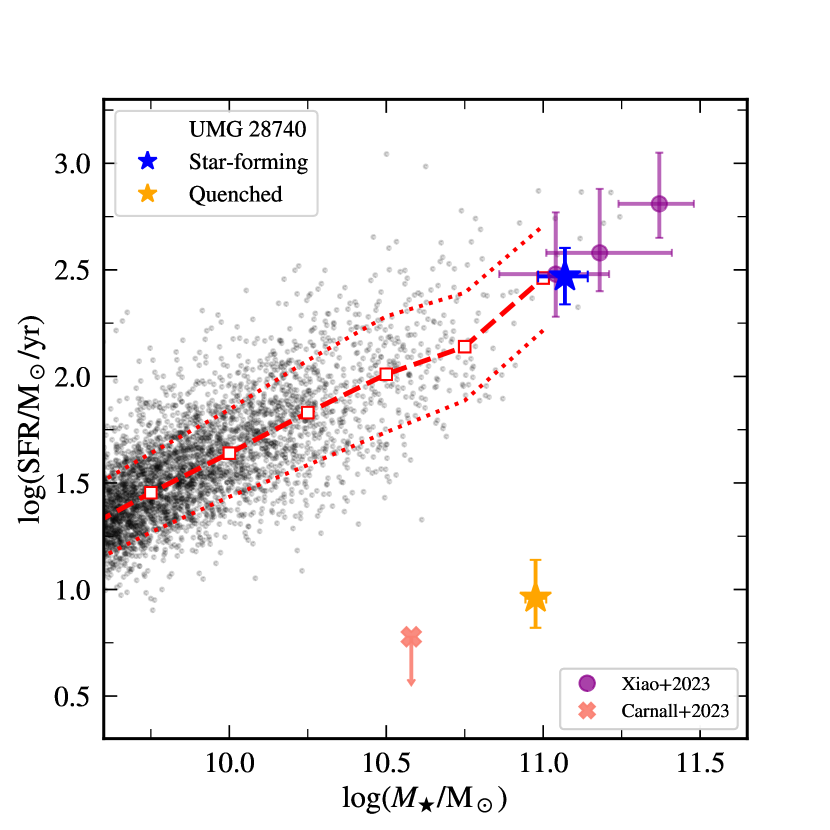
The number density of UMGs at is extremely low, especially for more quiescent systems (Stefanon et al., 2015; Davidzon et al., 2017; Marsan et al., 2022; Weaver et al., 2023). In addition, due to various observational challenges associated with observing these systems, there are only a handful of spectroscopically-confirmed UMGs at this epoch in the literature (e.g. Antwi-Danso et al., 2023; Xiao et al., 2023; Carnall et al., 2023). To compare the SFR of UMG-28740 to a large, unbiased sample of galaxies, we plot SFR versus stellar mass for UMG-28740 with simulated galaxies. Many simulations struggle to produce massive systems at high redshift, and most fail to quench these objects at early epochs. However, the Illustris TNG-300 simulation (Nelson et al., 2019) has been able to form massive systems and subsequently suppress SFR to reproduce quiescent UMGs up to (Forrest et al., 2020a; Schreiber et al., 2018; Glazebrook et al., 2017). Hence, we compare UMG-28740 to simulated galaxies in TNG-300 at (see Fig. 5).
While TNG-300 reproduces massive quiescent systems at , as well as massive star-forming galaxies at earlier epochs (Forrest et al., 2020a), TNG-300 fails to create massive and quiescent galaxies like UMG-28740 (assuming a quenched scenario) and one other spectroscopically-confirmed quenched system in the literature (Carnall et al., 2023) at . The measured SFR of UMG-28740 for the quenched scenario is dex below that of any other simulated galaxy at . On the other hand, the TNG-300 simulation does reproduce massive, star-forming galaxies at this epoch, including those from Xiao et al. (2023) and the star-forming scenario of UMG-28740. The lack of massive quenched objects is likely a result of one of two possibilities: the TNG-300 simulation fails to catch the cessation of star formation at this epoch or that the size of TNG-300 is too small ( Mpc3) to capture a system as rare as UMG-28740 and its protocluster environment.
Recently, Xie et al. (2024) used the GAEA semi-analytic model (De Lucia et al., 2024), applied to a larger box size than that of TNG-300 ( Mpc3), to study the formation of massive quiescent galaxies at early cosmic times. In summary, Xie et al. (2024) find a larger relative number of quenched massive galaxies at , with a quenched fraction for systems with of . Xie et al. (2024) suggest that the primary quenching mechanism for massive galaxies at high redshift is accretion disk feedback via quasar winds. Yet even within the GAEA simulation UMG-28740 is exceptionally rare; galaxies as quiescent as the best-fit quenched model, with a specific SFR of , have a number density of only per at in GAEA (De Lucia et al., 2024).
4.3 Mass Assembly History of UMG-28740
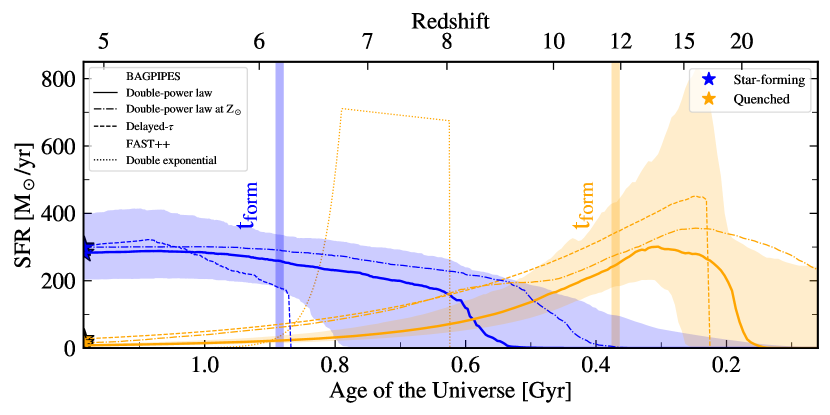
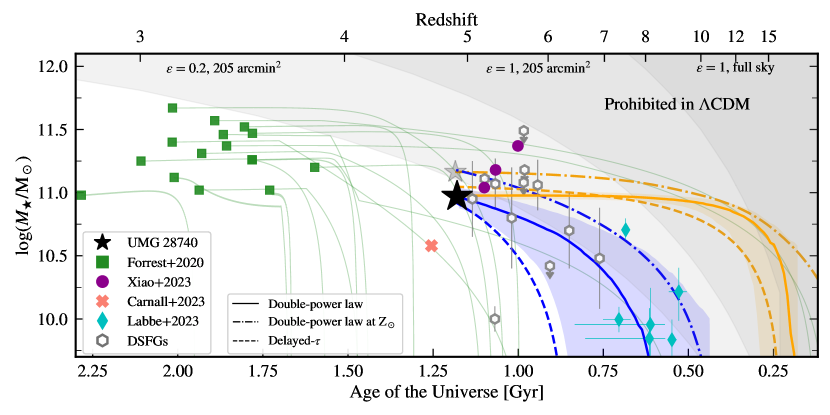
To investigate the potential evolution of UMG-28740, in Figure 6 we plot the mass assembly history corresponding to the best-fit star-forming and quiescent models from BAGPIPES (see Fig. 4). We compare the mass growth of UMG-28740 to that of spectroscopically-confirmed UMGs at from the Massive Ancient Galaxies At NEar-infrared (MAGAZ3NE) survey (Forrest et al., 2020a, b, 2022), a Keck/MOSFIRE effort that has successfully spectroscopically confirmed a large sample of star-forming and quenched UMGs at . We also include a sample of massive dusty star-forming galaxies (DSFGs) at from the literature (Riechers et al., 2020; Williams et al., 2019; Jin et al., 2019; Zavala et al., 2018; Pavesi et al., 2018; Riechers et al., 2017; Strandet et al., 2017; Ma et al., 2015; Cooray et al., 2014; Riechers et al., 2013; Walter et al., 2012), including the dusty star-forming UMGs spectroscopically confirmed by Xiao et al. (2023). Finally, we also include the massive, spectroscopically-confirmed quiescent galaxy from Carnall et al. (2023) and the photometric massive galaxy candidates from Labbé et al. (2023). Below we discuss the possible connections between UMG-28740 and these various populations.
For the mass assembly history predicted by the best-fit star-forming models, UMG-28740 is consistent with being the progenitor of the existing UMG population at , such that the ongoing star formation in the system will continue to grow its stellar mass at , likely becoming similar to one of the more massive UMGs detected by the MAGAZ3NE survey. Similarly, the DSFG population at , including the galaxies identified by Xiao et al. (2023), are also likely to evolve into members of the existing UMG population at (Forrest et al., 2020b). Looking towards higher for the best-fit star-forming models, the assembly history of UMG-28740 is consistent with the massive galaxy candidates from Labbé et al. (2023) as potential progenitors, with UMG-28740 forming much of its stellar mass at .
On the other hand, assuming the more-likely quenched SFH, UMG-28740 will evolve into a lower-mass UMG at (). Interestingly, however, in this scenario UMG-28740 would not be included in the sample of known UMGs at . Due to the difficulty in detecting absorption lines in faint systems from the ground, MAGAZ3NE observations were limited to an AB magnitude of . In contrast, if we passively evolve the quenched model SED for UMG-28740 at to , we find that UMG-28740 would have an AB magnitude of , fainter than the selection limit for the MAGAZ3NE survey and indicating that existing samples of UMGs at intermediate redshift may be biased against the oldest systems (see Forrest et al. 2020b). Instead, UMG-28740 would more likely resemble much fainter UMGs at , such as those that have been targeted with JWST/NIRSpec (Nanayakkara et al., 2024; Glazebrook et al., 2024).
Towards high-, the evolutionary history of UMG-28740 drastically changes assuming a quenched model. At , UMG-28740 is already an extreme system, more massive than the only other spectroscopically-confirmed quiescent system at this epoch (Carnall et al., 2023). Moreover, in contrast to the massive quiescent galaxy from Carnall et al. (2023), which formed its mass at , we find UMG-28740 to already be quenching by , with the bulk of its stellar mass formed at much earlier cosmic time (). Based on the quenched SED fits, the mass assembly of UMG-28740 is inconsistent with the DSFG population at and the massive galaxy candidates from Labbé et al. (2023), instead forming a more extreme amount of mass at very high redshift.
The formation of such massive galaxies at high redshift is a highly active area of study thanks to a wealth of new observations from JWST. For example, early JWST imaging campaigns discovered a surplus of massive galaxy candidates at that stand in tension with predictions from CDM (Casey et al., 2023; Labbé et al., 2023; Boylan-Kolchin, 2023). These results have sparked a myriad of questions and scrutiny in our current understanding of the physical processes driving galaxy evolution, including those that underpin SED fitting codes. The extreme build-up of mass required to assemble massive galaxies suggests intense bursts of star formation that convert of the available baryons into stars (Steinhardt et al., 2016; Boylan-Kolchin, 2023; Sun et al., 2023; Casey et al., 2023; Xiao et al., 2023; Antwi-Danso et al., 2023).
To investigate the star formation efficiency of UMG-28740, we plot the limiting mass as imposed by a CDM cosmology (shown as the grey shaded regions in Fig. 6). To do this, we follow the methodology from Boylan-Kolchin (2023), first calculating the number density of halos of a given mass as a function of redshift using hmf444https://hmf.readthedocs.io, a python package that calculates the halo mass function at different redshifts (Murray, 2014). We then find the maximum halo mass, given a survey volume, for which we would observe such system. To convert to stellar mass, we follow , where is the cosmic baryon fraction and is the efficiency of converting baryons into stars. We perform this calculation for the area of the CANDELS footprint within the EGS (205 arcmin2, Stefanon et al. 2017) using a line-of-sight depth of and an efficiency of 20 () and 100 (). We also calculate the maximum stellar mass for observations across the full sky with an efficiency of 100, which is the upper limit for what is allowed in a CDM cosmology.
At , UMG-28740 has a stellar mass consistent with a relatively high star formation efficiency (), comparable to that found in larger samples of massive galaxies at high redshift (e.g. Chworowsky et al., 2023). In contrast, recent analyses of massive star-forming galaxies at find even more extreme star formation efficiencies (, Xiao et al., 2023; Casey et al., 2023). If UMG-28740 is quiescent at , then its evolution is also consistent with an elevated formation efficiency at higher . As shown in Figure 6, at where the quenched model for UMG-28740 is still star forming, the implied formation efficiency is on the order of (and potentially in excess of) unity, consistent with the expectations from models of feedback-free star formation (Dekel et al., 2023). Moreover, for the quenched model, UMG-28740 reaches significant tension with CDM at even earlier times, exceeding across the area of the full sky at . This suggests UMG-28740 formed its stars at nearly impossible rates as currently predicted by theoretical models.
4.4 RUBIES-EGS-QG-1
While we finalized this manuscript, de Graaff et al. (2024) presented a JWST/NIRSpec PRISM and G395M spectrum of UMG-28740 (identified as RUBIES-EGS-QG-1 in de Graaff et al. 2024). The spectroscopic observations were collected in March 2024, with coverage of the Balmer break and the H emission line. This effort was part of the RUBIES survey (GO-4233; PIs A. de Graaff and G. Brammer), which uses JWST/NIRSpec to observe galaxies in the EGS and UDS fields. In this section, we discuss the results of this independent work and compare those to our work.
The physical properties of RUBIES-EGS-QG-1 were measured from SED fitting of the JWST/NIRSpec PRISM spectrum, as well as photometry from HST/WFC3 (F125W, F140W, and F160W), HST/ACS (F814W and F606W), and JWST/NIRCam (F115W, F150W, F200W, F277W, F356W, F444W, and F410M). The spectrum and photometry were fit simultaneously via Prospector (Leja et al., 2017), assuming a Chabrier IMF (Chabrier, 2003), stellar population models from Flexible Stellar Population Synthesis (FSPS, Conroy & Gunn, 2010; Conroy et al., 2009), the MILES spectral library (Sánchez-Blázquez et al., 2006), and MESA Isochrones and stellar tracks (MIST, Choi et al., 2016; Dotter, 2016). With Prospector, de Graaff et al. (2024) explored four different star formation history models – a delayed-, rising, and fixed model as well as a SFH comprised of 14 bins of constant star formation. The resulting best-fit stellar mass is in agreement with our results, yielding . With inclusion of mid-IR spectroscopy from JWST/NIRCam, de Graaff et al. (2024) pin down the SFR in the last 100 Myr as . This independent work uses a separate SED modeling code and includes a high-quality spectrum that probes key spectral features, yet the final results are in excellent agreement with our quenched model.
The complementary analysis from de Graaff et al. (2024), taken together with the conclusions of our SED fitting, highlights the importance of high-quality mid-IR photometry – currently only accessible via JWST/NIRCam – in understanding systems like UMG-28740. Only with such data can we accurately measure key physical properties of galaxies. This example (UMG-28740) demonstrates the importance of JWST as we continue to search and study the rarest and most massive systems in the Universe.
5 Conclusions
In this work, we present spectroscopic confirmation of an ultra-massive galaxy (UMG, ID 28740) with at based on deep spectroscopy with Keck/DEIMOS. UMG-28740 is one of the most massive spectroscopically-confirmed galaxies at and lies within one of the most extreme overdensities in the EGS. Here, we summarize the main results of our analysis:
-
•
Using the spectroscopic redshift, we run a large suite of SED modeling (assuming various SFHs and using two SED fitting codes, BAGPIPES and FAST++) on two sets of photometric data from CANDELS (Stefanon et al., 2017) and CEERS (Bagley et al., 2023). Regardless of the SED code, set of free parameters, or SFH assumed, the stellar mass of UMG-28740 is tightly constrained, with a median mass of and a standard deviation of between all runs.
-
•
We find a discrepancy between the measured SFR and photometric dataset assumed, with multiple SED fits to the CANDELS photometry yielding a highly star-forming object. However, when fitting to the JWST/NIRCam photometry from CEERS, UMG-28740 is nearly quiescent, with SFR . Futhermore, while the quenched SED is consistent with both sets of photometry, the predicted flux from the best-fit star-forming SED is under-predicts the measured flux at F277W and over-predicts the measured flux at F356W, F410M, and F444W; suggesting a quenched scenario is more likely. Finally, we show the presence of Ly does not rule out a post-starburst, nearly quenched scenario.
-
•
We find UMG-28740 to be the most massive member of a protocluster environment at , with the surface density of galaxies in the region around UMG-28740 roughly higher than the average coeval field surface density. Within cMpc of UMG-28740, we find 26 photometric members with and 160 photometric members with at , using the CANDELS and CEERS photometric catalogs, respectively. Finally, we find four additional massive galaxies () within cMpc of UMG-28740 in the CANDELS photometric catalog.
-
•
Comparing the SFR of UMG-28740 to the Illustris TNG-300 simulation box at shows that, if quenched, UMG-28740 is extremely rare – with a SFR dex lower than any simulated galaxy at .
-
•
We find UMG-28740 has a high star formation efficiency () at . Assuming a quenched model, this efficiency exceeds for the area of the full sky, suggesting UMG-28740 would need to form its stars at faster rates than predicted by theoretical models.
Acknowledgements
Based on observations with the NASA/ESA/CSA James Webb Space Telescope obtained at the Space Telescope Science Institute, which is operated by the Association of Universities for Research in Astronomy, Incorporated, under NASA contract NAS5-03127. The authors wish to recognize and acknowledge the very significant cultural role and reverence that the summit of Maunakea has always had within the indigenous Hawaiian community. We are most fortunate to have the opportunity to conduct observations from this mountain. This work is based in part on observations made with the NASA/ESA Hubble Space Telescope and with the NASA/ESA/CSA James Webb Space Telescope from the Space Telescope Science Institute, which is operated by the Association of Universities for Research in Astronomy, Inc., under NASA contracts NAS 5–26555 and NAS 5-03127. SMUS and MCC acknowledge support from the National Science Foundation through grant AST-1815475. BF acknowledges support from JWST-GO-02913.001-A. GW gratefully acknowledges support from the National Science Foundation through grant AST-2205189 and from HST program number GO-16300. This research was supported by the International Space Science Institute (ISSI) in Bern, through ISSI International Team project “Understanding the evolution and transitioning of distant proto-clusters into clusters". We also gratefully acknowledge the Lorentz Center in Leiden (NL) for facilitating discussions related to this project. MCC thanks Michael Boylan-Kolchin, Kristin Turney, and Lucas Cooper for helpful discussions related to this work. SMUS thanks Adam Carnall for additional support with BAGPIPES functionality.
References
- Antwi-Danso et al. (2023) Antwi-Danso J., et al., 2023, arXiv e-prints, p. arXiv:2307.09590
- Arrabal Haro et al. (2023a) Arrabal Haro P., et al., 2023a, Nature, 622, 707
- Arrabal Haro et al. (2023b) Arrabal Haro P., et al., 2023b, ApJ, 951, L22
- Bagley et al. (2023) Bagley M. B., et al., 2023, ApJ, 946, L12
- Baugh (2006) Baugh C. M., 2006, Reports on Progress in Physics, 69, 3101
- Beichman et al. (2012) Beichman C. A., Rieke M., Eisenstein D., Greene T. P., Krist J., McCarthy D., Meyer M., Stansberry J., 2012, in Clampin M. C., Fazio G. G., MacEwen H. A., Oschmann Jacobus M. J., eds, Society of Photo-Optical Instrumentation Engineers (SPIE) Conference Series Vol. 8442, Space Telescopes and Instrumentation 2012: Optical, Infrared, and Millimeter Wave. p. 84422N, doi:10.1117/12.925447
- Boylan-Kolchin (2023) Boylan-Kolchin M., 2023, Nature Astronomy, 7, 731
- Bruzual & Charlot (2003) Bruzual G., Charlot S., 2003, MNRAS, 344, 1000
- Calzetti et al. (2000) Calzetti D., Armus L., Bohlin R. C., Kinney A. L., Koornneef J., Storchi-Bergmann T., 2000, ApJ, 533, 682
- Carnall et al. (2018) Carnall A. C., McLure R. J., Dunlop J. S., Davé R., 2018, MNRAS, 480, 4379
- Carnall et al. (2023) Carnall A. C., et al., 2023, Nature, 619, 716
- Casey et al. (2023) Casey C. M., et al., 2023, arXiv e-prints, p. arXiv:2308.10932
- Chabrier (2003) Chabrier G., 2003, Publications of the Astronomical Society of the Pacific, 115, 763
- Chiang et al. (2013) Chiang Y.-K., Overzier R., Gebhardt K., 2013, ApJ, 779, 127
- Choi et al. (2016) Choi J., Dotter A., Conroy C., Cantiello M., Paxton B., Johnson B. D., 2016, The Astrophysical Journal, 823, 102
- Chworowsky et al. (2023) Chworowsky K., et al., 2023, arXiv e-prints, p. arXiv:2311.14804
- Conroy & Gunn (2010) Conroy C., Gunn J. E., 2010, ApJ, 712, 833
- Conroy et al. (2009) Conroy C., Gunn J. E., White M., 2009, ApJ, 699, 486
- Cooper et al. (2012) Cooper M. C., Newman J. A., Davis M., Finkbeiner D. P., Gerke B. F., 2012, spec2d: DEEP2 DEIMOS Spectral Pipeline, Astrophysics Source Code Library, record ascl:1203.003 (ascl:1203.003)
- Cooray et al. (2014) Cooray A., et al., 2014, ApJ, 790, 40
- Croton et al. (2006) Croton D. J., et al., 2006, MNRAS, 365, 11
- Davidzon et al. (2017) Davidzon I., et al., 2017, A&A, 605, A70
- De Lucia et al. (2024) De Lucia G., Fontanot F., Xie L., Hirschmann M., 2024, arXiv e-prints, p. arXiv:2401.06211
- Dekel et al. (2023) Dekel A., Sarkar K. C., Birnboim Y., Mandelker N., Li Z., 2023, MNRAS, 523, 3201
- Dotter (2016) Dotter A., 2016, The Astrophysical Journal Supplement Series, 222, 8
- Faber et al. (2003) Faber S. M., et al., 2003, in Iye M., Moorwood A. F. M., eds, Society of Photo-Optical Instrumentation Engineers (SPIE) Conference Series Vol. 4841, Instrument Design and Performance for Optical/Infrared Ground-based Telescopes. pp 1657–1669, doi:10.1117/12.460346
- Finkelstein et al. (2023) Finkelstein S. L., et al., 2023, ApJ, 946, L13
- Forrest et al. (2020a) Forrest B., et al., 2020a, ApJ, 890, L1
- Forrest et al. (2020b) Forrest B., et al., 2020b, ApJ, 903, 47
- Forrest et al. (2022) Forrest B., et al., 2022, ApJ, 938, 109
- Glazebrook et al. (2017) Glazebrook K., et al., 2017, Nature, 544, 71
- Glazebrook et al. (2024) Glazebrook K., et al., 2024, Nature, 628, 277
- Grogin et al. (2011) Grogin N. A., et al., 2011, ApJS, 197, 35
- Jin et al. (2019) Jin S., et al., 2019, ApJ, 887, 144
- Koekemoer et al. (2011) Koekemoer A. M., et al., 2011, ApJS, 197, 36
- Kriek et al. (2009) Kriek M., van Dokkum P. G., Labbé I., Franx M., Illingworth G. D., Marchesini D., Quadri R. F., 2009, ApJ, 700, 221
- Kroupa & Boily (2002) Kroupa P., Boily C. M., 2002, MNRAS, 336, 1188
- Labbé et al. (2023) Labbé I., et al., 2023, Nature, 616, 266
- Leja et al. (2017) Leja J., Johnson B. D., Conroy C., van Dokkum P. G., Byler N., 2017, ApJ, 837, 170
- Ma et al. (2015) Ma J., et al., 2015, ApJ, 812, 88
- Marsan et al. (2017) Marsan Z. C., Marchesini D., Brammer G. B., Geier S., Kado-Fong E., Labbé I., Muzzin A., Stefanon M., 2017, The Astrophysical Journal, 842, 21
- Marsan et al. (2022) Marsan Z. C., et al., 2022, The Astrophysical Journal, 924, 25
- Martin et al. (2015) Martin C. L., Dijkstra M., Henry A., Soto K. T., Danforth C. W., Wong J., 2015, ApJ, 803, 6
- Murray (2014) Murray S., 2014, HMF: Halo Mass Function calculator, Astrophysics Source Code Library, record ascl:1412.006
- Muzzin et al. (2013a) Muzzin A., et al., 2013a, ApJS, 206, 8
- Muzzin et al. (2013b) Muzzin A., et al., 2013b, ApJ, 777, 18
- Naidu et al. (2022) Naidu R. P., et al., 2022, arXiv e-prints, p. arXiv:2208.02794
- Nanayakkara et al. (2024) Nanayakkara T., et al., 2024, Scientific Reports, 14, 3724
- Nelson et al. (2018) Nelson D., et al., 2018, MNRAS, 475, 624
- Nelson et al. (2019) Nelson D., et al., 2019, Computational Astrophysics and Cosmology, 6, 2
- Newman et al. (2013) Newman J. A., et al., 2013, ApJS, 208, 5
- Pavesi et al. (2018) Pavesi R., et al., 2018, ApJ, 861, 43
- Planck Collaboration et al. (2016) Planck Collaboration et al., 2016, A&A, 594, A13
- Riechers et al. (2013) Riechers D. A., et al., 2013, Nature, 496, 329
- Riechers et al. (2017) Riechers D. A., et al., 2017, ApJ, 850, 1
- Riechers et al. (2020) Riechers D. A., et al., 2020, ApJ, 895, 81
- Rieke et al. (2003) Rieke M. J., et al., 2003, in Mather J. C., ed., Society of Photo-Optical Instrumentation Engineers (SPIE) Conference Series Vol. 4850, IR Space Telescopes and Instruments. pp 478–485, doi:10.1117/12.489103
- Sánchez-Blázquez et al. (2006) Sánchez-Blázquez P., et al., 2006, MNRAS, 371, 703
- Schreiber et al. (2018) Schreiber C., et al., 2018, A&A, 618, A85
- Stefanon et al. (2015) Stefanon M., et al., 2015, ApJ, 803, 11
- Stefanon et al. (2017) Stefanon M., et al., 2017, ApJS, 229, 32
- Steinhardt et al. (2016) Steinhardt C. L., Capak P., Masters D., Speagle J. S., 2016, ApJ, 824, 21
- Strandet et al. (2017) Strandet M. L., et al., 2017, ApJ, 842, L15
- Sun et al. (2023) Sun G., Faucher-Giguère C.-A., Hayward C. C., Shen X., Wetzel A., Cochrane R. K., 2023, The Astrophysical Journal Letters, 955, L35
- Urbano Stawinski et al. (2024) Urbano Stawinski S. M., et al., 2024, MNRAS, 528, 5624
- Valentino et al. (2020) Valentino F., et al., 2020, ApJ, 889, 93
- Valentino et al. (2023) Valentino F., et al., 2023, ApJ, 947, 20
- Verhamme et al. (2008) Verhamme A., Schaerer D., Atek H., Tapken C., 2008, A&A, 491, 89
- Walter et al. (2012) Walter F., et al., 2012, Nature, 486, 233
- Weaver et al. (2023) Weaver J. R., et al., 2023, A&A, 677, A184
- Weibel et al. (2024) Weibel A., et al., 2024, arXiv e-prints, p. arXiv:2403.08872
- Weiner et al. (2006) Weiner B. J., et al., 2006, ApJ, 653, 1027
- Williams et al. (2019) Williams C. C., et al., 2019, ApJ, 884, 154
- Wright et al. (2017) Wright A. H., et al., 2017, Monthly Notices of the Royal Astronomical Society, 470, 283
- Xiao et al. (2023) Xiao M., et al., 2023, arXiv e-prints, p. arXiv:2309.02492
- Xie et al. (2024) Xie L., et al., 2024, arXiv e-prints, p. arXiv:2402.01314
- Zavala et al. (2018) Zavala J. A., et al., 2018, Nature Astronomy, 2, 56
- de Graaff et al. (2024) de Graaff A., et al., 2024, arXiv e-prints, p. arXiv:2404.05683