[1]\fnmJacek \surWasik
[1]\fnmRoss \surSpringell
1]\orgdivIAC, School of Physics, \orgnameUniversity of Bristol, \orgaddress\streetTyndall Avenue, \cityBristol, \postcodeBS8 1TL, \stateAvon, \countryUK
2]\orgnameICSM, \orgaddress\streetBagnols-sur-Cèze, \citySite de Marcoule, \postcode30207, \countryFrance
3]\orgnameDepartment of Materials, \orgnameUniversity of Oxford \orgaddress\street21 Banbury Road, \cityOxford, \postcodeOX2 6NN, \countryUK
4]\orgnameEuropean Synchrotron Radiation Facility, \orgaddress\street71 Avenue des Martyrs, \cityGrenoble, \postcode38000, \countryFrance
5]\orgnameOak Ridge National Laboratory, \orgaddress\street1 Bethel Valley Road, \cityOak Ridge, \postcodeTN 37831, \countryUS
Polyepitaxial grain matching to study the oxidation of uranium dioxide
Abstract
Although the principal physical behaviour of a material is inherently connected to its fundamental crystal structure, the behaviours observed in the real-world are often driven by the microstructure, which for many polycrystalline materials, equates to the size and shape of the constituent crystal grains. Here we highlight a cutting edge synthesis route to the controlled engineering of grain structures in thin films and the simplification of associated 3-dimensional problems to less complex 2D ones. This has been applied to the actinide ceramic, uranium dioxide, to replicate structures typical in nuclear fission fuel pellets, in order to investigate the oxidation and subsequent transformation of cubic UO2 to orthorhombic U3O8. This article shows how this synthesis approach could be utilised to investigate a range of phenomena, affected by grain morphology, and highlights some unusual results in the oxidation behaviour of UO2, regarding the phase transition to U3O8.
keywords:
Polyepitaxy, Uranium oxides, Oxidation1 Introduction
The nature of grains and grain boundaries is crucial to our understanding of the behaviour of polycrystalline materials [1, 2, 3, 4]. The relationship between these defect dense regions and the misaligned crystal grains can be affected by geometries, such as tilt and twist angles, and by impurities, which tend to precipitate and segregate [5, 6]. All this complexity can have dramatic consequences on critical properties, such as mechanical strength, electrical and thermal conductivities, and corrosion resistance [5, 6, 7, 8, 9, 10]. In this paper, we demonstrate an approach to controlled grain engineering, which reduces a three dimensional problem to two dimensions, yielding new results in an important applied materials system in the nuclear industry.
Uranium dioxide is the most prevalent fission fuel and is used world-wide in over 400 nuclear reactors [11]. Typical fuel pellets are small cylinders of 1 cm height and diameter and are placed inside fuel pins several metres long. There are tens of thousands of fuel pins in a reactor core, resulting in more than 10 million fuel pellets in an average, water-moderated reactor [11]. This means that there are more than 30,000 tonnes of UO2 fuel currently in operation. This fuel is most commonly manufactured by sintering powdered UO2 at high temperature and pressure to achieve densities approaching 97% [12].
During operation the fission process causes severe structural transformations, driven by the kinetic energy of daughter nuclei and emitted neutrons. There is an enormous amount of heat deposited in the fuel pellets, which is transported away by the coolant in the core, however, the fundamental thermal conductivity of UO2 is particularly poor and this results in large thermal gradients across only a few mm. Centreline temperatures can reach C with the outer edge of the fuel pellet just a 300∘C [13]. These effects cause grain growth in the centre of the pellet, with average grain sizes of about 50 microns, becoming smaller radially outwards, down to an average size of 10 microns in the so-called rim-structure [14, 15, 12, 16, 17] (see Fig. 1A and 1C). The grain structure is particularly important in two crucial stages of the fuel lifetime; 1) affecting the thermal transport and migration of fission products during operation and 2) affecting oxidation and corrosion post-operation during interim and final storage, especially in aqueous environments. [14, 15, 12, 16, 17, 18, 19].
The use of thin film deposition techniques to synthesise fission fuel materials is gaining traction as a viable and, in some cases, preferred route for test and experimentation [20, 21]. The bulk fuel material is complex making it difficult to deconvolve the many contributing factors. Spent nuclear fuel presents even more of a problem as the handling of such highly radioactive material is only possible in a handful of specialist laboratories. A thin film approach to fuel synthesis creates a macroscopic surface with limited thickness, typically tens to hundreds of nanometres, where radioactivity levels are very low; a 100 nm thick, 1 cm2 sample is 1.5 Bq. It is then possible to control structural and chemical parameters, such as crystallographic orientation, strain, and stoichiometry [21]. We present a unique mode of growth that can engineer the grain size of high temperature ceramics, such as UO2, without requiring the extremely high temperatures required in bulk materials. This process relies on a 1:1 substrate match, combined with careful heat treatment and surface preparation of substrate materials, before deposition.
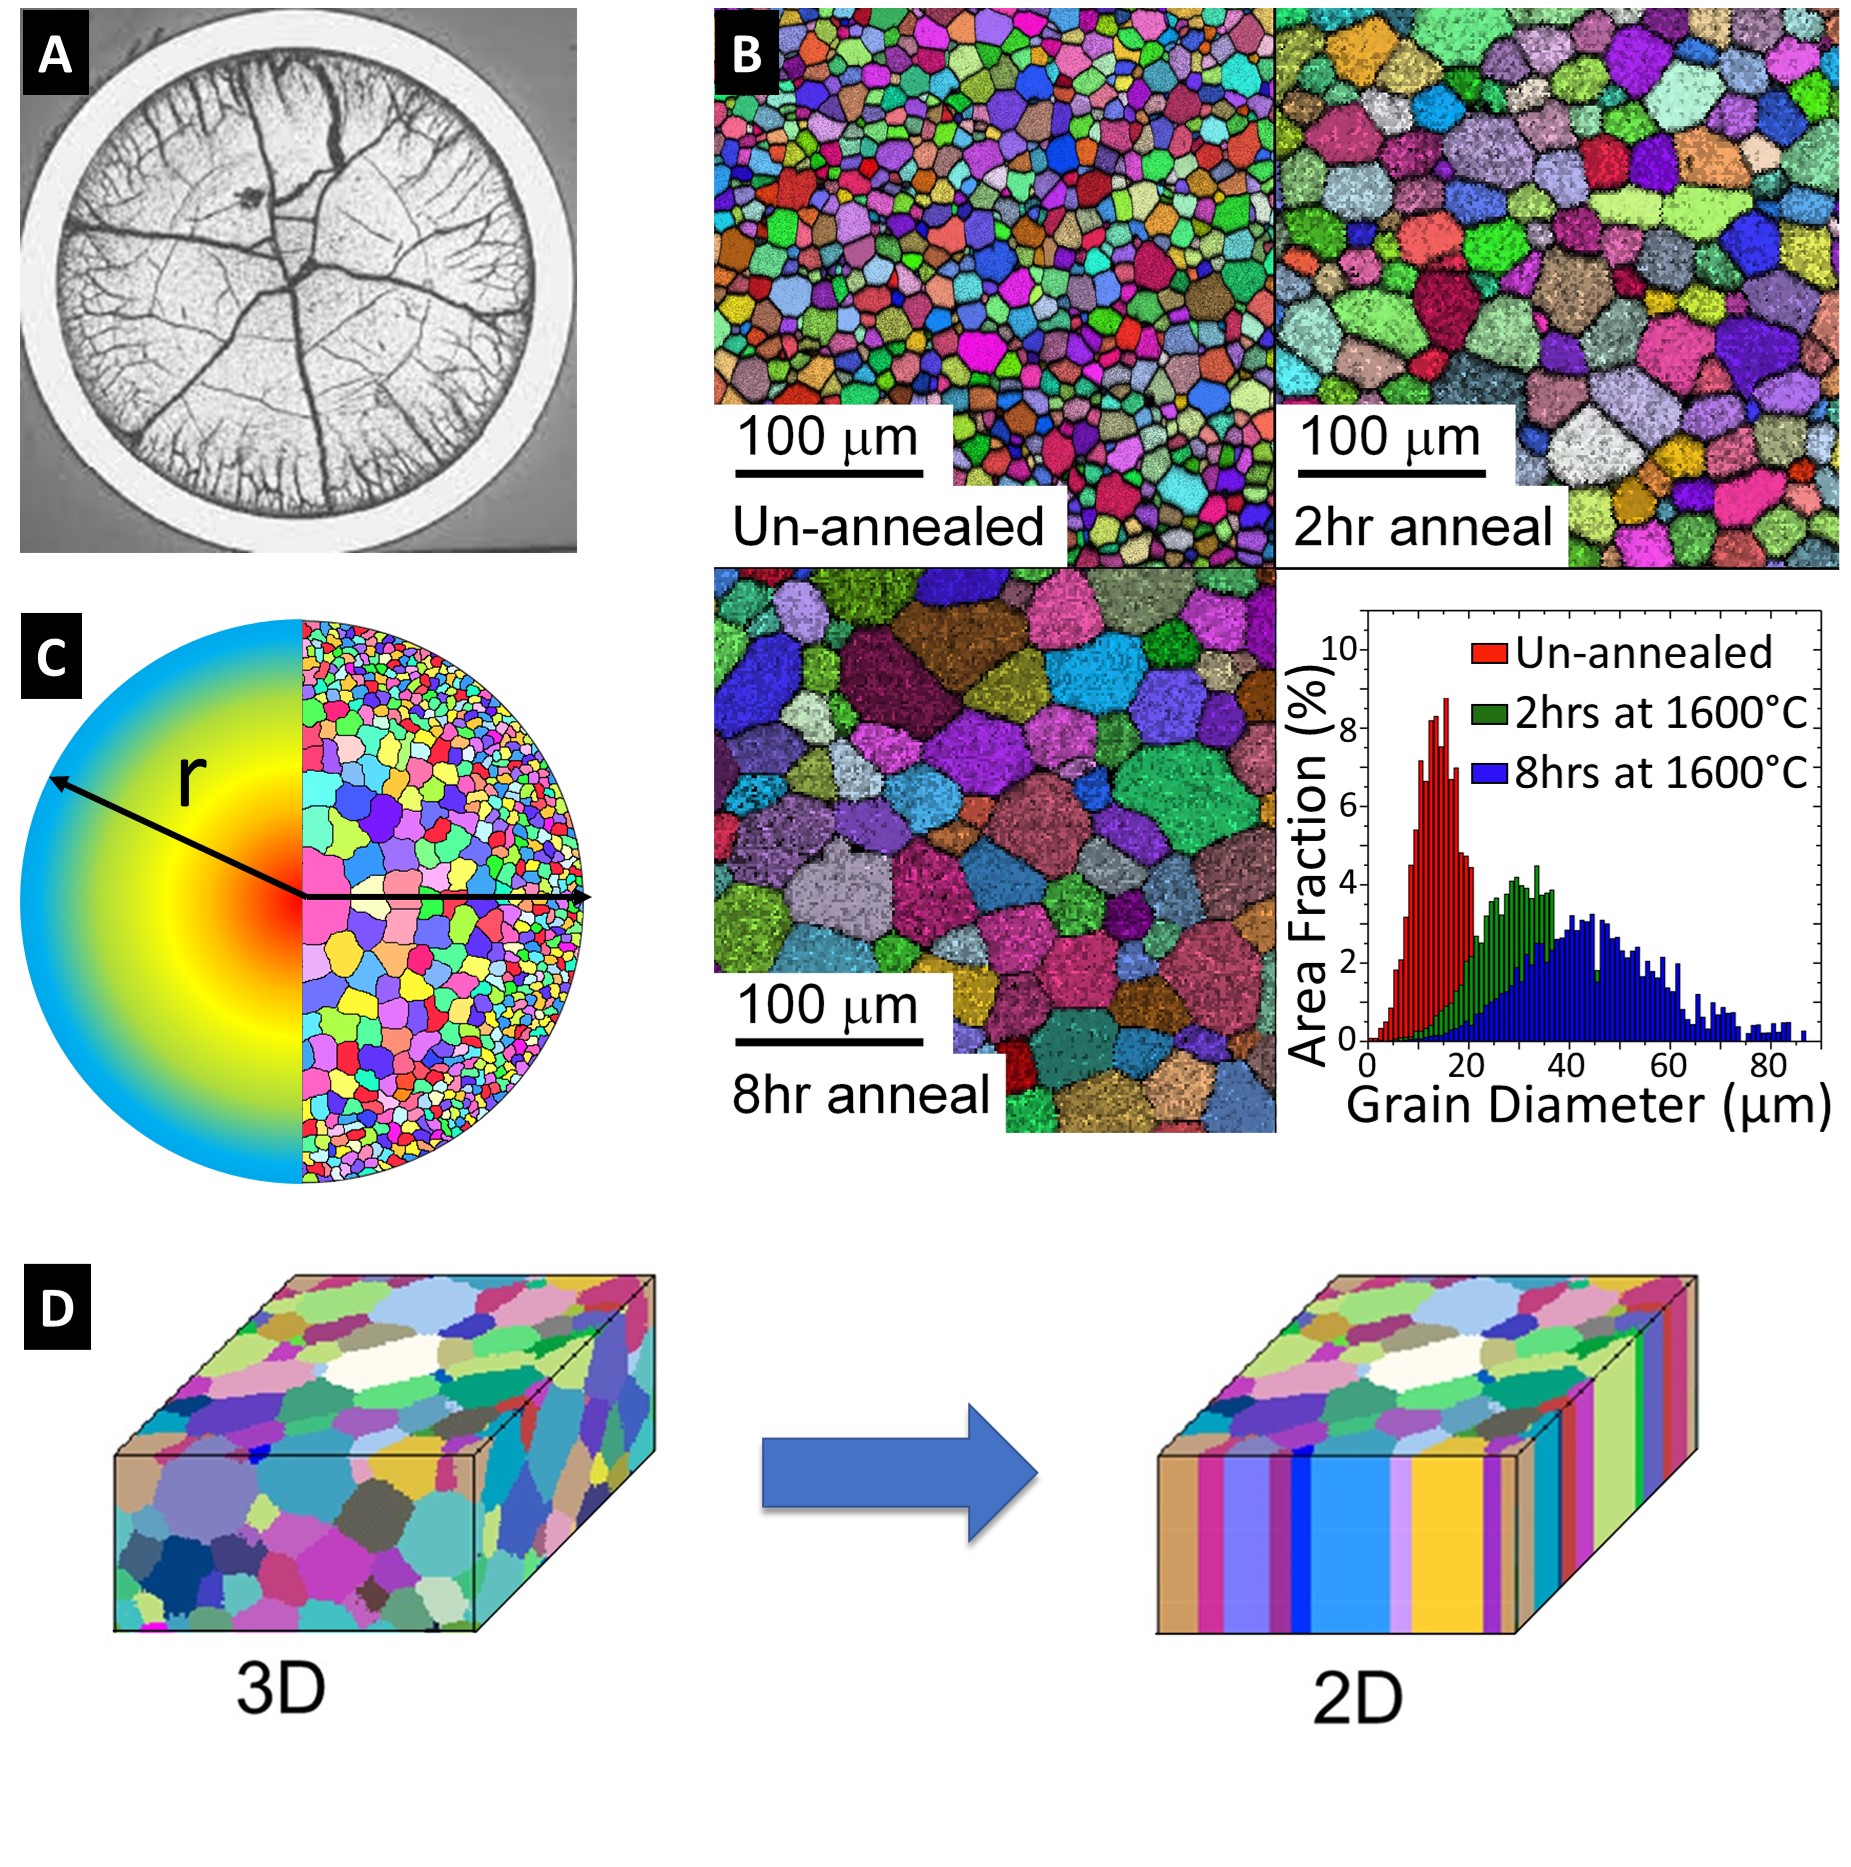
The pre-treatment of the substrate material can be used to selectively engineer desired average grain sizes (see Fig. 1C). The columnar-type growth of these epitaxial grains means that although the lateral grain dimensions mimic those of the underlying polycrystal, the in-plane microstructure is uniform along the growth direction. This approach has distinct advantages for any depth-dependent studies, as a complex 3D problem is effectively reduced to two dimensions (see Fig. 1D). This approach can be adapted to a wide variety of materials, where grain size-dependent effects are of interest. We have applied this method to uranium dioxide, which is most familiar in a small cylindrical sintered pellet form for nuclear fuel. Here we present the first images of UO2 synthesised in this way in order to investigate the grain orientation-dependent oxidation to U3O8. This process follows the oxidation sequence as: UO2 U4O9 U3O7 U3O8, with nucleation and growth kinetics [12, 22, 23, 24, 25, 26, 27, 28, 6, 10, 29].
This is of direct industrial interest in the initial processing and eventual disposal of nuclear fuel. The precise mechanism of UO2 oxidation is still not fully understood and there are outstanding questions regarding the transformation of UO2 to U3O8. Here we have discovered some peculiar results, which could shed light on a specific crystallographic route for this phase transition.
2 Results
2.1 Sample synthesis and grain engineering
The UO2/YSZ system (YSZ is yttria-stabilised zirconia) is an example of a 1:1, or so-called cube on cube matched epitaxial relationship, used to produce single crystal films to study surface and interfacial effects on pristine fuel material [30, 31]. The ability to match grains of UO2 onto YSZ is demonstrated in Fig. 1B, which shows electron-backscatter images from the surface of 100 nm polycrystalline films of stoichiometric UO2, where the final deposited surface requires no further mechanical treatment (avoiding possible influence of mechanical polishing and defect formation), typically necessary to achieve high quality Electron Backscatter Diffraction (EBSD) patterns from bulk material. Polycrystalline substrates of YSZ were heat-treated and polished flat before reactive dc magnetron sputtering of UO2, which required no further treatment to get the observed patterns. The three samples shown here are chosen to represent three positions across a fuel pellet and have grain orientation distribution akin to that found in bulk material, but with average grain sizes of 14.20.2 m, 31.70.3 m and 45.80.4 m (errors here are represented by the standard error). In a bulk material any measurement of the surface properties that is any deeper than the first few atomic layers will be affected by the grain structure along the surface normal. Our polyepitaxial growth mechanism avoids these issues, creating columnar grains matched along the underlying YSZ grain directions, where the lateral grain structure remains constant as a function of depth (see Fig. 1D). This provides an ideal scenario to study and engineer grain effects for a wide range of materials properties. Here we focus on the effect of grain size, orientation and grain boundary volume on the oxidation of UO2.
2.2 X-ray diffraction investigation of oxidation process
The lattice parameter of the as-grown samples was 5.476(2)Å, similar to values reported for the bulk material [12, 32, 33, 34]. The polycrystalline character of the sample was confirmed by comparing measured integrated intensities with predicted structure factor intensities. Based on the (111) being the strongest intensity 100%, the measured values for (220) and (002) were 483% and 343%, with expected theoretical values 47% and 36% respectively, exhibiting minimal preferential texture. The lattice parameter as a function of x in the UO2+x system was observed to have non-Vegard character as reported by Elorrieta et al. [35]. The oxidation of polyepitaxial UO2 thin films was performed in two stages. In the first stage, the sample was exposed to 200 mbar of O2 at 150°C for 16 hours. (see supplementary data). The lattice constant first shrinks in the region below x = 0.13, and then slightly expands for 0.13 x 0.17 before shrinking again for x above 0.17. The final product at this stage was identified as tetragonal U3O7, as c is 1.9% longer than a [36, 37, 38]. No further oxidation was observed, as expected in this temperature range [22, 10].
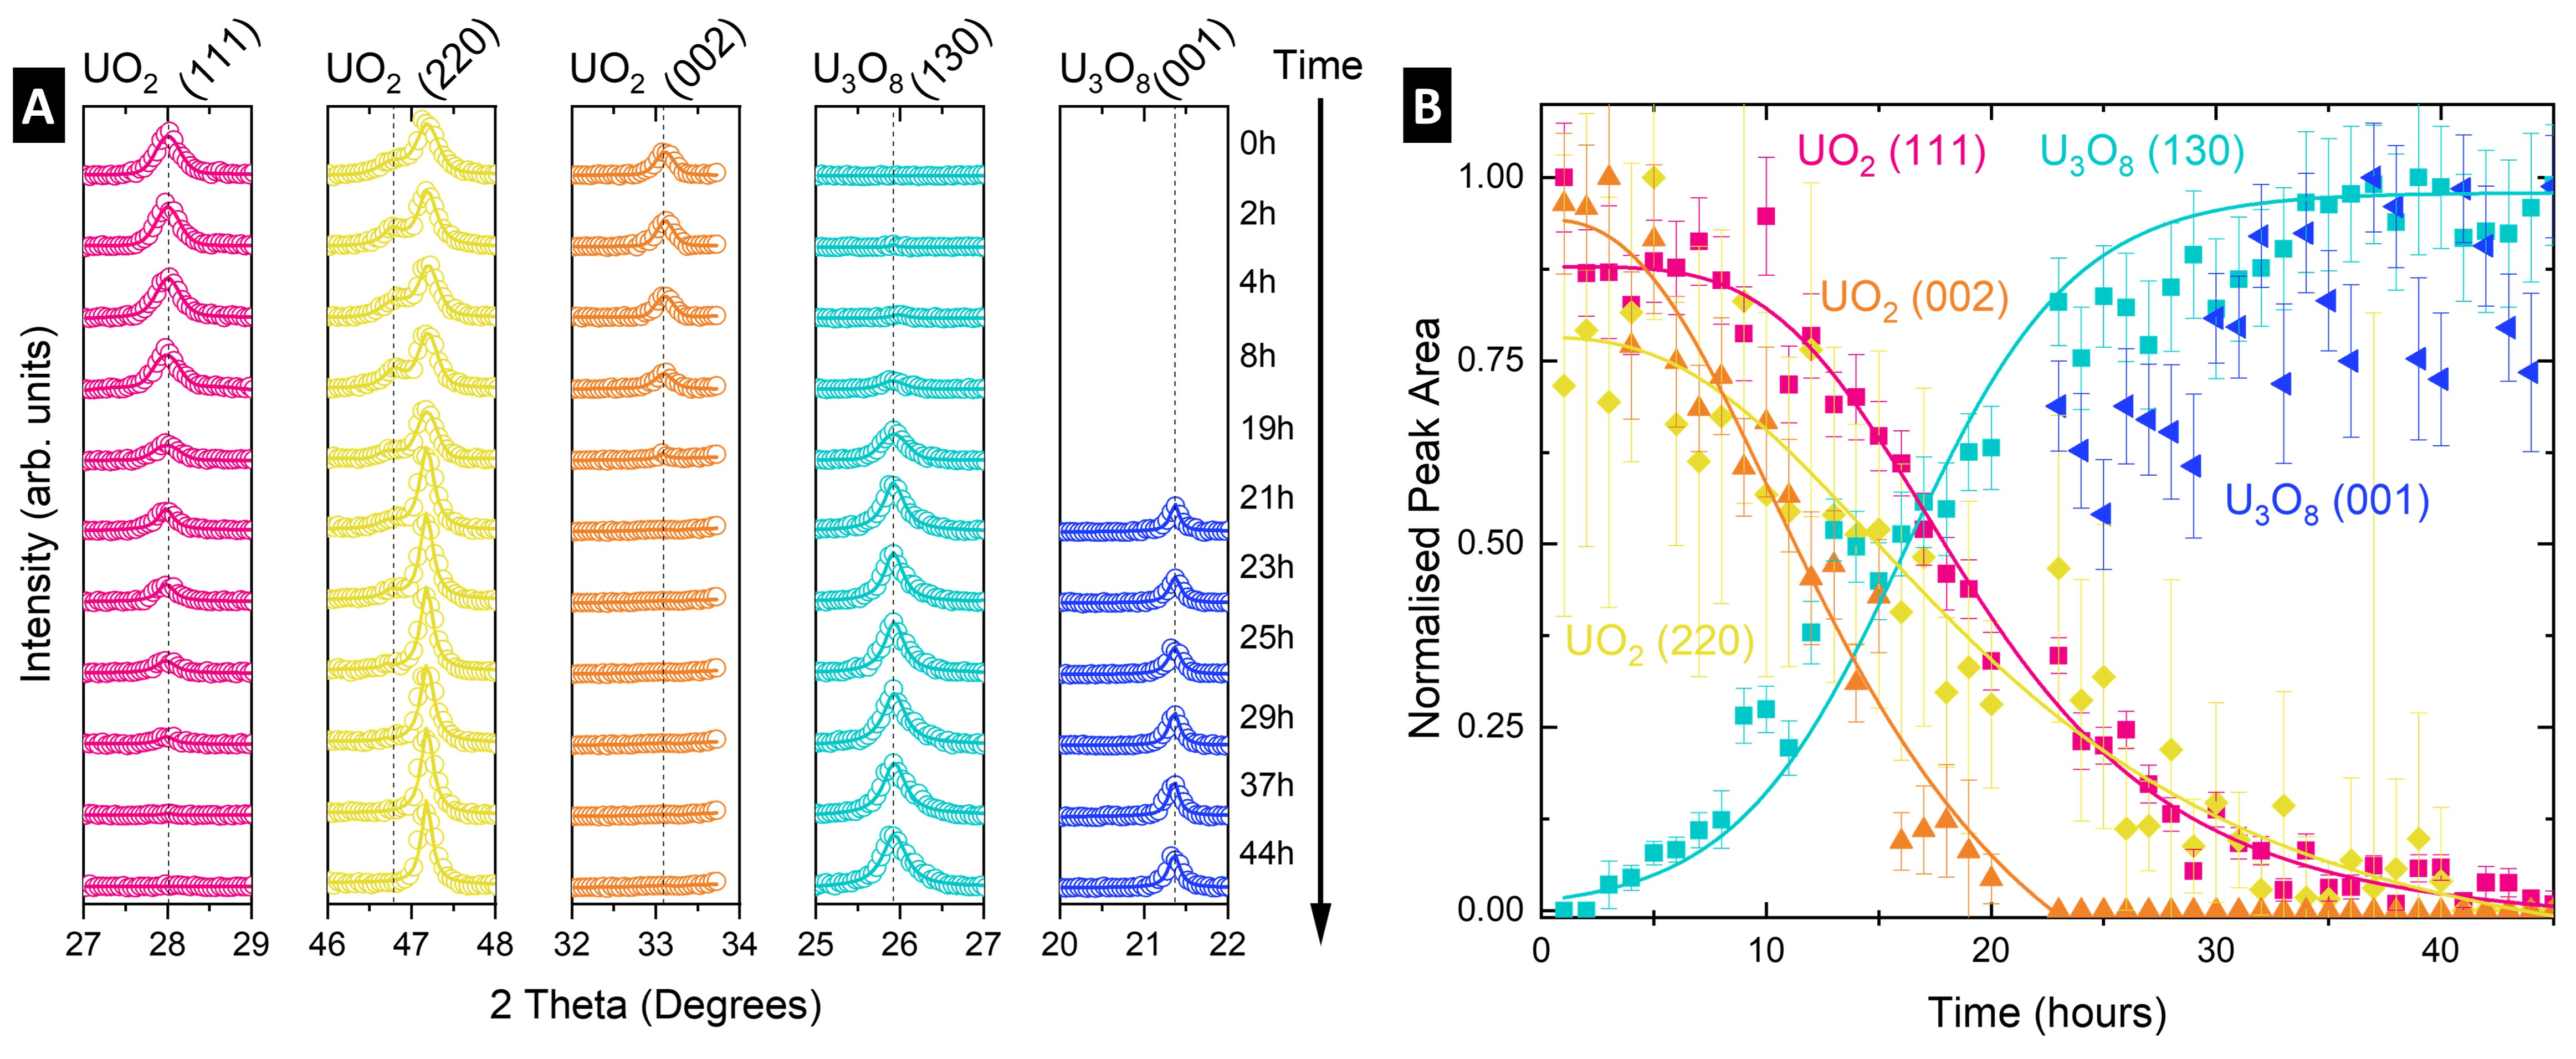
In the second stage of the experiment, the pressure of oxygen was kept constant at 200 mbar, and the temperature was increased to 300°C. The Longitudinal scans were collected every 0.5 hour for 48 hours, and a selection of these are shown in Fig. 2A. A general decrease in the intensity is observed for (111), (002) and (220) reflection assigned to the UO2+x structure as the cubic/tetragonal structure undergoes a phase transition to the orthorhombic structure of U3O8. This coincides with an increase in the observed intensities of the U3O8 reflections within the XRD pattern. To better illustrate this process, an area under each peak was extracted, normalised to the highest value and plotted against time as shown Fig. 2B.
The kinetics of oxidation from UO2+x to U3O8 presented in Fig. 2B. are in good agreement with the sigmoidal nucleation-and-growth mechanism described in literature for this phase transition [12, 39, 40, 22, 41, 42, 25]. The induction period, where the initial rate of oxidation is very low, takes place during first the 10 hours of the oxidation process. After this time, the oxidation rate gradually increases to a maximum, and this linear region [12] is observed from around 13 hours to 21 hours. When the reaction approaches completion, it tails off, finishing after 44 hours with the sample completely oxidised to U3O8.
Data presented here is in contradiction to what was reported by Allen et al. [23, 24], where the oxidation rate of UO2 was suggested to be highest for the [111] orientation due to epitaxial relations with U3O8, followed by [110] and slowest for [001]. The [001] oriented grains within the polyepitaxial sample oxidised quickest, and no UO2+x {002} reflection was observed after 23 hours. There is no significant difference between kinetics observed for the [111] and [110] oriented grains. This might suggest that there is potentially crystallographic relationship between the [001] orientation of UO2+x and orthorhombic U3O8.
2.3 In-situ electron observation of oxidation
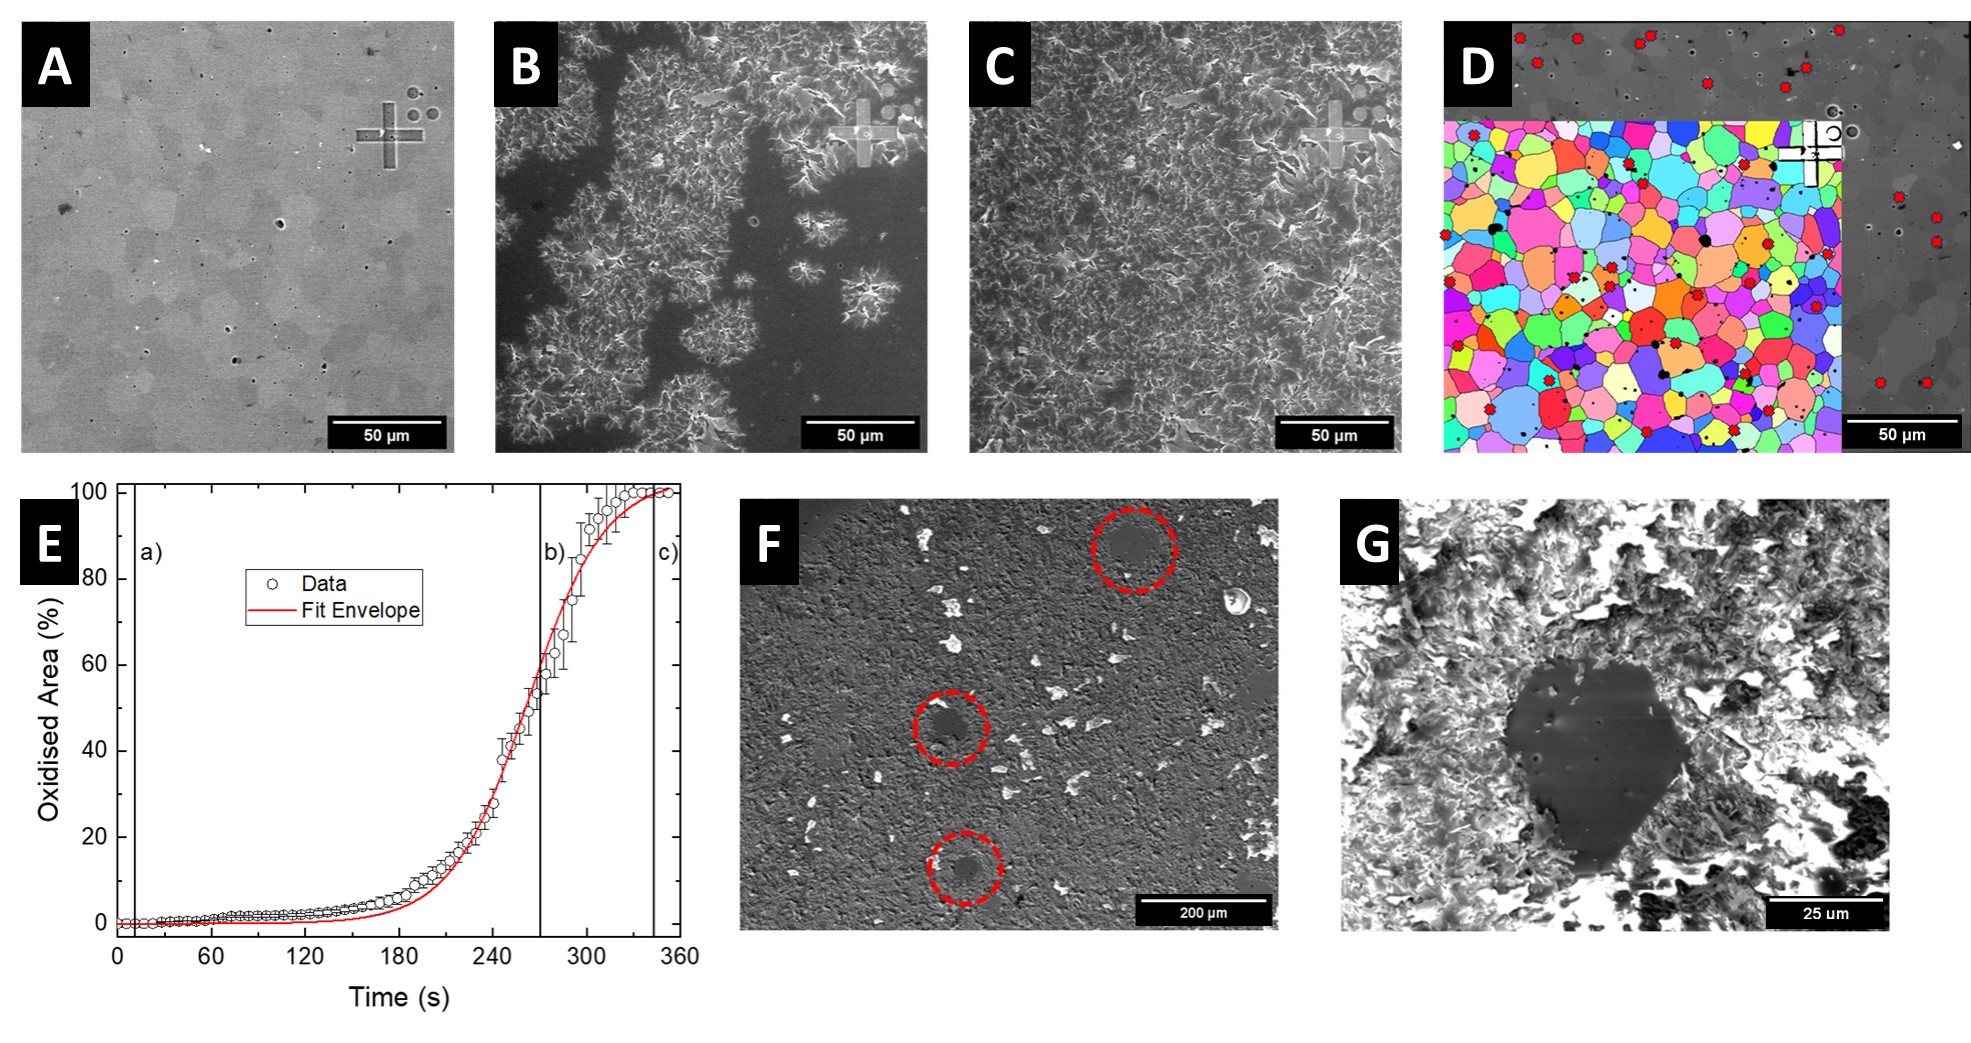
To further explore the potential of a polyepitaxial system, a UO2 sample was oxidised in-situ in a High Temperature Environmental Scanning Electron Microscope (HT-ESEM). Prior to oxidation an area of sample was marked and mapped using EBSD. Selected images taken during this in-situ oxidation experiment are shown in Fig. 3A-C. Clear cracking of the surface is observed as a result of the 36% volume expansion [12, 22, 29, 35] associated with transition to U3O8. The kinetics extracted from this process as the percentage of the damaged area to the entire area are provided in Fig. 3E. The characteristic nucleation and grow character is also independently observed in this experiment.
The ignition centers, observed as cracks related to oxidation, were extracted and are indicated by red markers on the overlay of SEM and EBSD maps in Fig. 3D. In 75% of cases the oxidation-related cracking was observed at the grain boundaries, which is expected and has been previously demonstrated that oxidation preferentially occurs along the grain boundaries, and then advances from boundary to the centre of the grains [12, 6]. This shows that faster oxidation rate correlate to regions of UO2 with higher grain boundary density. Post-oxidation examination of the sample revealed U3O8 grains within the polyepitaxial sample that did not disintegrate, Fig. 3F-G. This would suggest a unique crystallographic relationship between between UO2 and U3O8 along the UO2 [001] direction.
3 Discussion
The combined use of XRD, SEM and EBSD on polyepitaxial UO2 deposited onto specially engineered YSZ substrates has demonstrated that it is possible to mimic the grain structure of the nuclear fuel. This was achieved through different heat annealing treatments of the substrate producing similar variations in the grain size morphology of the thin film to that observed in pristine and irradiated sintered pellets of UO2. The polycrystalline character of the system, was confirmed by XRD. EBSD results showed that the grain size could be controlled within 10-50 m without needing to expose UO2 to high temperatures. Althought, other have discussed grain-to-grain epitaxy [43, 44] or domain-matching epitaxy [45], non has realised the power of this method to controllably engineer grain structure to study material properties in the way presented here. This new high-quality system with constant lateral grain structure, and ability to acquire desired grain boundary density by controlling the average grain size, could open new areas of further investigation.
Here we have used it to look at the UO2 U3O8 oxidation transformation. Data collected using in-situ XRD and SEM approaches has shown good agreement with the characteristic kinetics of the transition [12], and the importance of the grain boundary density [46, 47, 48, 49, 3]. The SEM data confirms recent simulation studies, were it has been shown that oxidation predominantly takes place along the grain boundaries before advancing from the boundaries towards the center of grains [6]. Our data shows that the [001] orientation is most readily oxidised, in contradiction to previous studies which report a [111][110][001] order of oxidation rate [23, 24]. The sample system demonstrated here can be used for further studies to confirm faster oxidation in fuel with finer grain due to the faster oxygen diffusion in the grain boundary [6, 3, 12].
Notably, although most grains transforming from UO2 to U3O8 experienced a high degree of disintegration due to the extreme volume expansion (36%), a small number of grains remained laterally unaffected, and appeared to expand along the surface normal. This suggests a possible crystallographic relationship between UO2 and U3O8 that needs further study.
4 Methods
4.1 Reactive DC magnetron sputtering
Polyepitaxial thin film samples were fabricated using reactive DC magnetron sputtering system at the FaRMS (Facility for Radioactive Materials Surfaces) at the University of Bristol [21]. The system operates at a base pressure of 1 x 10⁻¹⁰ mbar, with 5.5N argon used as the main sputtering gas at a pressure of 7.3 x 10⁻³ mbar. To grow polyepitaxial UO2 a depleted uranium target was used, and a partial pressure of 2 x 10⁻⁵ mbar of O2. Substrates were held at elevated temperature of 650°C to assist crystalline growth of UO2. With calibrated deposition rate, the growth time was controlled to achieve roughly a 100 nm thick layer of UO2 [21].
4.2 Substrate preparation
To investigate the effect of grain structure on UO2 oxidation, polyepitaxial UO2 thin films were grown on polycrystalline ceramic of yttrium stabilized zirconia (Y2O3)0.08(ZrO3)0.92 substrates obtained commercially from MTI Corporation, with dimensions 10 10 0.5 mm, polished to <100 Å root mean square (rms) roughness.
The structure of uranium dioxide is cubic fluorite, with space group of UO2 is Fmm, No. 225, with a lattice constant at room temperature 5.47 Å[12, 32, 33, 34]. A good match between the thin film and the substrate helps to reduce lattice strain and structural defects.
In the work of Bao et al. [50] a match between [001] oriented thin film of UO2 and the [001]-oriented substrates of calcium fluoride (CaF2) and lanthanum aluminate (LAO) was reported. The yttria-stabilized zirconia (YSZ) substrate to grow a [001] single crystal of UO2 was reported by Strehle et al. [30]. Later all three orientations [111], [110] and [001] of YSZ were used by Rennie et al. [31] to produce single crystals of UO2 for corrosion studies. In this project, YSZ was selected due to its suitability for surface preparation, given its ease of mechanical polishing and relatively straightforward induction of grain growth.
Lateral grain sizes of the YSZ substrates was increased by annealing them in a tube furnace. This process was carried out in air atmosphere, at 1600°C. The heating ramp rate was set to 15°C/min, and the same rate was used for cooling down. During heat treatment the roughness of the material increased due to changes in the grain size and shape, to obtain a smooth and clean surface, polishing and cleaning processes were applied.
To assist with the surface preparation process, annealed substrates were encapsulated in ClaroCit resin (Struers). The first stage of polishing process for one side polished YSZ was P1200, followed by P2500 and P4000 silicon carbide (SiC) abrasive papers (Buehler). Time needed for each step was between 3 minutes to 20 minutes, based on the surface quality assessment performed using an optical microscope. The polishers used during this stage were Buehler Metaserv, operated at speed of 600 rpm, with water flow. The ECOMET polishers were used in next stage. Diamond pastes with 3um, 1 um, 0.25 um and 0.1 um sizes were used, together with MetaDi fluid lubricant (Buehler). The three polishers with higher grades, use MasterTex polishing cloths fitted to a wheel, while the last one was fitted with MicroCloth. The last step of the polishing process involves use of a Vibro-Polisher (with 50 nm of Colloidal Silica), at medium vibration speed for 24 hours.
The initial cleaning stage involved ultrasonicating the substrate in a 500 ml beaker filled with 250 ml acetone for 1 hour to remove larger resin contaminants from the sample. Once this step was completed, the sample was rinsed with acetone and underwent an additional 45 minutes of ultrasonication in clean acetone. Subsequently, to further eliminate organic contaminants, the substrates were immersed in ethanol and subjected to ultrasonic treatment for one hour, then rinsed with ethanol. The same procedures were then repeated using isopropanol. Following the cleaning process with these three solvents, the surface was dried using a flow of warm, clean air to prevent residue buildup.
4.3 In-situ X-ray analysis
X-ray diffraction (XRD) measurements were performed using a Philips X’Pert PRO MPD diffractometer with a Cu-K source, configured for Bragg–Brentano diffraction geometry, with specialized mirror designed to reflect Cu-K away from the detector. The footprint width of the X-ray beam on the sample surface was 10 mm, and the incident programmable divergence slit, located 240 mm away from the sample, was set to 0.5°. The step size was 0.05° and counting time per step was 2s, with sample being held stationary. The in-situ oxidation experiment was performed utilizing the Anton Paar HTK 1200 high temperature environment chamber, each time at a constant oxygen pressure of 200 mbar. Lattice parameters were extracted using a least-squares fitting routine of Pseudo-Voigt peak profiles.
4.4 SEM characterization
The initial sample characterisation, including EBSD, measurement were conducted at an acceleration voltage of 30 keV and aperture of 120 m using Zeiss Sigma High Definition Variable Pressure Field Emission SEM with EDAX Electron Backscatter Diffraction detector. To analyse the data OIM AnalysisTM (EDAX) software was used. The same microscope was used to characterise sample surface post-oxidation.
The in-situ SEM oxidation experiment was performed using a HT-ESEM at the Institut de Chimie Separative de Marcoule (ICSM) in Marcoule, France, model: FEI Quanta 200 FEG ESEM, Thermo Fisher Scientific, Massachusetts, USA. The insertion was performed in air. Samples were heated under an atmosphere of 3.5 mbar of oxygen. Once the signs of the oxidation were visible, temperature was held constant. The sample regions underwent continuous monitoring throughout the entire duration of the experiment, with images being recorded at intervals of 3 to 5 seconds. All pictures were recorded with the same magnification of x250, corresponding to an area of 512 x 470 m2.
Fiji ImageJ [51] software, with in-built functions, was used to analyse the surface changes during the sample treatment. The sample surface cracking due to oxidation and further expansion of the crack propagation was monitored by measuring the percentage of the damaged surface to the entire ROI. The background of each photo was generated using a Gaussian-blurred version of the image and then subtracting it from the original. To enhance the contrast between the oxidised and the pristine areas of the sample, a series of find edges and smooth functions were used. In the next step Gaussian-blurred or Medina filters were applied.
Data Availability
The data will be available in the University’s Data Repository in a form suitable for long-term retention and wider publication. Available from the corresponding author upon request.
Acknowledgements
This research was supported by the Bristol Centre for Functional Nanomaterials, Centre for Doctoral Training, the University of Bristol Facility for Radioactive Materials Surfaces (FaRMS), funded by the UK Engineering and Physical Sciences Research Council [EP/V035495/1], and the TRANSCEND consortium on nuclear waste and decommissioning, also funded by the UK Engineering and Physical Sciences Research Council [EP/S01019X/1].
Author Contributions
JW - Conceptualisation, substrate preparation, sample fabrication, EBSD data collection and analysis, in-situ XRD experiment and data analysis, SEM data collection and analysis, HT-ESEM data analysis, figures, original draft preparation JS - substrate preparation, sample preparation, EBSD data collection and analysis RP - In-situ HT-ESEM data collection and analysis JL - sample preparation, XRD data collection, RS - Conceptualisation, data analysis, supervision, manuscript review and editing All authors discussed and contributed to the writing of the paper.
Competing Interests
The authors declare no competing interests.
References
- \bibcommenthead
- [1] Clarke, D. R. Grain boundaries in polycrystalline ceramics. Annual Review of Materials Science 17, 57–74 (1987).
- [2] Watanabe, T. Grain boundary engineering: historical perspective and future prospects. Journal of materials science 46, 4095–4115 (2011).
- [3] Cantwell, P. R. et al. Grain boundary complexion transitions. Annual Review of Materials Research 50, 465–492 (2020).
- [4] Krause, A. R. et al. Review of grain boundary complexion engineering: Know your boundaries. Journal of the American Ceramic Society 102, 778–800 (2019).
- [5] Yajima, S., Furuya, H. & Hirai, T. Lattice and grain-boundary diffusion of uranium in UO2. Journal of Nuclear Materials 20, 162–170 (1966).
- [6] Liu, M., Kang, Q. & Xu, H. Grain-scale study of the grain boundary effect on UO2 fuel oxidation and fission gas release under reactor conditions. Chemical Engineering Science 229, 116026 (2021).
- [7] Sabioni, A. C. S., Ferraz, W. B. & Millot, F. Effect of grain-boundaries on uranium and oxygen diffusion in polycrystalline UO2. Journal of nuclear materials 278, 364–369 (2000).
- [8] Millett, P. C., Tonks, M. R. & Biner, S. Grain boundary percolation modeling of fission gas release in oxide fuels. Journal of nuclear materials 424, 176–182 (2012).
- [9] Andersson, D. A. et al. Multiscale simulation of xenon diffusion and grain boundary segregation in UO2. Journal of Nuclear Materials 462, 15–25 (2015).
- [10] Lim, H. C. et al. Effects of microstructural constraints on the transport of fission products in uranium dioxide at low burnups. Journal of Nuclear Materials 477, 24–36 (2016).
- [11] Bayraktar, M. & Pamik, M. Nuclear power utilization as a future alternative energy on icebreakers. Nuclear Engineering and Technology 55, 580–586 (2023).
- [12] McEachern, R. J. & Taylor, P. A review of the oxidation of uranium dioxide at temperatures below 400 c. Journal of Nuclear Materials 254, 87–121 (1998).
- [13] Wilson, P. The Nuclear Fuel Cycle: From Ore to Wastes Oxford science publications (Oxford University Press, 1996). URL https://books.google.co.uk/books?id=dGhTAAAAMAAJ.
- [14] Devanathan, R. et al. Modeling and simulation of nuclear fuel materials. Energy & Environmental Science 3, 1406–1426 (2010).
- [15] Suzuki, M., Sugiyama, T. & Fuketa, T. Thermal stress analysis of high-burnup lwr fuel pellet pulse-irradiated in reactivity-initiated accident conditions. Journal of nuclear science and technology 45, 1155–1164 (2008).
- [16] Sonoda, T. et al. Transmission electron microscopy observation on irradiation-induced microstructural evolution in high burn-up UO2 disk fuel. Nuclear Instruments and Methods in Physics Research Section B: Beam Interactions with Materials and Atoms 191, 622–628 (2002).
- [17] Spino, J., Vennix, K. & Coquerelle, M. Detailed characterisation of the rim microstructure in pwr fuels in the burn-up range 40–67 gwd/tm. Journal of Nuclear Materials 231, 179–190 (1996).
- [18] Shoesmith, D. W. Fuel corrosion processes under waste disposal conditions. Journal of Nuclear Materials 282, 1–31 (2000).
- [19] Springell, R. et al. Water corrosion of spent nuclear fuel: radiolysis driven dissolution at the UO2/water interface. Faraday Discussions 180, 301–311 (2015).
- [20] Vallejo, K. D. et al. Advances in actinide thin films: synthesis, properties, and future directions. Reports on Progress in Physics (2022).
- [21] Springell, R. et al. A review of uranium-based thin films. Advances in Physics 1–79 (2023).
- [22] Rousseau, G. et al. A detailed study of UO2 to U3O8 oxidation phases and the associated rate-limiting steps. Journal of nuclear materials 355, 10–20 (2006).
- [23] Allen, G., Tempest, P. & Tyler, J. The formation of U3O8 on crystalline UO2. Philosophical Magazine B 54, L67–L71 (1986).
- [24] Allen, G. C., Tempest, P. A. & Tyler, J. W. Oxidation of crystalline UO2 studied using x-ray photoelectron spectroscopy and x-ray diffraction. Journal of the Chemical Society, Faraday Transactions 1: Physical Chemistry in Condensed Phases 83, 925–935 (1987).
- [25] Allen, G. & Holmes, N. A mechanism for the UO2 to -U3O8 phase transformation. Journal of Nuclear Materials 223, 231–237 (1995).
- [26] Geønvold, F. & Haraldsen, H. Oxidation of uranium dioxide (UO2). Nature 162, 69–70 (1948).
- [27] Leinders, G. et al. Low-temperature oxidation of fine UO2 powders: A process of nanosized domain development. Inorganic Chemistry 55, 3915–3927 (2016).
- [28] Idriss, H. Surface reactions of uranium oxide powder, thin films and single crystals. Surface Science Reports 65, 67–109 (2010).
- [29] Quémard, L. et al. On the origin of the sigmoid shape in the UO2 oxidation weight gain curves. Journal of the European Ceramic Society 29, 2791–2798 (2009).
- [30] Strehle, M. M. et al. Characterization of single crystal uranium-oxide thin films grown via reactive-gas magnetron sputtering on yttria-stabilized zirconia and sapphire. Thin Solid Films 520, 5616–5626 (2012).
- [31] Rennie, S. et al. The role of crystal orientation in the dissolution of UO2 thin films. Corrosion science 145, 162–169 (2018).
- [32] Barrett, S., Jacobson, A., Tofield, B. & Fender, B. The preparation and structure of barium uranium oxide BaUO3+X. Acta Crystallographica Section B: Structural Crystallography and Crystal Chemistry 38, 2775–2781 (1982).
- [33] Swanson, H. E. Standard X-ray diffraction powder patterns Vol. 25 (US Department of Commerce, National Bureau of Standards, 1955).
- [34] Desgranges, L., Baldinozzi, G., Rousseau, G., Niepce, J.-C. & Calvarin, G. Neutron diffraction study of the in situ oxidation of UO2. Inorganic chemistry 48, 7585–7592 (2009).
- [35] Elorrieta, J., Bonales, L., Rodríguez-Villagra, N., Baonza, V. & Cobos, J. A detailed raman and x-ray study of UO2+X oxides and related structure transitions. Physical Chemistry Chemical Physics 18, 28209–28216 (2016).
- [36] Smith, D., Scheetz, B., Anderson, C. A. & Smith, K. Phase relations in the uranium-oxygen-water system and its significance on the stability of nuclear waste forms. Uranium 1, 79–111 (1982).
- [37] Leinders, G. et al. Assessment of the U3O7 crystal structure by x-ray and electron diffraction. Inorganic chemistry 55, 9923–9936 (2016).
- [38] Leinders, G. et al. Charge localization and magnetic correlations in the refined structure of U3O7. Inorganic Chemistry 60, 10550–10564 (2021).
- [39] Aronson, S., Roof Jr, R. & Belle, J. Kinetic study of the oxidation of uranium dioxide. The Journal of Chemical Physics 27, 137–144 (1957).
- [40] Hoekstra, H., Santoro, A. & Siegel, S. The low temperature oxidation of UO2 and U4O9. Journal of Inorganic and Nuclear Chemistry 18, 166–178 (1961).
- [41] Desgranges, L., Baldinozzi, G., Simeone, D. & Fischer, H. Refinement of the -U4O9 crystalline structure: new insight into the U4O9→ U3O8 transformation. Inorganic chemistry 50, 6146–6151 (2011).
- [42] Walker, D. The oxidation of uranium dioxides. Journal of Applied Chemistry 15, 128–135 (1965).
- [43] Hwang, C., Geiss, R. H. & Howard, J. K. Imaging of the grain-to-grain epitaxy in nife/femn thin-film couples. Journal of applied physics 64, 6115–6117 (1988).
- [44] Bhat, A. P., Ramadurai, R. et al. Grain to grain epitaxy-like nano structures of (Ba, Ca)(ZrTi) O3/CoFe2O4 for magneto–electric based devices. ACS Applied Nano Materials 3, 11098–11106 (2020).
- [45] Estandía, S., Dix, N., Chisholm, M. F., Fina, I. & Sánchez, F. Domain-matching epitaxy of ferroelectric hf0. 5zr0. 5o2 (111) on la2/3sr1/3mno3 (001). Crystal Growth & Design 20, 3801–3806 (2020).
- [46] Campbell, T. K., Gilbert, E. R., White, G. D., Piepel, G. F. & Wrona, B. J. Oxidation behavior of nonirradiated UO2. Nuclear Technology 85, 160–171 (1989).
- [47] Taylor, P., Burgess, E. A. & Owen, D. G. An x-ray diffraction study of the formation of -UO2. 33 on UO2 pellet surfaces in air at 229 to 275° c. Journal of Nuclear Materials 88, 153–160 (1980).
- [48] Guenther, R. et al. Dry storage experience with spent fuel and high-level and transuranic wastes. Trans. Am. Nucl. Soc.;(United States) 46 (1984).
- [49] Campbell, T. K., Gilbert, E. R., Thornhill, C. K. & Wrona, B. J. Oxidation behavior of spent UO2 fuel. Nuclear Technology 84, 182–195 (1989).
- [50] Bao, Z. et al. Antiferromagnetism in UO2 thin epitaxial films. Physical Review B 88, 134426 (2013).
- [51] Schneider, C. A., Rasband, W. S. & Eliceiri, K. W. Nih image to imagej: 25 years of image analysis. Nature methods 9, 671–675 (2012).