Multi-Physics Numerical Analysis of Single-phase Immersion Cooling for Thermal Management of Li-Ion Batteries
Abstract
Battery thermal management systems (BTMSs) are critical for efficient and safe operation of lithium-ion batteries (LIBs), especially for fast charging/discharging applications that generate significant heating within the cell. Forced immersion cooling, where a dielectric fluid flows in direct contact with the LIB cells, is an effective cooling approach. But because of its complex nature, a thorough understanding of the underlying physics - including the coupled electrochemical, thermal, fluid, and mechanical effects - is required before immersion cooling will see wide adoption into commercial systems. Past research on immersion cooling focused mainly on the coupled thermal-fluid transport problem. But for a holistic assessment of immersion cooled LIB systems, electrochemical and thermal-fluid aspect should be considered simultaneously as both are interdependent. In this work, to investigate the performance of a LIB subjected to forced immersion cooling, we develop a fully coupled modeling approach that solves the detailed electrochemical model in conjunction with the thermal-fluid transport models for both the cell and fluid domain. After calculating the electrochemical and thermal responses, we also estimate the mechanical stresses within the cell generated due to the ion diffusion and temperature rise that impact reliability. To assess the effectiveness of forced immersion cooling, we evaluate several different configurations for a cylindrical 18650 battery cell (with Nickel Manganese Cobalt (NMC) cathode material) under varying cell discharge rates (1C, 3C & 5C). We compare forced immersion cooling for two liquids (deionized water and mineral oil) at three different fluid mass flow rates (0.0025, 0.0050 & 0.0100 kg/s). The liquid cooling results are compared to forced convection cooling with air (at a velocity of 0.3 m/s). As the electrochemical kinetics improve with increasing temperature, the thermal management goals for stability and reliability of the cell compete with the electrochemical performance goals. Specifically, with improved temperature control (lower temperatures), there is a higher capacity loss for a cell, but the lower temperatures and lower temperature variations during operation are expected to improve reliability. This highlights the strong cross-coupling of the electrochemical and heat transfer phenomena. Furthermore, a sensitivity analysis of dielectric fluid properties (i.e., density, thermal conductivity, specific heat, and viscosity) on the immersion cooling performance at a fixed mass flow rate and cell discharge rate suggest that the thermal conductivity and the specific heat capacity of the fluid have the most significant effects on temperature rise of the battery. By comparing results across fluids and flow rates, we define a new metric that can be used to compare the cooling capacity considering different flow parameters. Overall, this study provides insights that will be useful in the design of immersion cooling-based BTMSs including, for example, the selection of forced immersion cooling specifications (i.e., dielectric fluid and mass flow rate), such that the temperature is controlled without significant capacity loss. The newly defined metric for assessing performance accelerates system design by enabling physics-informed choices without computationally-expensive numerical simulations.
Index Terms:
Thermal Management, Li-Ion battery, Immersion cooling, Dielectric fluidI Introduction
Recently, the noticeable effects of climate change such as global warming, irregular weather patterns, and higher levels of air pollution have forced people to work towards sustainable growth without exploiting or decimating natural resources. One of the key strategies to achieve this is to reduce our reliance on non-renewable energy sources such as fossil fuels (i.e., oil, coal) in all areas [1]. As a result, electricity generation from renewable sources (such as solar, wind, and geothermal) is increasing significantly. Because of the transient nature of some of these sources (e.g., wind and solar) and the need for portable power in the transport sector, energy storage devices including batteries are now indispensable. For example, electric vehicles (EVs) ranging from cars to trucks are now ubiquitous on the roads. Lithium-ion batteries (LIBs) are one of the prominent energy storage technologies because of their high energy density, high power density, and other secondary considerations such as cost and lifetime [2, 3].
However, there are inherent thermal challenges that hinder efficient and safe functioning of LIBs. For example, fast charging/discharging rates lead to high operating temperatures that accelerate the degradation (aging) of the cells and increase the chances of catastrophic failure (thermal runaway). Additionally, lower working temperatures reduce the discharge capacity [2, 4], but can improve stability and lifetime. Previous studies have demonstrated that there is an optimum temperature range to circumvent the effects of extreme temperatures (i.e., high and low temperatures) in order to achieve the best performance for a lithium-ion battery cell [5]. Typically, the desired operational temperature (across a wide range of charging/discharging rates) is between 20∘C and 40∘C for efficient performance with a long lifespan [6]. Given the internal heat generation during normal operation and varying environmental conditions, an effective battery thermal management system (BTMS) becomes an integral part of a LIB system.
Battery thermal management systems (BTMSs) can be broadly categorized as active or passive. Active systems use forced fluid (liquid or gas) flow to remove heat, whereas passive systems store the heat in some media (such as phase change materials (PCMs) that store energy through melting) and release it at a later time (for PCMs, when re-solidifying) [7]. One of the most effective active cooling mechanisms is immersion cooling [8], where a fluid (usually a dielectric fluids to ensure electric insulation) comes in direct contact with the LIB cells to moves the heat out of the battery pack or module. There are primarily two categories of immersion cooling systems: static immersion cooling [9, 10] (where the LIBs are submerged in a static pool of dielectric fluid and fluid motion is due primarily to buoyancy effects) and forced immersion cooling [11, 12, 13] (where a dielectric fluid is circulated through the battery pack or module around each cell). From a heat transfer perspective, forced immersion cooling is expected to perform better than static immersion cooling because of the enhanced fluid flow rates, which result in higher cooling capacity, and the FIC should be less sensitive to driving conditions for EV applications.
Although forced immersion cooling is a promising candidate for an effective thermal management system, the design of these sophisticated systems requires a thorough understanding of the strong cross-coupling of the electrochemical, heat transfer, fluid flow, and mechanical effects. Previous studies have focused primarily on the thermal-fluid aspect with simple models (e.g, similar to Ohm’s Law of heat generation [11, 12, 14] or semi-empirical models [13]) to account for the electrochemistry that governs the rate of heat generation. Also, numerical work on immersion cooling has generally been restricted to low discharge rates ( 3C), which correspondingly have lower heat generation rates. The findings may not be relevant for fast-charging applications. Moreover, at higher discharge rates, the non-linearity becomes more prominent since temperature significantly influences the LIB electrochemical performance as has been demonstrated by studies [15, 16] that vary the ambient temperature and/or the convection heat transfer coefficients. This multiphysics coupling within the system demonstrates the need for a detailed and holistic approach to understanding the performance of immersion-cooled battery systems considering the coupling of temperature, electrochemistry, and heat generation. Typically, fully coupled multi-physics models are computationally expensive. Thus, for efficient design of such systems, rapid design estimates using physics-informed performance metrics to analytically compare different cooling solutions would accelerate the design process.
In the present study, we first develop a comprehensive numerical model that solves a detailed electrochemical model in conjunction with a 3D thermal-fluid model to investigate the impact of single-phase forced immersion cooling on the electrochemical performance and the thermal response. After calculating the electrochemical and thermofluid response, the potential for mechanical degradation is assessed by examining the resulting diffusion and thermal stresses. To get a thorough insight into the optimal design parameters for immersion cooling, different combinations of discharge rates, mass flow rates, and dielectric fluids are evaluated. Furthermore, the impact of the properties of the dielectric fluids (e.g., density, thermal conductivity, specific heat, and viscosity) on the battery system performance are evaluated through a detailed set of parametric sweeps. From these results, we identify and demonstrate the efficacy of using a newly proposed metric for analyzing the relative performance of forced immersion cooling configurations. Note that during charging/discharging of LIB cell same order of heat is generated [17] since the physical process is very similar (i.e., lithiationdelithiation of the electrodes) and usually the temperature rise is even slightly higher for the discharging process compared to charging operation for a given cooling system [16, 18]. For this reason, present study focuses on discharging process, however the findings of this study will be valid for immersion cooling of LIB cell irrespective of chargingdischarging operation since the underlying physics remain the same.
II Methodology
In this section, we first describe the details of the forced immersion cooling numerical model including the geometry (the LIB cell and domain for fluid flow), details of each sub-model (i.e, electrochemical, fluid-thermal & mechanical), and the parameters including material properties.
II-A Simulated Geometry
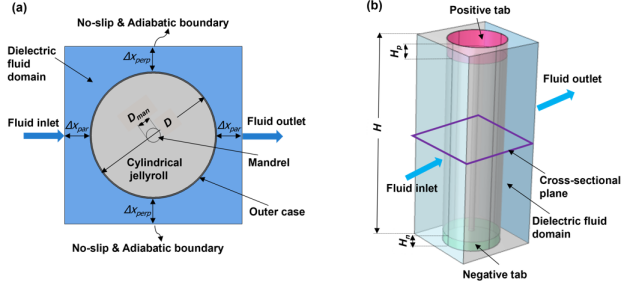
The forced immersion cooling geometry includes a single cylindrical LIB cell and the surrounding fluid domain (see Figure 1(a-b). The battery cell itself includes a cylindrical “jellyroll” (consisting of alternating layers of anode, cathode, and separator materials soaked with a liquid electrolyte) surrounding a central mandrel and enclosed in an outer case [19, 20]. Electrical connections are made at the top of the bottom of the cell where the current collectors for the cathodes and anodes inside the cell are connected to the outside of the case.
In the present study, an 18650 Nickel Manganese Cobalt (NCM)-based cylindrical LIB cell is selected for analysis, since NMC has one of the highest energy densities for LIB batteries [2]. Note that 18650 means that the cell diameter, , is 18 mm and the height, , is 65 mm. Chemical reactions, including those that generate heat, primarily occur within the jellyroll. Key geometrical parameters of the cylindrical cell include the mandrel diameter ( 2 mm), the outer case thickness ( 0.2 mm), the thickness of positive tab ( 5 mm), and the thickness of the negative tab ( 3 mm), which are estimated based from literature [21, 19].
The dielectric fluid domain is a cuboidal region around the cylindrical cell (see Figure 1 (b)). The fluid domain completely surrounds the lateral curved surface of the cell and the height of the flow domain is selected to be the same as the cell height, . Note that the dielectric fluid does not flow over the top of positive tab or below the negative tab for this analysis.111Note that the height of the fluid domain can also be taller than the cell height , which adds cooling directly to the top electrode (i.e., adding ‘tab cooling’). Results when including tab cooling are briefly discussed in Appendix B. The cross-section of flow domain, which governs the flow dynamics around the cell, is controlled by two key geometrical parameters: and , which are the minimum distances from the case surface to the wall in directions parallel (subscript ‘par’) and perpendicular (subscript ‘perp’) to the flow. In the present study, and are both chosen to be . Thus, the total volume of the simulated domain is or .
During operation (i.e., charge\discharge) of a LIB cell, electrochemical reactions occur within the active materials that make up the jellyroll. As the LIB operates, heat generated by these processes must diffuse (conduct) through the components that make up the cell and then dissipate by convection into the dielectric fluid at the surface of the cell. The cross-coupled nature of physics for electrochemistry, heat transfer, and fluid flow makes it challenging to estimate performance accurately without computationally-intensive numerical simulations.
| Description | Domain | Governing equation |
|---|---|---|
| Conservation of Li+ Species | Electrode | |
| Conservation of Li+ Species | Electrolyte | |
| Charge Conservation | Electrode | |
| Charge Conservation | Electrolyte | |
| Electrochemical Kinetics | Electrode-Electrolyte interface |
II-B Coupled Numerical Model for the Immersion Cooling Battery System
The following sub-sections discuss the modeling approach used here to understand the impact of immersion cooling on performance from electrochemical, thermal, and mechanics/reliability perspectives.
As mentioned in Section II-A, a LIB consists of a cylindrical jellyroll (which consists of a long sheet of cathode, anode, and separator pressed together wrapped around a mandrel) encased in an outer can that is sealed with a positive tab on top and a negative tab on the bottom. This geometry contains features across different length scales and integrates numerous thin layers of different materials with large aspect ratios. Thus, simplified models are needed for accurate, but efficient, analysis of the system.
Here, we develop a psuedo-two dimensional (P2D) electrochemical model (that models a single anode, cathode, and separator in order to represent the entire jellyroll domain), while the heat conduction and thermo-fluid models are fully three-dimensional. The simulation domain of the P2D model (i.e., the anode, separator, and cathode) is the building block of LIB and is arranged to achieve the geometry and performance of the cell. He et al. [22] demonstrated that assuming the cylindrical jellyroll to be a homogeneous region for the electrochemical model (instead of separate domains for the individual anode, separator, and cathode in 3D) does not significantly affect the accuracy of thermal analysis of a LIB.
II-B1 Electrochemical Model of the Battery Cell
In the present study, the electrochemical response of the battery cell is modeled following a Neumann pseudo-two dimensional (P2D) approach [23, 24]. The P2D model approximates the 3D cell as 1 anode-separator-cathode zone based on the total active electrode area. The simulation domain consists of a porous anode (LixC6, Graphite), a porous separator, and a porous cathode (LiNi1/3Co1/3Mn1/3O2 or ‘NMC’ for short). This domain is impregnated with a liquid electrolyte, which is a lithiated organic solution. During chargingdischarging of a cell, diffusion of Li+ ion occurs between two electrodes (i.e., cathode & anode) via electrolyte as well as within the electrodes, which eventually changes the electric potential of the cell. This phenomenon is simulated by conserving charge and species in the cell domain. All the equations except the diffusion of Li+ are solved in 1D along the thickness of the cell, whereas the diffusion equation in electrodes is solved in the radial direction of spherical coordinates as the active particles in electrode are assumed to be spherical.
| Geometric Details | ||||
| Parameter | Anode | Separator | Cathode | Ref |
| Layer Thickness, (m) | 80 | 25 | 73 | [21] |
| Layer Porosity, (-) | 0.3 | 0.4 | 0.3 | [21] |
| Particle Radius, (m) | 5 | N.A. | 5 | [21] |
| Volume Fraction of Active Particles, (-) | 0.662 | N.A. | 0.58 | [21] |
| Specific Surface Area, (1/m) | 3 | [21] | ||
| Bruggermann Exponent, | 1.5 | [21] | ||
| Electronic Conductivity, (S/m) | 10 | N.A. | 0.1 | [21] |
| Reference Reaction Rate, (m2.5mol-0.5s-1) | 2.32 | N.A. | 2.4177 | [25],[est1] |
| Reference Diffusion Coefficient, (m2s-1) | 1.4 | 2 | [21] | |
| Transference Number, | 0.363 | [21, 25] | ||
| Initial Li+ Concentration in Electrolyte, (mol/m3) | 1200 | [21, 26] | ||
| Maximum Li+ Concentration in the Electrodes, (mol/m3) | 30,900 | N.A. | 49,500 | [25] |
| Activation Energy for () (kJ/mol) | 30 | N.A. | 30 | [26] |
| Activation Energy for () (kJ/mol) | 68 | N.A. | 50 | [26] |
| Contact Resistance, ( cm2) | 6 | [26] | ||
| Electrode Area, (cm2) | 600 | [26] | ||
| 1Note that ‘est’ means that parameter is estimated by comparing numerical and experimental results. | ||||
Table I summarizes the governing equations for the P2D electrochemical model. Note that thermal effects are coupled to the electrochemical response through the temperature-dependent properties and heat generation rates using an approach similar to past research [27]. The thermal model is described in detail in Section II-B2 and provides spatial- and time-varying temperatures within the battery cell. All parameters and properties used in the P2D simulation are outlined in Table II along with the references from which it has been adopted. Note that throughout the simulations all the variables are estimated in appropriate SI units as described in the table. Key variables of interest in P2D model are the concentration of Li+ species in the solid phase of the porous electrodes () and the electrolyte (), the electric potential in solid phase of porous electrodes () and the electrolyte (), and the transfer current density ().
The transfer current density governs the electrochemical kinetics [28, 25, 29] at the electrode-electrolyte interface and are defined by the Butler-Volmer equation (see Table I). The transfer current density depends on the exchange current density (), which is a function of the Lithium concentration in electrodes and electrolyte:
| (1) |
where is the maximum possible concentration of Li+ in each electrodes (i.e., cathode & anode), is the Li+ concentration at the surface of electrode particles, and is the temperature dependent reaction rate for each electrode. Note that the transport and kinetic properties of anode and cathode in the P2D model are temperature-dependent, and their values are calculated using an Arrhenius-type equation:
| (2) |
where is the temperature-adjusted property (such as , , …) as a function of temperature (), is the value of the property at the reference temperature (), and is the activation energy. For the present study, is set at 298 K, which is the same as the initial temperature (). For the P2D approach, the temperature corresponds to the average temperature of the entire jellyroll domain calculated from the thermal model (see Eq. 6).
In the present study, electrolyte properties, such as the ionic conductivity () and the diffusion coefficient (), are concentration- and temperature-dependent [29, 30, 25]:
| (3) |
and
| (4) |
Effective ionic and transport properties of electrodes and electrolytes (i.e., , and ) are determined from the porosity () using the Bruggermann exponent (), similar to past studies [29, 28, 21]. Additionally, the effective diffusion ionic conductivity () depends on and the thermodynamic factor (), which is a function of and as given by [25, 21]:
| (5) |
Additionally, note that the open circuit potential () and the entropic heating coefficient are functions of parameters of the LIB cell components (i.e., the NMC and graphite electrodes in this study) [21, 26, 25]. Other constants needed for the P2D model include the Faraday constant ( = 96,485 C/mol) and the universal gas constant ( = 8.3143 J/(mol K)).
II-B2 Thermal Model of the Battery Cell
A numerical, transient, 3D heat conduction model estimates the temperature response of the cylindrical cell throughout the jellyroll, outer case including the positive and negative tabs, and the mandrel in response to the heat generation calculated based on results from the electrochemical side [16, 15, 26, 25, 29, 28] (see Section II-B1) and the convection cooling provided from the thermofluid model (see Section II-B3). All domains within the conduction model are assumed to be in perfect thermal contact, such that there is continuity of temperature across the domains. Note that the heat generation calculated from the P2D electrochemical model (assuming the average cell temperature at a particular time step) is assumed to provide a uniform volumetric heat source within the homogeneous jellyroll region, which is the active part of the LIB cell, in the thermal model. Thermophysical parameters used as inputs to the numerical model are given in Table III. The mandrel domain is usually considered to be a void [19] and, for the present study, is assumed to be filled with air. Note that apart from the jellyroll, all materials are assumed to have isotropic thermal conductivity (). The anisotropic thermal conductivity of the jellyroll is modeled with a high thermal conductivity in the axial direction ( along the sheets of the current collectors) and a lower thermal conductivity in the radial and azimuthal directions ( and ).
| Thermophysical Properties | ||||
|---|---|---|---|---|
| Region | (kg/m3) | (J/(kg K)) | (W/(m K)) | Ref. |
| Jellyroll | 2055 | 1399 | ; | [15] |
| Outer Case | 7500 | 460 | 14 | [31, 32] |
| Positive Tab | 2719 | 871 | 202 | [32, 13] |
| Negative Tab | 8978 | 381 | 387 | [32, 13] |
The local transient temperature of the battery cell is determined for the 3D cylindrical cell domain from the heat diffusion equation (i.e., conservation of energy) applied within each component of the system:
| (6) |
where is time, and are the density and specific heat of each domain simulated, and is the volumetric heat generation.
The volumetric heat generation is calculated based on the output of P2D model and is only nonzero in the cylindrical jellyroll region. Specifically, it can be determined as:
| (7) |
The first set of terms is the kinetic heating; the second term is the reversible heat source; and all other terms contributes to Ohmic heating (), which is a result of electronic resistance, ionic resistance, and concentration overpotential. Apart from the electrochemical heat generation term given in above, contact resistance results in heat generation during cell operation, , where is the current and has been accounted in the thermal model.
Initially, the cell (and fluid domain) are assumed to be at a uniform temperature of = 298.15 K. Heat generated within the cell leads to the cell temperature to rise and the heat is dissipated by convection to the fluid domain. Surface energy balances at the interface between the solid and liquid domains link the conduction within the cell (related to the temperatures and temperature gradients in these materials) to heat transfer within the fluid.
II-B3 Thermo-fluid Model within the Dielectric Fluid Domain
For the understanding the coupled fluid flow and heat transfer, conservation equations are solved within the the domain of the dielectric fluid, while insuring conservation of energy at the solid-liquid interface.
The governing equations are conservation of mass, momentum, and (thermal) energy within in the 3D fluid domain:
| (8) |
| (9) |
and
| (10) |
where is density of fluid, is velocity, is pressure, is dynamic viscosity, is the specific heat, and is the thermal conductivity of the fluid. Note that we are neglecting the effects of gravity.
For the fluid flow, the boundary conditions are as follows:
-
•
Inlet Face: specified mass flow rate (or velocity for air cooling comparison);
-
•
Outlet Face: specified pressure; and
-
•
Other Boundaries (including the interface with the case and the other external walls of the fluid domain): No-slip condition.
The inlet boundary conditions (i.e., mass flow rates for the liquids and fluid velocity for gasses) are selected such that fluid flow is in the laminar region (although this can be relaxed with appropriate turbulent flow closure relations).
For the required thermal boundary conditions, the inlet temperature is fixed at the initial temperature ( = 25 ∘C = 298.15 K). All other exterior walls except the inlet and outlet faces are assumed to be adiabatic. Surface energy balances at the case-fluid interface dictate the heat fluxes on those boundaries.
Two different dielectric fluids (deionized water (DIW) and mineral oil (MO)) are chosen for the present analysis. Also, forced air cooling is simulated for comparison. Table IV shows the thermophysical properties of both the dielectric fluids and air. Note that the properties of fluids are assumed to be constant in the simulation.
| Properties | De-Ionized Water | Mineral Oil | Air |
| Abbreviation: | DIW | MO | |
| References: | [13, 33] | [34, 13] | [34, 13] |
| Density, (kg/m3) | 998 | 920 | 1.225 |
| Specific Heat Capacity, (J/(kg K)) | 4182 | 1900 | 1006 |
| Thermal Conductivity, (W/(m K)) | 0.6 | 0.13 | 0.0242 |
| Dynamic Viscosity, (Pa s) | 0.001 | 0.05 | 1.79 |
II-B4 Mechanical Model of the Cell
Mechanical stress is a key factor that influences both performance and degradation of battery cells [35, 36, 37, 38, 39]. Two factors contribute significantly to the mechanical response within the cell: temperature (or thermal strain ()) and diffusion (or diffusion strain ()), assuming the outer rigid outer case restricts the expansion of the cell. In the present study, the mechanical model estimates the average stress generated during the operation in the cylindrical jellyroll region, which is the active region of LIB, based on the temperatures and electrochemical state of the cell. Table V shows the mechanical properties of the different layers in the model.
| Mechanical Properties | ||||
|---|---|---|---|---|
| Material | (GPa) | (1/K) | Ref. | |
| NMC Electrode | 142 | 0.3 | 8.610-6 | [40, 35, 36, 37] |
| Graphite Electrode | 10 | 0.3 | 410-6 | [35, 36, 37, 38] |
| Separator | 0.14 | 0.3 | - | [35, 36, 37, 38] |
| Positive Current Collector | 70 | 0.3 | 2310-6 | [35, 36, 37] |
| Negative Current Collector | 110 | 0.3 | 1710-6 | [35, 36, 37] |
Diffusion-induced stresses () are a consequence of delithiation or lithiation of the porous electrodes (i.e., the cathode and anode) during the operation of LIB. Specifically, the addition or removal of a species (in this case, Li+) from a material causes a change in the volume of the materials. Typically, the diffusive stress, , is estimated based on the diffusion-thermal analogy [36]:
| (11) |
where is the Dirac delta function and is the change in concentration of diffusion species. Here, we calculate the diffusion stress based on analytical expressions proposed in a recent study [38]:
| (12) |
where and are the change in the thickness of the cathode and anode due to diffusion (subscripts ‘c’ and ‘a’, respectively). A key assumption in this equation is that ion transport does not cause a change in thickness of the separator . In Equation 12, is a coefficient, which depends on Young’s modulus (), Poisson’s ratio (), and the thickness () of the cathode, separator, and anode (using subscripts ‘c’, ‘s’, and ‘a’, respectively):
| (13) |
where
| (14) |
The change in thickness for the anode and cathode ( and ) can be found from:
| (15) |
where is the partial molar volume and the subscripts is ‘c’ or ‘a’ to represent the cathode or anode, respectively, represents the initial concentration in electrodes, and is the concentration in electrodes at a given time. The partial molar volume is a property of an electrode that governs the change in volume due to species diffusion, and for LIBs, it depends on the concentration of Li+ in the electrodes. For both electrodes (here, the NMC cathode and graphite anode), is modeled as a function of concentration based on Koerver et al. [41]. Although there is no explicit mention of time () in Equation 12, is a function of since the concentration of lithium () varies with time as LIB operates.
To estimate the thermal stress (), the mechanical equilibrium equation, given by:
| (16) |
is solved within the cylindrical jellyroll domain. The outer boundaries of the cell (the case) are assumed to be rigid, such that the case prevents any overall deformation. As the temperature () varies temporally and spatially within the jellyroll (as calculated by the thermal model, see Section II-B2), this result in thermal strain of:
| (17) |
where is the coefficient of thermal expansion and is the local temperature change at each location of the domain.
All of the mechanical properties (i.e., , & ) used for the calculation of & are based on an average of the properties within the domain (i.e., cathode, anode, separator and current collectors) that form the cylindrical jellyroll. Table V shows the values of properties and corresponding references from which they are adopted.
II-B5 Coupled Model Implementation
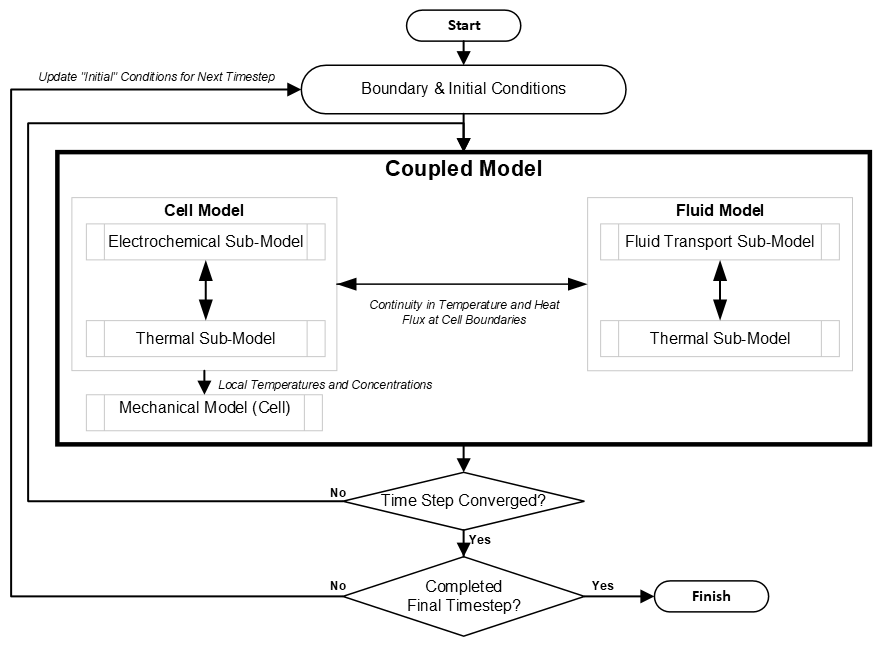
As illustrated in the previous sections, the equations that govern electrochemical, thermal, and fluid transport, as well as mechanical stresses, are coupled. Specifically, properties and parameters of P2D electrochemical model depend on temperature (see Equations 1-5), heat generation is function of outputs from the P2D model intertwined with the temperature (see Equation 7), and the temperature within the LIB is governed by the fluid cooling performance (see Equations 8-10). In other words, the cooling using the dielectric fluid governs the cell domain temperature, which in turn influences the P2D model. Hence, there is significant cross-coupling between different subroutines (i.e., electrochemical, heat transfer, and fluid flow) in the immersion cooling simulations. Due to this two-way coupling, we need to solve the thermal, fluid, and electrochemical sub-models simultaneously while advancing in time, as shown in Figure 2. The mechanical model is only one-way coupled with the other models and can be solved after the coupled models converge. In this work, the P2D electrochemical model is solved using the partial differential equation (PDE) interface of COMSOL®, and the fluid flow and heat transfer models are implemented in the specific COMSOL® modules. The mechanical model is solved using MATLAB® after calculation of the other sub-models. The complete algorithm outlined in Figure 2 is implemented using LiveLinkTM for MATLAB® that integrates it with COMSOL®.
In the present study, several discharge rates are analyzed: 1C, 3C & 5C. For this system, 1C corresponds to a constant current discharge at = 2.2 A as we are modeling a cell with capacity = 2.2 Ah. This matches a recent study from literature [26] that is used to validate the model (See Section II-C and Fig. 3). Additionally, we evaluate three different mass flow rates (0.01, 0.005, and 0.0025 kg/s) for the dielectric fluids (mineral oil (‘MO’) and deionized water (‘DIW’)). For comparison, we also consider cooling with air at a constant inlet velocity of 0.3 m/s. These liquid flow rates and the air velocity is selected to ensure that the flow is laminar based on the flow rates investigated in the literature [42, 13].
II-C Model Validation
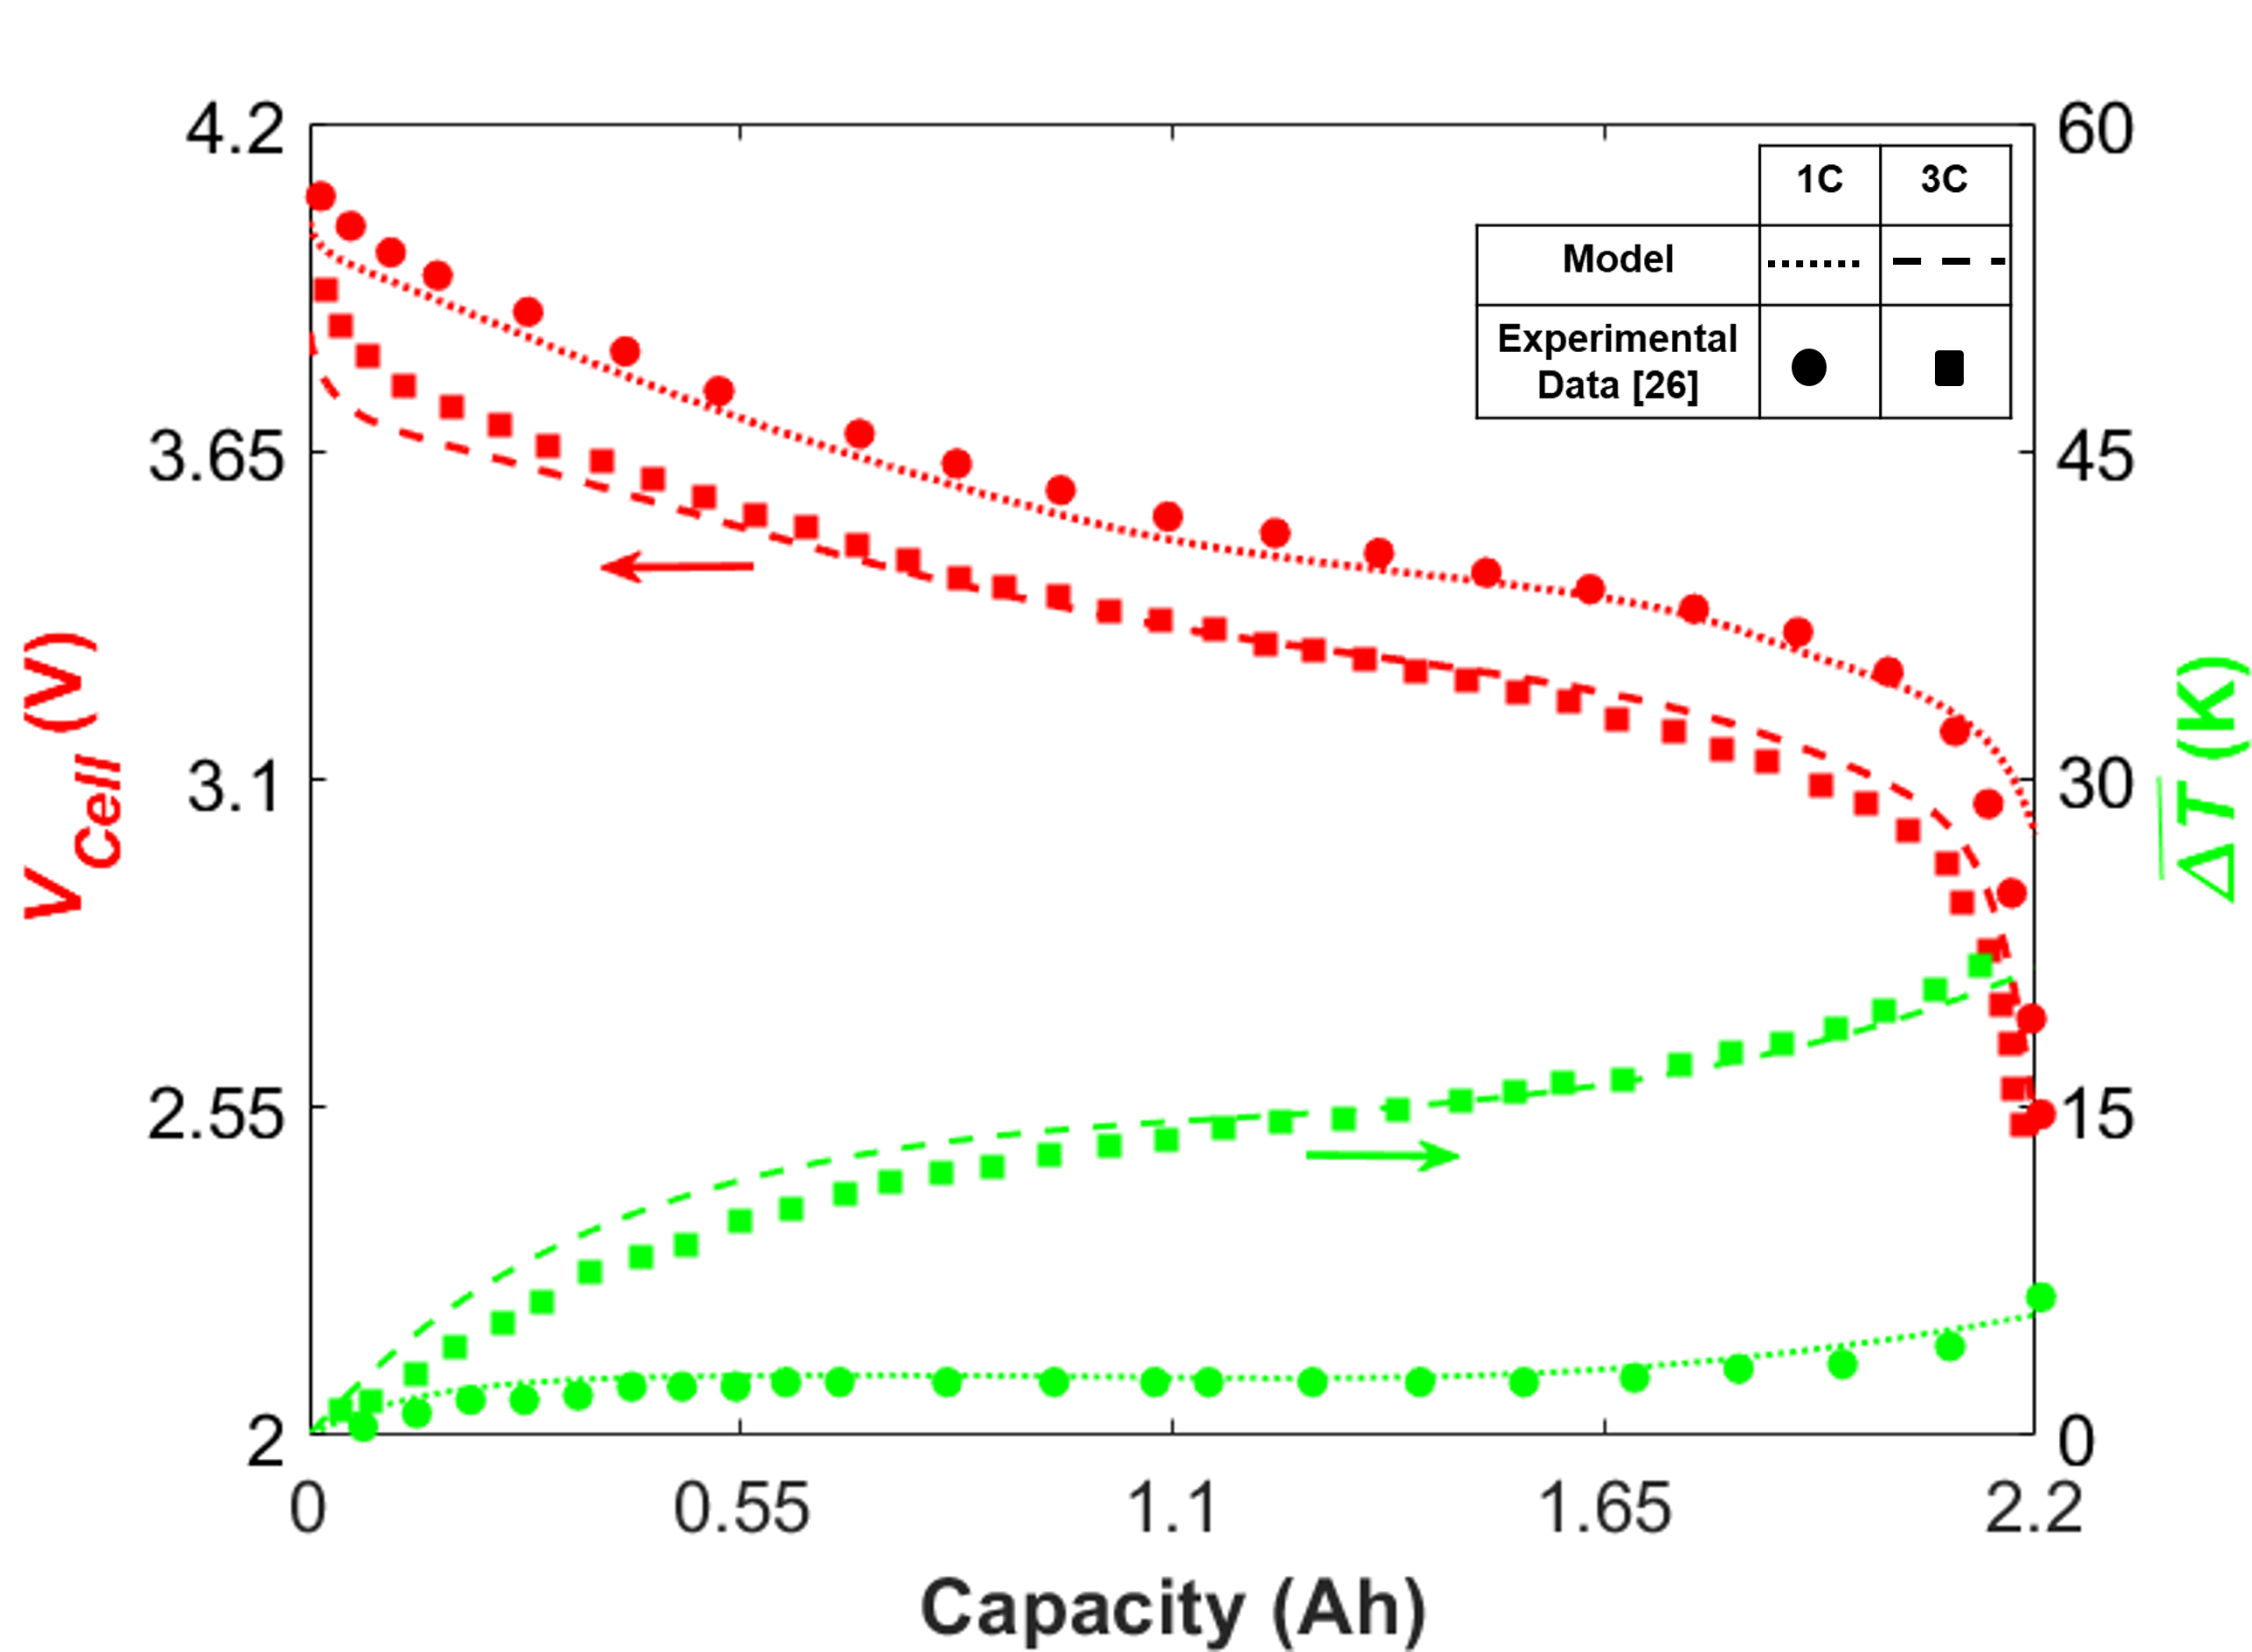
For validating the coupled electrochemical-thermal model, results from the present electrochemical and thermal models are compared with the experimental results from literature for a natural convection cooled battery cell [26]. For this validation, the electrochemical model (Section II-B1) and the thermal model (Section II-B2) of the cell alone are analyzed without the fluid flow and mechanical components. From their experimental data, using a lumped capacitance thermal model, they estimated a natural convection heat transfer coefficient of 28.4 W/m2K, which we then apply at the boundary of our thermal model for the validation of the electrochemical and (conduction) thermal sub-models. Note that the thermophysical properties such as density and specific heat in the lumped model for validation are same as in given in the original paper by Ji et al. [26]. All properties in the electrochemical model are same are shown in Table II. Figure 3 shows the cell potential () and the average temperature rise () for discharge rate of 1C and 3C from our numerically model and the past experimental data. Our numerical model accurately predicts the magnitude of the cell potential and average temperature rise .
II-D Mesh Independence
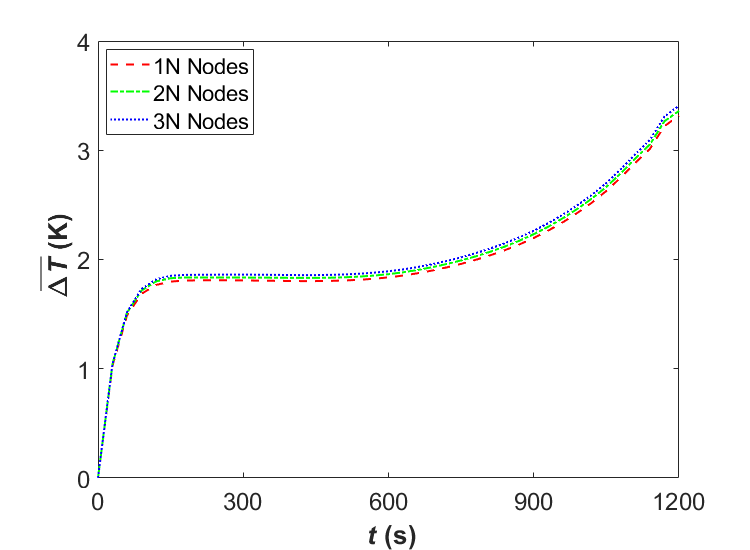
Numerical simulations can be impacted by number of nodes within the mesh. To ensure that the results are insensitive to the mesh, we evaluate the forced immersion cooling model for deionized water with a mass flow rate of 0.01 kg/s at a discharge rate of 3C. Figure 4 shows the predicted average temperature of the cell, , for three different levels of meshing (, , and , where 400,000 nodes). The total number of nodes includes the full immersion cooling domain (see Figure 1 (b)). The results are acceptably similar for all 3 mesh levels. Therefore, the middle level of meshing ( nodes) is selected for all further simulations as an optimum choice between computational time and accuracy.
III Results and Discussion
Now that we have validated the model against data from literature and evaluated the mesh independence of the model, we use the model to understand the impact of discharge rate and fluid flow parameters on the electrochemical, thermal, and mechanical response of the system. First we analyze the impact of discharge rate in Section III-A and then we consider the varying the mass flow rate in Section III-B. To further understand the impact of fluid choice on system response, a parametric sensitivity analysis is described in Section III-C. Finally, we define a new metric to accelerate design of immersion cooling systems in Section III-D.
III-A Effect of Cell Discharge Rate and Fluid Type
First, we evaluate effect of discharge rate and fluid type on the cell performance by keeping the mass flow rate of dielectric fluid fixed at 0.01 kg/s and varying the discharge rate (1C, 3C, & 5C). We compare two immersion cooling liquids: mineral oil (shown in blues throughout the following plots) and deionized water (shown in greens). For comparison to more standard cooling methods, we also evaluate forced convection cooling using air at 0.3 m/s (shown in reds).
III-A1 Electrochemical and Thermal Response
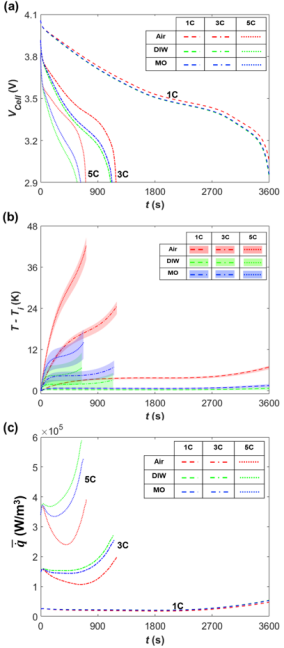
As seen in Figure 5, both the type of dielectric fluid and the discharge rate strongly impact both the cell potential and thermal response. This highlights the need for a holistic approach toward understanding immersion cooling, rather than simulating the thermal-fluid aspects in isolation of the electrochemistry.
Immersion cooling with water (DIW) reduces the average temperature rise () significantly compared to the baseline case forced convection cooling by air, with the mineral oil (MO) providing an intermediate response (see Figure 5 (b)). In particular, at the end of the 5C discharge process, the average temperature rise in the cell is 40 K for air, 16 K for MO, and only 8 K for DIW.
For all fluids, as expected, the magnitude of increases as the discharge rate increases, since increasingly rapid discharge rates indicates the power within the battery cell is used in a shorter time leading to higher heat generation rates. This trend is clearly demonstrated in Figure 5 (c), which shows the average heat generation () for each case throughout the dsicharge process. Quantitatively, is approximately 5 and 10 higher 3C and 5C, respectively, compared to corresponding 1C value. Note that the heat generation rate is not constant in time: as the cell starts to heat up, the heat generation rate first decreases, then it increases as the discharge process nears completion.
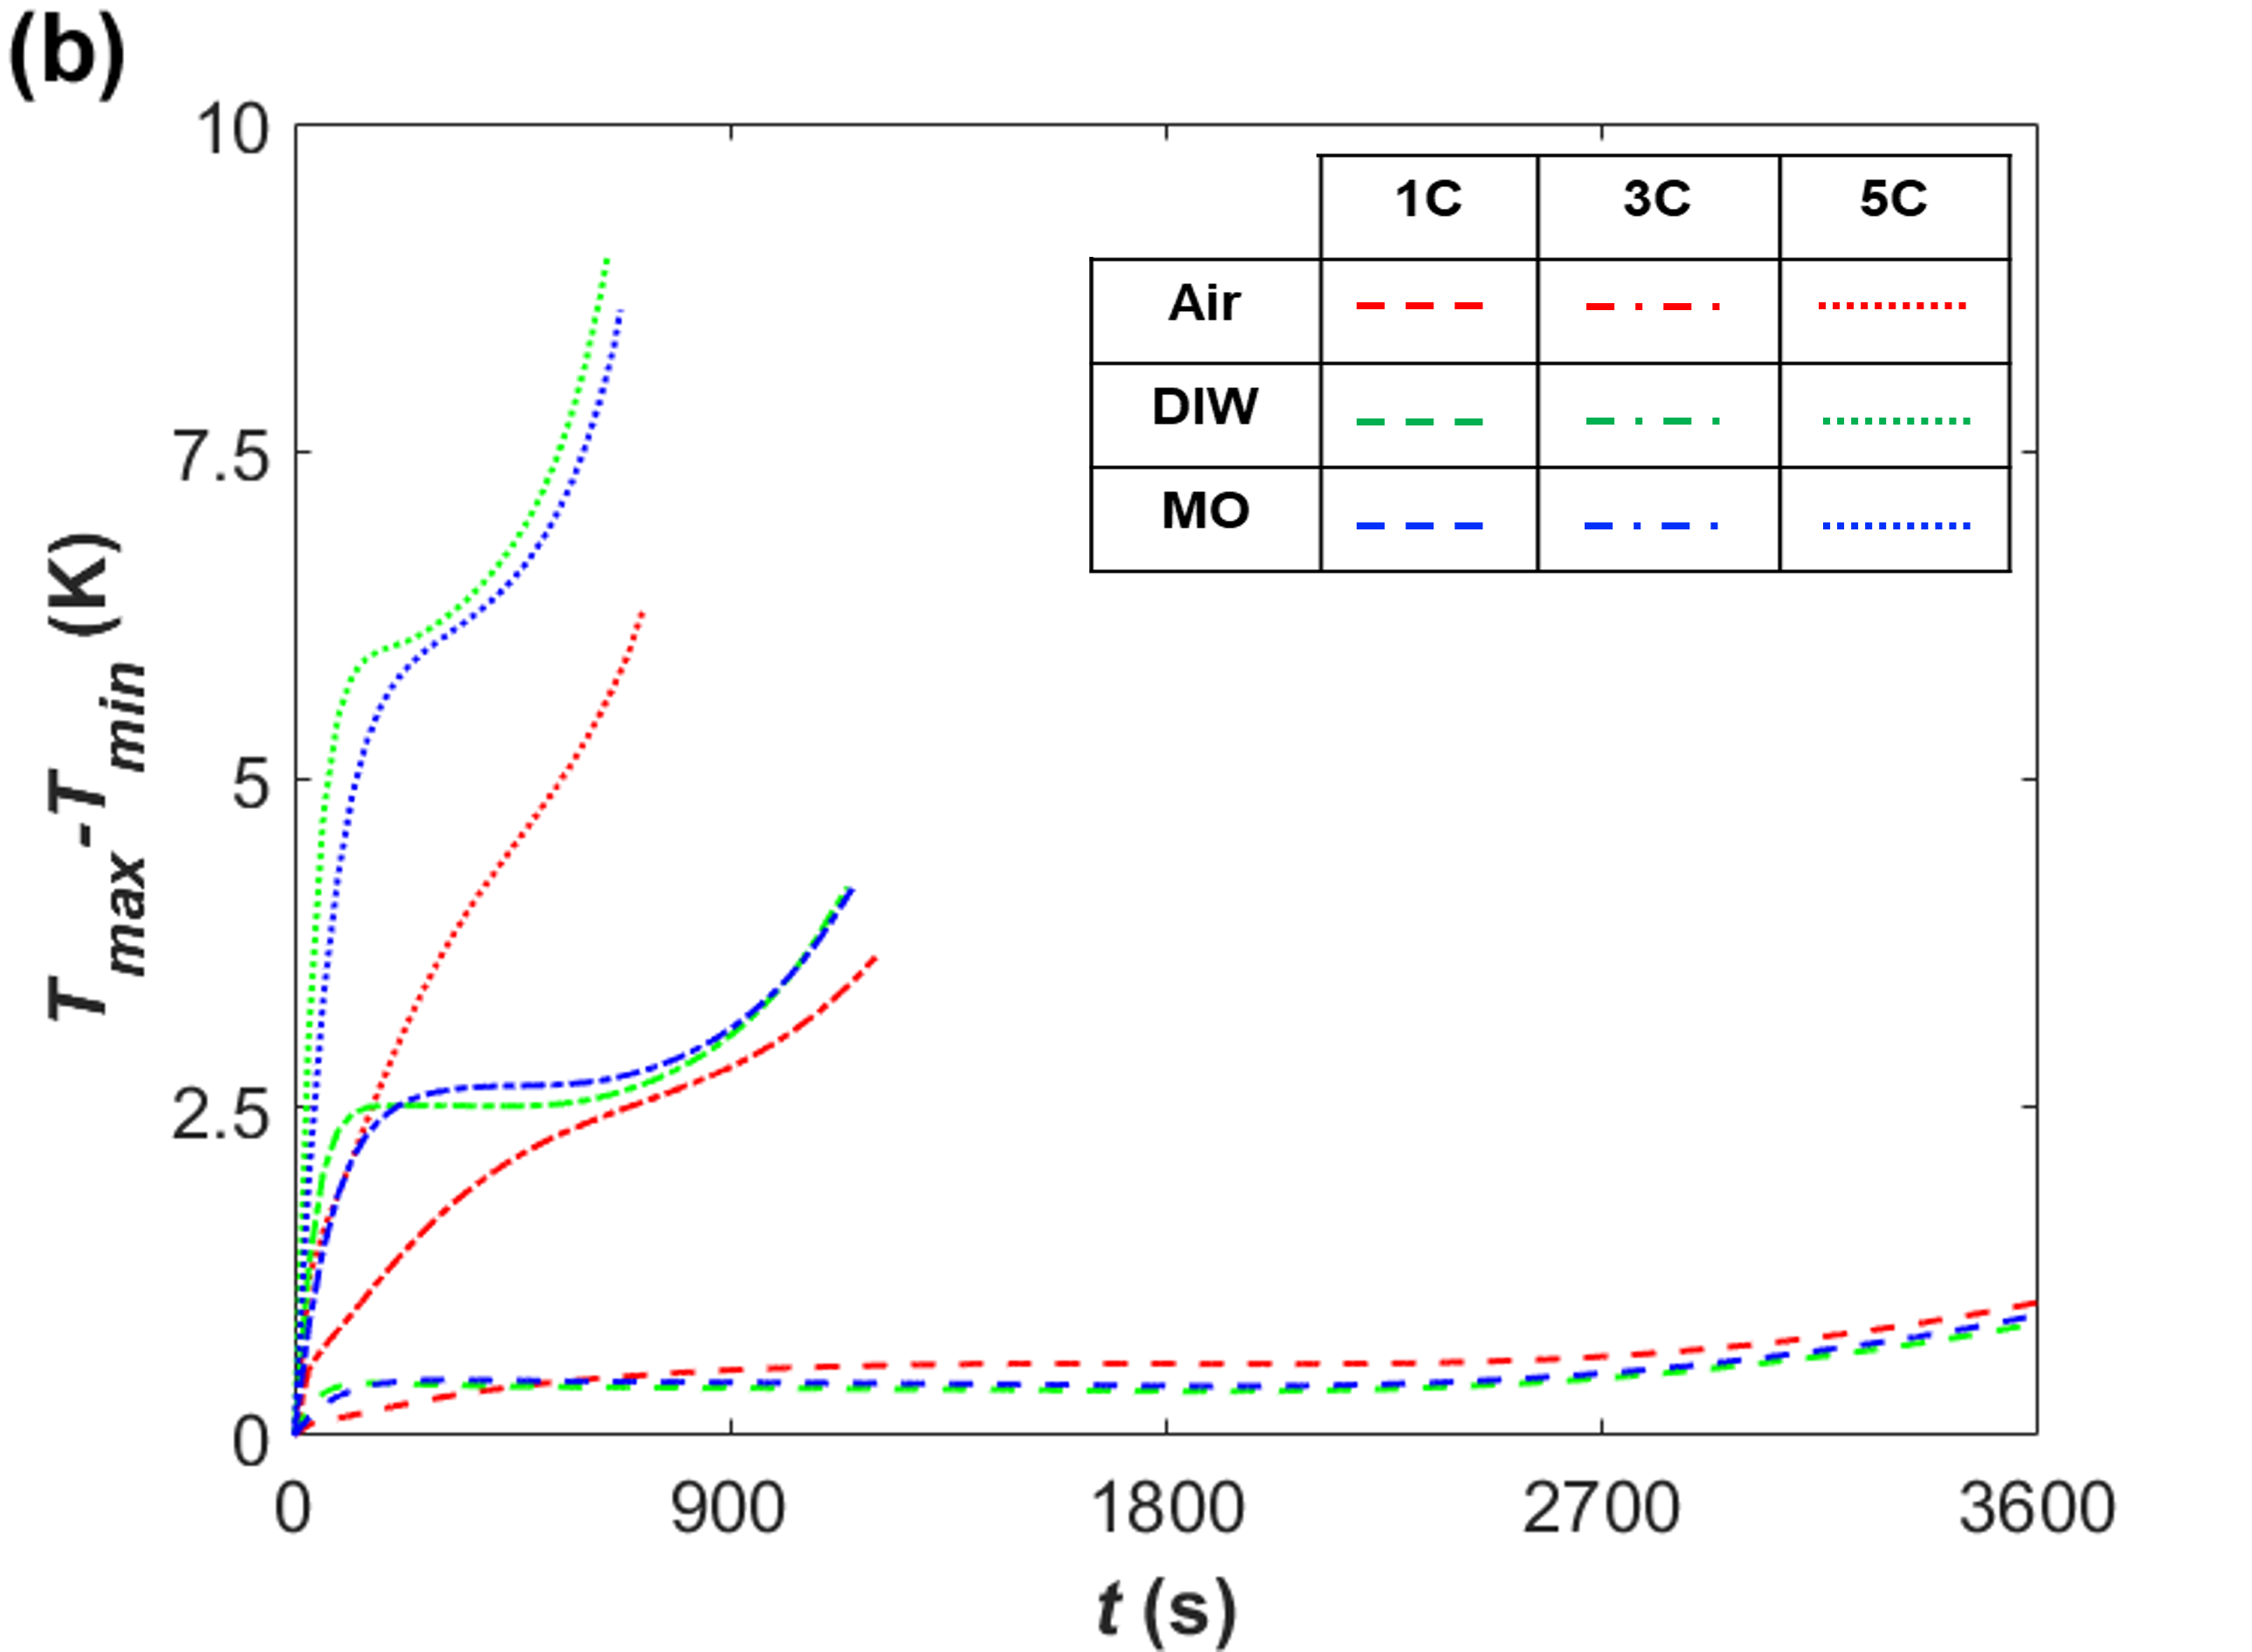
Beyond the average temperature rise in the system, variations in temperature within a cell can impact performance and reliability. Figure 5 (b) shows the range of temperature rises above the initial temperature for the different discharge rates and fluids. For all the fluids, the range of temperature variations within the cell increases with increasing discharge rate. But although improved cooling at the cell boundary (for instance, using liquid water instead of mineral oil) improves the absolute temperatures in the battery cell, the variation within the cell can be large even with high-performance cooling fluids. For example, at 5C, the range of temperatures within the cell is the largest for DIW, followed by MO, and then air. This is opposite of the trend for the average temperature rise (see in Figure 5 (b)). Qualitatively, the Biot Number () provides an estimate of when internal temperature gradients are significant () based on the effective convection heat transfer coefficient , a characteristic length scale for the cell , and the cell thermal conductivity . For a fixed cell with given and , the internal temperature gradients will be more likely to be significant when the convection coefficient is large. Additional discussion on the heat transfer within the cell is included in Appendix A.
Clearly, the LIB cell performance is influenced by both the type of cooling fluid and the discharge rate. The sensitivity to cooling fluid is exacerbated at higher discharge rates. In other words, at higher discharge rates (i.e., 3C and 5C), all the performance metrics (i.e., , , and ) differ both in trend and magnitude with the cooling conditions, while at 1C the response, especially that of and , is relatively insensitive to the type of fluid. For example, consider the discharging time () for the LIB cell. The expected trend is that it will take 3600 s, 1200 s, and 720 s to fully discharge the cell at rates of 1C, 3C, and 5C, respectively. At 1C discharge rate, all fluids expend the cell capacity at 3600 s irrespective of fluid. However, the discharging time at 5C is reduced to 650 s for DIW-based immersion cooling and 690 s for MO-based immersion cooling, but matches the expected value of 720 s when there is only natural convection cooling in air.
III-A2 Mechanical Response
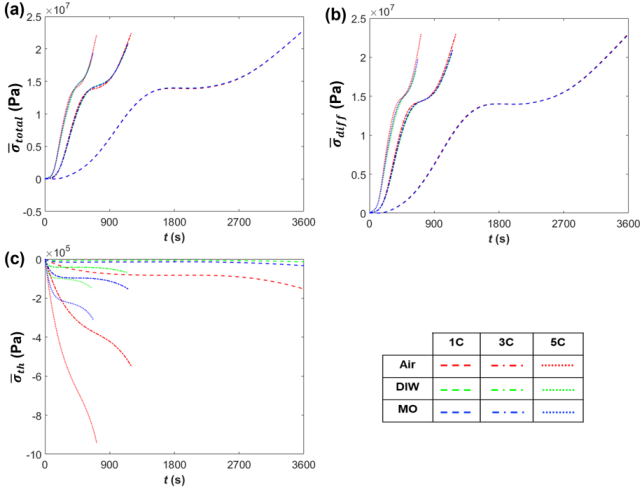
After predicting the temperature and electrochemical response, the mechanical response of the cell is determined for the same set of cooling fluids and cell discharge rates. Figure 6 shows the value of average diffusion stress (), average thermal stress () and total stress (), which is summation of and . Also, the diffusion stress is two orders of magnitude larger than the thermal stress throughout the discharging process. As a result trend (see Figure 6) is similar to the plot. In other words, the net stress, within the cell domain is tensile and its magnitude is same as .
The trend of the temporal evolution of the diffusion stress is similar for all immersion cooling conditions (see Figure 6 (a-b)). Specifically, the plateau region in the middle of the discharge process, as opposed to the monotonic behavior, is related to the value of for each electrode (see Ref. [41]). Clearly, temporal stretch of the plateau region in decrease with increasing discharge rate for all the fluids (i.e., DIW, MO, & Air), which could be related to the high speed of diffusion that eventually leads to fast variation in . Also, note that the diffusion stress is a tensile stress, which indicates that NCM electrode expands less than the graphite electrode shrinks during the discharge process. The diffusion stress is sensitive to the immersion cooling fluids only during a short period in the middle of the discharge process. Even at 5C, the diffusion stress is generally independent of the cooling fluid.
In contrast to the diffusion stress, the thermal stress (Figure 6 (c)) is significantly influenced by the discharge rates as well as the type of fluids (see Figure 6 (c)), since its magnitude is directly proportional to the (see Figure 5 (b)). Thus, the thermal stresses are the highest for 5C discharge with air as the cooling fluid and lowest for DIW at 1C discharge. However, the thermal stresses are generally two orders of magnitude smaller than the diffusion stresses and thus there is minimal impact on the overall stress response. Note that the stress calculated in the analysis represent the stress generated (or change) from t = 0 s and the absolute value depends on the initial value of stress at the beginning of the discharge process.
III-B Mass Flow Rate Dependence
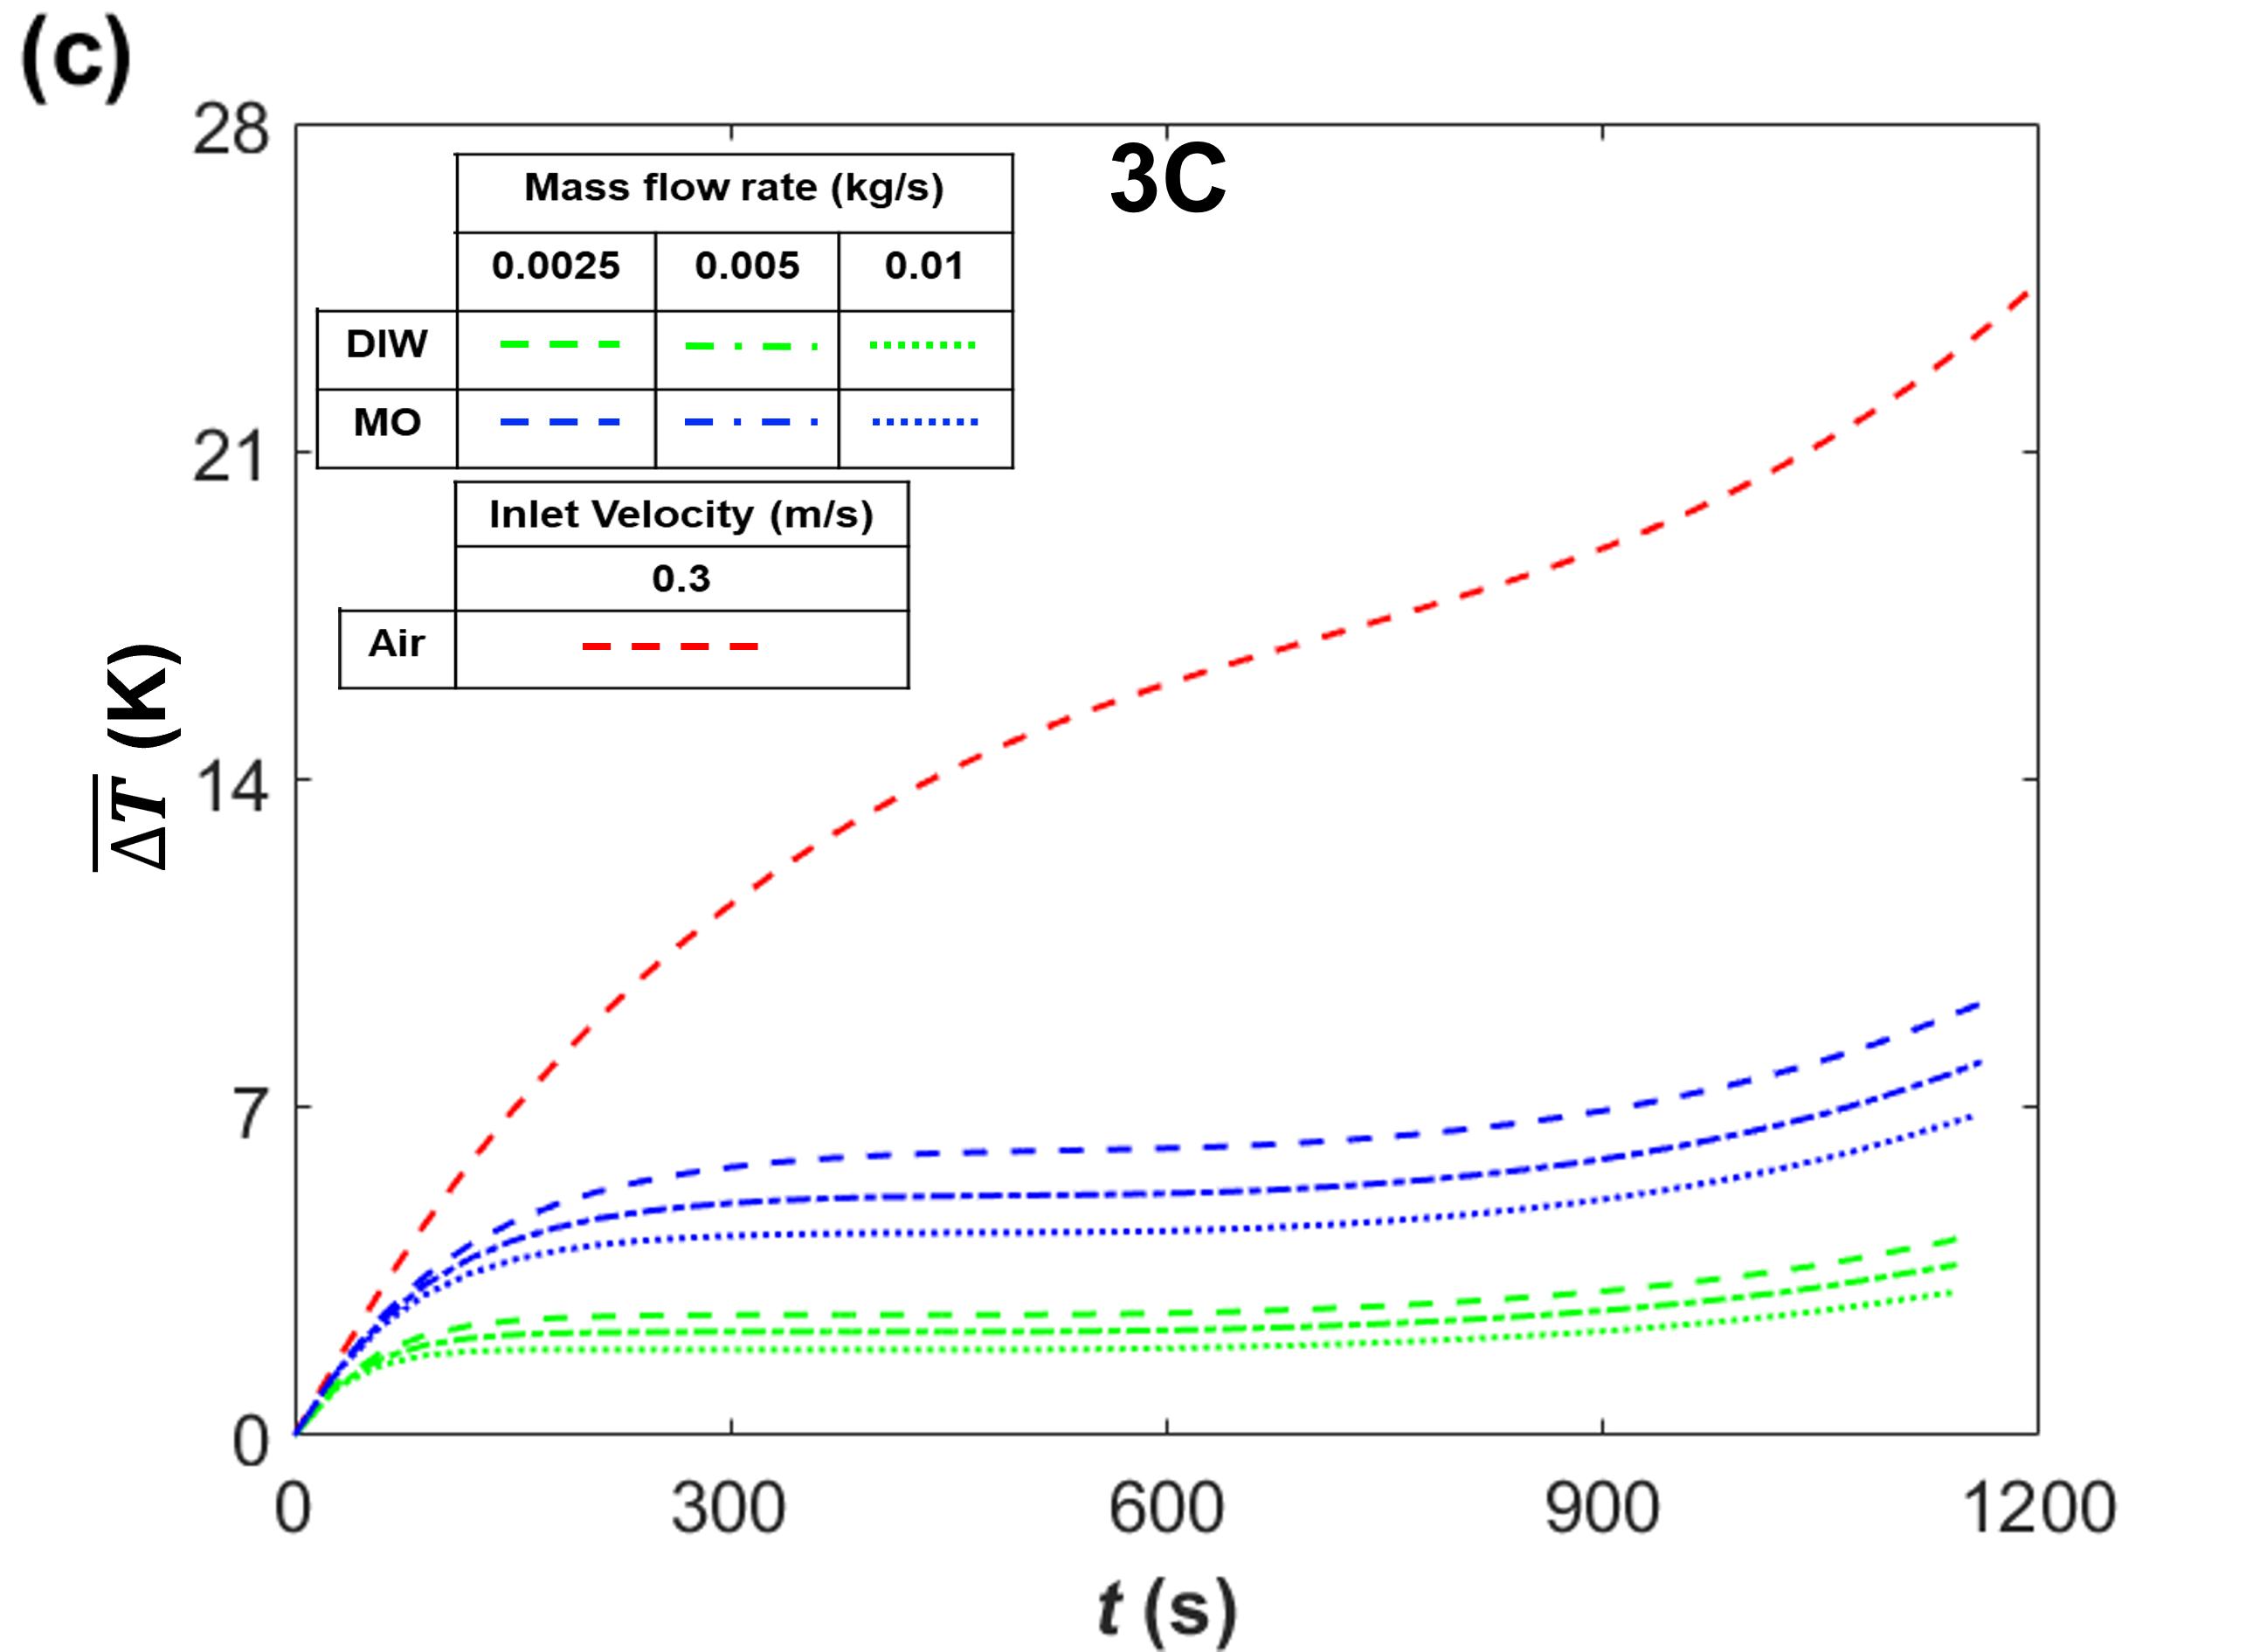
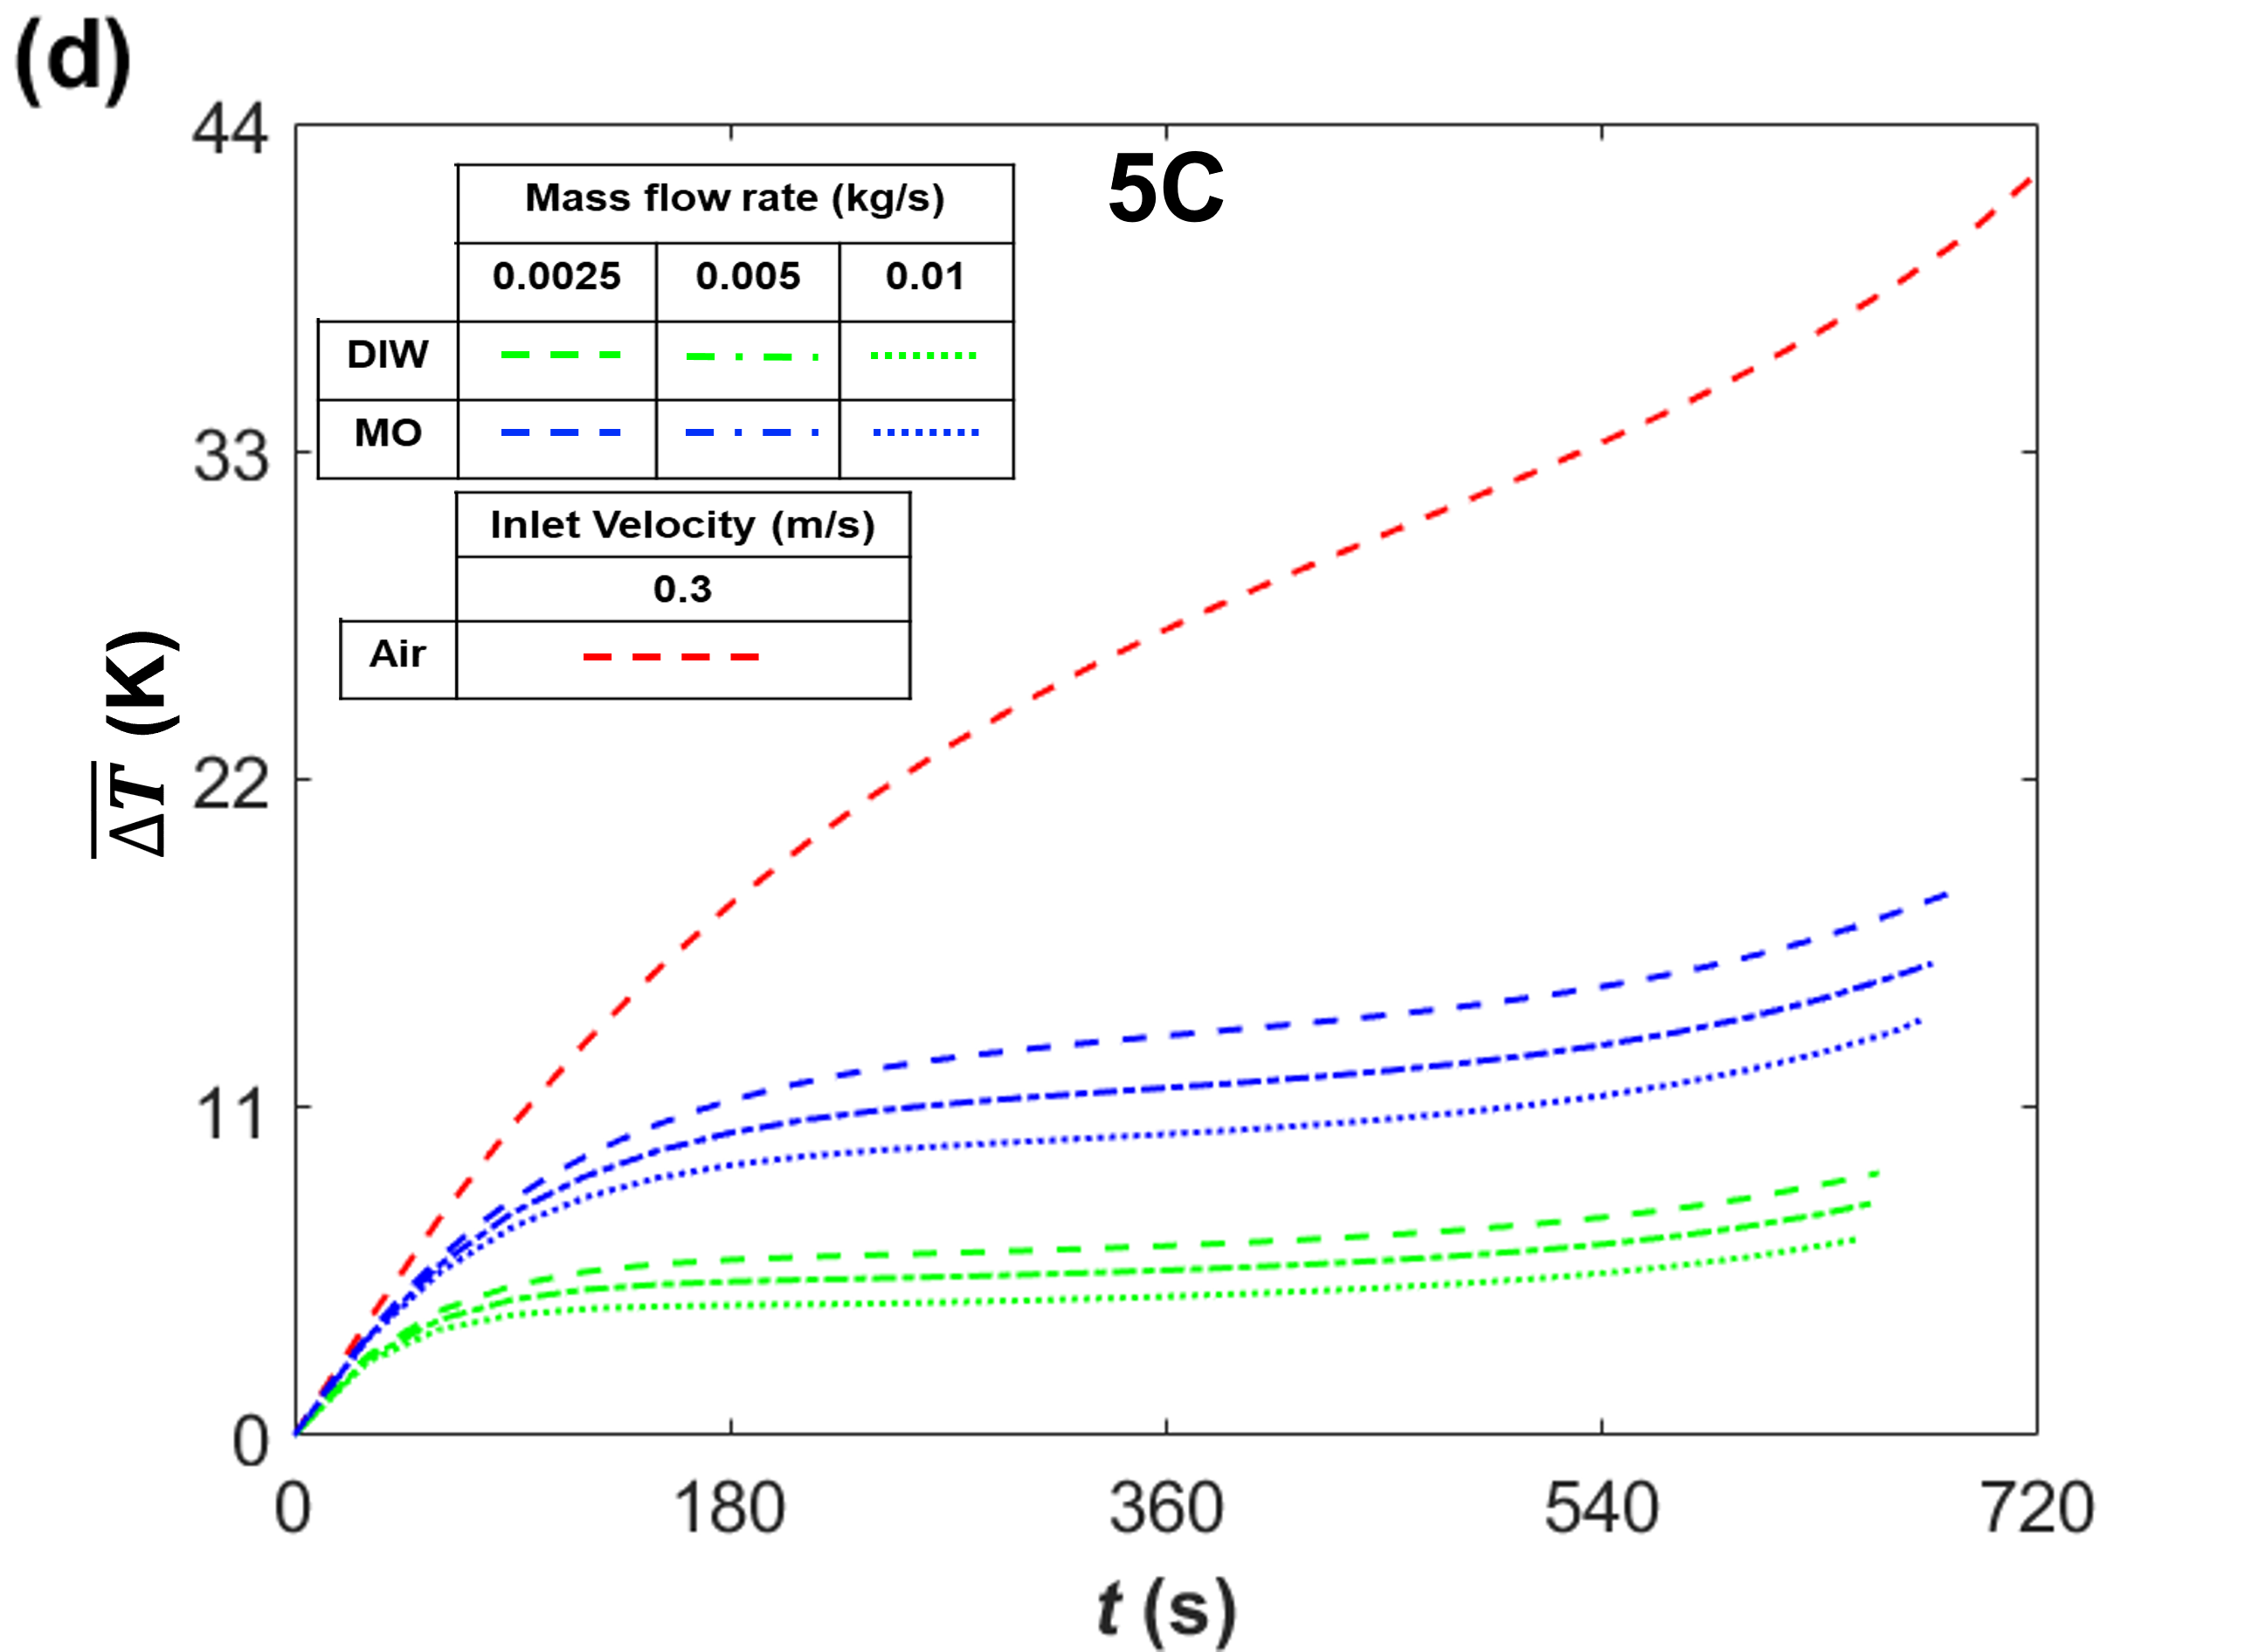
The mass flow rate of the dielectric fluids is one of the key operating parameters for an immersion cooling system and impacts the electrochemical performance of the system due to the coupling to the thermal response. To elucidate the effect of mass flow rate for our system, we consider three different mass flow rates (i.e., 0.01, 0.005, and 0.0025 kg/s) for two cell discharge rates (i.e., 3C and 5C). Results for liquid immersion cooling are compared to air cooling at an inlet velocity of 0.3 m/s.
III-B1 Electrochemical and Thermal Performance
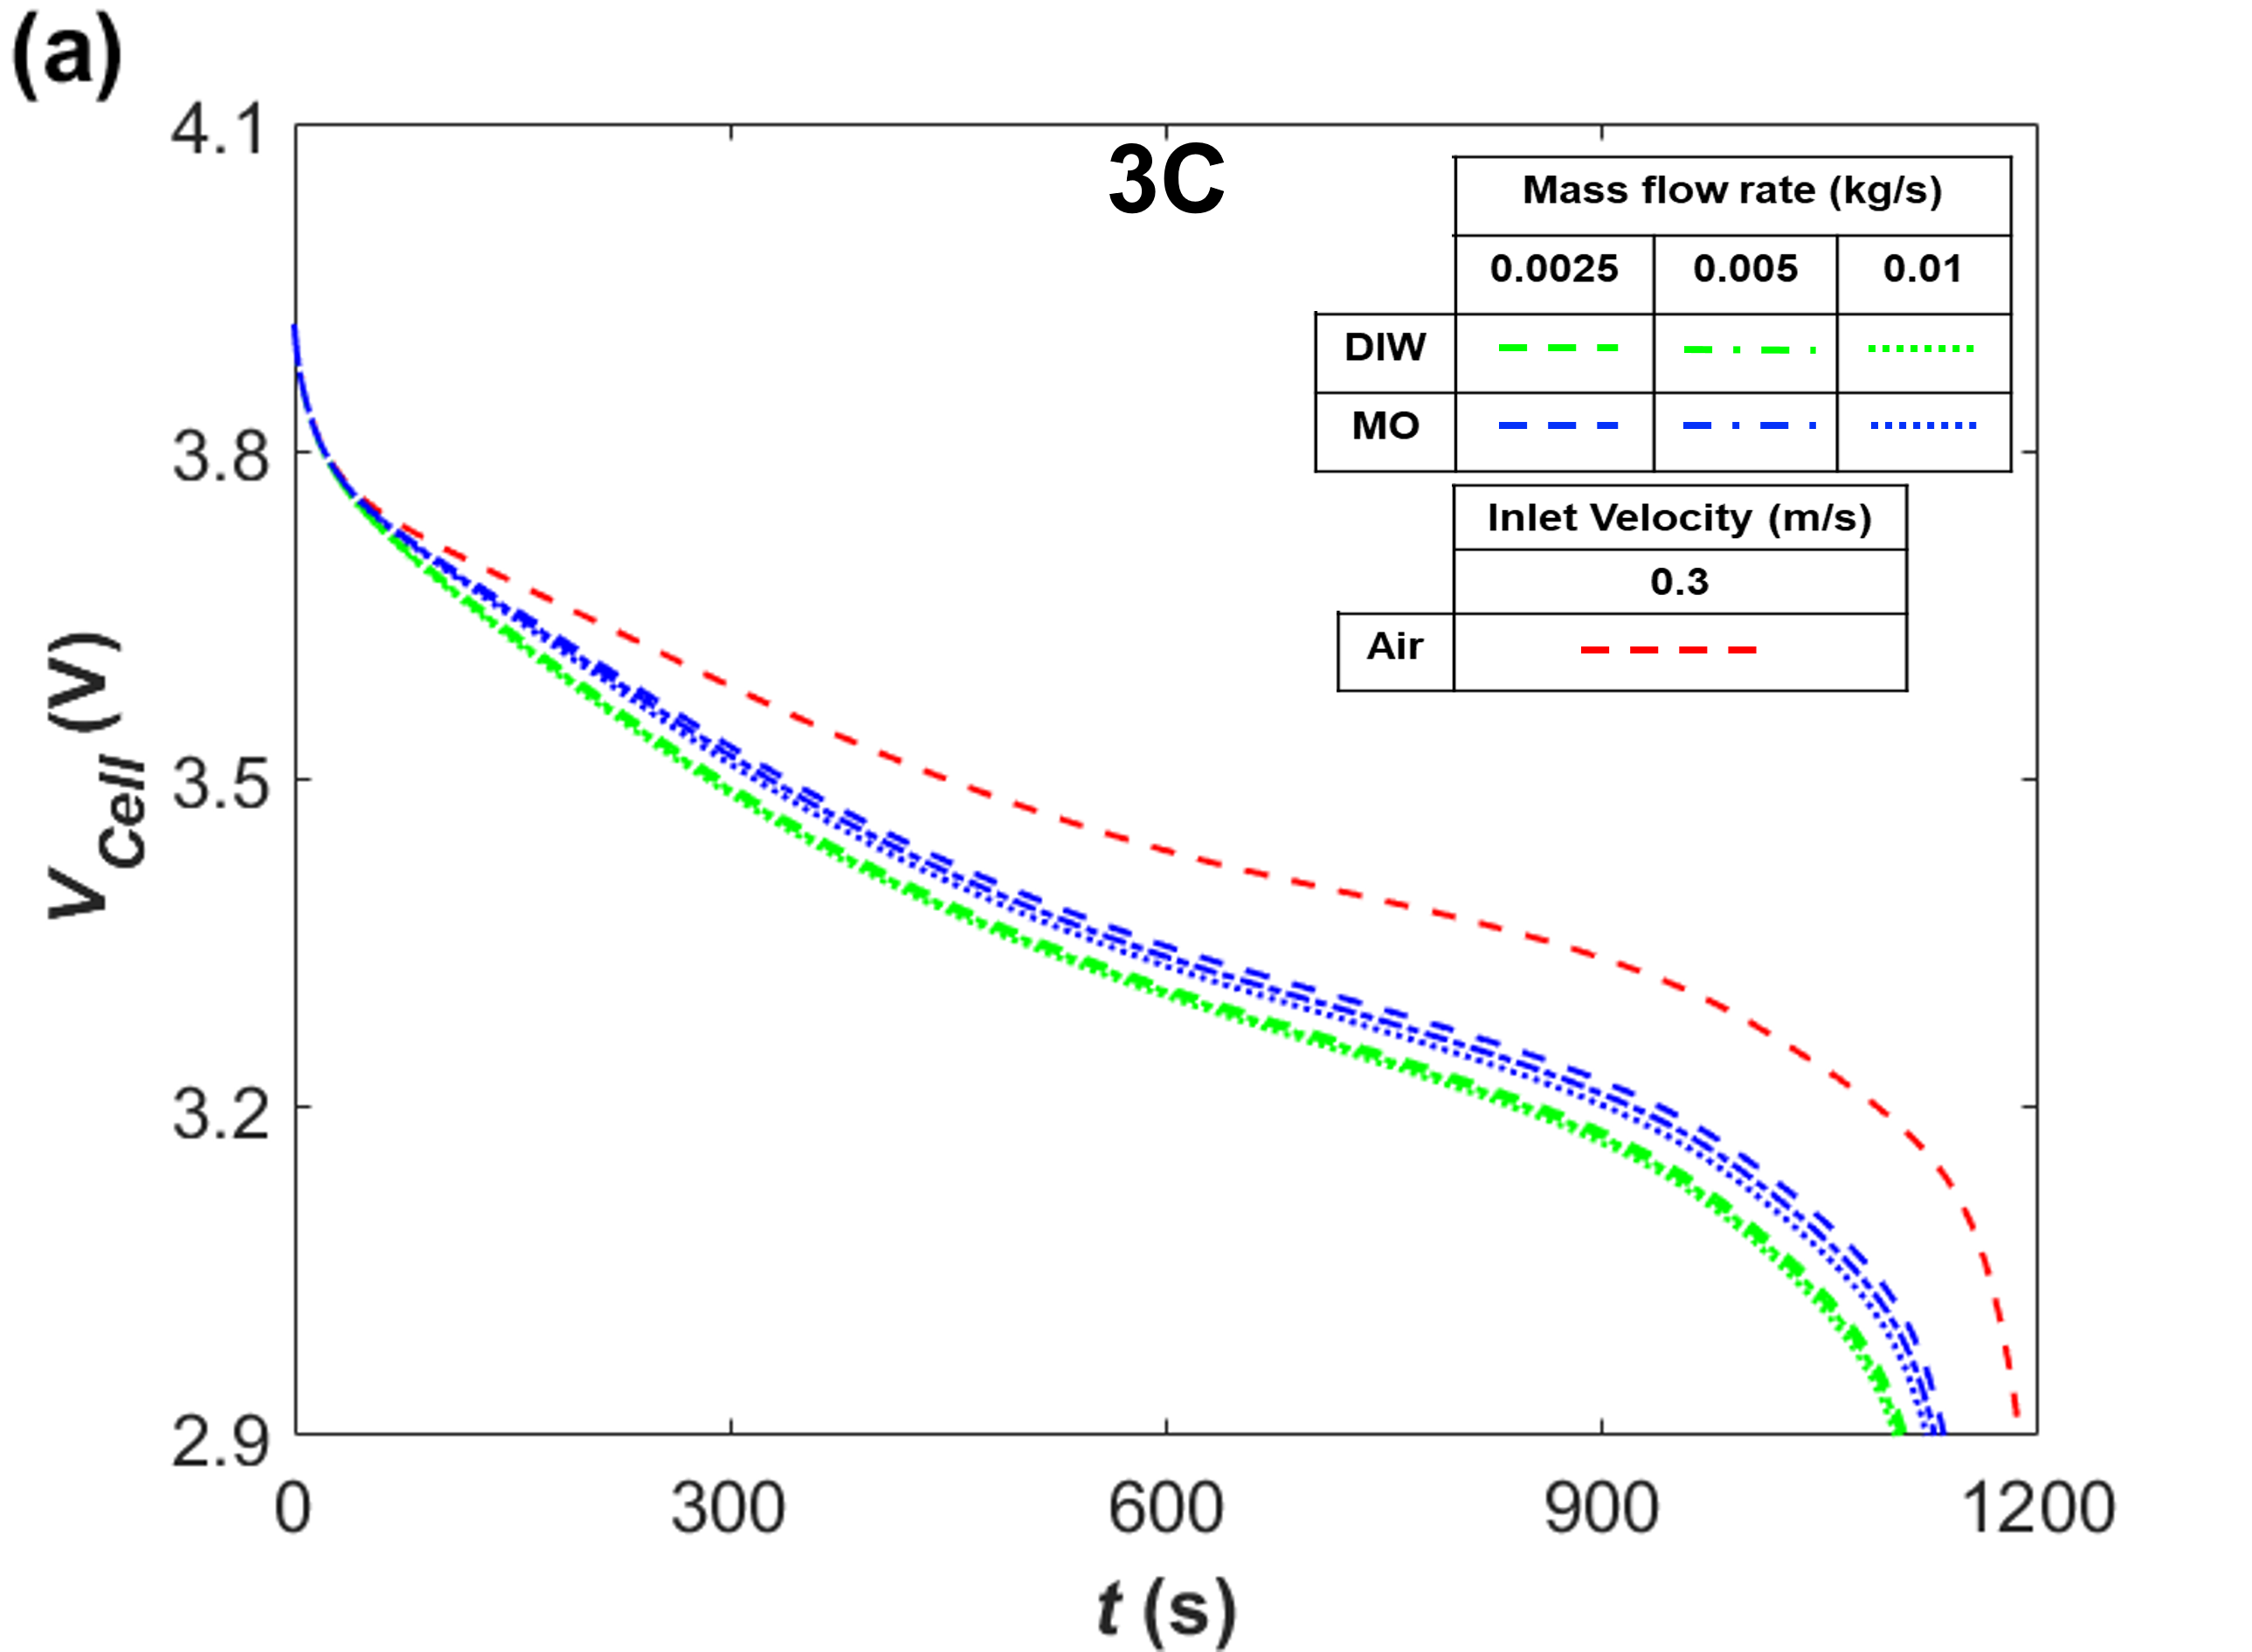
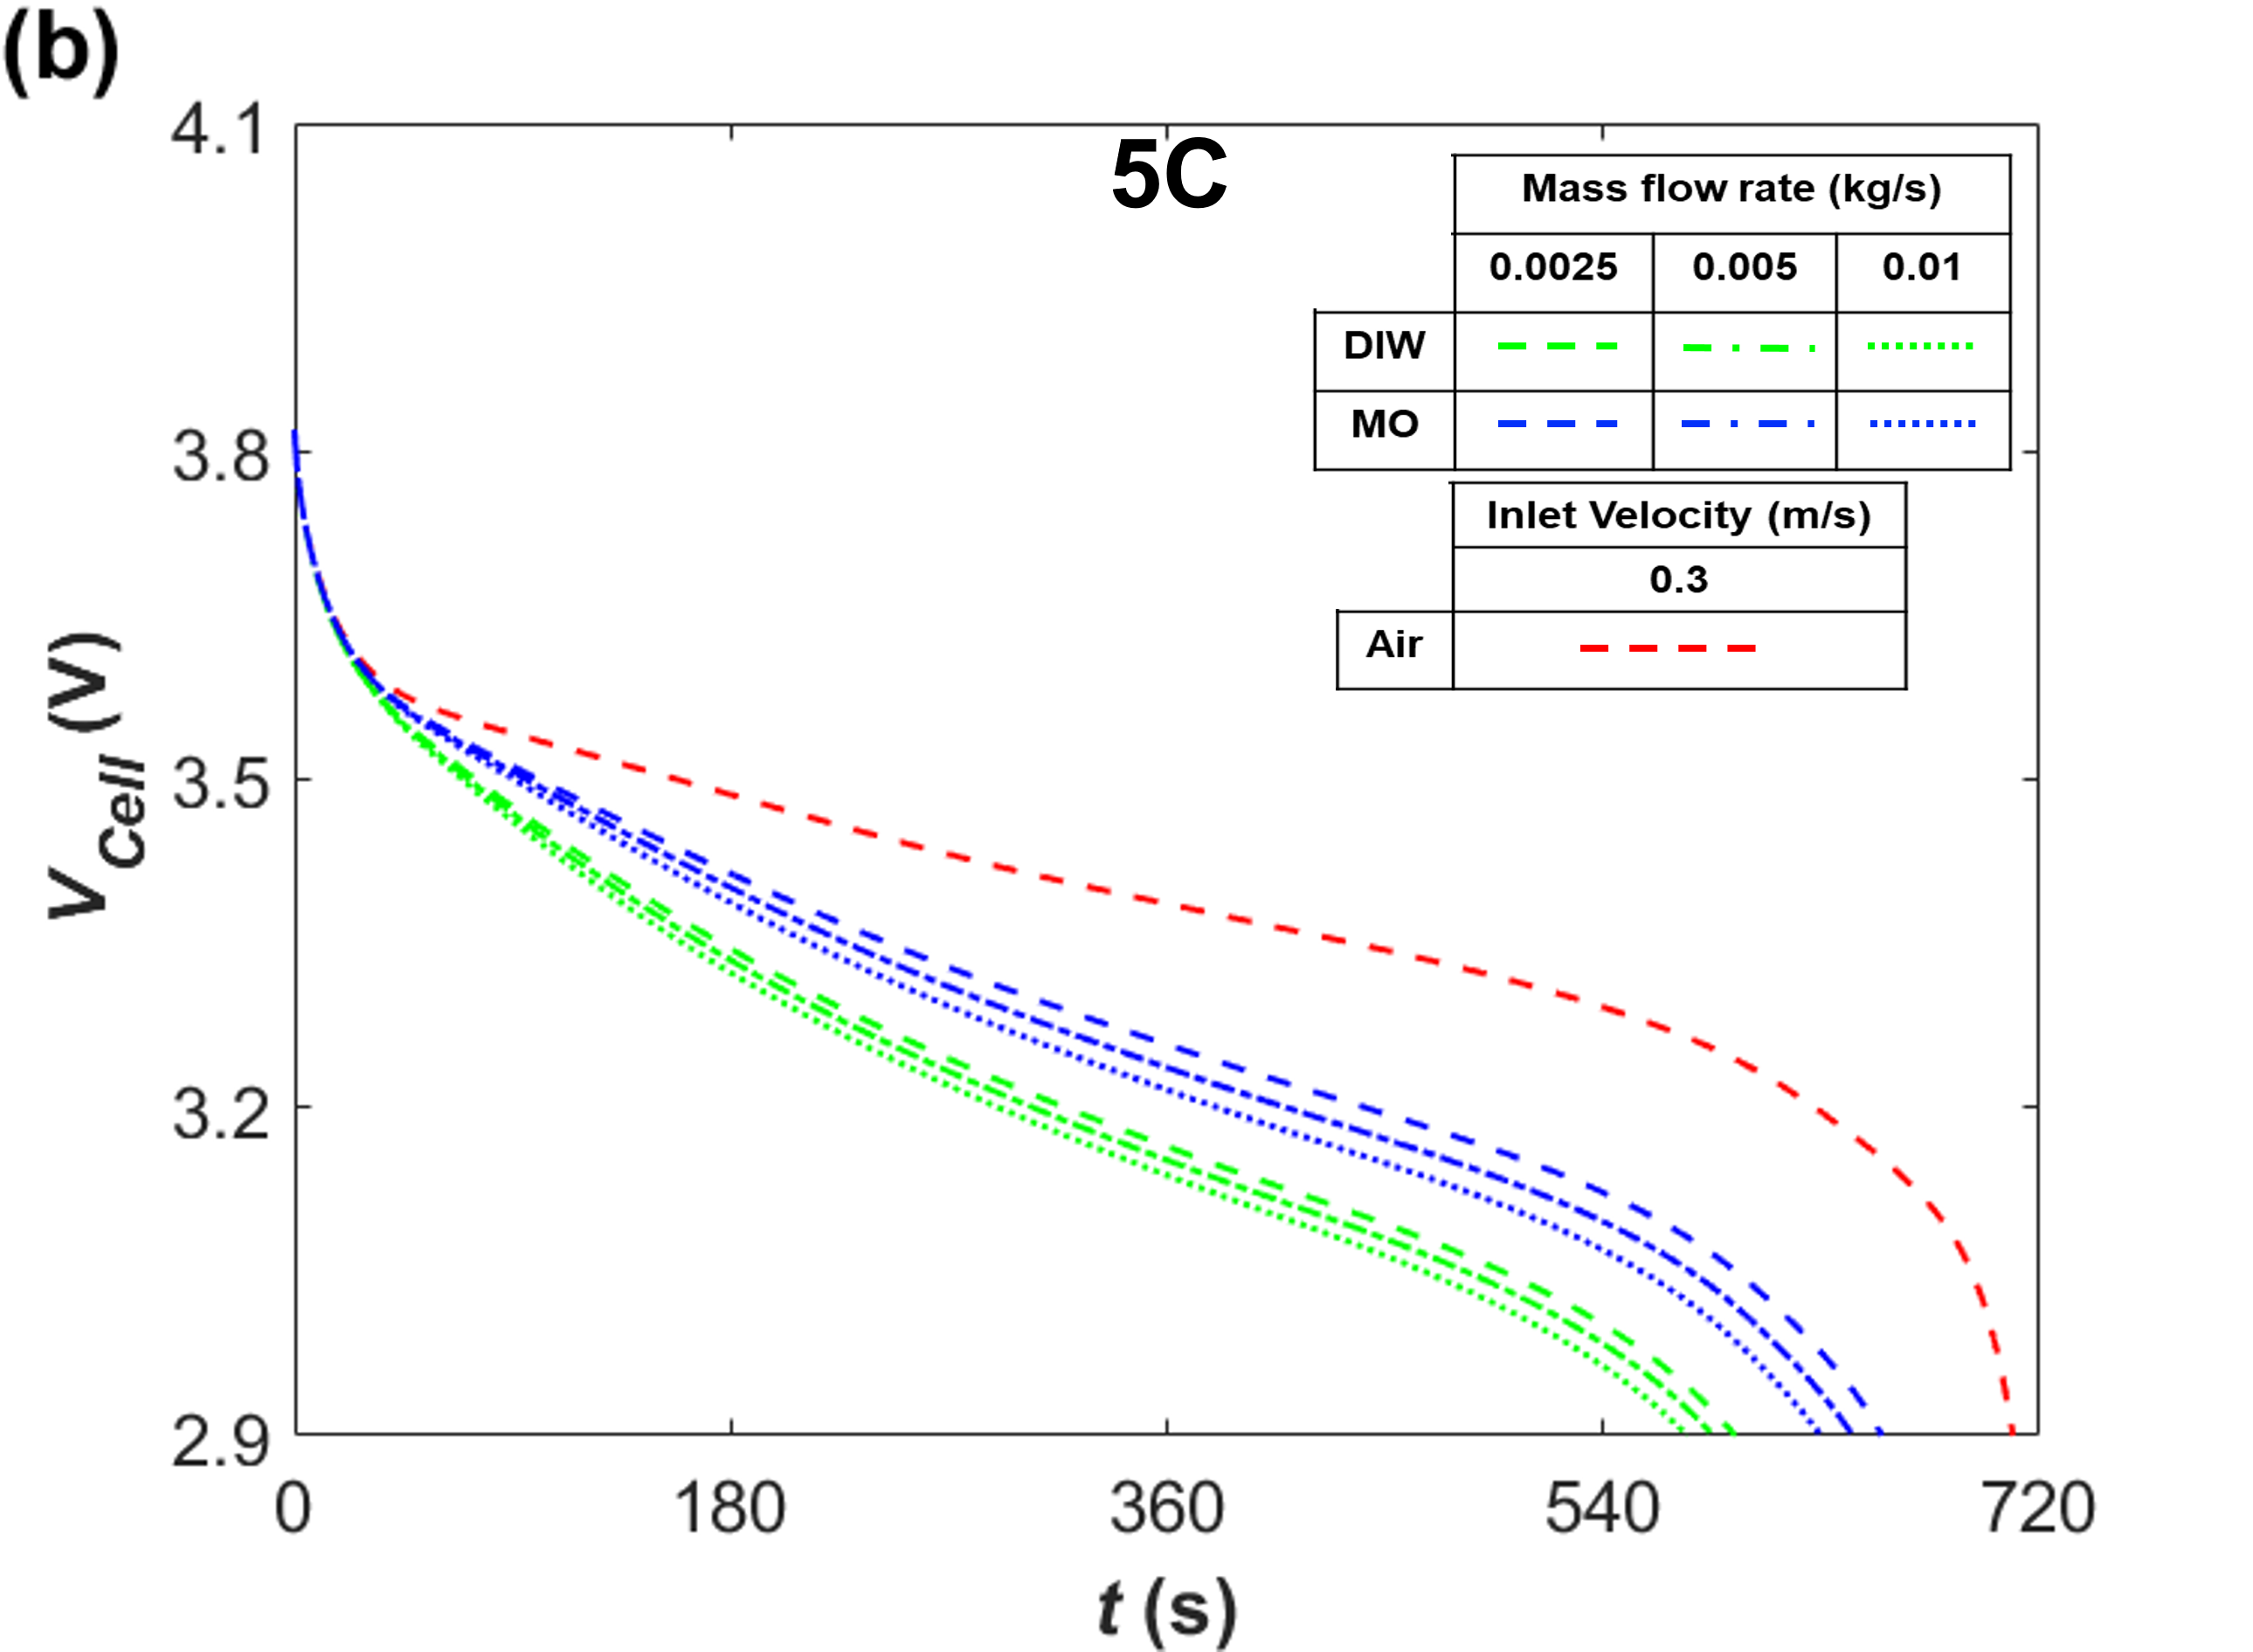
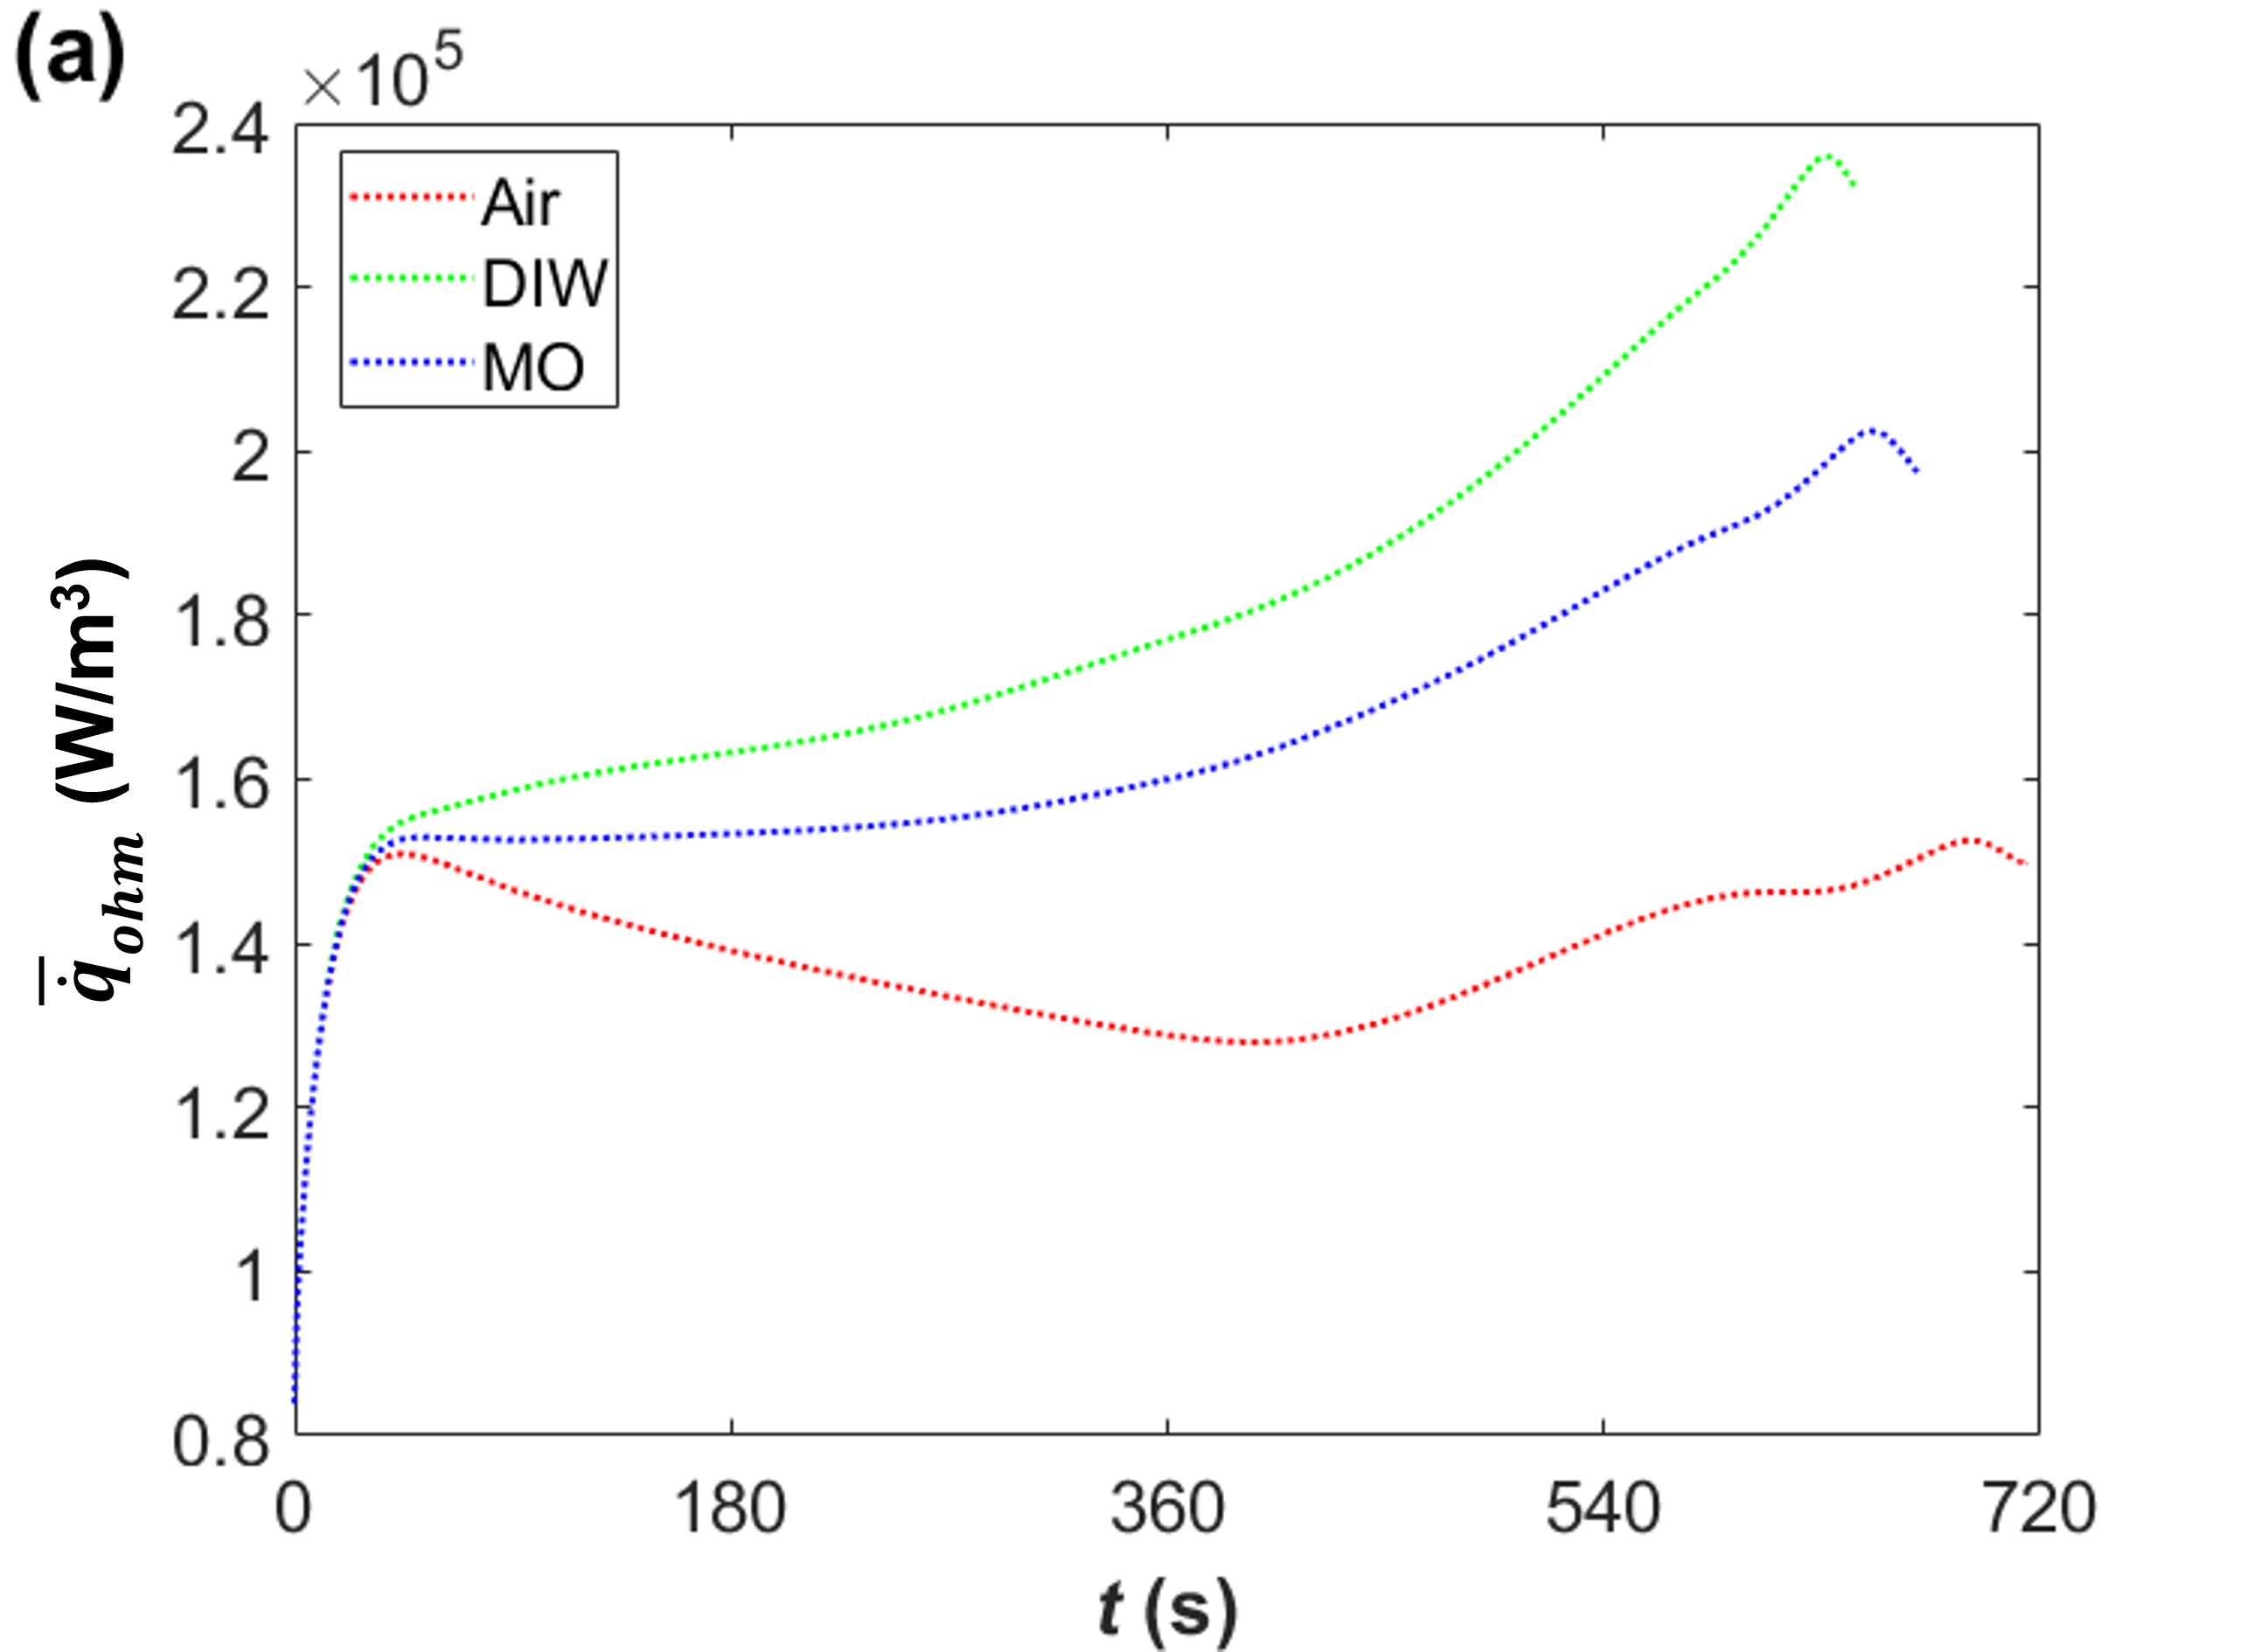
Several key conclusions can be drawn from the electrochemical and thermal results for immersion cooling with different fluids and mass flow rate combinations (see Figures 7 for results at 3C and 5C.).
First, we can see that as the mass flow rate decreases, the magnitude of increases for both dielectric fluids (i.e., DIW & MO). This follows the expected trend since convective cooling is directly proportional to mass flow rate. However, the thermal performance of MO-based immersion cooling configuration is more sensitive to the variation in mass flow rate compared to DIW because of the inherently higher cooling capacity (as discussed in Section III-A).
Second, the evolution of the cell potential, , is also influenced by the mass flow rate as shown in panel (a) & (b) of figure 7. However, similar to average temperature rise, , the effect of mass flow rate on the cell potential is more apparent as the mass flow rate decreases and the discharge rate increases.
Third, the range of temperatures within the cell domain does not follow a straightforward monotonic trend with increasing mass flow rate at either discharge rate. Appendix A provides a more detailed discussion on the temperature variation within the cell.
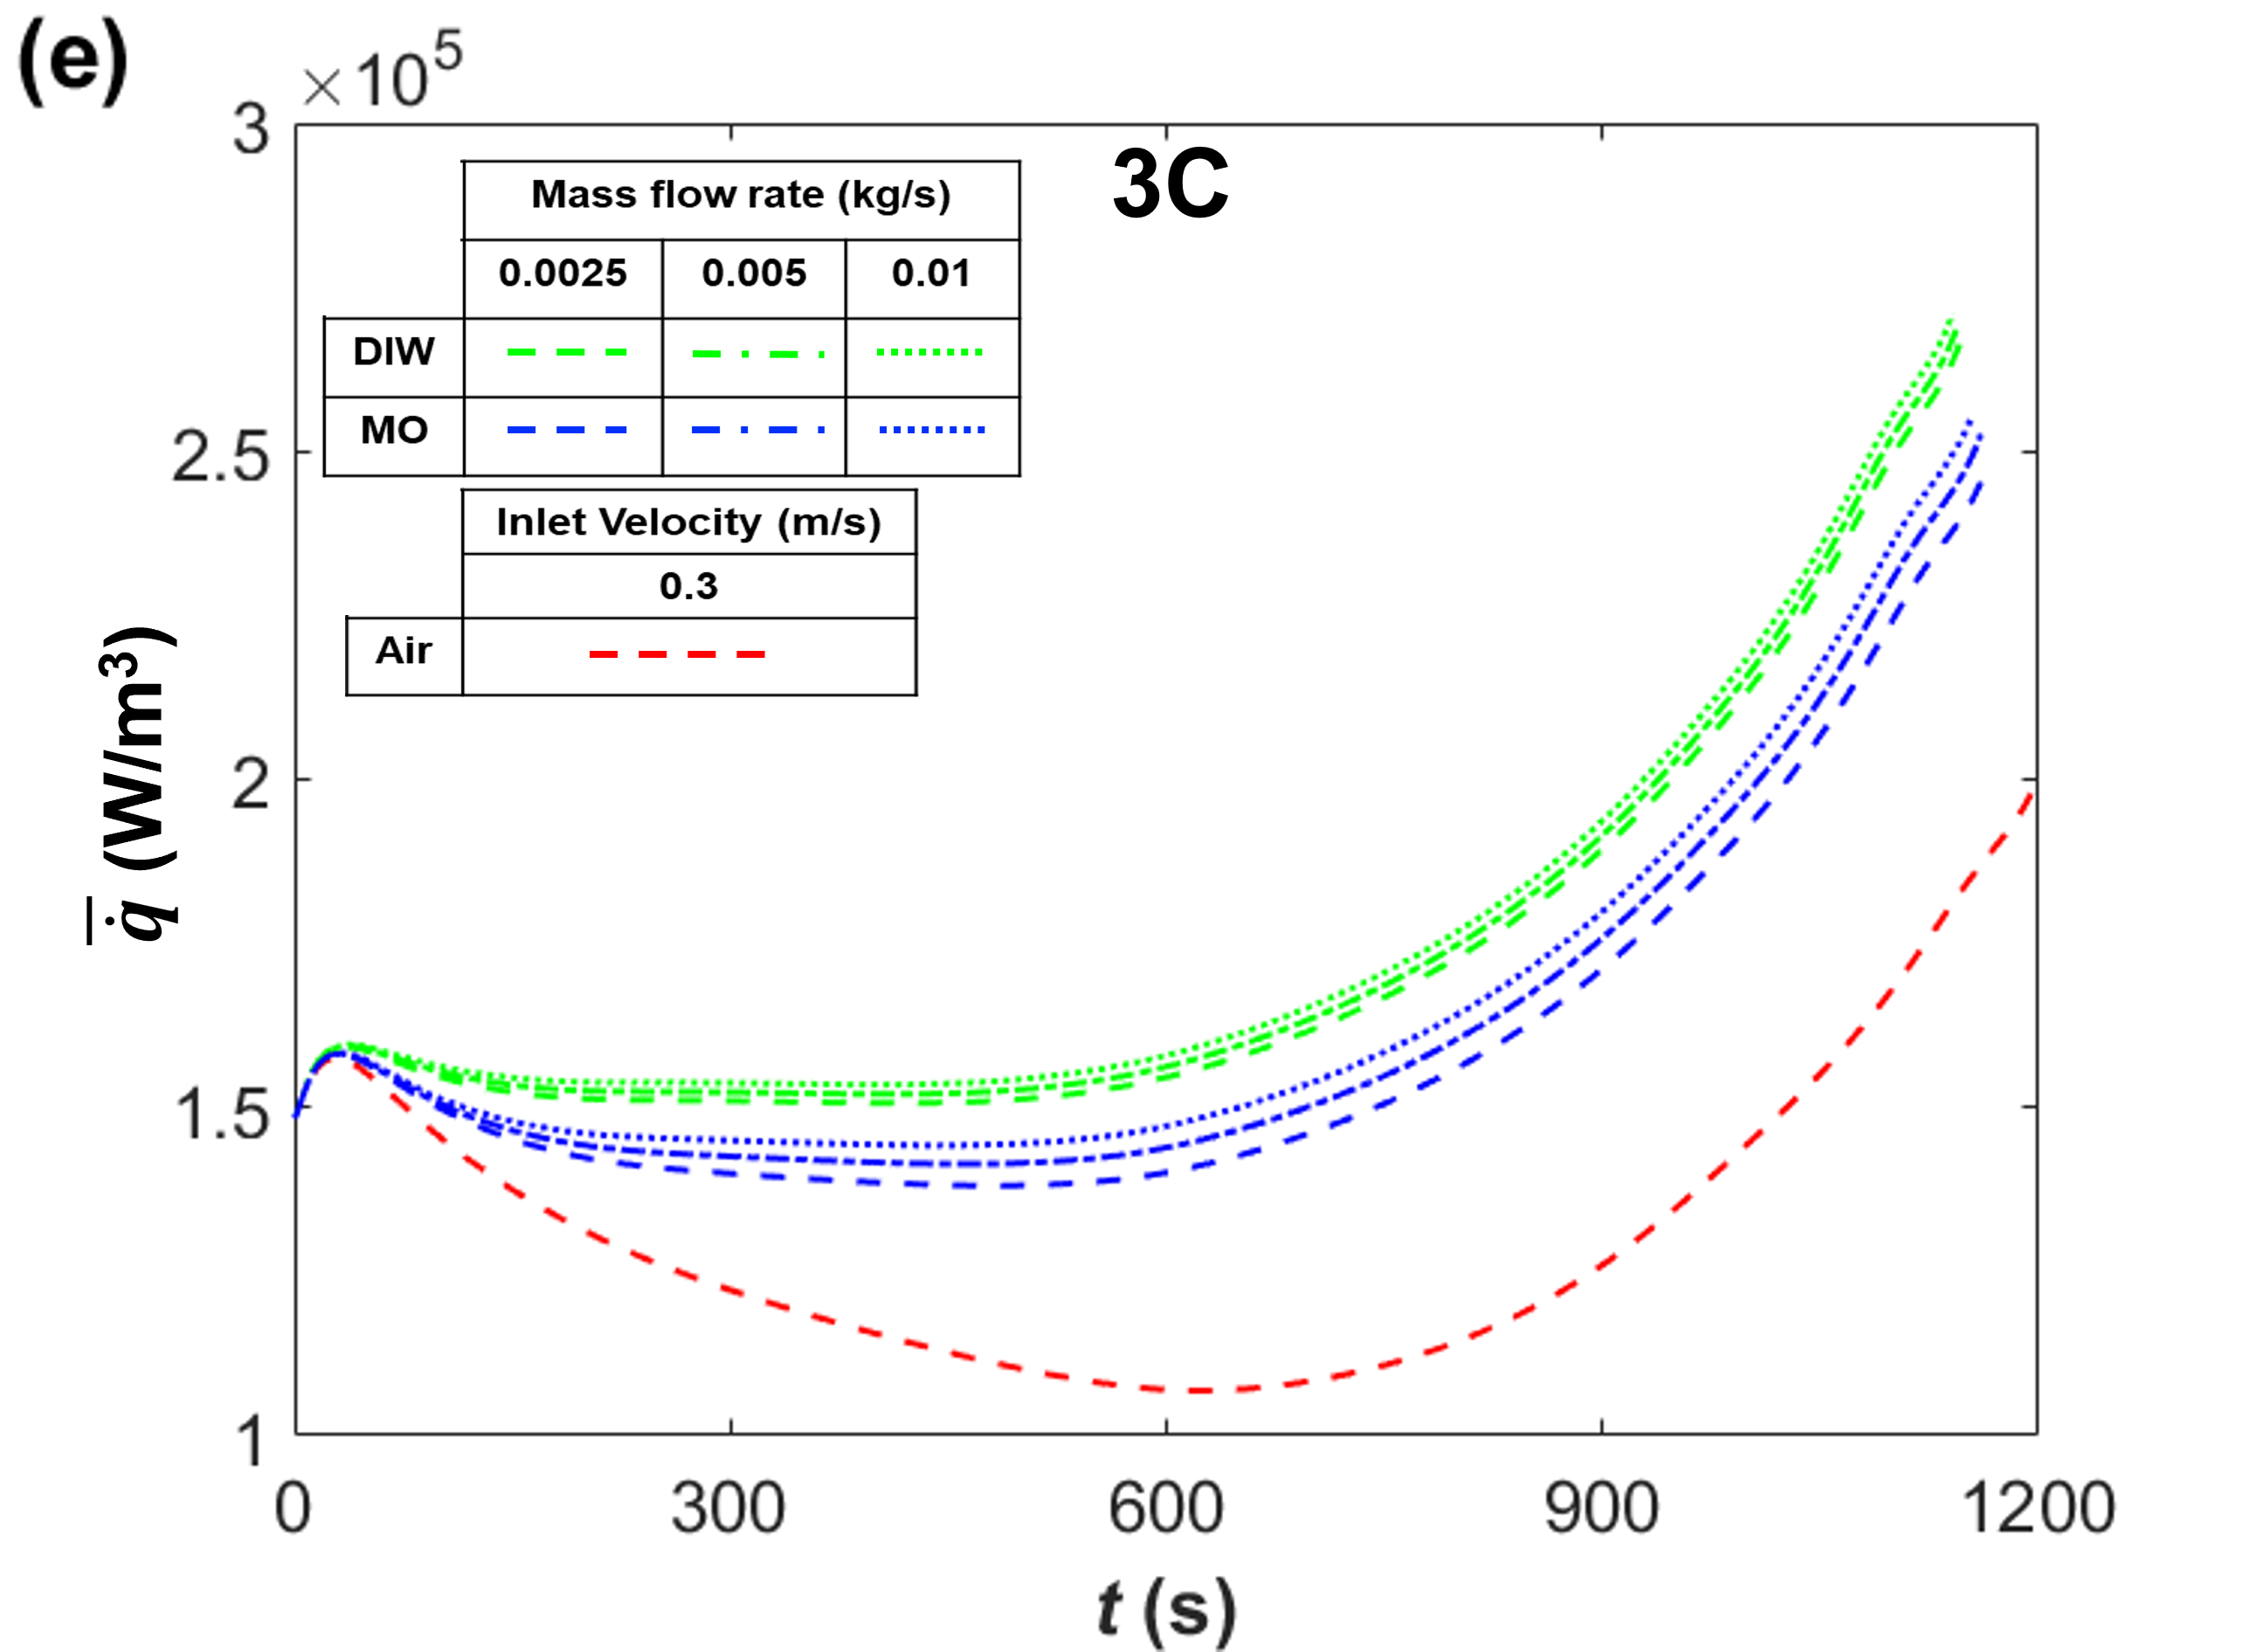
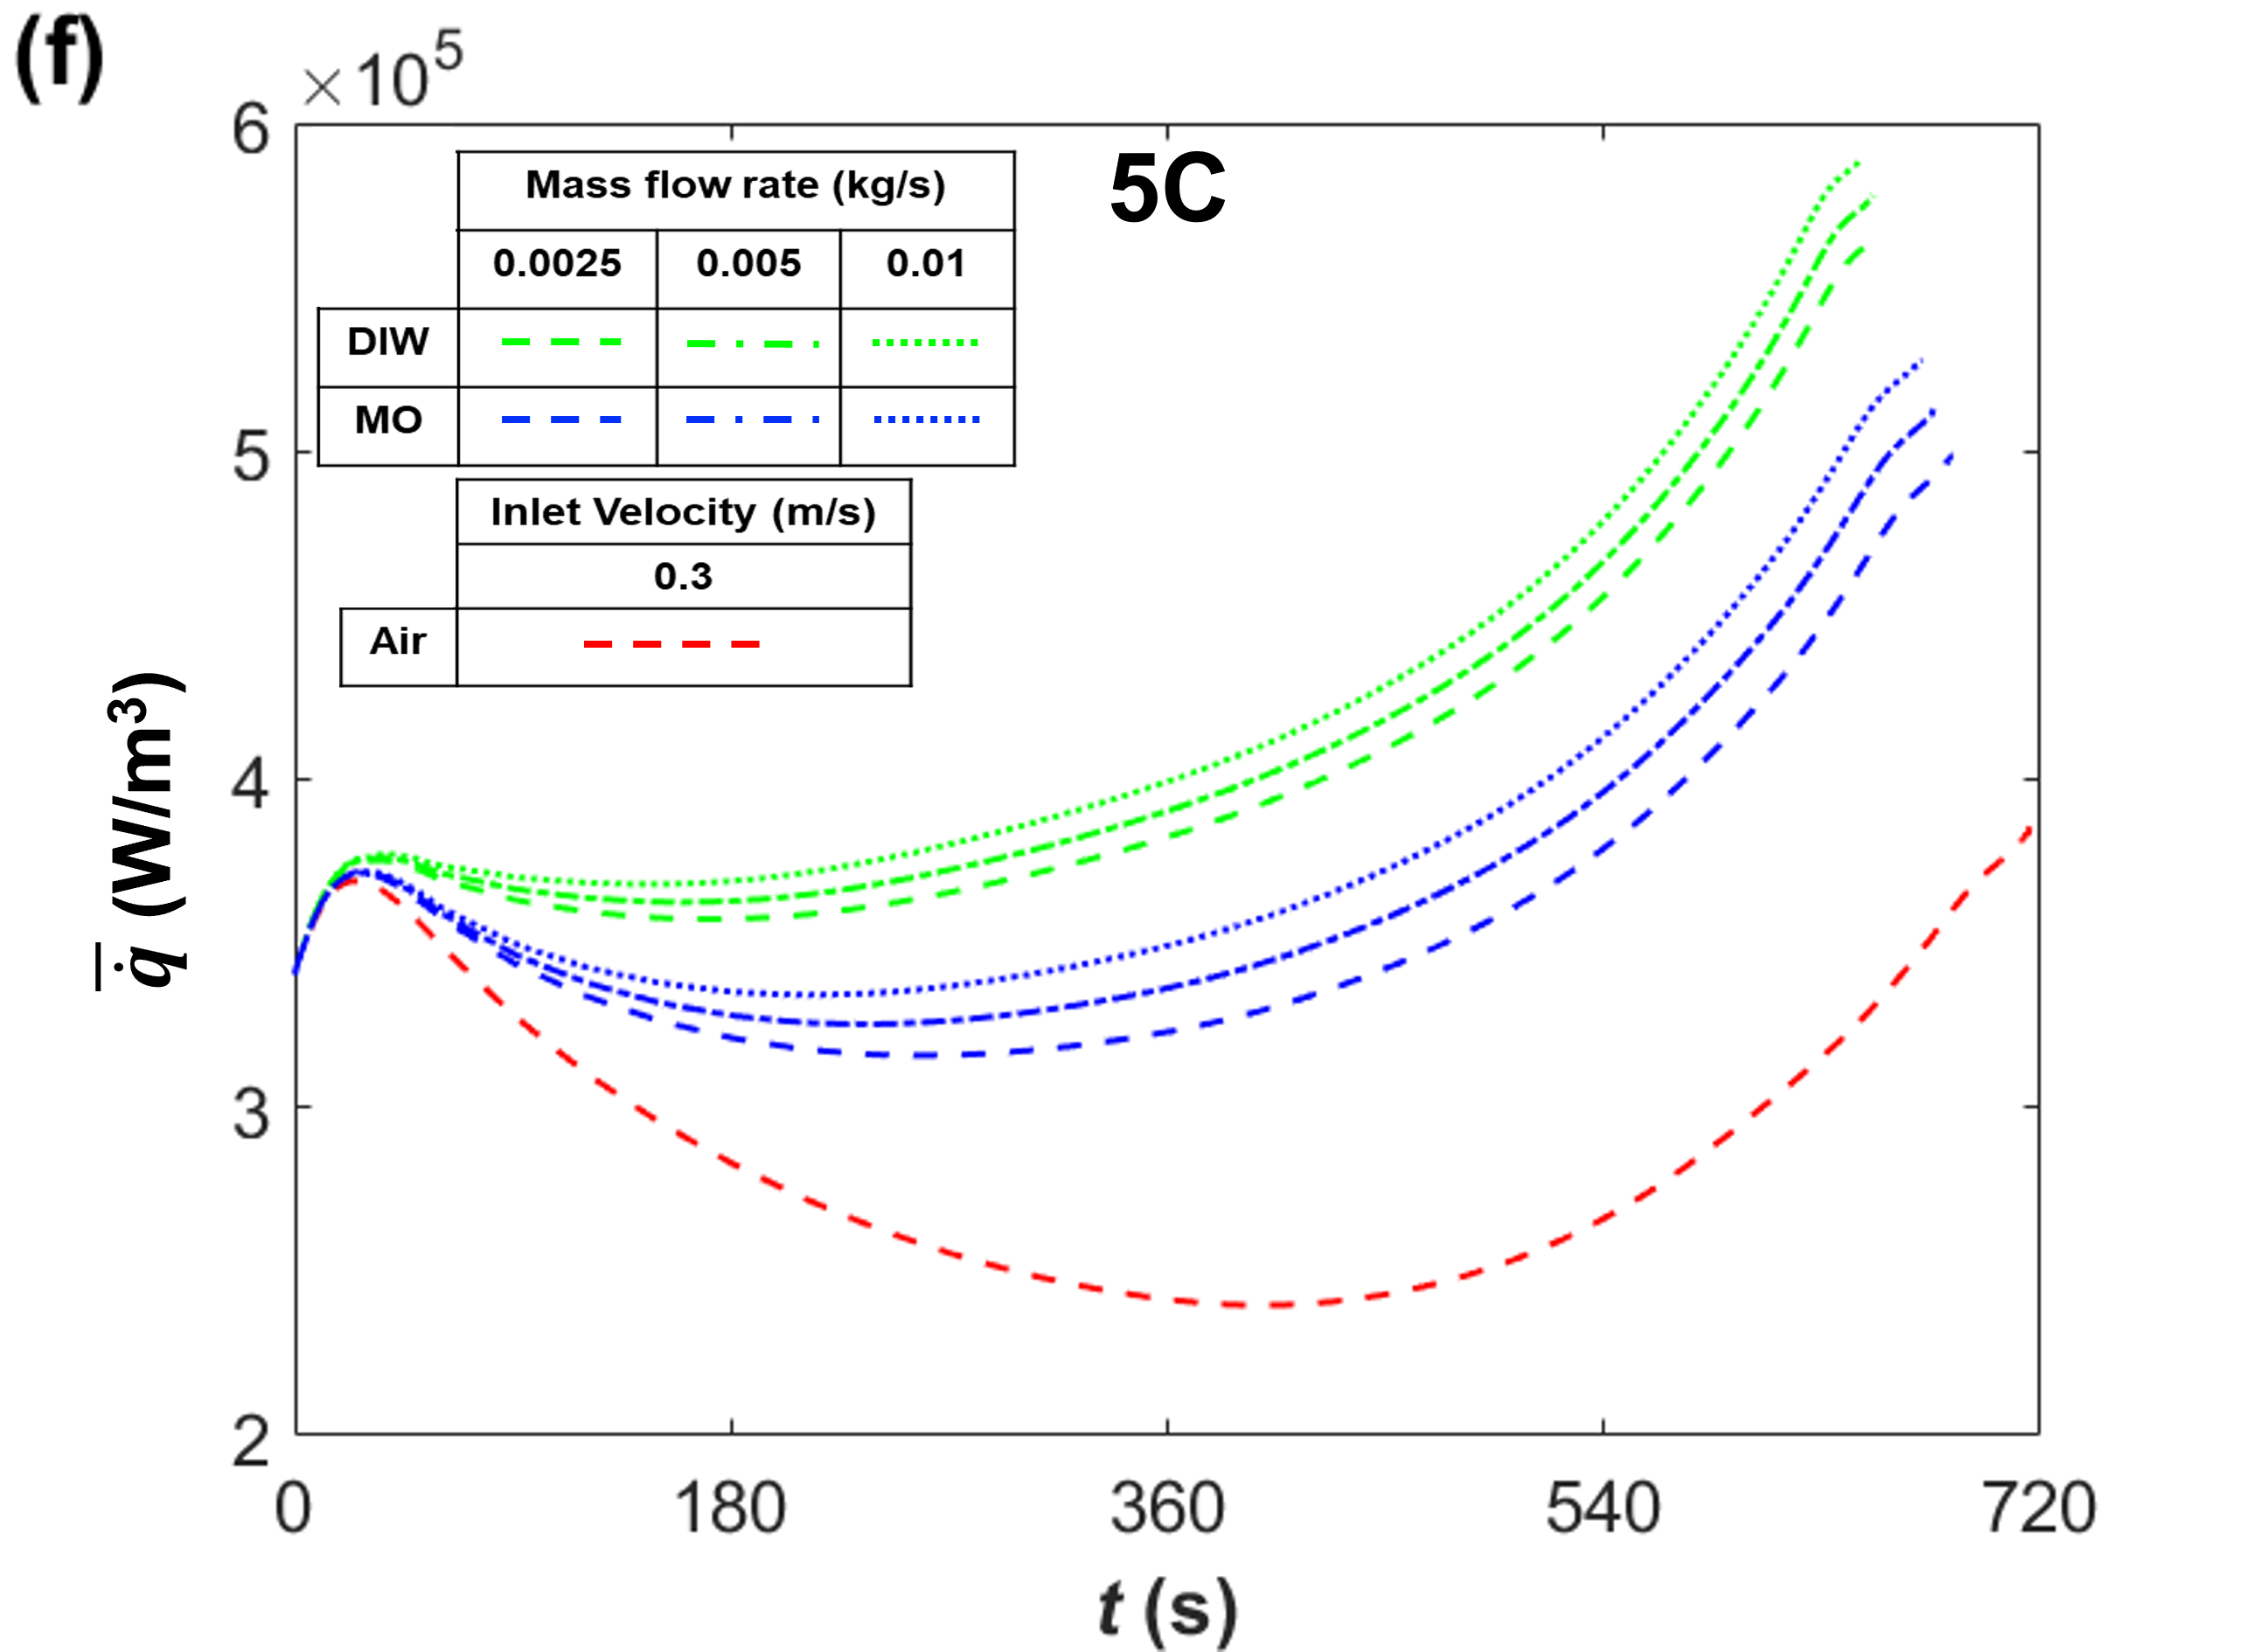
Lastly, despite the average temperature rise being the lowest for DIW-based configuration with the highest mass flow rate (0.01 kg/s), it has the highest rate of heat generation, , as shown in Figure 7(e) and (f). In fact, the average heat generation rate is the lowest for the air-cooled configurations , which has the highest temperature rise. Overall, there is a clear trend (here and in Section III-A) that lower average temperature rise leads to larger heat generation rates. Initially, this seems somewhat counter-intuitive (if one considers that more heat generation ties to higher temperatures assuming a fixed convection coefficient for heat losses and uniform and constant material properties). However, here, the temperature and heat generation rate are closely coupled. Specifically, the high heat generation at lower temperatures results from the temperature dependence of the electrical resistance of the cell. Due to the electrochemical kinetics, the cell resistance decreases with increasing temperature in this temperature regime. More insight into this thermal behavior is provided in Appendix A. This explanation is further backed by the observation that the DIW-based cooling suffers from a higher capacity loss (, when compared to the other two fluids (MO and Air), especially at high discharge rates (3C and 5C). In other words, LIB cells cooled with DIW discharge quicker than other cooling configurations (see also Section III-A). The capacity loss follows a clear monotonous inverse trend with respect to average temperature, , for all the configurations at a given discharge rate (increasing reduces the apparent capacity loss). This effect is also important for battery cells operating at low ambient temperatures [26, 5, 2, 15].
To summarize, the highly cross-coupled and nonlinear nature of the immersion-cooled battery system impacts heat transfer and electrochemical performance. Therefore, as the battery starts discharging, the temperature rise is lower for high-performance cooling fluids in immersion cooling configurations. This results in higher electrical resistance of the cell, which in turn leads to higher compared to less effective cooling cases. However, due to the better heat dissipation for the higher-performance fluid, the temperature rise remains lower.
III-B2 Pressure Drop and Pumping Power
One other critical parameter of forced immersion cooled systems is pressure drop () required to drive the flow at the required mass flow rate. This parameter governs the pumping power () required to operate the cooling system. The pressure drop depends strongly on the type of fluid (and its underlying properties such as viscosity) and the flow rate. Note that the fluid property is assumed to be independent of temperature in the present study since the domain only consist of single cell and therefore pressure drop is insensitive to cell discharge rate for these fluids. However, the temperature dependency may becomes important for immersion cooled BTMS with large number of cells. Table VI shows the pressure drop () and pumping power () for DIW and MO at three different flow rates in the immersion cooling domain. The highest and is for the mineral oil at the highest flow rate, while the lowest and water at the slowest flow rate. This is due to the fluid viscosity: for MO is approximately 50 greater than that of DIW. In all cases, the pumping power is less than 150 W. This corresponds to less than 150 Wh of energy for pumping during the discharging process of 1C. For comparison, one 18650 battery cell stores approximately Wh[19, 43]. Thus, for a single cell, the pumping power is not a major concern.
| Mass Flow Rate (kg/s) | DIW | MO | ||
|---|---|---|---|---|
| (Pa) | (W) | (Pa) | (W) | |
| 0.01 | 0.332 | 3.32 | 11.315 | 122.4 |
| 0.005 | 0.125 | 0.62 | 5.658 | 30.61 |
| 0.0025 | 0.055 | 0.13 | 2.829 | 7.65 |
III-C Sensitivity Analysis: Cooling Fluid Properties
In the previous sections, clearly, the DIW provides better thermal control than the MO. However, given that multiple properties are different between the DIW and MO, the influence of the underlying thermophysical properties of the dielectric fluids on the system performance remains unclear. To address this, we perform a sensitivity analysis by independently varying the individual properties of fluids that contribute to the cooling capacity and response of the system. Specifically, all the fluid properties [such as density (), thermal conductivity (), specific heat (), and viscosity ()] are varied one at a time considering a 50% increase and 50% decrease with respect to original properties, while other properties remain at the nominal values. So for sensitivity two set of properties are simulated: (0.5, , , and ) and (1.5, , , and ), where the terms with the subscript ‘f’ represent the original properties of fluid. This results in 8 combinations of FIC configuration for both DIW and MO to compare with the baseline fluid. For this analysis, we consider a discharge rate of 5C with a mass flow rate of 0.005 kg/s for both dielectric fluids. This case provides the most significant variation in performance for the slight change in fluid properties.
Figure 8 shows the results of this sensitivity analysis for both fluids. Generally, the thermal conductivity of the fluid, , is the most critical property of a dielectric fluid followed by in an immersion cooling configuration from the thermal aspect (at a given mass flow rate). For example, for DIW a 50% decrease in results in 24% increase in and a 50% increase in leads to 11% decline , whereas 50% decrease in results in 15% increase in and a 50% increase in leads to 8% decline . However, similar variations in the other two properties ( & ) do not result in a significant change in the thermal response of the system for both DIW- and MO-based immersion-cooled configurations. This trend is impacted by fixing the mass flow rate (at 0.005 kg/s for the sensitivity analysis) as opposed to fixing the fluid velocity or fixing the allowed pressure drop. This keeps the thermal response nearly unaltered (with respect to the original DIW and MO systems) with variations in and . For example, reducing the by 50% will approximately double the average velocity to maintain the same mass flow rate, which does not significantly alter the cooling performance of the fluid. Nevertheless, it is worth pointing out that other flow parameters such as pressure drop () will be significantly affected by varying and .
Furthermore, Figure 8 (c) and (d) show the change in the and response from the sensitivity analysis, where the bounds correspond to (0.5 , , , ) and (1.5 , , , ) for both the dielectric fluids. Note that the lower thermal conductivity (0.5 ) corresponds to a higher temperature and lower capacity loss. This again highlights the inverse relation between the temperature rise and capacity loss (see Section III-B). Moreover, the 50% change in thermal conductivity for the MO-based fluid leads to more significant variation in the response compared to the DIW. To summarize, the superior thermal performance of DIW can be attribute to its higher and , which are approximately 4 and 2 higher than that of MO.
III-D Metric for Comparing Immersion Cooling Configurations
As mentioned in Section I, analyzing immersion cooling requires detailed numerical simulations. There is no universal metric that can be used to compare different combinations of mass flow rate and type of fluid with different discharging rates. Such an analytical metric could be very helpful in the design and operation/control of immersion cooling systems. Often empirical heat transfer correlations are developed for particular flow configurations, and correlations exist for a range of fluids and operating conditions (for example, forced vs. natural convection, internal vs. external flow, and different geometries). Such correlations can become the foundation for a metric to estimate cooling configuration performance without detailed numerical simulations. To begin, we consdier a heat transfer correlation for a cylinder in crossflow [44, 45], which has been updated to account for the cylinder in duct flow [46]. This correlation predicts for Nusselt number () then predicts the heat transfer coefficients:
| (18) |
where is the Reynolds number based on the cell diameter () and average inlet velocity (), is the Prandtl number, and is the width of the duct ( in the present analysis). Note that () accounts for the effect of duct and cylinder geometry.
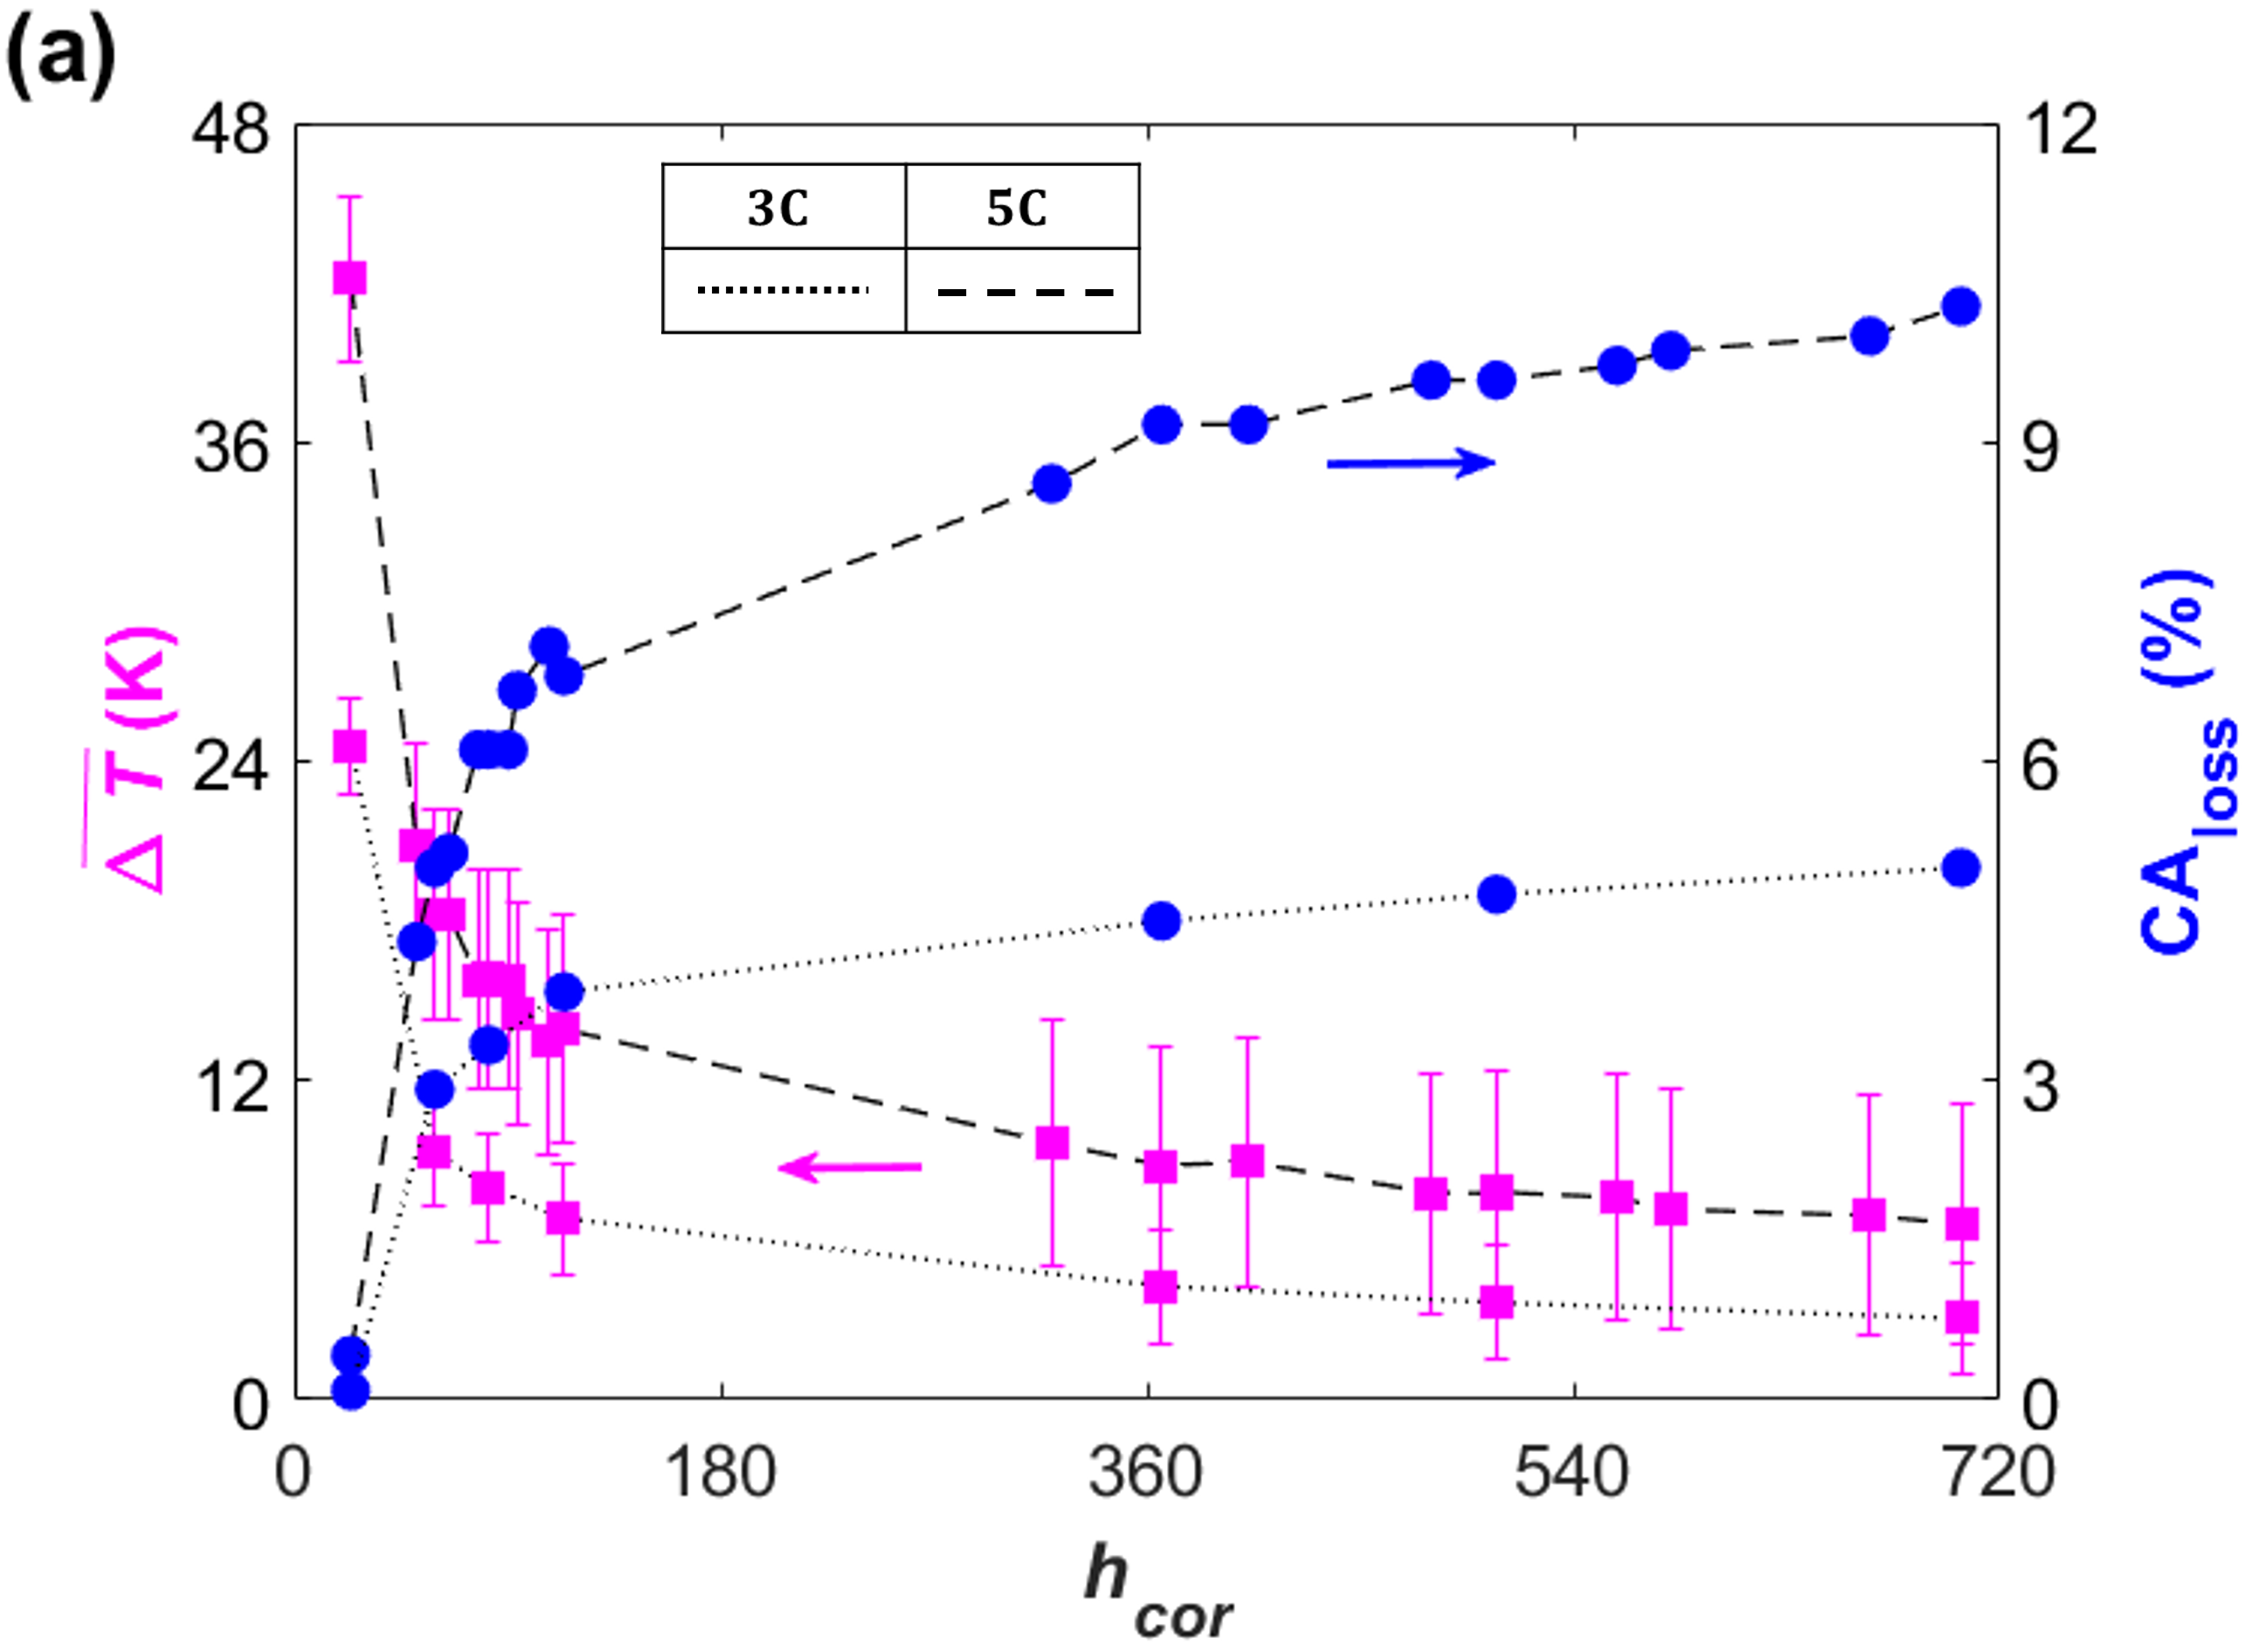
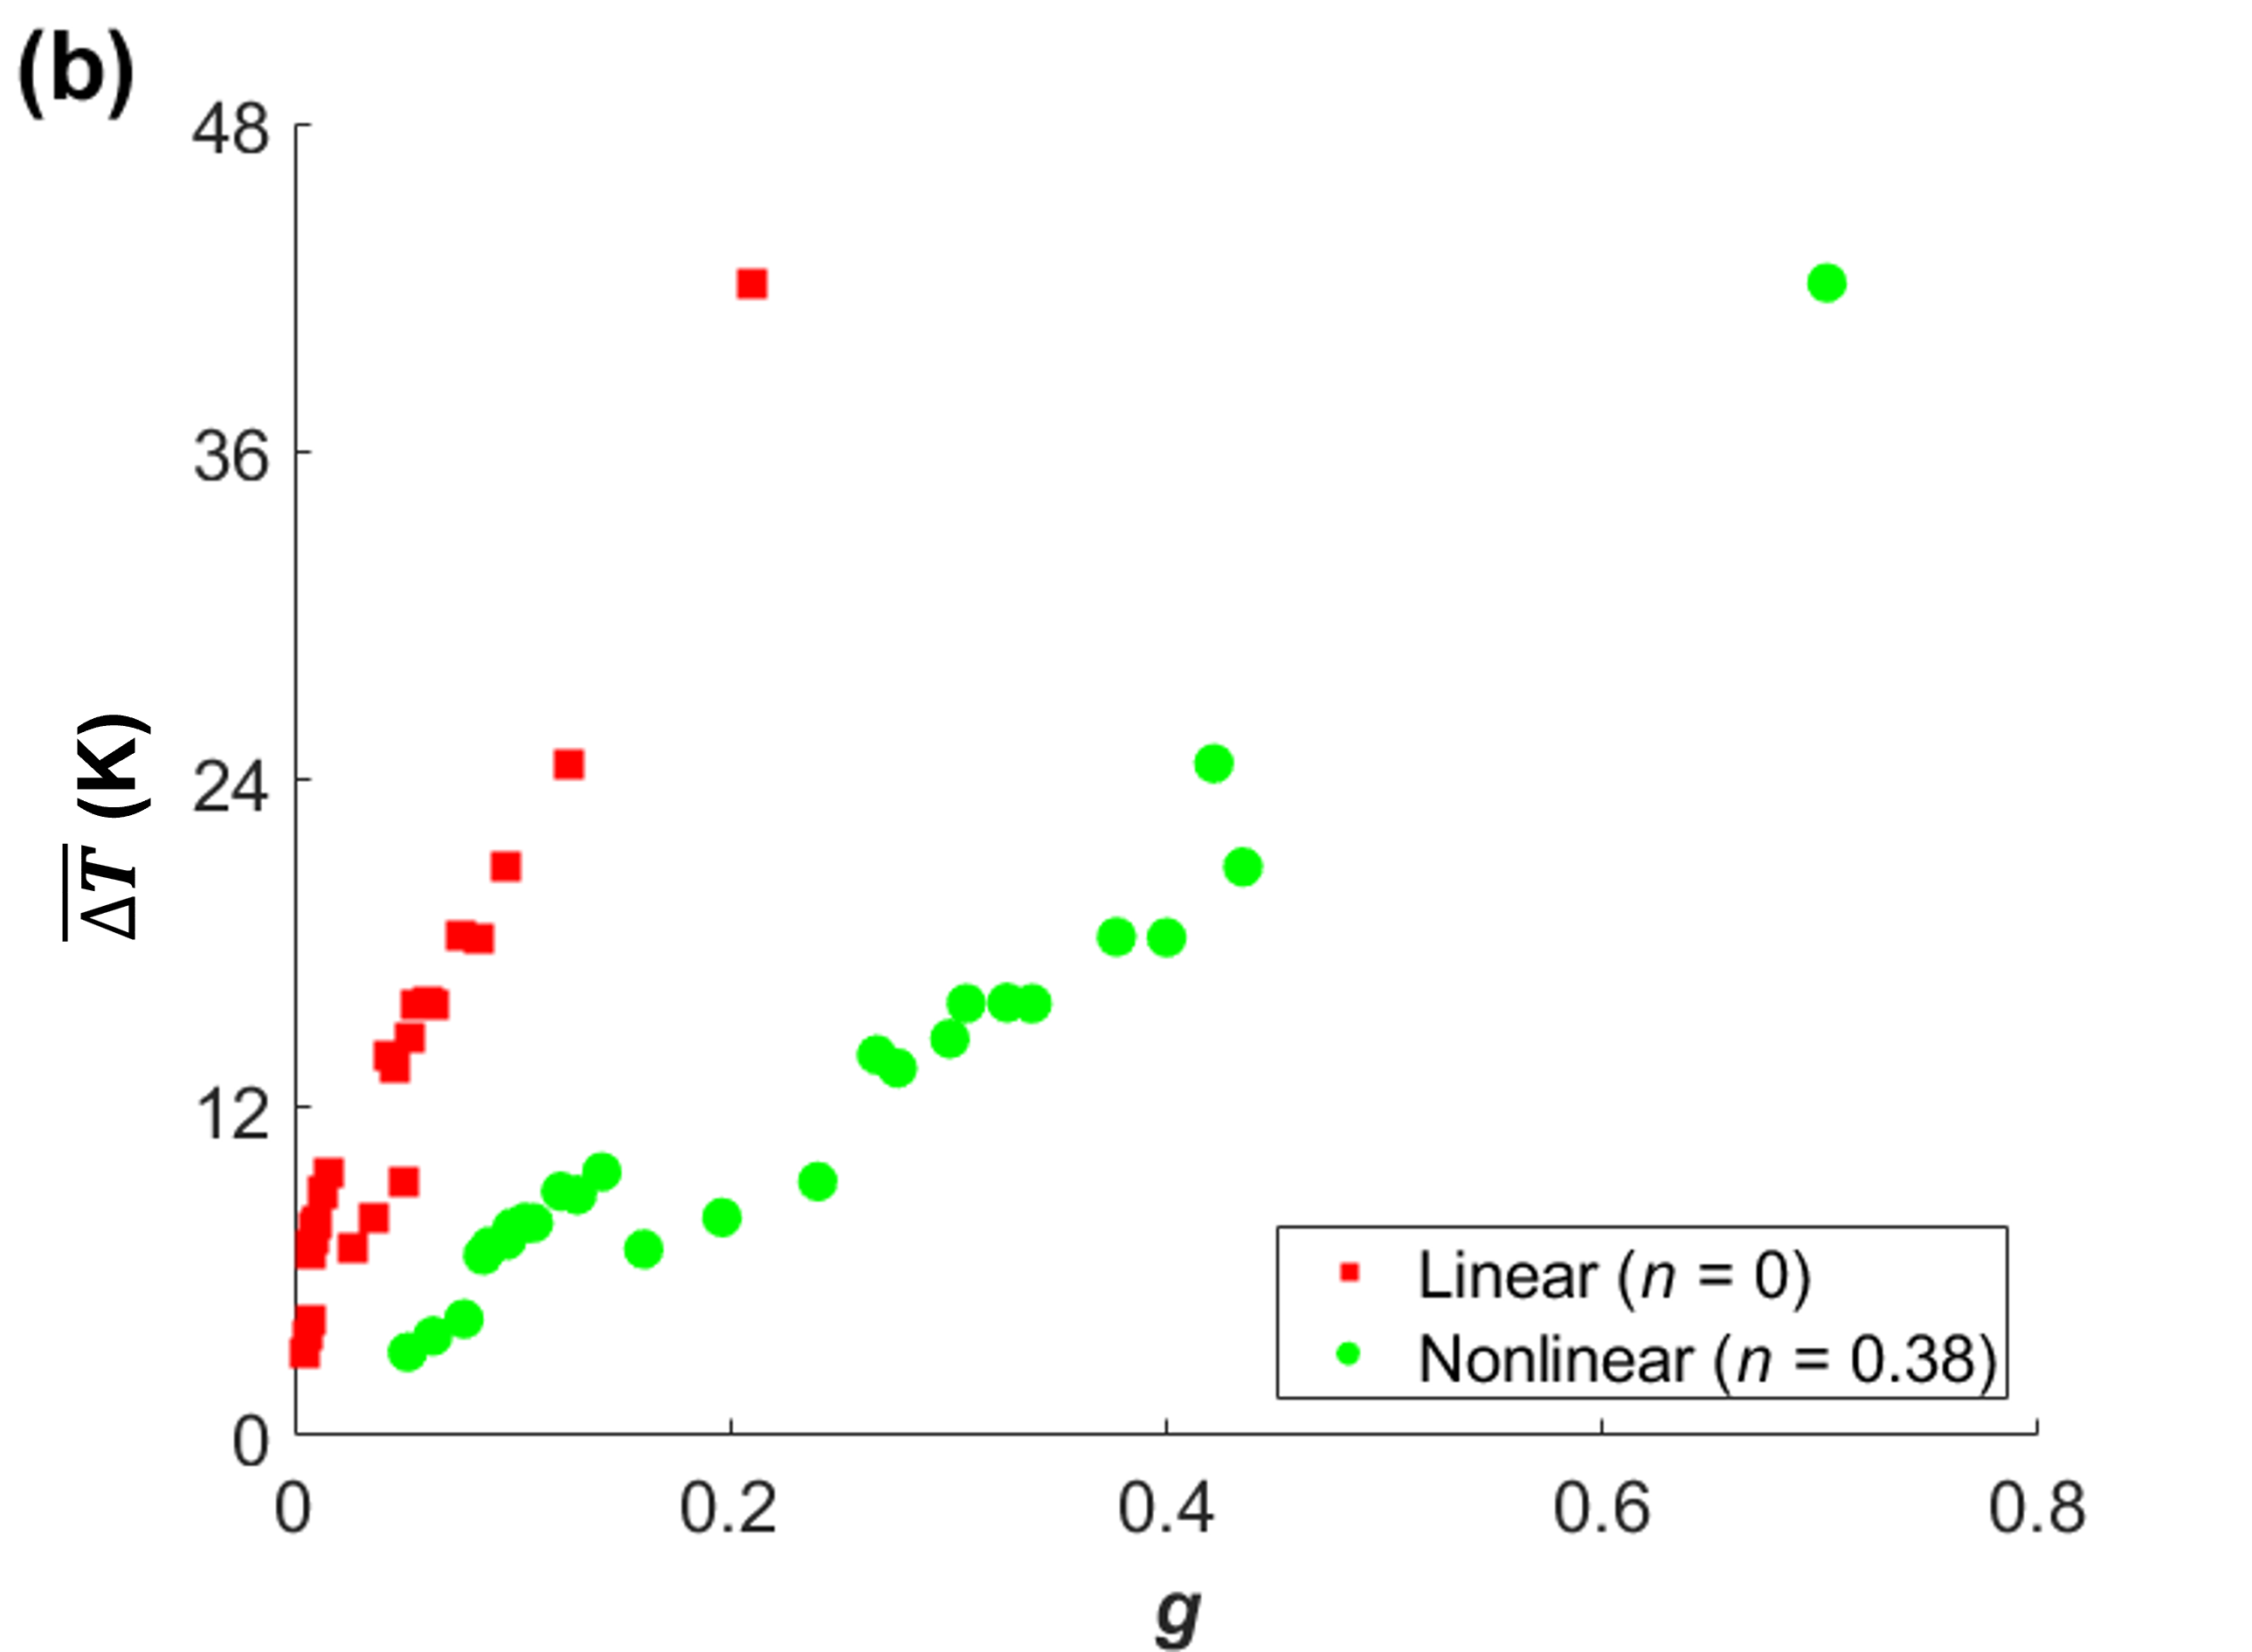
Figure 9 (a) shows the average temperature rise and capacity loss for all the cases spanning 3 mass flow rates (0.0025, 0.005, and 0.01 kg/s) and 19 combinations of different fluid properties (DIW, MO, Air, and 16 hypothetical fluids from the sensitivity analysis). This corresponds to 7 data points for 3C and 24 for 5C discharge. For each discharge rate, there is a monotonic decrease in the temperature rise and a monotonic increase in the capacity loss as the convection coefficient increases. This demonstrates that the convection correlation can be a metric that can be used for analytical estimates on which cooling fluids flow rates will perform well at a given discharge rate.
In order to extend the versatility, the variation with cell discharge rate should be included in the proposed. One possible approach is to include an estimate of the heat generation rate as it is a direct function of the discharge rate and is linked to temperature response. However, the heat generation rate is not a quantity that is known accurately before computational analysis, so we can make some estimates for a simplified metric. From a lumped capacitance heat transfer analysis, we can link the temperature rise and the heat generation rate as , where is the cell volume and is the surface area in contact with the cooling fluid. If we assume that the heat generation rate scales linearly with discharge rate ( is independent of cooling performance), we can estimate , where is the discharging rate (e.g., 5 for 5C) and is a function of LIB cell properties, which is an NCM cell in the present study. If we include some non-linearity (i.e., is dependent on cooling), then we can estimate , with a power law dependence on the convection coefficient. Mathematically, these can be consolidated into a single form:
| (19) |
where we define a new metric to estimate system performance. For the linear case, , and for the nonlinear case , based on the best fit of the data in Figure 9(a). Figure 9(b) shows the temperature rise for all immersion cooling configurations as a function of this proposed metric assuming is constant for a given LIB cell. Although there is some scatter in the data, a clear monotonic increase in temperature rise with respect to is apparent. Thus, is an effective metric to compare thermal performance of different combinations of fluids, flow rates, and cell discharge rates.
IV Conclusion
In the present study, we analyze the electrochemical, thermal, and mechanical response of an 18650 battery cell with different immersion cooling fluids and flow rates using a fully-coupled modeling approach. Specifically, the detailed pseudo-2D electrochemical model is solved in conjunction with a 3D thermo-fluid model, and results are integrated with a mechanical model to predict stresses in the cell.
From the analysis of different fluids, flow rates, and discharge rates, the average cell temperature rise follows a trend opposite to that of the capacity loss and average heat generation rate due to the coupled effects of temperature and electrochemical response. Due to the improved electrochemical kinetics with increasing temperature in the temperature range of these simulations, cells operating at lower temperatures due to improved cooling dissipate more heat than those operating at higher temperatures. In turn, the discharging rate is impacted by the temperature rise and higher temperatures retain more battery capacity for these moderate temperature rises. Note that at higher temperatures, catastrophic effects can occur when the heat generation rate increases with increasing temperature leading to thermal runaway. Considering the coupled thermal and electrochemical effects, a holistic understanding of the forced immersion cooling system is necessary for the efficient design and operation of such a system.
The sensitivity analysis, considering varying the dielectric fluid properties, reveals that forced immersion cooled system thermal performance is most sensitive to thermal conductivity and specific heat of the fluid (for a fixed mass flow rate and cell discharge rate). Therefore, fluids with high and will provide superior temperature control for similar operating conditions. This is evident in the results that illustrate that DIW leads to lower average temperature rises compared to MO.
Finally, starting from a correlation for the convection heat transfer coefficient , we propose and demonstrate the applicability of a metric that can rank the performance of different cooling fluids and flow rates across different cell discharge rates . There is a clear monotonic decrease in the temperature rise and increase in capacity loss as rises at a given discharge rate. The proposed metric extends this analysis to include the impact of discharge rate on cell response. Now, with a single analytical equation, potential fluids for immersion cooling can be ranked and the impact of changing parameters can be analyzed. Combining the analytical metric to screen potential fluids with the multi-physics numerical models can make the battery thermal management system design more efficient. As mentioned in the introduction (see Section I), although the present study focuses on discharging process, all the finding (like temperature control, sensitivity analysis and use of metric) is valid for immersion cooling based BTMS of LIB batteries independent of charging/discharging operation.
Acknowledgment
This material is based upon work supported by the National Science Foundation under Grant No. 2143043. Any opinions, findings, and conclusions or recommendations expressed in this material are those of the authors and do not necessarily reflect the views of the National Science Foundation.
Appendix A: Details of Heat transfer within the LIB cell
As highlighted in section III-B, the DIW-based forced immersion cooling configurations have the highest average heat generation despite having the lowest rise compared to all the fluids, which is attributed to the cross-coupled nature of LIB system: the electrical resistance of the cell decreases with increasing temperature leading to lower heat generation for the poorly cooled systems.
To gain more insight into the effect of the type of fluid on the temperature within the LIB cell, in this section, we consider the range of temperatures within the cell () for various combinations of discharge rate (1C, 3C, or 5C) and type of fluid (see Figure 10(b)). The range temperatures within a cell is the largest for DIW and smallest for air. This correlates with the basic heat transfer analysis, which indicates that the fluid cooling performance, as expressed by the heat transfer coefficient , impacts both the average temperature of the cell and the temperature gradients within the cell as indicated by the Biot number (), which is roughly a ratio internal to external temperature differences for a system. It is used to determine when internal temperature gradients are negligible: . Fluids with effective cooling performance will have large values making it more likely that the internal gradients are significant. However, this explanation alone does not fully explain the results at a 1C discharge rate, where air has a slightly higher range of temperatures in the cell compared to the dielectric fluids. At this discharge rate, the heat generation rate is low and is fairly insensitive to the cooling fluid. Overall, these trends highlight the complex and coupled nature of heat transfer and electrochemical performance of immersion-cooled battery systems as the temperature gradient within the system is affected by the effectiveness of the external cooling system and the absolute magnitude of the temperature rise in the domain.
Appendix B: Effect of forced immersion cooling with tab cooling
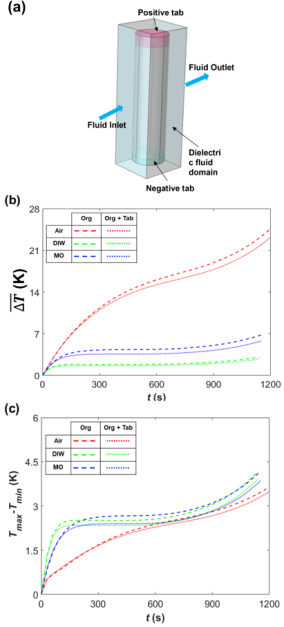
For the geometry evaluated thus far (see Section II-A), only the lateral (cylindrical) surface of the LIB cell is cooled in the original geometry (see Figure 1). However, flowing the immersion cooling fluid over the tabs, in addition to the lateral surface of the cell, can improve performance [32] in part because the thermal conductivity of the jellyroll is high in the axial direction making this pathway for heat removal more efficient. Figure 11 (a) shows the forced immersion cooling with tab cooling (Org +Tab) geometry, where ’Org’ means the original configuration shown in Figure 1. Apart from the added flow passages above and below the cell (of height ), all other geometrical parameters are the same as Figure 1. Here, we focus on a discharge rate of 3C with a mass flow rate of 0.01 kg/s for DIW and MO. The results are compared to air with an inlet velocity of 0.3 m/s.
Figure 11(b) shows that the average temperature rise decreases slightly with the addition of tab cooling for cells operating at similar conditions. The change in the temperature rise is the largest for air and smallest for DIW, which is directly related to the cooling performance of the fluid. Higher cooling capacity reduces the average temperature rise. Therefore, adding tab cooling has a smaller effect for these systems than the air-cooled case. Moreover, the range of the temperature distribution within the LIB cell is decreased with the addition of tab cooling as illustrated in Figure 11(c). Note that these results are for discharging at 3C and 0.01 m/s, but the performance may vary for different combinations of discharge rate and mass flow rate similar to the response observed for the case without tab cooling.
References
- Chu and Majumdar [2012] Steven Chu and Arun Majumdar. Opportunities and challenges for a sustainable energy future. Nature, 488(7411):294–303, 2012. ISSN 00280836. doi: 10.1038/nature11475.
- Wang et al. [2016] Qian Wang, Bin Jiang, Bo Li, and Yuying Yan. A critical review of thermal management models and solutions of lithium-ion batteries for the development of pure electric vehicles. Renewable and Sustainable Energy Reviews, 64:106–128, 2016. ISSN 18790690. doi: 10.1016/j.rser.2016.05.033.
- Dunn et al. [2011] Bruce Dunn, Haresh Kamath, and Jean Marie Tarascon. Electrical energy storage for the grid: A battery of choices. Science, 334(6058):928–935, 2011. ISSN 10959203. doi: 10.1126/science.1212741.
- Zeng et al. [2021] Yuqiang Zeng, Divya Chalise, Sean D. Lubner, Sumanjeet Kaur, and Ravi S. Prasher. A review of thermal physics and management inside lithium-ion batteries for high energy density and fast charging. Energy Storage Materials, 41(May):264–288, 2021. ISSN 24058297. doi: 10.1016/j.ensm.2021.06.008. URL https://doi.org/10.1016/j.ensm.2021.06.008.
- Hao et al. [2018] Menglong Hao, Jian Li, Saehong Park, Scott Moura, and Chris Dames. Efficient thermal management of Li-ion batteries with a passive interfacial thermal regulator based on a shape memory alloy. Nature Energy, 3(10):899–906, 2018. ISSN 20587546. doi: 10.1038/s41560-018-0243-8. URL http://dx.doi.org/10.1038/s41560-018-0243-8.
- Lin et al. [2021] Jiayuan Lin, Xinhua Liu, Shen Li, Cheng Zhang, and Shichun Yang. A review on recent progress, challenges and perspective of battery thermal management system. International Journal of Heat and Mass Transfer, 167:120834, 2021. ISSN 00179310. doi: 10.1016/j.ijheatmasstransfer.2020.120834. URL https://doi.org/10.1016/j.ijheatmasstransfer.2020.120834.
- Kumar Thakur et al. [2023] Amrit Kumar Thakur, Ravishankar Sathyamurthy, R. Velraj, R. Saidur, A. K. Pandey, Z. Ma, Punit Singh, Soumya Kanti Hazra, Swellam Wafa Sharshir, Rajendran Prabakaran, Sung Chul Kim, Satyam Panchal, and Hafiz Muhammad Ali. A state-of-the art review on advancing battery thermal management systems for fast-charging. Applied Thermal Engineering, 226(January), 2023. ISSN 13594311. doi: 10.1016/j.applthermaleng.2023.120303.
- Roe et al. [2022] Charlotte Roe, Xuning Feng, Gavin White, Ruihe Li, Huaibin Wang, Xinyu Rui, Cheng Li, Feng Zhang, Volker Null, Michael Parkes, Yatish Patel, Yan Wang, Hewu Wang, Minggao Ouyang, Gregory Offer, and Billy Wu. Immersion cooling for lithium-ion batteries – A review. Journal of Power Sources, 525(February):231094, 2022. ISSN 03787753. doi: 10.1016/j.jpowsour.2022.231094. URL https://doi.org/10.1016/j.jpowsour.2022.231094.
- Liu et al. [2023a] Yanhui Liu, Gulzhan Aldan, Xinyan Huang, and Menglong Hao. Single-phase static immersion cooling for cylindrical lithium-ion battery module. Applied Thermal Engineering, 233(July):121184, 2023a. ISSN 13594311. doi: 10.1016/j.applthermaleng.2023.121184. URL https://doi.org/10.1016/j.applthermaleng.2023.121184.
- Jilte et al. [2019] R. D. Jilte, Ravinder Kumar, and Mohammad H. Ahmadi. Cooling performance of nanofluid submerged vs. nanofluid circulated battery thermal management systems. Journal of Cleaner Production, 240, 2019. ISSN 09596526. doi: 10.1016/j.jclepro.2019.118131.
- Huo and Rao [2015] Yutao Huo and Zhonghao Rao. The numerical investigation of nanofluid based cylinder battery thermal management using lattice Boltzmann method. International Journal of Heat and Mass Transfer, 91:374–384, 12 2015. ISSN 00179310. doi: 10.1016/j.ijheatmasstransfer.2015.07.128. URL https://linkinghub.elsevier.com/retrieve/pii/S0017931015008467.
- Liu et al. [2023b] Jiahao Liu, Qingwen Ma, and Xianbin Li. Numerical study on heat dissipation performance of a lithium-ion battery module based on immersion cooling. Journal of Energy Storage, 66(March):107511, 2023b. ISSN 2352152X. doi: 10.1016/j.est.2023.107511. URL https://doi.org/10.1016/j.est.2023.107511.
- Jithin and Rajesh [2022] K. V. Jithin and P. K. Rajesh. Numerical analysis of single-phase liquid immersion cooling for lithium-ion battery thermal management using different dielectric fluids. International Journal of Heat and Mass Transfer, 188:122608, 2022. ISSN 00179310. doi: 10.1016/j.ijheatmasstransfer.2022.122608. URL https://doi.org/10.1016/j.ijheatmasstransfer.2022.122608.
- Solai et al. [2022] Elie Solai, Maxime Guadagnini, Héloïse Beaugendre, Rémi Daccord, and Pietro Congedo. Validation of a data-driven fast numerical model to simulate the immersion cooling of a lithium-ion battery pack. Energy, 249, 2022. ISSN 03605442. doi: 10.1016/j.energy.2022.123633.
- Lyu et al. [2020] Peizhao Lyu, Yutao Huo, Zhiguo Qu, and Zhonghao Rao. Investigation on the thermal behavior of Ni-rich NMC lithium ion battery for energy storage. Applied Thermal Engineering, 166(November 2019):114749, 2020. ISSN 13594311. doi: 10.1016/j.applthermaleng.2019.114749. URL https://doi.org/10.1016/j.applthermaleng.2019.114749.
- Dong et al. [2018] Ti Dong, Peng Peng, and Fangming Jiang. Numerical modeling and analysis of the thermal behavior of NCM lithium-ion batteries subjected to very high C-rate discharge/charge operations. International Journal of Heat and Mass Transfer, 117:261–272, 2018. ISSN 00179310. doi: 10.1016/j.ijheatmasstransfer.2017.10.024. URL https://doi.org/10.1016/j.ijheatmasstransfer.2017.10.024.
- Zhao et al. [2018] Chunrong Zhao, Wenjiong Cao, Ti Dong, and Fangming Jiang. Thermal behavior study of discharging/charging cylindrical lithium-ion battery module cooled by channeled liquid flow. International Journal of Heat and Mass Transfer, 120:751–762, 2018. ISSN 00179310. doi: 10.1016/j.ijheatmasstransfer.2017.12.083. URL https://doi.org/10.1016/j.ijheatmasstransfer.2017.12.083.
- Prada et al. [2012] E. Prada, D. Di Domenico, Y. Creff, J. Bernard, V. Sauvant-Moynot, and F. Huet. Simplified Electrochemical and Thermal Model of LiFePO 4 -Graphite Li-Ion Batteries for Fast Charge Applications . Journal of The Electrochemical Society, 159(9):A1508–A1519, 2012. ISSN 0013-4651. doi: 10.1149/2.064209jes.
- Quinn et al. [2018] Jason B. Quinn, Thomas Waldmann, Karsten Richter, Michael Kasper, and Margret Wohlfahrt-Mehrens. Energy Density of Cylindrical Li-Ion Cells: A Comparison of Commercial 18650 to the 21700 Cells. Journal of The Electrochemical Society, 165(14):A3284–A3291, 2018. ISSN 0013-4651. doi: 10.1149/2.0281814jes.
- Jeon and Baek [2011] Dong Hyup Jeon and Seung Man Baek. Thermal modeling of cylindrical lithium ion battery during discharge cycle. Energy Conversion and Management, 52(8-9):2973–2981, 2011. ISSN 01968904. doi: 10.1016/j.enconman.2011.04.013. URL http://dx.doi.org/10.1016/j.enconman.2011.04.013.
- Kang et al. [2022] Jianqiang Kang, Yulong Jia, Guorong Zhu, Jing V. Wang, Bin Huang, and Yaxiang Fan. How electrode thicknesses influence performance of cylindrical lithium-ion batteries. Journal of Energy Storage, 46(March 2021):103827, 2022. ISSN 2352152X. doi: 10.1016/j.est.2021.103827. URL https://doi.org/10.1016/j.est.2021.103827.
- He et al. [2022] Tengfei He, Teng Zhang, Zhirong Wang, and Qiong Cai. A comprehensive numerical study on electrochemical-thermal models of a cylindrical lithium-ion battery during discharge process. Applied Energy, 313(February):118797, 2022. ISSN 03062619. doi: 10.1016/j.apenergy.2022.118797. URL https://doi.org/10.1016/j.apenergy.2022.118797.
- Doyle et al. [1993] Marc Doyle, Thomas F. Fuller, and John Newman. Modeling of Galvanostatic Charge and Discharge of the Lithium/Polymer/Insertion Cell. Journal of The Electrochemical Society, 140(6):1526–1533, 1993. ISSN 0013-4651. doi: 10.1149/1.2221597.
- Fuller et al. [1994] Thomas F. Fuller, Marc Doyle, and John Newman. Simulation and Optimization of the Dual Lithium Ion Insertion Cell. Journal of The Electrochemical Society, 141(1):1–10, 1994. ISSN 0013-4651. doi: 10.1149/1.2054684.
- Chen et al. [2017] Chien-Fan Chen, Ankit Verma, and Partha P. Mukherjee. Probing the Role of Electrode Microstructure in the Lithium-Ion Battery Thermal Behavior. Journal of The Electrochemical Society, 164(11):E3146–E3158, 2017. ISSN 0013-4651. doi: 10.1149/2.0161711jes.
- Ji et al. [2013] Yan Ji, Yancheng Zhang, and Chao-Yang Wang. Li-Ion Cell Operation at Low Temperatures. Journal of The Electrochemical Society, 160(4):A636–A649, 2013. ISSN 0013-4651. doi: 10.1149/2.047304jes.
- Gu and Wang [2000] W. B. Gu and C. Y. Wang. Thermal-Electrochemical Modeling of Battery Systems. Journal of The Electrochemical Society, 147(8):2910, 2000. ISSN 00134651. doi: 10.1149/1.1393625.
- Cai and White [2009] Long Cai and Ralph E. White. Reduction of Model Order Based on Proper Orthogonal Decomposition for Lithium-Ion Battery Simulations. Journal of The Electrochemical Society, 156(3):A154, 2009. ISSN 00134651. doi: 10.1149/1.3049347.
- Cai and White [2011] Long Cai and Ralph E. White. Mathematical modeling of a lithium ion battery with thermal effects in COMSOL Inc. Multiphysics (MP) software, 2011. ISSN 03787753.
- Kumaresan et al. [2008] Karthikeyan Kumaresan, Godfrey Sikha, and Ralph E. White. Thermal Model for a Li-Ion Cell. Journal of The Electrochemical Society, 155(2):A164, 2008. ISSN 00134651. doi: 10.1149/1.2817888.
- Cheng et al. [2019] Ximing Cheng, Tao Li, Yu Tang, and Shouqun Wang. Influences of Structure Components on Thermal Distribution of a Cylindrical Lithium-ion Battery. Energy Procedia, 158:4959–4966, 2 2019. ISSN 18766102. doi: 10.1016/j.egypro.2019.01.692. URL https://linkinghub.elsevier.com/retrieve/pii/S1876610219307295.
- Li et al. [2021] Shen Li, Niall Kirkaldy, Cheng Zhang, Krishnakumar Gopalakrishnan, Tazdin Amietszajew, Laura Bravo Diaz, Jorge Varela Barreras, Mosayeb Shams, Xiao Hua, Yatish Patel, Gregory J. Offer, and Monica Marinescu. Optimal cell tab design and cooling strategy for cylindrical lithium-ion batteries. Journal of Power Sources, 492(January):229594, 2021. ISSN 03787753. doi: 10.1016/j.jpowsour.2021.229594. URL https://doi.org/10.1016/j.jpowsour.2021.229594.
- Sirikasemsuk et al. [2021] Sarawut Sirikasemsuk, Songkran Wiriyasart, Paisarn Naphon, and Nittaya Naphon. Thermal cooling characteristics of Li-ion battery pack with thermoelectric ferrofluid cooling module. International Journal of Energy Research, 45(6):8824–8836, 2021. ISSN 1099114X. doi: 10.1002/er.6417.
- Chen et al. [2016] Dafen Chen, Jiuchun Jiang, Gi Heon Kim, Chuanbo Yang, and Ahmad Pesaran. Comparison of different cooling methods for lithium ion battery cells. Applied Thermal Engineering, 94:846–854, 2016. ISSN 13594311. doi: 10.1016/j.applthermaleng.2015.10.015. URL http://dx.doi.org/10.1016/j.applthermaleng.2015.10.015.
- Fu et al. [2013] Rujian Fu, Meng Xiao, and Song Yul Choe. Modeling, validation and analysis of mechanical stress generation and dimension changes of a pouch type high power Li-ion battery. Journal of Power Sources, 224:211–224, 2013. ISSN 03787753. doi: 10.1016/j.jpowsour.2012.09.096. URL http://dx.doi.org/10.1016/j.jpowsour.2012.09.096.
- Xiao et al. [2010] Xinran Xiao, Wei Wu, and Xiaosong Huang. A multi-scale approach for the stress analysis of polymeric separators in a lithium-ion battery. Journal of Power Sources, 195(22):7649–7660, 2010. ISSN 03787753. doi: 10.1016/j.jpowsour.2010.06.020. URL http://dx.doi.org/10.1016/j.jpowsour.2010.06.020.
- Duan et al. [2018] Xiting Duan, Wenjuan Jiang, Youlan Zou, Weixin Lei, and Zengsheng Ma. A coupled electrochemical–thermal–mechanical model for spiral-wound Li-ion batteries. Journal of Materials Science, 53(15):10987–11001, 2018. ISSN 15734803. doi: 10.1007/s10853-018-2365-6. URL https://doi.org/10.1007/s10853-018-2365-6.
- Shao et al. [2023] Yu qiang Shao, Huan ling Liu, Xiao dong Shao, and Lin Sang. A fully coupled mechano-electrochemical model for all-solid-state Li-ion batteries: An optimal strategy for controlling interfacial contact using internal stress generated by electrode expansion. Electrochimica Acta, 443(June 2022):141958, 2023. ISSN 00134686. doi: 10.1016/j.electacta.2023.141958. URL https://doi.org/10.1016/j.electacta.2023.141958.
- Li et al. [2020] Ping Li, Yibo Zhao, Yongxing Shen, and Shou Hang Bo. Fracture behavior in battery materials. JPhys Energy, 2(2), 2020. ISSN 25157655. doi: 10.1088/2515-7655/ab83e1.
- Xu et al. [2017] Rong Xu, Hong Sun, Luize Scalco de Vasconcelos, and Kejie Zhao. Mechanical and Structural Degradation of LiNi x Mn y Co z O 2 Cathode in Li-Ion Batteries: An Experimental Study . Journal of The Electrochemical Society, 164(13):A3333–A3341, 2017. ISSN 0013-4651. doi: 10.1149/2.1751713jes.
- Koerver et al. [2018] Raimund Koerver, Wenbo Zhang, Lea De Biasi, Simon Schweidler, Aleksandr O. Kondrakov, Stefan Kolling, Torsten Brezesinski, Pascal Hartmann, Wolfgang G. Zeier, and Jürgen Janek. Chemo-mechanical expansion of lithium electrode materials-on the route to mechanically optimized all-solid-state batteries. Energy and Environmental Science, 11(8):2142–2158, 2018. ISSN 17545706. doi: 10.1039/c8ee00907d.
- Trimbake et al. [2022] Amol Trimbake, Chandra Pratap Singh, and Shankar Krishnan. Mineral Oil Immersion Cooling of Lithium-Ion Batteries: An Experimental Investigation. Journal of Electrochemical Energy Conversion and Storage, 19(2):1–7, 2022. ISSN 23816910. doi: 10.1115/1.4052094.
- Abbott et al. [2023] Katie C. Abbott, Jonathan E.H. Buston, Jason Gill, Steven L. Goddard, Daniel Howard, Gemma E. Howard, Elliott Read, and Rhiannon C.E. Williams. Experimental study of three commercially available 18650 lithium ion batteries using multiple abuse methods. Journal of Energy Storage, 65(April):107293, 2023. ISSN 2352152X. doi: 10.1016/j.est.2023.107293. URL https://doi.org/10.1016/j.est.2023.107293.
- Žukauskas [1972] A. Žukauskas. Heat Transfer from Tubes in Crossflow. In Advances in Heat Transfer, volume 18, pages 93–160. 1972. doi: 10.1016/S0065-2717(08)70038-8. URL https://linkinghub.elsevier.com/retrieve/pii/S0065271708700388.
- Morgan [1975] Vincent T. Morgan. The Overall Convective Heat Transfer from Smooth Circular Cylinders. In Advances in Heat Transfer, volume 11, pages 199–264. 1975. doi: 10.1016/S0065-2717(08)70075-3. URL https://linkinghub.elsevier.com/retrieve/pii/S0065271708700753.
- Pederson and Sparrow [1977] R. J. Pederson and E. M. Sparrow. Heat Transfer From a Cylinder in Crossflow Situated in a Turbulent Pipe Flow. Journal of Heat Transfer, 99(3):425–432, 8 1977. ISSN 0022-1481. doi: 10.1115/1.3450713. URL https://asmedigitalcollection.asme.org/heattransfer/article/99/3/425/415026/Heat-Transfer-From-a-Cylinder-in-Crossflow.