A national longitudinal dataset of skills taught in U.S. higher education curricula
alj112@pitt.edu.edu
\And
sarah.bana@gmail.com
\And
renzheyu@tc.columbia.edu
\And
mrfrank@pitt.edu
1Department of Informatics and Networked Systems, University of Pittsburgh, Pittsburgh, PA 15216, USA
2Argyros School of Business and Economics, Chapman University, Orange, CA, USA
3Digital Economy Lab, Institute for Human-Centered Artificial Intelligence,
Stanford University, Stanford, CA 94305, USA
4Teachers College, Columbia University, New York, NY 10027, USA
5Data Science Institute, Columbia University, New York, NY 10027, USA
6Media Laboratory, Massachusetts Institute of Technology, Cambridge, MA 02139, USA
Abstract
Higher education plays a critical role in driving an innovative economy by equipping students with knowledge and skills demanded by the workforce. While researchers and practitioners have developed data systems to track detailed occupational skills, such as those established by the U.S. Department of Labor (DOL), much less effort has been made to document skill development in higher education at a similar granularity. Here, we fill this gap by presenting a longitudinal dataset of skills inferred from over three million course syllabi taught at nearly three thousand U.S. higher education institutions. To construct this dataset, we apply natural language processing to extract from course descriptions detailed workplace activities (DWAs) used by the DOL to describe occupations. We then aggregate these DWAs to create skill profiles for institutions and academic majors. Our dataset offers a large-scale representation of college-educated workers and their role in the economy. To showcase the utility of this dataset, we use it to 1) compare the similarity of skills taught and skills in the workforce according to the US Bureau of Labor Statistics, 2) estimate gender differences in acquired skills based on enrollment data, 3) depict temporal trends in the skills taught in social science curricula, and 4) connect college majors’ skill distinctiveness to salary differences of graduates. Overall, this dataset can enable new research on the source of skills in the context of workforce development and provide actionable insights for shaping the future of higher education to meet evolving labor demands especially in the face of new technologies.
Keywords Skill Higher Education Future of Work Labor Economics Complexity O*NET Workplace Activity
Background & Summary
Skills are essential components of jobs and shape the career outcomes of workers within the labor market. Therefore, quantifying skills and their sources is essential for predicting workers’ career trajectories and macro-level workforce dynamics [1, 2, 3]. For example, recent study on remote work [4] and automation [5] explain part of the erosion of the U.S. middle class using the relationship between technology and low- or high-skill work. Another study from economists finds increasing demand for social skills for modern, flexible team-based work environments based on required skills in job postings [6]. In response to shifts in skills, employers need to consider skill profiles and skill development in their hiring and training. For instance, employers subjectively perceive the skill content of college majors when determining the requirements to include in online job advertisements [7]. Combined, the focus on skills in the labor market warrants a similar perspective on the sources of skills during workforce development and talent acquisition.
Higher education is arguably the most important source for skill development, which facilitates both economic and social mobility [8]. In the past few decades, empirical studies have consistently demonstrated that college-educated individuals earn higher wages, achieve more extensive professional networks, and collectively experience greater inter-generational upward mobility [9, 10]. Non-college educated workers now engage in markedly less skilled tasks than their counterparts from previous eras [11] and tend to transition into low-wage occupations. On the other hand, the economic returns of higher education vary across fields of study due to differing skill sets imparted by college majors [12, 13]. They also vary along the lines of institutional selectivity [14]. Moreover, students from different demographic and socioeconomic backgrounds are sorted into different educational trajectories due to existing structural inequalities, which may hinder the social mobility that higher education is intended to foster [15]. In recent years, as elevated dropout rates [16] and rising unemployment or underemployment rates of college graduates fuel concerns around the efficacy of higher education [17, 18], it is important to better understand how higher education imparts skills and prepares students for the labor market. This process remains under explored due to the challenge of aligning the fine-grained content of education with job market demands [19, 20].
Here, we fill this gap by providing a new dataset on the skills taught in American higher education [21]. We first introduce Syllabus2O*NET, a novel natural language processing (NLP) framework designed to identify and interpret skills from curricular content, in line with the O*NET taxonomy used by the U.S. Department of Labor (see Figure 1). Applying this algorithmic pipeline to the most extensive dataset of university course syllabi, we then present a longitudinal, national dataset of inferred skill profiles across different institutions, academic majors, and student populations in the United States. To validate this dataset, we perform qualitative and quantitative explorations of the identified skill structures, as well as a benchmarking analysis against existing studies. We further include a handful of descriptive analyses to showcase the potential utility of this dataset, including revealing gender skills gaps, analyzing temporal trends in taught abilities, and quantifying skill-salary correlations.
Overall, our paper makes a handful of intellectual and practical contributions. First, we present a computational framework to describe the content alignment between education and workforce. While we developed the methodology based on two specific document types, it is applicable to other types of documents as well. Second, we provide an essential data source on the skill profiles of institutions, which can facilitate future research in such fields as higher education, labor economics, and future of work especially in an era marked by rapid technological advancements and shifting economic landscapes [22, 23]. Third, we illustrate some macro-level patterns of skills taught in higher education that warrant more in-depth research in the future.
Methods
Materials
Open Syllabus Project Dataset:
The Open Syllabus Project (OSP) Dataset111https://opensyllabus.org/ (accessed on 28th November 2023) is composed of nearly course syllabi worldwide among which syllabi across fields of study (FOS) belong to U.S. colleges and universities. Each course syllabus contains features including course description, language, year, field of study, and information about the institution.
O*NET:
The O*NET (Occupational Information Network) [24] is a comprehensive database of worker attributes and job characteristics. Developed under the sponsorship of the U.S. Department of Labor/Employment and Training Administration, O*NET has been used extensively for understanding and analyzing the labor market and workforce [25, 26, 27, 28, 29, 30, 31, 32, 33]. The O*NET database is a vital resource for educators, career counselors, and workforce development professionals. It provides a structured way to analyze job requirements and worker qualifications, aiding in curriculum development, career guidance, and labor market analysis [34].
O*NET classifies occupations using a standardized hierarchical taxonomy. This taxonomy includes several key components including:
-
•
Ability:222https://www.onetonline.org/find/descriptor/browse/1.A (accessed on 5th February 2024) The performance of individuals is influenced by their enduring abilities, categorized into four key areas: “Cognitive”, “Physical”, “Psychomotor”, and “Sensory”.
-
•
Detailed Work Activity (DWA):333https://www.onetcenter.org/dictionary/20.1/excel/dwa_reference.html (accessed on 5th February 2024) This taxonomy provides more than 2,000 detailed descriptions of work activities specific to various occupations. DWAs are precise and descriptive, outlining the tasks and responsibilities of a particular job. They help in understanding the day-to-day activities and skills required for a particular role.
-
•
Task Statement (Task):444https://www.onetcenter.org/dictionary/20.1/excel/task_statements.html (accessed on 5th February 2024) Finally, a Task is a basic unit of work, the smallest action that constitutes part of a job. Roughly 18,000 Tasks provide the most detailed overview of the job responsibilities.
Integrated Postsecondary Education Data System:
For the analysis presented in the “Gender, Education, and Skills” Section, we employ data from the Integrated Postsecondary Education Data System (IPEDS). IPEDS is a system of surveys conducted annually by the U.S. Department of Education’s (DOE) National Center for Education Statistics (NCES). IPEDS collects data from all primary providers of postsecondary education in the United States, which includes universities, colleges, vocational and technical institutions, and other postsecondary institutions. The purpose of IPEDS is to gather information on postsecondary education in the United States, covering a range of areas such as program completions, student financial aid, and institutional finances. The data collected is comprehensive and is used for policy analysis, decision-making, and research in the field of higher education.
In this study, we analyze fields of study or, equivalently, college majors according to the 2-digit Classification of Instructional Programs (CIP) codes used by the DOE. This enables us to connect syllabus data to the number of degrees awarded, disaggregated by demographic group, across fields of study. The dataset encompasses records dating back to 2010.
National Employment Records and Skills:
In analyzing the “Dynamic Differences Between Inferred Workplace Activities and Labor Market Workplace Activities” Section, we sourced the national employment share for each occupation from the US Bureau of Labor Statistics (BLS) Occupation Employment and Wage Statistics (OEWS).555https://www.bls.gov/emp/ind-occ-matrix/occupation.xlsx (accessed on 5th February 2024) We focused on occupations requiring at least a Bachelor’s, Master’s, Associate’s, or Doctoral/professional degree. Additionally, we employed the O*NET DWA data per occupation666https://www.onetonline.org/find/all (accessed on 5th February 2024) to determine the required DWAs for each occupation.
Skill Inference Framework (Syllabus2O*NET):
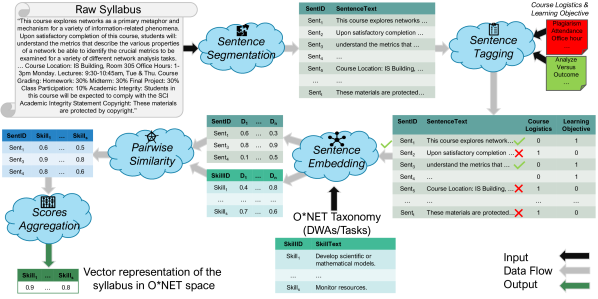
Figure 1 illustrates a high-level overview of our Syllabus2O*NET skill inference framework. Given the text from a course syllabus, we segment sentences using Stanza [35], a tool designed to partition text into individual sentences. We extracted approximately 300 million sentences from the course syllabi in our dataset. On average, each syllabus contains roughly 100 sentences. Each course syllabus starts as unstructured text lacking metadata to distinguish between course logistics (e.g., scheduling and grading rubrics) and learning outcomes (e.g., course content and learning objectives). Thus, we implement a human-in-the-loop approach to remove sentences pertaining to Course Logistics while keeping sentences about Learning Outcomes. To do so, we compiled two distinct lists for labeling sentences. The list of Course Logistic related terms includes 356 phrases that are common but unrelated to the course content (e.g., “Plagiarism,” “Attendance,” and “Office hours”). The list of Learning Objective related terms includes 51 phrases such as “Analyze,” “Versus,” and “Outcome.” The complete lists can be found on the code’s GitHub page. We removed sentences from each syllabus that contained Course Logistic phrases or lacked Learning Objective phrases resulting in the removal of approximately 85% of the sentences. Each syllabus contains nearly 17 Learning Objective related sentences on average (see SI Section “Skills Inference Framework (Syllabus2O*NET)” for details on the statistics of Learning Objective sentence counts by FOS.).
Finally, we infer the presence of each O*NET DWA or Task (hereafter, “skill”) in a syllabus’s Learning Outcome sentences based on their semantic similarity. Specifically, we employ Sentence Embedding using the Siamese Bidirectional Encoder Representations from Transformers-Networks (SBERT) [36] utilizing the “all-mpnet-base-v2” model [37] to embed each Learning Outcome sentence and each O*NET DWA or Task into a 768 dimension semantic space. SBERT is well-suited for our project due to its training on a diverse range of more than 1 billion sentences including S2ORC: The Semantic Scholar Open Research Corpus [38], WikiAnswers Corpus [39], PAQ: 65 Million Probably-Asked Questions[40], and GooAQ: Open Question Answering with Diverse Answer Types [41]. The semantic similarity of sentences and skills are calculated from the cosine similarity of their embeddings. For instance, the sentence “understand the metrics that describe the various properties of a network be able to identify the crucial metrics to be examined for a variety of different network analysis tasks.” from the example syllabus in Figure 1 is semantically similar to the O*NET DWA “Develop scientific or mathematical models.” (i.e., cosine similarity score ). For each skill, we select the maximum similarity score from all the sentences within the syllabus and generate a vector representing the maximum similarity score between a specific course and a corresponding skill. These vectors have 2,070 elements for DWAs and 17,992 elements for Tasks. In addition, we developed another tool to map the O*NET DWAs to O*NET Ability taxonomy (see SI Section “Mapping O*NET DWAs to Abilities (DWA2Ability)”).
Skill Normalization:
Some DWAs, such as “Maintain student records” and “Document lesson plans”, are ubiquitous across fields of study (FOS) and, therefore, do not distinguish the learning outcomes of one FOS from another. To address this issue and control for widespread skills we propose two approaches.
The first approach is applying Revealed Comparative Advantage (RCA) (a.k.a., “location quotient” [42, 28, 43, 44, 45]) according to:
| (1) |
where denotes a FOS (i.e., a college major) and denotes a skill (i.e., an O*NET DWA). If , then is more related to than would be expected across all DWAs and all FOS; therefore, is a relatively distinctive skill identifying more strongly than other FOS.
The second approach, which is used in Fig. 4 (top) is to mask the frequently occurring skills based on their prevalence. This was implemented by evaluating the top 100 DWAs for each FOS and masking those that were commonly observed. Note that masked DWAs remain accessible in the published dataset.
Data Records
In this study, we create and release the DWAs, Tasks, and Abilities datasets inferred from the OSP course syllabi. Figure 2 provides the entity relationship diagram of the provided datasets.
Each record in these datasets includes the year, institution name, and UnitID (i.e., the unique identifier assigned by IPEDS to each institution), the geographical location of the institution (i.e., the city and state), and the FOS name along with its CIP code. The provided scores are the average scores of the syllabi belonging to the corresponding year, university, and FOS.
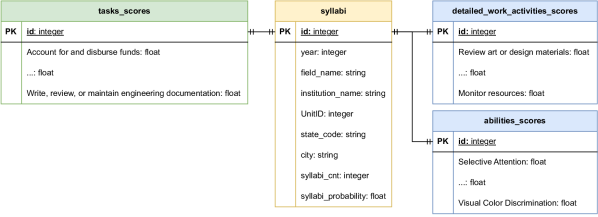
Figure 3 explores the coverage of the syllabi data. Across each U.S. state, between 32% and 76% of the postsecondary institutions in each state provide at least eight course syllabi (i.e., corresponding to the 25th percentile. See Fig. 3A). Among the most represented FOS in our data, syllabi counts per year range from to from 2000 through 2016 (see Fig. 3B).
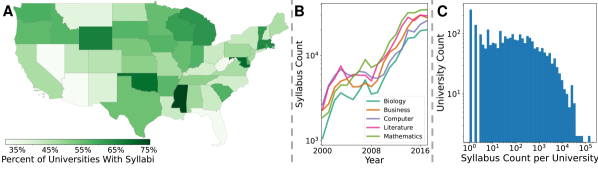
Across the entire data set, the majority of universities (nearly 2000) contribute at least 10 syllabi to the data, but some contribute up to syllabi across all FOS (see Fig. 3C). Comprehensive descriptive statistics of these datasets are presented in the “Descriptive Statistics” Section of the SI.
Technical Validation
Qualitative Analysis of the Inferred Workplace Activities
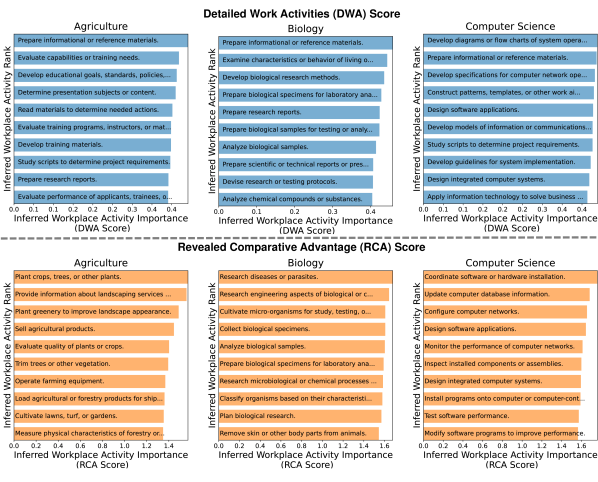
As a face-validity check of Syllabus2O*NET, we list the ten DWAs that are most strongly associated with three example fields of study (FOS): Agriculture, Biology, and Computer Science (see Fig. 4). Some DWAs (e.g., “Prepare informational or reference materials”) are common across many FOS and, therefore, obscure the DWAs that most distinguish one FOS from the others. To normalize for ubiquitous DWAs, we also present the DWAs with the greatest revealed comparative advantage (RCA) in each field (see Section “Skill Normalization”). For instance, “Plant crops, trees, or other plants” emerges as the foremost skill in Agriculture, “Research diseases or parasites” is predominant in Biology, and “Coordinate software or hardware installation” is leading in Computer Science according to RCA scores. SI Section “Top 10 Detailed Work Activities per Field of Study” contains similar results for each FOS.
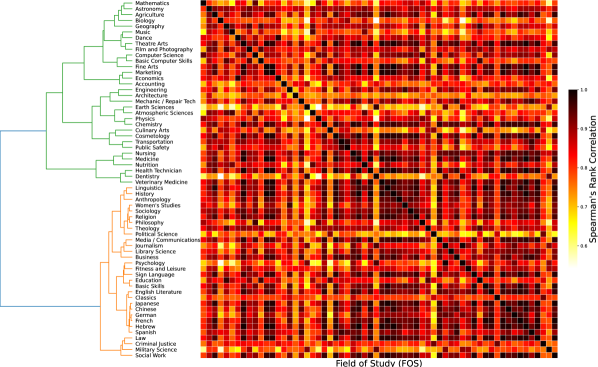
Relating Fields of Study from Skill Similarity
How similar are fields of study based on their skills? Following existing work [27], we cluster [46] FOS based on the similarity of their inferred DWAs (see Fig. 5). The resulting dendrogram offers another face-validity check as similar FOS (e.g., STEM majors) tend to require similar DWAs. For instance, Marketing and Economics are closely related, as are Linguistics and History. Notably, just before the final clustering step, which amalgamates all majors (indicated in blue), two predominant clusters are discernible: one representing technical majors including those in STEM (in green) and the other humanities-based majors (in orange). For example, although Film and Photography is not a STEM-designated program, it requires skills that are common in STEM fields, such as “Draw detailed or technical illustrations” and “Design video game features or details” (see SI Section “Top 10 Detailed Work Activities per Field of Study”).
Dynamic Differences Between Inferred Workplace Activities and Labor Market Workplace Activities
How responsive are the skills taught in higher education to the skills required in the US labor market? A “skills mismatch” may occur if higher education fails to adapt [47, 48, 49] (e.g., by teaching more theoretical skills than practical skills [47]). For the first time, our data set offers a direct comparison between the skills taught across higher education and the skills in the labor market using the skill taxonomy deployed by the US Department of Labor to describe occupations.
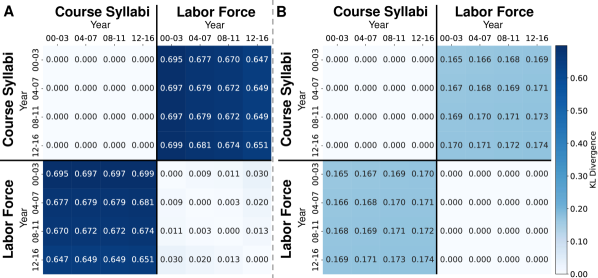
For comparison, one existing study [50] uses similar syllabus data to compare the skills taught in Computer Science (CS) with the skill demands of CS-related jobs in the US labor market. The study chooses an external measure of skills, from Burning Glass Technologies, which represents skills required in a job posting. On the other hand, our measure of skills uses the DWA scores required by each occupation. Specifically, we weight by the national employment share associated with each occupation according to the US BLS OEWS and cover a longer period with our data. Across all FOS, the skills inferred from course syllabi are increasingly similar to the skills in the US labor market over time (see Fig. 6A). For instance, skills (i.e., DWAs) from the 2000-2003 course syllabi are the least similar to labor force skills from the same period but are most similar to those from the latest period, 2012-2016. These results suggest that taught skills are forward-looking.
However, going beyond existing research, our dataset enables us to make direct comparisons between specific FOS and labor market dynamics for individual occupations. For example, motivated by earlier analysis of CS syllabi and CS-related job postings [50], we compare CS syllabi to Computer and Mathematical occupations (i.e., Standard Occupation Classification code: 15-0000. See Fig. 6B). Despite the trend across all FOS, over time, the labor force skill distribution becomes increasingly dissimilar to older course syllabi which confirms the rapidly changing nature of such domains. Comparing the KL Divergence scores of the syllabi among different periods (top left box of Fig. 6B), we observe that syllabi are staying stagnant, and as a result, they are moving away from the frontier of knowledge required in the labor force.
Usage Notes
Our dataset offers a versatile tool for addressing a variety of research questions pertinent to education and workforce development across multiple domains. In the subsequent sections, we illustrate potential analytical approaches utilizing this dataset, such as exploring differences in skill sets across gender profiles in U.S. higher education, the trend of abilities in teaching activities, and utilizing skill scores for salary estimation. Lastly, we discuss our data’s limitations.
Gender, Education, and Skills
Existing research finds that males and females tend to possess different workplace skills on aggregate [51, 52] which may correspond to gender stereotypes shaping careers [53, 54]. But are these differences the result of education or labor market outcomes? In general, these questions can only be studied through enrollment and graduation statistics from the US Department of Education without taking into account the granular differences in taught skills across different majors and institutions. However, our dataset enables the study of this heterogeneity and, thus, creates an opportunity to explain career outcomes from the differences in skills taught during higher education—even differences within a given FOS based on varied enrollment across educational institutions.
For example, recent research [55] from the Organisation for Economic Cooperation and Development (OECD) examined the difference in skills by gender. This difference is most pronounced in “Healthcare & Welfare”, which has higher female employment, and “Engineering, Manufacturing & Construction”, which has higher male employment. Our data set allows us to explain the skill differences between these majors based on course syllabi. We first weight the DWA scores for each combination of FOS, university, and year, using the number of graduates from the IPEDS dataset. Subsequently, we calculate the RCA score to pinpoint distinctive skills for each gender group and observe results in agreement with the OECD report (see Table 1). Healthcare-related skills, such as “Prescribe medications,” are more indicative of females and engineering-related skills, such as “Design industrial processing systems,” are more indicative of males.
| Detailed Work Activity |
|
Detailed Work Activity |
|
||||
|---|---|---|---|---|---|---|---|
| Administer blood or other fluids intravenously. | 1 | Measure stock or liquid levels in sustainable fuel … | 1 | ||||
| Apply bandages, dressings, or splints. | 2 | Reshape small metal components for precision assembly. | 2 | ||||
| Prepare official health documents or records. | 3 | Design industrial processing systems. | 3 | ||||
| Administer non-intravenous medications. | 4 | Calculate shipping costs. | 4 | ||||
| Give medications or immunizations. | 5 | Design control systems for mechanical or other … | 5 | ||||
| Administer anesthetics or sedatives to control pain. | 6 | Compact materials to create level bases. | 6 | ||||
| Prescribe treatments or therapies. | 7 | Move large objects using heavy equipment. | 7 | ||||
| Prescribe medications. | 8 | Estimate costs or terms of sales. | 8 | ||||
| Order medical diagnostic or clinical tests. | 9 | Design environmental control systems. | 9 | ||||
| Refer patients to other healthcare practitioners or … | 10 | Weigh parcels to determine shipping costs. | 10 |
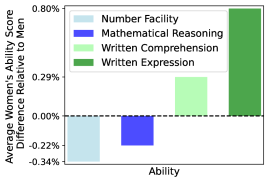
To make a more direct comparison with the OECD report, we quantify these differences at the O*NET Ability level using our DWA2Ability trained models (see Section SI “Mapping O*NET DWAs to Abilities (DWA2Ability)”). The OECD [55] Survey of Adult Skills (PIAAC) reports that female students engage 15% less in advanced mathematics and numeracy in daily life compared to male students. In general agreement with this result, we find that females learn fewer numeracy skills according to the courses they enroll in (see Fig. 7). However, contrary to the OECD report, female students report a smaller gender gap in literacy use, around 5% less, while we find that female students enroll in classes teaching literacy in greater rates than male students. This inconsistency might suggest a mismatch between the skills taught at universities and the daily activities involving literacy skills (see SI Section “Gender, Education, and Skills” for the complete list).
As automation and AI continue to reshape job markets [56], the contrast in skills between genders might influence how each group adapts to new technologies both during education and once they enter the workforce. As a result, educational institutions and policymakers may need to consider these differences to ensure that both genders have equal opportunities to acquire a diverse range of skills, preparing them for various roles in the future job market [57]. In addition, the observed differences might also reflect traditional gender roles and stereotypes in education and career choices [58]. Initiatives aimed at diversifying skills across genders could be beneficial in breaking down these stereotypes.
Temporal Trends in Teaching Activities
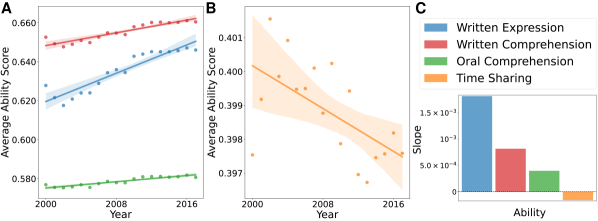
Our dataset enables the study of skill differences within and across majors and universities over time. Taking active learning in social sciences as an example, a recent critique of active learning and the employability agenda in higher education within the social sciences [59] identified an inadvertent neglect of key skills including reading, listening, and note-taking. Utilizing our DWA2Ability trained models (see SI Section “Mapping O*NET DWAs to Abilities (DWA2Ability)”), we mapped the DWAs from the social sciences syllabi (CIP code=45) to the corresponding O*NET abilities. The abilities of Written Comprehension, Written Expression, and Oral Comprehension are analogous to reading, writing (analogous to note-taking), and listening, respectively. Active learning, as defined in [60], “refer[s] to an assortment of techniques where students do more than simply listen to a lecture.” Thus, it encompasses a range of techniques that extend beyond passive listening in a lecture setting.
We observe a positive trend over time for the average annual scores of Social Sciences syllabi for the abilities of writing, reading, and listening, which suggests an increased emphasis on these skills in social sciences education (see Figure 8A and C). Conversely, the ability of Time Sharing, essential for active learning, displays a negative trend (see Figure 8B and C). Time Sharing, according to O*NET,777https://www.onetonline.org/find/descriptor/result/1.A.1.g.2 (accessed on 8th March 2024) is “th[e] ability to shift back and forth between two or more activities or sources of information (such as speech, sounds, touch, or other sources).” This divergence in trends suggests a potential gap in fostering Time Sharing ability within the social sciences, a skill that might be the missing piece for the effective integration of writing, reading, and listening as recommended in [59]. Our findings highlight the trends in key abilities within the social sciences, provide a critical foundation in our dataset to pave the way for further investigation into how educational strategies can be developed to effectively balance traditional academic skills with the competencies essential for active learning environments.
Taught Skill Distinctiveness and Labor Market Outcomes
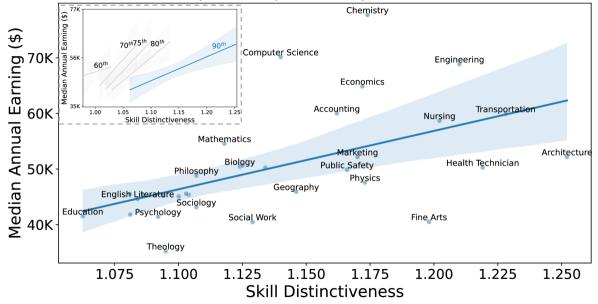
Research has consistently shown a strong relationship between college majors, skills, and wages [61, 62, 63]. For example, some majors may offer more diverse skill sets with more general skills profiles that lead to adaptable careers after a student graduates and enters the workforce [7]. We test this hypothesis by comparing the distinctiveness of FOS’s taught skills with earnings of 25- to 29-year-old bachelor’s degree holders reported by the National Center for Education Statistics (NCES).888https://nces.ed.gov/programs/digest/d19/tables/dt19_505.10.asp (accessed on 12th February 2024) We measure skill distinctiveness by noting the 90th percentile skill RCA score within each FOS; under this measure, FOS with higher diversity scores teach more distinctive skills compared to other FOS. Graduates of FOS with more distinctive skills (i.e., greater RCA scores) tend to earn higher salaries with differences in RCA scores accounting for 29.4% of the variation in graduate earnings (see Fig. 9). As a robustness check, we observe similar results for modest changes to the RCA cut-off (see SI Section “Taught Skill Distinctiveness and Labor Market Outcomes”).
The salary gap among majors is multifaceted, involving factors like labor market demands [64], institutional focus on specific fields [65], major distribution’s effect on gender wage disparities [62], and the impact of gender segregation in the labor market [66]. Addressing this gap requires a blend of strategies such as adjusting recruitment incentives, reevaluating institutional priorities, and fostering gender equality in education and occupations.
Limitations
This study produces a novel large-scale data set reflecting the skills taught to US college and university students across majors. While useful for understanding one of the major pathways for workforce development in the US, there are some limitations to the current data set. First, the syllabus dataset is, to our knowledge, the largest collection of university syllabi available, but it is not comprehensive. The syllabus data has a sampling bias towards specific majors and universities; we describe the coverage of this data in Section “Data Records”. Second, we propose a new approach for inferring taught skills (i.e., O*NET DWAs and Tasks) from syllabus text, but it is difficult to confirm the effectiveness of our approach without wide-scale comprehensive exams to test the skills that students actually obtain during a course. Such an effort would be extremely cumbersome because each student would ideally be assessed on over 2,000 DWAs; it’s not clear how to empirically validate each of these DWAs and implementing such an examination across universities and majors throughout the US would be an immense undertaking. Effectively, it is crucial to acknowledge that teaching does not necessarily equate to learning. Third, our approach relies on the O*NET database which is designed to describe workers in the US workforce, and not explicitly designed to describe learning outcomes. While O*NET serves as a standardized taxonomy for communicating results to policymakers, its coverage across all occupations, and by extension, academic majors, is not uniformly comprehensive.
Code availability
The source code for Syllabus2O*NET is available at: https://github.com/AlirezaJavadian/Syllabus-to-ONET and the dataset is available at https://doi.org/10.6084/m9.figshare.25632429
References
- [1] Spenner, K. I. Skill: Meanings, methods, and measures. Work and Occupations 17, 399–421 (1990). https://doi.org/10.1177/0730888490017004002.
- [2] Attewell, P. What is skill? Work and Occupations 17, 422–448 (1990). https://doi.org/10.1177/0730888490017004003.
- [3] Warhurst, C., Mayhew, K., Finegold, D. & Buchanan, J. The Oxford handbook of skills and training (Oxford University Press, 2017).
- [4] Garrote Sanchez, D. et al. Who on earth can work from home? The World Bank Research Observer 36, 67–100 (2021).
- [5] Acemoglu, D. & Restrepo, P. Tasks, automation, and the rise in us wage inequality. Econometrica 90, 1973–2016 (2022).
- [6] Deming, D. J. The value of soft skills in the labor market. NBER Reporter 4, 7–11 (2017).
- [7] Hemelt, S. W., Hershbein, B., Martin, S. M. & Stange, K. M. College majors and skills: Evidence from the universe of online job ads. Tech. Rep., National Bureau of Economic Research (2021).
- [8] Haveman, R. & Smeeding, T. The role of higher education in social mobility. The Future of children 125–150 (2006).
- [9] Chetty, R., Friedman, J. N., Saez, E., Turner, N. & Yagan, D. Mobility report cards: The role of colleges in intergenerational mobility. Tech. Rep., national bureau of economic research (2017).
- [10] Kerckhoff, A. C. Education and social stratification processes in comparative perspective. Sociology of education 3–18 (2001).
- [11] Acemoglu, D. & Autor, D. Chapter 12 - skills, tasks and technologies: Implications for employment and earnings. vol. 4 of Handbook of Labor Economics, 1043–1171, https://doi.org/10.1016/S0169-7218(11)02410-5 (Elsevier, 2011).
- [12] Altonji, J., Arcidiacono, P. & Maurel, A. Chapter 7 - the analysis of field choice in college and graduate school: Determinants and wage effects. vol. 5 of Handbook of the Economics of Education, 305–396, https://doi.org/10.1016/B978-0-444-63459-7.00007-5 (Elsevier, 2016).
- [13] Altonji, J. G., Blom, E. & Meghir, C. Heterogeneity in human capital investments: High school curriculum, college major, and careers. Annual Review of Economics 4, 185–223 (2012). https://doi.org/10.1146/annurev-economics-080511-110908.
- [14] Triventi, M. The role of higher education stratification in the reproduction of social inequality in the labor market. Research in social stratification and mobility 32, 45–63 (2013).
- [15] Lovenheim, M. & Smith, J. Chapter 4 - returns to different postsecondary investments: Institution type, academic programs, and credentials. vol. 6 of Handbook of the Economics of Education, 187–318, https://doi.org/10.1016/bs.hesedu.2022.11.006 (Elsevier, 2023).
- [16] Shapiro, D. et al. Completing college: A national view of student attainment rates by race and ethnicity–fall 2010 cohort (signature 12 supplement). National Student Clearinghouse (2017).
- [17] Bonvillian, W. B. & Sarma, S. E. Workforce education: a new roadmap (MIT Press, 2021).
- [18] Taylor, P. et al. Is college worth it? (Pew Social and Demographic trends, 2011).
- [19] Brauer, S. Towards competence-oriented higher education: a systematic literature review of the different perspectives on successful exit profiles. Education+ Training 63, 1376–1390 (2021).
- [20] Li, X., Linde, S. & Shimao, H. Major complexity index and college skill production. Available at SSRN 3791651 (2021).
- [21] Javadian Sabet, A., Bana, S. H., Yu, R. & Frank, M. A national longitudinal dataset of skills taught in u.s. higher education curricula, 10.6084/m9.figshare.25632429.v1 (2024).
- [22] Akour, M. & Alenezi, M. Higher education future in the era of digital transformation. Education Sciences 12, 784 (2022).
- [23] Brasca, C., Krishnan, C., Marya, V., Owen, K. & Sirois, J. How technology is shaping learning in higher education. McKinsey & Company. June 15 (2022).
- [24] O*NET OnLine, (2024). Available at https://www.onetonline.org/.
- [25] Lim, J., Aklin, M. & Frank, M. R. Location is a major barrier for transferring us fossil fuel employment to green jobs. Nature Communications 14, 5711 (2023).
- [26] Frank, M. R., Sun, L., Cebrian, M., Youn, H. & Rahwan, I. Small cities face greater impact from automation. Journal of the Royal Society Interface 15, 20170946 (2018).
- [27] Chau, H., Bana, S. H., Bouvier, B. & Frank, M. R. Connecting higher education to workplace activities and earnings. Plos one 18, e0282323 (2023).
- [28] Alabdulkareem, A. et al. Unpacking the polarization of workplace skills. Science advances 4, eaao6030 (2018).
- [29] Frank, M. R. et al. Toward understanding the impact of artificial intelligence on labor. Proceedings of the National Academy of Sciences 116, 6531–6539 (2019).
- [30] Moro, E. et al. Universal resilience patterns in labor markets. Nature communications 12, 1972 (2021).
- [31] Frank, M. R. et al. Network constraints on worker mobility. Nature Cities 1, 94–104 (2024).
- [32] Agnihotri, A. & Misra, R. K. Managerial competencies: A comparative study of us-india employer’s needs. Global Business and Organizational Excellence 43, 92–106 (2024).
- [33] Cabell, A. Supporting the career development of black adults during the covid-19 pandemic. Journal of Employment Counseling 60, 62–71 (2023).
- [34] Council, N. R. et al. A database for a changing economy: Review of the occupational information network (o*net) (2010).
- [35] Qi, P., Zhang, Y., Zhang, Y., Bolton, J. & Manning, C. D. Stanza: A python natural language processing toolkit for many human languages. arXiv preprint arXiv:2003.07082 (2020).
- [36] Reimers, N. & Gurevych, I. Sentence-bert: Sentence embeddings using siamese bert-networks. arXiv preprint arXiv:1908.10084 (2019).
- [37] Reimers, N. & Inui, K. Sentence-transformers/all-mpnet-base-v2 · hugging face (2019).
- [38] Lo, K., Wang, L. L., Neumann, M., Kinney, R. & Weld, D. S2ORC: The semantic scholar open research corpus. In Proceedings of the 58th Annual Meeting of the Association for Computational Linguistics, 4969–4983 (Association for Computational Linguistics, Online, 2020).
- [39] Fader, A., Zettlemoyer, L. & Etzioni, O. Open Question Answering Over Curated and Extracted Knowledge Bases. In KDD (2014).
- [40] Lewis, P. et al. Paq: 65 million probably-asked questions and what you can do with them. Transactions of the Association for Computational Linguistics 9, 1098–1115 (2021).
- [41] Khashabi, D. et al. Gooaq: Open question answering with diverse answer types. arXiv preprint (2021).
- [42] Hoen, A. R. & Oosterhaven, J. On the measurement of comparative advantage. The Annals of Regional Science 40, 677–691 (2006).
- [43] Hidalgo, C. A. & Hausmann, R. The building blocks of economic complexity. Proceedings of the national academy of sciences 106, 10570–10575 (2009).
- [44] Hausmann, R. & Hidalgo, C. A. The network structure of economic output. Journal of economic growth 16, 309–342 (2011).
- [45] Hartmann, D., Guevara, M. R., Jara-Figueroa, C., Aristarán, M. & Hidalgo, C. A. Linking economic complexity, institutions, and income inequality. World development 93, 75–93 (2017).
- [46] Johnson, S. C. Hierarchical clustering schemes. Psychometrika 32, 241–254 (1967).
- [47] Aloysius, O. I., Ismail, I. A., Suandi, T. & Arshad, M. Enhancing university’s and industry’s employability-collaboration among nigeria graduates in the labor market. International Journal of Academic Research in Business and Social Sciences 8, 32–48 (2018).
- [48] Pujol-Jover, M., Riera-Prunera, C. & Abio, G. Competences acquisition of university students: Do they match job market’s needs? Intangible Capital 11, 612–626 (2015).
- [49] Jackson, D. & Tomlinson, M. The relative importance of work experience, extra-curricular and university-based activities on student employability. Higher Education Research & Development 41, 1119–1135 (2022).
- [50] Börner, K. et al. Skill discrepancies between research, education, and jobs reveal the critical need to supply soft skills for the data economy. Proceedings of the National Academy of Sciences 115, 12630–12637 (2018).
- [51] Christl, M. & Köppl-Turyna, M. Gender wage gap and the role of skills and tasks: evidence from the austrian piaac data set. Applied Economics 52, 113–134 (2020).
- [52] Azmat, G. & Ferrer, R. Gender gaps in performance: Evidence from young lawyers. Journal of Political Economy 125, 1306–1355 (2017).
- [53] Hausmann, R., Tyson, L. D., Zahidi, S. et al. The global gender gap report 2012 (World Economic Forum Geneva, 2012).
- [54] Fana, M., Villani, D. & Bisello, M. Gender gaps in power and control within jobs. Socio-Economic Review 21, 1343–1367 (2022). https://academic.oup.com/ser/article-pdf/21/3/1343/50969983/mwac062.pdf.
- [55] Encinas-Martin, M. & Cherian, M. Gender, education and skills: The persistence of gender gaps in education and skills. OECD Skills Studies 1–54 (2023).
- [56] Eloundou, T., Manning, S., Mishkin, P. & Rock, D. Gpts are gpts: An early look at the labor market impact potential of large language models. arXiv preprint arXiv:2303.10130 (2023).
- [57] Li, L. Reskilling and upskilling the future-ready workforce for industry 4.0 and beyond. Information Systems Frontiers 1–16 (2022).
- [58] Balducci, M. Linking gender differences with gender equality: A systematic-narrative literature review of basic skills and personality. Frontiers in Psychology 14, 1105234 (2023).
- [59] David, M. & Maurer, H. Reclaiming agency: skills, academics and students in the social sciences. European Political Science 1–17 (2022).
- [60] Ishiyama, J. Frequently used active learning techniques and their impact: A critical review of existing journal literature in the united states. European Political Science 12, 116–126 (2013).
- [61] Grogger, J. & Eide, E. Changes in college skills and the rise in the college wage premium. Journal of Human Resources 280–310 (1995).
- [62] Eide, E. College major choice and changes in the gender wage gap. Contemporary Economic Policy 12, 55–64 (1994).
- [63] Long, M. C., Goldhaber, D. & Huntington-Klein, N. Do completed college majors respond to changes in wages? Economics of Education Review 49, 1–14 (2015).
- [64] Metcalf, D. University salaries: faculty differentials. Economica 362–372 (1970).
- [65] Johnson, J. A. & Taylor, B. J. Academic capitalism and the faculty salary gap. Innovative Higher Education 44, 21–35 (2019).
- [66] Doseděl, T. Poorly paid jobs or study fields? gender pay gap of tertiary-educated employees in contemporary european labour markets. Population Review 61, 55–71 (2022).
Acknowledgments
This work received funding from Russell Sage Foundation and is supported by the University of Pittsburgh Center for Research Computing.
Author contributions statement
A.J.S. processed the data, performed all calculations, and produced all figures and statistics. All authors designed the research, analyzed the results, and reviewed the manuscript.
Competing interests
The authors declare no competing interests.