Observation of Floquet states in graphene
Abstract
Recent advances in the field of condensed-matter physics have unlocked the potential to realize and control emergent material phases that do not exist in thermal equilibrium Basov et al. (2017); de la Torre et al. (2021); Bao et al. (2022). One of the most promising concepts in this regard is Floquet engineering, the coherent dressing of matter via time-periodic perturbations Rudner and Lindner (2020); Oka and Kitamura (2019). However, the broad applicability of Floquet engineering to quantum materials is still unclear. For the paradigmatic case of monolayer graphene, the theoretically predicted Floquet-induced effects Oka and Aoki (2009); Usaj et al. (2014); Sentef et al. (2015); Schüler et al. (2020), despite a seminal report of the light-induced anomalous Hall effect McIver et al. (2020), have been put into question Aeschlimann et al. (2021). Here, we overcome this problem by using electronic structure measurements to provide direct experimental evidence of Floquet engineering in graphene. We report light-matter-dressed Dirac bands by measuring the contribution of Floquet sidebands, Volkov sidebands Baggesen and Madsen (2008); Saathoff et al. (2008), and their quantum path interference Mahmood et al. (2016); Park (2014) to graphene’s photoemission spectral function. Our results finally demonstrate that Floquet engineering in graphene is possible, paving the way for the experimental realization of the many theoretical proposals on Floquet-engineered band structures and topological phases Hübener et al. (2017); Lindner et al. (2011); Claassen et al. (2016); Zhang et al. (2016); Yan and Wang (2016); Sentef et al. (2015); Liu et al. (2018); Rodriguez-Vega et al. (2021); Topp et al. (2019); Katz et al. (2020); Kennes et al. (2021); Chan et al. (2023).
Introduction
The field of topological Floquet engineering was started by Oka and Aoki Oka and Aoki (2009), who proposed that the Haldane model Haldane (1988) – one of the most paradigmatic models of topology in condensed matter physics – can be realized in monolayer graphene. Upon irradiation with circularly polarized light, a dynamical topological anomalous Hall state can be induced, which manifests itself via the formation of Floquet replicas of the original Bloch bands and a band gap opening at the Brillouin zone’s K and K′ points with an inherent change of the Chern number. Such a light-induced topological phase transition can be rationalized within Floquet theory Shirley (1965); Usaj et al. (2014); Sentef et al. (2015), and has been demonstrated experimentally for ultracold fermions in an optical lattice Jotzu et al. (2014) and photonic crystals Rechtsman et al. (2013). Specifically in graphene, the power and versatility of Floquet engineering was demonstrated in a pioneering experiment reporting a light-induced anomalous Hall effect McIver et al. (2020). However, significant theoretical effort was needed to explain the experimental findings by a combination of Floquet-induced topology and asymmetric photocarrier distributions Sato et al. (2019); Nuske et al. (2020). Moreover, while there is a growing body of experimental reports highlighting the applicability of Floquet engineering to condensed matter systems Wang et al. (2013); Sie et al. (2014); Mahmood et al. (2016); Reutzel et al. (2020); Aeschlimann et al. (2021); Park et al. (2022); Zhou et al. (2023a); Ito et al. (2023); Kobayashi et al. (2023); Zhou et al. (2023b), for graphene, today’s preconception is that the ultrafast decoherence time of only a few tens of femtoseconds Heide et al. (2021) is so short that it hinders the efficient generation and verification of Floquet-engineered phases Aeschlimann et al. (2021); Sato et al. (2020); Broers and Mathey (2022). Hence, any unambiguous experimental demonstration of the Floquet engineering concept for monolayer graphene would be a major advancement in the field.
In this article, we use linearly-polarized infrared driving light fields to coherently dress monolayer graphene and then probe the energy-momentum dispersion of the light-dressed band structure with extreme ultraviolet laser pulses generated via high-harmonic generation in a new type of angle-resolved photoemission spectroscopy experiment (ARPES), known as momentum microscopy Medjanik et al. (2017); Keunecke et al. (2020a). In the direct comparison of measured and calculated ARPES maps of the light-dressed band structure, we identify energy- and momentum-resolved fingerprints of Floquet sidebands, Volkov sidebands, and their mutual interference. Specifically, we show that the latter, i.e., the quantum path interference between Floquet and Volkov states in momentum space, is a powerful tool to unambiguously identify light-dressed band structures with time-resolved momentum microscopy. Our work opens up a direct pathway to test the many theoretical proposals of light-induced phase transitions that have remained elusive experimentally to this date Hübener et al. (2017); Lindner et al. (2011); Claassen et al. (2016); Zhang et al. (2016); Yan and Wang (2016); Sentef et al. (2015); Liu et al. (2018); Rodriguez-Vega et al. (2021); Topp et al. (2019); Katz et al. (2020); Kennes et al. (2021); Chan et al. (2023).
Experimental observables for Floquet engineering in graphene
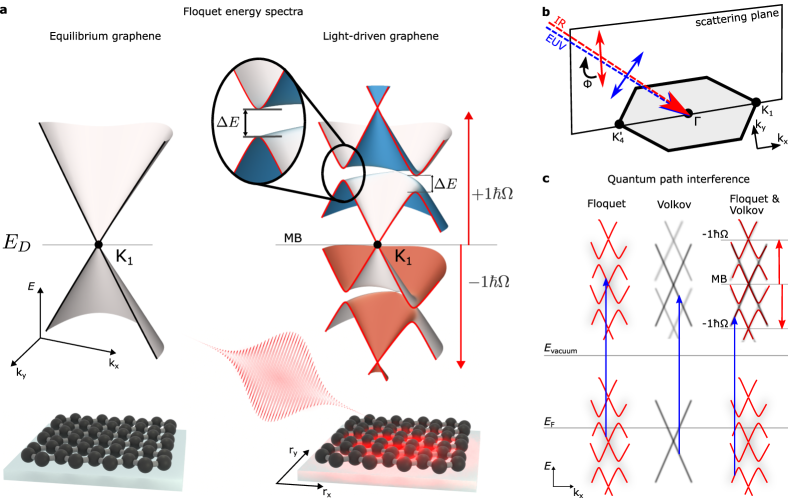
Figure 1a shows a schematic of the equilibrium (black) and the Floquet-engineered (red) electronic structure of graphene (using linearly-polarized laser pulses). As discussed in many earlier reports Oka and Aoki (2009); Usaj et al. (2014); Sentef et al. (2015); Schüler et al. (2020), the light-dressed band structure deviates from its equilibrium counterpart based on two distinct signatures: First (i), Floquet theory predicts that higher-order photon-dressed sidebands of the main band Dirac cone are formed (labelled and MB in Fig. 1a, respectively). Second (ii), energy bands are gapped where sidebands of different photon order cross and hybridize in energy-momentum space ( in Fig. 1a). To probe such coherent modifications of graphene’s band structure, the combination of ARPES, in particular momentum microscopy, with a femtosecond pump-probe setup is ideally suited Wang et al. (2013); Mahmood et al. (2016); Reutzel et al. (2020); Aeschlimann et al. (2021); Zhou et al. (2023a); Ito et al. (2023); Zhou et al. (2023b); Keunecke et al. (2020b). While an infrared (IR) laser pulse enables the periodic driving of the system, a time-delayed extreme ultraviolet (EUV) laser pulse allows to record the energy- and in-plane momentum-resolved photoemission spectral function. Notably, as broadband ultrashort laser pulses are used in time-resolved ARPES experiments, Floquet energy gaps might not be directly resolvable (extended Fig. 7). Hence, it is more straightforward to study the aforementioned case (i), i.e., the photon-dressed sideband formation in momentum space. We opt for this route by using our in-house photoemission endstation Keunecke et al. (2020a); Schmitt et al. (2022) that combines a time-of-flight momentum microscope Medjanik et al. (2017) with an ultrafast table-top EUV light source. From the -doped graphene sample grown on 4H-SiC Momeni Pakdehi et al. (2018); Düvel et al. (2022), the momentum microscope facilitates the collection of photoelectrons as a function of energy and both in-plane momenta kx and ky. In our experimental geometry, the EUV probe (26.5 eV, fs, -polarized) and infrared (IR) driving ( eV, 100 fs, 3 MV/cm) pulses impinge nearly co-linearly onto the graphene sample at an oblique angle of incidence of 22°. The K--K1 crystal direction lies in the scattering plane and photoelectrons are collected in the proximity of the K1 point (Fig. 1b).
IR polarization dependence of sideband photoemission yield
During the presence of the IR driving laser field, Floquet eigenstates are created and can, in principle, be photoexcited by the EUV laser pulse and measured with ARPES (Fig. 1c, left panel). However, when ARPES is used for such measurements, it is well-known that a competing process can lead to similar photoemission signatures: The coherent interaction of quasi-free photoelectrons with the driving light field leads to the formation of so-called Volkov sidebands of the main photoemission signature (Fig. 1c, middle panel) Baggesen and Madsen (2008); Saathoff et al. (2008). Importantly, these Volkov sidebands look similar to Floquet sidebands in ARPES, but are not an indication for a light-dressed band structure. However, because the Floquet and the Volkov transitions are observed at the same final state energy, quantum path interference effects between both excitation pathways occur and can be observed Park (2014); Mahmood et al. (2016) (Fig. 1c, right panel). Hence, for the unambiguous identification of Floquet sidebands in ARPES, the experimental challenge lies in the discrimination of Floquet sidebands, Volkov sidebands, and their interference pattern.
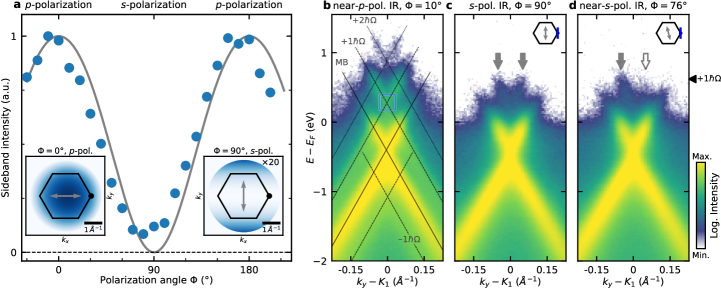
For this task, we make use of the fact that the (kx,ky)-momentum-resolved amplitude of Volkov sidebands can be controlled by varying the polarization of the IR field Keunecke et al. (2020b); Park (2014); Mahmood et al. (2016), and do not yet consider possible contributions of Floquet states (methods): For -polarized IR pulses (°), the surface projected electric field vector is oriented parallel to the scattering plane, and the amplitude of Volkov sidebands is large for all six Ki points (Fig. 2a, left inset). In contrast, for -polarized IR pulses (°), the surface projected electric field vector is oriented perpendicular to the scattering plane, and the Volkov sideband amplitude vanishes for all momenta along the K--K1 crystal direction (Fig. 2a, right inset). Based on these calculations, in the main panel of Fig. 2a, we plot the calculated polarization dependence of the Volkov sideband amplitude at the momentum of the K1 point (grey line): The Volkov sideband amplitude is maximized for -polarized light and vanishes for -polarized light. Hence, if it is possible to observe sideband photoemission spectral weight in the proximity of the K1 point for -polarized IR light, where the Volkov sideband amplitude must be zero, the result would be indicative for the formation of Floquet states.
Figures 2b,c,d show energy- and momentum-resolved photoemission data collected in temporal overlap of the EUV and the IR laser pulses; the polarization of the IR pulses is ° (near--polarization), 90° (-polarization), and 76° (near--polarization). Starting with the case of near--polarization, we can clearly identify the main Dirac cone (main band, MB), and, in addition, sidebands spaced by , , and (Fig. 2b). In order to evaluate the impact of the IR polarization on the sideband photoemission yield, we systematically evaluate the data in a 0.064 Å Å eV region of interest at the sideband (blue box in Fig. 2b). For all polarizations , we detect a spectral weight originating from the sideband (Fig. 2a, data points). Notably, even for the case of -polarized IR pulses, we still identify spectral weight of the sideband (Fig. 2c). This observation is in stark contrast to the expected fingerprints in the hypothetical case of Volkov states only, which should not lead to a finite sideband photoemission yield for -polarized IR pulses (grey line in Fig. 2a).
The natural follow-up question is whether the sideband photoemission signal collected for -polarized IR light already constitutes unambiguous proof for the existence of Floquet states (Fig. 2c), especially since such a signature could not be identified in a previous ARPES experiment Aeschlimann et al. (2021). For instance, it might be possible that the linear polarization of the IR pulses is not pure, which would also lead to a finite Volkov sideband intensity. Hence, an additional hallmark that supports the successful generation of Floquet states seems necessary. Looking again at Fig. 2b-d, we find another very strong signature in the energy-momentum-resolved photoemission spectra that is incompatible with the Volkov picture alone: While the near-- and the -polarized measurements show symmetric sideband spectral weight in momentum-direction (Fig. 2b,c), for °, the measurement exhibits a striking asymmetry between the two sides of the Dirac cone (Fig. 2d, vertical arrows). In the following, we will show that such strongly asymmetric photoemission signatures of the observed sidebands cannot be explained within the Volkov or the Floquet picture alone, but must be a result of quantum path interference of Volkov and Floquet states.
Verification of Floquet states in graphene
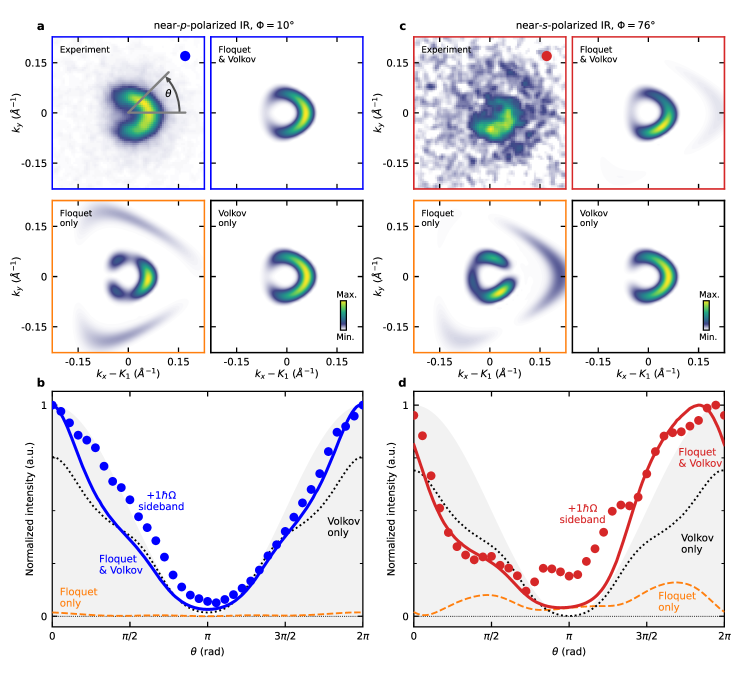
To investigate the momentum asymmetry in more detail, we make use of the full momentum-resolved data collection capability of our photoemission endstation and generate (,)-resolved photoemission maps at the energy of the sideband (Fig. 3a,c). While the momentum map of the near--polarized case (°) shows the well-known horseshoe-like spectral weight distribution in the sideband that originates from the dark corridor effect Shirley et al. (1995) (Fig. 3a), in the case of near--polarized IR pulses (°), the spectral weight distribution is dominated by the strong asymmetry (Fig. 3b) that was already observed in the energy-momentum-resolved data in Fig. 2d. In order to show that this asymmetry provides unambiguous evidence for Floquet states in graphene, we compare our experimental data with ARPES momentum maps calculated within the time-dependent non-equilibrium Green’s function formalism (methods). The calculations are performed such that the spectral weight in the momentum maps can contain contributions of the coherent sum of Floquet and Volkov sidebands, Floquet sidebands only, or Volkov sidebands only, as labelled in the respective momentum maps in Fig. 3a,c. Intriguingly, already from the visual inspection of the momentum maps, it is obvious that the experimental momentum asymmetry for the near--polarized IR pulses can only be reproduced by the calculations that consider constructive and destructive quantum path interference processes between Floquet and Volkov transitions (Fig. 3c, red highlighted momentum maps). Neither the calculated momentum-dependence of the pure Floquet (orange) nor of the pure Volkov (black) transitions can reproduce the experimentally observed asymmetry.
We evaluate the momentum-dependent spectral weight distribution of the sideband in experiment and theory by integrating the sideband signal in segments around the K1 point parameterized with the angle (cf. Fig. 3a). For near--polarized IR pulses (Fig. 3b), we make two important observations: First, we find that the experimental data (blue circles) follows the -dependence expected from the dark corridor effect Shirley et al. (1995) (grey area), indicating that the sideband spectral weight is a near-perfect replica of the non-driven main band (extended Fig. 5c). Second, the experimental -dependence is well-described by the calculations that include the coherent contribution of Floquet and Volkov states (blue solid line). However, by comparing the -dependent spectral weight of the Volkov only (black dotted line) and the Floquet only calculation (orange dashed line), it is obvious that mainly Volkov transitions contribute to the measured sideband intensity, as expected for near--polarized driving.
Next, we repeat the same evaluation for the sideband momentum pattern for the case of near--polarized IR pulses (°, Fig. 3c,d). In Fig. 3d, it is directly clear that the sideband’s photoemission spectral weight (red circles) deviates from the pure cosine-like -dependence and thus does not follow the periodicity of graphene’s dark corridor (grey area). To verify the contribution of Floquet states at ° IR driving, Fig. 3d shows the -dependence of the spectral weight of the calculated momentum maps for Floquet-only (orange line), Volkov-only (black line), and the case of photoemission quantum path interference of Floquet and Volkov states (red line). Notably, the -dependence of the Volkov-only solution is close to symmetric for , as found for the case of near--polarized IR driving, but in contrast to the experimental data of the ° case. Hence, the measured momentum-asymmetric sideband spectral weight distribution cannot be described within the Volkov formalism alone. Likewise, the calculated Floquet-only momentum-dependence is close to symmetric for , and therefore does not reproduce our experimental observations either. However, in the case that constructive and destructive quantum path interference processes of Floquet and Volkov transitions are considered, our calculations clearly reproduce the experimentally observed asymmetry (red line). In other words, the strong asymmetric momentum-fingerprint of the sideband intensity can only be observed if Floquet and Volkov states are detected, which thus, for the first time, directly verifies the experimental realization of Floquet engineering in graphene.
Quantum path interference of Floquet and Volkov states
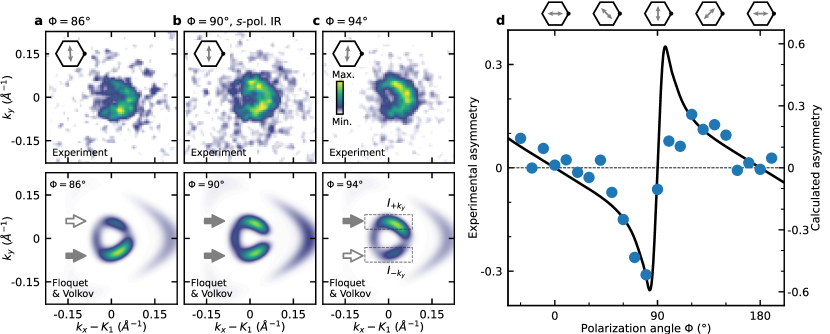
Our results indicate that the momentum-resolved sideband photoemission spectral weight is dependent on the relative phase of the Floquet and Volkov transitions contributing to the quantum path interference conditions. As discussed by Park Park (2014), the phase of the Floquet amplitude is determined by the projection of the IR field onto the momentum , while the Volkov phase exhibits a much weaker dependence. Therefore, as in an interferometer where the phase of one channel can be controlled, it must be possible to flip the asymmetric momentum fingerprint of the sideband by controlling the polarization angle around = 90° (-polarization). In Fig. 4a-c, we show measured (top row) and calculated (bottom row) momentum maps of the sideband for = 90° (Fig. 4b) and = 90° 4° (Fig. 4a,c). In the case of -polarized IR pulses, the surface projected electric field vector is oriented perpendicular to the scattering plane and the quantum path interference conditions are symmetric in and direction (Fig. 4b). In contrast, if °, the surface projected electric field vector and the scattering plane are not perpendicular anymore with respect to each other, and quantum path interference leads to an asymmetric spectral weight for (Fig. 4a,c). In particular, the asymmetry flips for angles °, as expected from theory. Finally, Fig. 4d shows the systematic evaluation of the momentum asymmetry as a function of the IR pulse polarization angle . In agreement between experiment (blue dots) and theory (black line), we find that the asymmetry increases from the -polarized (°, 180°) to the -polarized case (°). Close to -polarization (°), the asymmetry flips and is most sensitive to changes in polarization, as both Floquet and Volkov sideband contributions have comparable amplitudes.
Conclusions and outlook
We directly and unambiguously demonstrate the successful generation of Floquet states in graphene. We do so by exploiting quantum path interference processes of Floquet and Volkov transitions in the time- and momentum-resolved photoemission experiment, i.e., without the need to resolve vanishingly small energy gaps or band renormalizations. More generally, our results are the first direct experimental proof for the seminal theoretical predictions of Floquet states in monolayer graphene, first proposed about 15 years ago Oka and Aoki (2009). In a next step, the application of circularly polarized driving light pulses will show if a phase transition to a topologically non-trivial state can be achieved. Moreover, since the pioneering work of Oka and Aoki Oka and Aoki (2009), many subsequent theoretical proposals have extended the Floquet engineering concept to quantum materials such as Weyl semimetals Hübener et al. (2017) and twisted heterostructures of two-dimensional materials Rodriguez-Vega et al. (2021); Topp et al. (2019); Katz et al. (2020), motivating even the combination of Floquet engineering and twistronics Kennes et al. (2021). Our results will allow the experimental verification of all these theoretical proposals in the coming years, promising the creation of light-matter coupled material phases without a counterpart in thermal equilibrium.
I ACKNOWLEDGEMENTS
We thank G. S. Matthijs Jansen for fruitful discussions. The Göttingen authors acknowledge funding by the Deutsche Forschungsgemeinschaft (DFG, German Research Foundation) via 217133147/SFB 1073, projects B03, B07, and B10. The PTB group was supported by the Deutsche Forschungsgemeinschaft (DFG) project Pi385/3-1 within the Research Unit FOR5242 and the DFG Germany’s Excellence Strategy–EXC-2123 QuantumFrontiers – 390837967. M.S. acknowledges support from SNSF Ambizione Grant No. PZ00P2-193527. M.A.S. was funded by the European Union (ERC, CAVMAT, project no. 101124492). We acknowledge access to Piz Daint at the Swiss National Supercomputing Centre, Switzerland under the PSI’s share with the project ID psi10.
II AUTHOR CONTRIBUTIONS
M.M., D.Sch., J.P.B., and W.B. carried out the time-resolved momentum microscopy experiments. M.M. analyzed the experimental data with contributions from D.Sch.. M.S. performed the calculations. K.P., H.W.S., and D.M. provided the graphene sample. All authors discussed the results. S.M. and M.R. were responsible for the overall project direction and wrote the manuscript with contributions from all co-authors.
Methods
I Experimental setup and sample preparation
The time-resolved momentum microscopy experiments have been performed with our in-house photoemission endstation that combines a time-of-flight momentum microscope Medjanik et al. (2017) (Surface Concept GmbH) and a 300 W fiber laser system (Active Fiber Systems) Keunecke et al. (2020a). The laser is operated at 500 kHz and drives a table-top high-harmonic generation (HHG) beamline and an optical parametric amplifier (OPA, Light Conversion), as detailed in refs. Keunecke et al. (2020a); Schmitt et al. (2022). The HHG beamline is operated with 5 W, 50 fs, 515 nm pulses focused into Argon gas, and the 11th harmonic (26.5 eV, -polarized) is selected with a pair of EUV multilayer mirrors. The OPA is operated at 40 W input power (1030 nm, 220 fs) and generates the 210 mW (at sample), 100 fs, 0.65 eV IR driving laser pulses. The polarization angle of the IR pulses is varied with an achromatic half-wave plate (B. Halle, 700-2500 nm). The polarization of the IR pulses on the sample is determined by monitoring the extractor current as a function of the IR polarization angle (extended Fig. 5a) and the direct comparison of the sideband momentum fingerprints in experiment and theory (Fig. 4).
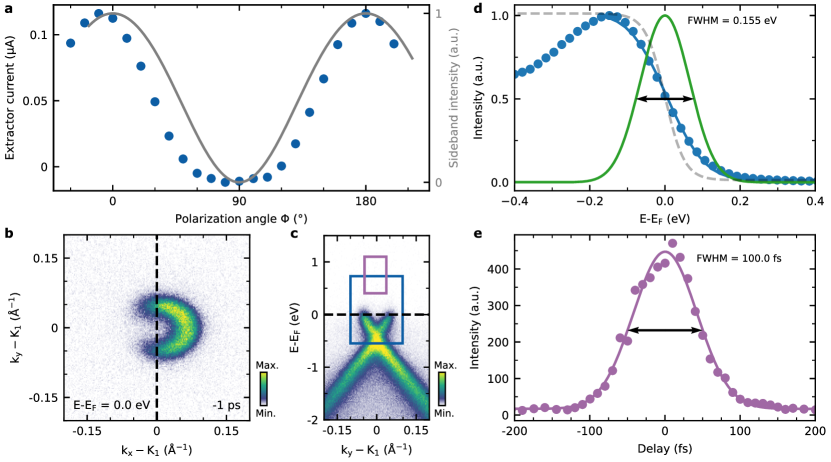
All experiments are performed at room temperature on a -doped graphene sample grown on 4H-SiC Momeni Pakdehi et al. (2018); Düvel et al. (2022). In ultra-high-vacuum, the graphene sample was annealed for 1 h at 450 °C. For all experiments, the microscope was aligned such that a momentum area with a diameter of 1.3 Å-1 centered on the K1 point is projected onto the detector Keunecke et al. (2020a). In addition, the multi-dimensional photoemission data shown throughout the text are corrected for distortions in energy and momentum Xian et al. (2019); Bange et al. (2023); Bennecke et al. (2024). The vacuum electric field strength of the IR pulses is approximated to 3 MV/cm with an estimated diameter of the IR beam of 300 m and a peak fluence of 1.23 mJ/cm2.
II Time- and energy-resolution of the photoemission experiment
We quantify the energy resolution of the momentum microscopy experiment by fitting a momentum-filtered energy distribution curve with a Fermi-Dirac distribution broadened by a Gaussian distribution (extended Fig. 5b,c,d). The data is taken from a measurement at -1 ps delay, i.e., the IR and EUV pulses are on the sample but not in temporal overlap (extended Fig. 5b,c). Keeping the temperature of the Fermi-Dirac distribution fixed to 300 K, the fit yields a Gaussian width of meV (extended Fig. 5d). The Gaussian width then describes the energy resolution of our experiment and contains contributions from the spectral width of the laser pulses and the energy resolution of the momentum microscope Keunecke et al. (2020a).
In extended Fig. 5e, we evaluate the pump-probe delay dependence of the sideband photoemission signal in order to extract the cross-correlation of the IR and EUV beams to 100 fs (FWHM). With a pulse duration of the EUV pulses of 20 fs Keunecke et al. (2020a); Bange et al. (2024), we extract the pulse duration of the IR pulse to 98 fs. This translates to a Fourier-limited spectral width of 27 meV and 124 meV for the IR and the EUV laser pulses, respectively.
III Momentum- and polarization-dependent Volkov sideband amplitude
In the following, we briefly describe the polarization- and momentum-dependence of the Volkov sideband yield, as discussed in the main text and shown in Fig. 2a (insets and grey line). Details on this analysis can be found in refs. Park (2014); Madsen (2005); Baggesen and Madsen (2008); Keunecke et al. (2020b), and we follow the earlier work of some of us (Keunecke et al. Keunecke et al. (2020b)). The photoelectron momentum-distribution of the first order Volkov sideband is given by
| (1) |
with being the photoemission yield of the undriven system, and is the Volkov sideband amplitude. In the electron scattering description Park (2014); Madsen (2005); Baggesen and Madsen (2008), the parameter can be expressed as
| (2) |
Here, the in-plane electric field components and the in-plane momentum components are expressed in polar coordinates, i.e. (measured from the point) and , as detailed in ref. Keunecke et al. (2020b). Moreover, , , and are the elementary charge, the elementary mass, and the driving light frequency, respectively. In the insets of Fig. 2a, the momentum-dependent distribution of , which describes the Volkov amplitude, is plotted for - and -polarized IR pulses in our experimental geometry (see Fig. 1b and ref. Keunecke et al. (2020b)).
IV Details on the calculations
IV.1 Experimental parameters that enter the calculations
For the determination of the experimental parameters that enter our simulations, we start with the measured vacuum field strength of MV/cm (see section I of the methods). Further, we need to adjust the electric field strength at the surface and inside the graphene, because the interface between the graphene and the vacuum is not a sharp interface as assumed for the Fresnel equations. To do so, we introduce scaling factors and for the Volkov and Floquet field strengths at the surface and inside the graphene, respectively.
The electric field strength that generates Volkov sidebands at the surface is then
| (3) |
where () is the amplitude of the incoming (reflected) pump field for a given polarization angle . The reflected field is computed by decomposing into and components and using the Fresnel equations. In direct comparison of our calculations with the experimental results, we fix . We note that this value is in good agreement with a study by Neppl et al. on dielectric screening on the atomic length scale Neppl et al. (2015).
The local effective field driving the electrons inside the graphene sample is also modified by the screening. To account for the screening of the field inside the graphene, we interpolate the fields by approximating the pump field by
| (4) |
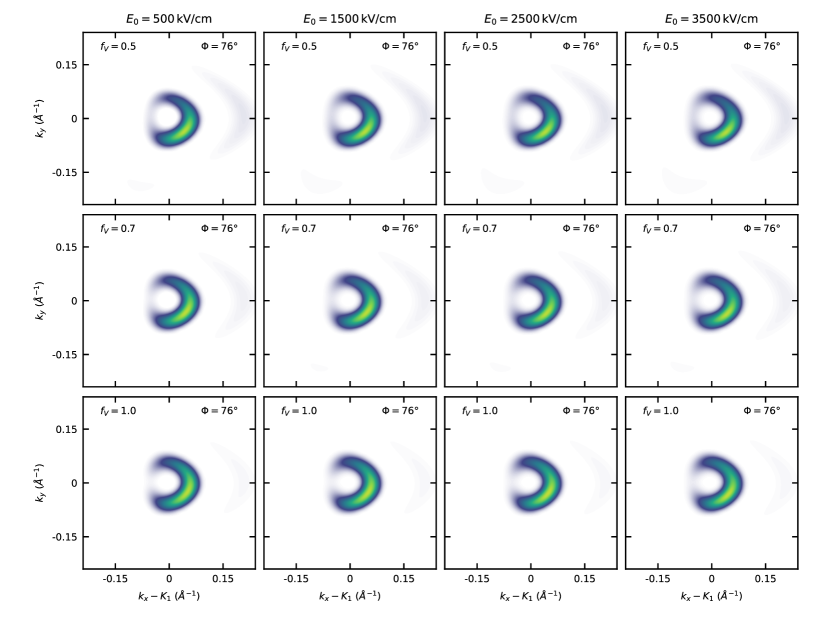
Here, is the transmitted field amplitude. We chose , assuming that the effective electric field interpolates between the field outside and inside the material. We note again that this value is in good agreement with the study by Neppl et al. Neppl et al. (2015). Finally, we stress that while there is a considerable uncertainty of , the momentum-space signatures of the Floquet-Volkov interference discussed in the main text are unaffected over a large parameter range (see extended Fig. 2).
From the electric field amplitudes we also obtain the time-dependent vector potentials and , which enter the calculation of the trARPES signals.
IV.2 Time-dependent dynamics
The pump-induced dynamics are described by solving the equation of motion for the density matrix:
| (5) |
Here, denotes a scattering term incorporating pure dephasing dynamics with a decoherence time of fs. The decoherence of the off-diagonal elements of is defined with respect to the instantaneous Hamiltonian , as discussed in ref. Murakami and Schüler (2022). The Hamiltonian is formulated in the velocity gauge, which allows us to consistently compute the time-resolved photoemission signal while retaining gauge invariance Schüler and Sentef (2021). In the velocity gauge,
| (6) |
We have computed the electronic band structure and the velocity matrix elements using our in-house all-electron density-functional theory (DFT) code. The consistency with the standard codes Quantum Espresso and Wannier90 has been checked. We included the two Dirac-like bands in Eq. (5) and (6).
The pump pulse is parameterized by a Gaussian pulse,
| (7) |
where is a Gaussian function with FWHM = 100 fs.
We have also performed calculations for the Floquet band structure of the Hamiltonian (6) by replacing and analyzing the thus time-periodic Hamiltonian.
IV.3 Simulation of time-resolved ARPES data
From the time-dependent density matrix we computed the time-resolved photoemission spectra through the time-dependent nonequilibrium Green’s function (td-NEGF) formalism. As described in refs. Schüler et al. (2020); Schüler and Sentef (2021), we employed the generalized Kadanoff-Baym ansatz (GKBA) that yields the lesser Green’s function from the equation of motion
| (8) |
with . From the Green’s function we can then compute the photoemission signal as a function of quasi-momentum , final-state energy , and pump-probe delay as
| (9) |
In Eq. (9), denotes the envelope function of the probe pulse (taken as Gaussian function with FWHM = 20 fs), while the phase factor is defined by
| (10) |
where is the photon energy of the probe pulse and is the light-dressed final state energy:
| (11) |
Here, , while is determined from . In our theory, the LAPE effect can be switched off by replacing in Eq. (11). Similarly, the case of pure Volkov side bands can be simulated by replacing in the time-dependent Hamiltonian (6).
Our DFT code also allows us to compute the photoemission matrix elements
| (12) |
where denotes the polarization of the -polarized probe pulse, and where are the inverse LEED states. The predictive power of our method to directly compute the matrix elements (12) has been confirmed by comparing the calculations to probe photon-energy dependent measurements in equilibrium.
V Floquet energy gaps in time-resolved ARPES experiments
In the main text, we highlight two options to observe a Floquet-engineered band structure in an ARPES experiment. Option (ii) is the identification of light-induced energy gaps where Floquet bands of different photon orders cross ( in Fig. 1a). For this, extended Fig. 7a shows energy-momentum-resolved photoemission data taken along the kx momentum direction for -polarized IR pulses (K1 point, °), i.e., the momentum direction where Floquet energy gaps are expected Mahmood et al. (2016); Sentef et al. (2015); Aeschlimann et al. (2021). However, the data shows no clear indication for energy gaps.
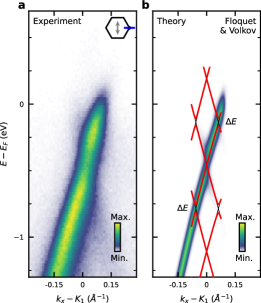
To verify whether this result is caused by the limited energy resolution in our ultrafast ARPES experiment with spectrally broad laser pulses, we compare the experimental data with our model calculations. For this, we first calculate the energy-momentum dispersion of the Floquet eigenenergies (red lines in extended Fig. 7b). For the 650 meV IR pulses with a vacuum electric field strength of 3 MV/cm, we extract a Floquet energy gap of meV. Second, we calculate an ARPES spectrum of the light-driven band structure within the non-equilibrium Green’s function formalism (color-coded data in extended Fig. 7b). The ARPES spectrum now intrinsically shows a distinct energy broadening, which is mainly caused by the spectrally broad pump and probe laser pulses. We note that the linewidth of the calculated ARPES signature is much narrower than found in our experimental results, indicating that also other broadening effects contribute to the experimental broadening (155 meV, extended Fig. 5d), which are not captured in the model. Nevertheless, also in the calculated ARPES spectrum, it is not straightforwardly possible to identify a clear spectroscopic signature of an energy gap. In consequence, for the parameters of the driving light field that are currently accessible with our setup, we conclude that the energy resolution of the time-resolved momentum microscopy experiment is simply not sufficient to directly resolve the spectroscopic signatures of energy gaps.
References
- Basov et al. (2017) D. N. Basov, R. D. Averitt, and D. Hsieh, “Towards properties on demand in quantum materials,” Nature Materials 16, 1077–1088 (2017).
- de la Torre et al. (2021) Alberto de la Torre, Dante M. Kennes, Martin Claassen, Simon Gerber, James W. McIver, and Michael A. Sentef, “Colloquium: Nonthermal pathways to ultrafast control in quantum materials,” Rev. Mod. Phys. 93, 041002 (2021).
- Bao et al. (2022) Changhua Bao, Peizhe Tang, Dong Sun, and Shuyun Zhou, “Light-induced emergent phenomena in 2D materials and topological materials,” Nature Reviews Physics 4, 33–48 (2022).
- Rudner and Lindner (2020) Mark S. Rudner and Netanel H. Lindner, “Band structure engineering and non-equilibrium dynamics in Floquet topological insulators,” Nature Reviews Physics 2, 229–244 (2020).
- Oka and Kitamura (2019) Takashi Oka and Sota Kitamura, “Floquet Engineering of Quantum Materials,” Annual Review of Condensed Matter Physics 10, 387–408 (2019).
- Oka and Aoki (2009) Takashi Oka and Hideo Aoki, “Photovoltaic Hall effect in graphene,” Physical Review B 79, 081406 (2009).
- Usaj et al. (2014) Gonzalo Usaj, P. M. Perez-Piskunow, L. E. F. Foa Torres, and C. A. Balseiro, “Irradiated graphene as a tunable Floquet topological insulator,” Physical Review B 90, 115423 (2014).
- Sentef et al. (2015) M.A. Sentef, M. Claassen, A.F. Kemper, B. Moritz, T. Oka, J.K. Freericks, and T.P. Devereaux, “Theory of Floquet band formation and local pseudospin textures in pump-probe photoemission of graphene,” Nature Communications 6, 7047 (2015).
- Schüler et al. (2020) Michael Schüler, Umberto De Giovannini, Hannes Hübener, Angel Rubio, Michael A. Sentef, Thomas P. Devereaux, and Philipp Werner, “How circular dichroism in time- and angle-resolved photoemission can be used to spectroscopically detect transient topological states in graphene,” Physical Review X 10, 041013 (2020).
- McIver et al. (2020) J. W. McIver, B. Schulte, F. U. Stein, T. Matsuyama, G. Jotzu, G. Meier, and A. Cavalleri, “Light-induced anomalous Hall effect in graphene,” Nature Physics 16, 38–41 (2020).
- Aeschlimann et al. (2021) Sven Aeschlimann, Shunsuke A. Sato, Razvan Krause, Mariana Chávez-Cervantes, Umberto De Giovannini, Hannes Hübener, Stiven Forti, Camilla Coletti, Kerstin Hanff, Kai Rossnagel, Angel Rubio, and Isabella Gierz, “Survival of Floquet–Bloch states in the presence of scattering,” Nano Letters 21, 5028–5035 (2021).
- Baggesen and Madsen (2008) Jan Conrad Baggesen and Lars Bojer Madsen, “Theory for time-resolved measurements of laser-induced electron emission from metal surfaces,” Physical Review A 78, 032903 (2008).
- Saathoff et al. (2008) G. Saathoff, L. Miaja-Avila, M. Aeschlimann, M. M. Murnane, and H. C. Kapteyn, “Laser-assisted photoemission from surfaces,” Physical Review A 77, 022903 (2008).
- Mahmood et al. (2016) Fahad Mahmood, Ching-Kit Chan, Zhanybek Alpichshev, Dillon Gardner, Young Lee, Patrick A. Lee, and Nuh Gedik, “Selective scattering between Floquet-Bloch and Volkov states in a topological insulator,” Nat Phys 12, 306–310 (2016).
- Park (2014) Sang Tae Park, “Interference in Floquet-Volkov transitions,” Physical Review A 90, 013420 (2014).
- Hübener et al. (2017) Hannes Hübener, Michael A. Sentef, Umberto De Giovannini, Alexander F. Kemper, and Angel Rubio, “Creating stable Floquet–Weyl semimetals by laser-driving of 3D Dirac materials,” Nature Communications 8, 13940 (2017).
- Lindner et al. (2011) Netanel H. Lindner, Gil Refael, and Victor Galitski, “Floquet topological insulator in semiconductor quantum wells,” Nature Physics 7, 490 (2011).
- Claassen et al. (2016) Martin Claassen, Chunjing Jia, Brian Moritz, and Thomas P. Devereaux, “All-optical materials design of chiral edge modes in transition-metal dichalcogenides,” Nature Communications 7, 13074 (2016).
- Zhang et al. (2016) Xiao-Xiao Zhang, Tze Tzen Ong, and Naoto Nagaosa, “Theory of photoinduced Floquet Weyl semimetal phases,” Phys. Rev. B 94, 235137 (2016).
- Yan and Wang (2016) Zhongbo Yan and Zhong Wang, “Tunable Weyl points in periodically driven nodal line semimetals,” Physical Review Letters 117, 087402 (2016).
- Liu et al. (2018) Hang Liu, Jia-Tao Sun, Cai Cheng, Feng Liu, and Sheng Meng, “Photoinduced nonequilibrium topological states in strained black phosphorus,” Physical Review Letters 120, 237403 (2018).
- Rodriguez-Vega et al. (2021) Martin Rodriguez-Vega, Michael Vogl, and Gregory A. Fiete, “Low-frequency and Moiré–Floquet engineering: A review,” Annals of Physics 435, 168434 (2021).
- Topp et al. (2019) Gabriel E. Topp, Gregor Jotzu, James W. McIver, Lede Xian, Angel Rubio, and Michael A. Sentef, “Topological Floquet engineering of twisted bilayer graphene,” Physical Review Research 1, 023031 (2019).
- Katz et al. (2020) Or Katz, Gil Refael, and Netanel H. Lindner, “Optically induced flat bands in twisted bilayer graphene,” Physical Review B 102, 155123 (2020).
- Kennes et al. (2021) Dante M. Kennes, Martin Claassen, Lede Xian, Antoine Georges, Andrew J. Millis, James Hone, Cory R. Dean, D. N. Basov, Abhay N. Pasupathy, and Angel Rubio, “Moiré heterostructures as a condensed-matter quantum simulator,” Nature Physics 17, 155–163 (2021).
- Chan et al. (2023) Y.-H. Chan, Diana Y. Qiu, Felipe H. da Jornada, and Steven G. Louie, “Giant self-driven exciton-Floquet signatures in time-resolved photoemission spectroscopy of MoS2 from time-dependent GW approach,” Proceedings of the National Academy of Sciences 120, e2301957120 (2023).
- Haldane (1988) F. D. M. Haldane, “Model for a quantum hall effect without landau levels: Condensed-matter realization of the "parity anomaly",” Phys. Rev. Lett. 61, 2015 (1988).
- Shirley (1965) Jon H. Shirley, “Solution of the Schrödinger equation with a Hamiltonian periodic in time,” Physical Review 138, B979–B987 (1965).
- Jotzu et al. (2014) Gregor Jotzu, Michael Messer, Rémi Desbuquois, Martin Lebrat, Thomas Uehlinger, Daniel Greif, and Tilman Esslinger, “Experimental realization of the topological Haldane model with ultracold fermions,” Nature 515, 237–240 (2014).
- Rechtsman et al. (2013) Mikael C. Rechtsman, Julia M. Zeuner, Yonatan Plotnik, Yaakov Lumer, Daniel Podolsky, Felix Dreisow, Stefan Nolte, Mordechai Segev, and Alexander Szameit, “Photonic Floquet topological insulators,” Nature 496, 196–200 (2013).
- Sato et al. (2019) S. A. Sato, J. W. McIver, M. Nuske, P. Tang, G. Jotzu, B. Schulte, H. Hübener, U. De Giovannini, L. Mathey, M. A. Sentef, A. Cavalleri, and A. Rubio, “Microscopic theory for the light-induced anomalous Hall effect in graphene,” Physical Review B 99, 214302 (2019).
- Nuske et al. (2020) M. Nuske, L. Broers, B. Schulte, G. Jotzu, S. A. Sato, A. Cavalleri, A. Rubio, J. W. McIver, and L. Mathey, “Floquet dynamics in light-driven solids,” Physical Review Research 2, 043408 (2020).
- Wang et al. (2013) Y. H. Wang, H. Steinberg, P. Jarillo-Herrero, and N. Gedik, “Observation of Floquet-Bloch states on the surface of a topological insulator,” Science 342, 453–457 (2013).
- Sie et al. (2014) Edbert J. Sie, James W. McIver, Yi-Hsien Lee, Liang Fu, Jing Kong, and Nuh Gedik, “Valley-selective optical Stark effect in monolayer WS2,” Nature Materials 14, 290 (2014).
- Reutzel et al. (2020) Marcel Reutzel, Andi Li, Zehua Wang, and Hrvoje Petek, “Coherent multidimensional photoelectron spectroscopy of ultrafast quasiparticle dressing by light,” Nature Communications 11, 2230 (2020).
- Park et al. (2022) Sein Park, Wonjun Lee, Seong Jang, Yong-Bin Choi, Jinho Park, Woochan Jung, Kenji Watanabe, Takashi Taniguchi, Gil Young Cho, and Gil-Ho Lee, “Steady Floquet–Andreev states in graphene Josephson junctions,” Nature 603, 421–426 (2022).
- Zhou et al. (2023a) Shaohua Zhou, Changhua Bao, Benshu Fan, Hui Zhou, Qixuan Gao, Haoyuan Zhong, Tianyun Lin, Hang Liu, Pu Yu, Peizhe Tang, Sheng Meng, Wenhui Duan, and Shuyun Zhou, “Pseudospin-selective Floquet band engineering in black phosphorus,” Nature 614, 75–80 (2023a).
- Ito et al. (2023) S. Ito, M. Schüler, M. Meierhofer, S. Schlauderer, J. Freudenstein, J. Reimann, D. Afanasiev, K. A. Kokh, O. E. Tereshchenko, J. Güdde, M. A. Sentef, U. Höfer, and R. Huber, “Build-up and dephasing of Floquet–Bloch bands on subcycle timescales,” Nature 616, 696–701 (2023).
- Kobayashi et al. (2023) Yuki Kobayashi, Christian Heide, Amalya C. Johnson, Vishal Tiwari, Fang Liu, David A. Reis, Tony F. Heinz, and Shambhu Ghimire, “Floquet engineering of strongly driven excitons in monolayer tungsten disulfide,” Nature Physics 19, 171–176 (2023).
- Zhou et al. (2023b) Shaohua Zhou, Changhua Bao, Benshu Fan, Fei Wang, Haoyuan Zhong, Hongyun Zhang, Peizhe Tang, Wenhui Duan, and Shuyun Zhou, “Floquet engineering of black phosphorus upon below-gap pumping,” Physical Review Letters 131, 116401 (2023b).
- Heide et al. (2021) Christian Heide, Timo Eckstein, Tobias Boolakee, Constanze Gerner, Heiko B. Weber, Ignacio Franco, and Peter Hommelhoff, “Electronic coherence and coherent dephasing in the optical control of electrons in graphene,” Nano Letters 21, 9403–9409 (2021).
- Sato et al. (2020) S. A. Sato, U. De Giovannini, S. Aeschlimann, I. Gierz, H. Hübener, and A. Rubio, “Floquet states in dissipative open quantum systems,” Journal of Physics B: Atomic, Molecular and Optical Physics 53, 225601 (2020).
- Broers and Mathey (2022) Lukas Broers and Ludwig Mathey, “Detecting light-induced Floquet band gaps of graphene via trARPES,” Physical Review Research 4, 013057 (2022).
- Medjanik et al. (2017) K. Medjanik, O. Fedchenko, S. Chernov, D. Kutnyakhov, M. Ellguth, A. Oelsner, B. Schönhense, T. R. F. Peixoto, P. Lutz, C.-H. Min, F. Reinert, S. Däster, Y. Acremann, J. Viefhaus, W. Wurth, H. J. Elmers, and G. Schönhense, “Direct 3D mapping of the Fermi surface and Fermi velocity,” Nature Materials 16, 615–621 (2017).
- Keunecke et al. (2020a) Marius Keunecke, Christina Möller, David Schmitt, Hendrik Nolte, G. S. Matthijs Jansen, Marcel Reutzel, Marie Gutberlet, Gyula Halasi, Daniel Steil, Sabine Steil, and Stefan Mathias, “Time-resolved momentum microscopy with a 1 MHz high-harmonic extreme ultraviolet beamline,” Review of Scientific Instruments 91, 063905 (2020a).
- Keunecke et al. (2020b) Marius Keunecke, Marcel Reutzel, David Schmitt, Alexander Osterkorn, Tridev A. Mishra, Christina Möller, Wiebke Bennecke, G. S. Matthijs Jansen, Daniel Steil, Salvatore R. Manmana, Sabine Steil, Stefan Kehrein, and Stefan Mathias, “Electromagnetic dressing of the electron energy spectrum of Au(111) at high momenta,” Physical Review B 102, 161403 (2020b).
- Schmitt et al. (2022) David Schmitt, Jan Philipp Bange, Wiebke Bennecke, AbdulAziz AlMutairi, Giuseppe Meneghini, Kenji Watanabe, Takashi Taniguchi, Daniel Steil, D. Russell Luke, R. Thomas Weitz, Sabine Steil, G. S. Matthijs Jansen, Samuel Brem, Ermin Malic, Stephan Hofmann, Marcel Reutzel, and Stefan Mathias, “Formation of moiré interlayer excitons in space and time,” Nature 608, 499–503 (2022).
- Momeni Pakdehi et al. (2018) D. Momeni Pakdehi, J. Aprojanz, A. Sinterhauf, K. Pierz, M. Kruskopf, P. Willke, J. Baringhaus, J. P. Stöckmann, G. A. Traeger, F. Hohls, C. Tegenkamp, M. Wenderoth, F. J. Ahlers, and H. W. Schumacher, “Minimum resistance anisotropy of epitaxial graphene on SiC,” ACS Applied Materials & Interfaces 10, 6039–6045 (2018).
- Düvel et al. (2022) Marten Düvel, Marco Merboldt, Jan Philipp Bange, Hannah Strauch, Michael Stellbrink, Klaus Pierz, Hans Werner Schumacher, Davood Momeni, Daniel Steil, G. S. Matthijs Jansen, Sabine Steil, Dino Novko, Stefan Mathias, and Marcel Reutzel, “Far-from-equilibrium electron–phonon interactions in optically excited graphene,” Nano Letters 22, 4897–4904 (2022).
- Shirley et al. (1995) Eric L. Shirley, L. J. Terminello, A. Santoni, and F. J. Himpsel, “Brillouin-zone-selection effects in graphite photoelectron angular distributions,” Physical Review B 51, 13614–13622 (1995).
- Xian et al. (2019) R Patrick Xian, Laurenz Rettig, and Ralph Ernstorfer, “Symmetry-guided nonrigid registration: The case for distortion correction in multidimensional photoemission spectroscopy,” Ultramicroscopy 202, 133–139 (2019).
- Bange et al. (2023) Jan Philipp Bange, Paul Werner, David Schmitt, Wiebke Bennecke, Giuseppe Meneghini, AbdulAziz AlMutairi, Marco Merboldt, Kenji Watanabe, Takashi Taniguchi, Sabine Steil, Daniel Steil, R. Thomas Weitz, Stephan Hofmann, G. S. Matthijs Jansen, Samuel Brem, Ermin Malic, Marcel Reutzel, and Stefan Mathias, “Ultrafast dynamics of bright and dark excitons in monolayer WSe2 and heterobilayer WSe2/MoS2,” 2D Materials 10, 035039 (2023).
- Bennecke et al. (2024) Wiebke Bennecke, Andreas Windischbacher, David Schmitt, Jan Philipp Bange, Ralf Hemm, Christian S. Kern, Gabriele D’Avino, Xavier Blase, Daniel Steil, Sabine Steil, Martin Aeschlimann, Benjamin Stadtmüller, Marcel Reutzel, Peter Puschnig, G. S. Matthijs Jansen, and Stefan Mathias, “Disentangling the multiorbital contributions of excitons by photoemission exciton tomography,” Nature Communications 15, 1804 (2024).
- Bange et al. (2024) Jan Philipp Bange, David Schmitt, Wiebke Bennecke, Giuseppe Meneghini, AbdulAziz AlMutairi, Kenji Watanabe, Takashi Taniguchi, Daniel Steil, Sabine Steil, R. Thomas Weitz, G. S. Matthijs Jansen, Stephan Hofmann, Samuel Brem, Ermin Malic, Marcel Reutzel, and Stefan Mathias, “Probing electron-hole coulomb correlations in the exciton landscape of a twisted semiconductor heterostructure,” Science Advances 10, eadi1323 (2024).
- Madsen (2005) Lars Bojer Madsen, “Strong-field approximation in laser-assisted dynamics,” American journal of physics 73, 57–62 (2005).
- Neppl et al. (2015) Stefan Neppl, Ralph Ernstorfer, Adrian L Cavalieri, C Lemell, G Wachter, Elisabeth Magerl, EM Bothschafter, Michael Jobst, Michael Hofstetter, Ulf Kleineberg, et al., “Direct observation of electron propagation and dielectric screening on the atomic length scale,” Nature 517, 342–346 (2015).
- Murakami and Schüler (2022) Yuta Murakami and Michael Schüler, “Doping and gap size dependence of high-harmonic generation in graphene: Importance of consistent formulation of light-matter coupling,” Phys. Rev. B 106, 035204 (2022).
- Schüler and Sentef (2021) Michael Schüler and Michael A. Sentef, “Theory of subcycle time-resolved photoemission: Application to terahertz photodressing in graphene,” Journal of Electron Spectroscopy and Related Phenomena 253, 1–12 (2021), arXiv:2103.15900 .