Towards Universal Performance Modeling for Machine Learning Training on Multi-GPU Platforms
Abstract
Characterizing and predicting the training performance of modern machine learning (ML) workloads on compute systems with compute and communication spread between CPUs, GPUs, and network devices is not only the key to optimization and planning but also a complex goal to achieve. The primary challenges include the complexity of synchronization and load balancing between CPUs and GPUs, the variance in input data distribution, and the use of different communication devices and topologies (e.g., NVLink, PCIe, network cards) that connect multiple compute devices, coupled with the desire for flexible training configurations. Built on top of our prior work for single-GPU platforms, we address these challenges and enable multi-GPU performance modeling by incorporating (1) data-distribution-aware performance models for embedding table lookup, and (2) data movement prediction of communication collectives, into our upgraded performance modeling pipeline equipped with inter-and intra-rank synchronization for ML workloads trained on multi-GPU platforms. Beyond accurately predicting the per-iteration training time of DLRM models with random configurations with a geomean error of 5.21% on two multi-GPU platforms, our prediction pipeline generalizes well to other types of ML workloads, such as Transformer-based NLP models with a geomean error of 3.00%. Moreover, even without actually running ML workloads like DLRMs on the hardware, it is capable of generating insights such as quickly selecting the fastest embedding table sharding configuration (with a success rate of 85%).
Index Terms:
Performance modeling, multi-GPU, DLRM, NLP, machine learning, model trainingI Introduction
Modern machine learning (ML) workloads tend to grow in both size and computation, usually beyond the capability of one single GPU to host and train. Platforms with multiple compute devices such as GPUs, therefore, play a essential role in undertaking training jobs for these workloads. Modern industrial recommendation models, such as DLRM [1], consist of embedding tables of hundreds of gigabytes and are trained in a distributed way on hierarchical compute systems, e.g., 16 nodes 8 GPUs, as an advanced software-hardware co-designed system [2]. In the area of large language models (LLM), the rapidly growing number of model parameters requires an equally rapid increase in the number of compute devices used to train them. Examples include GPT3 [3] (2020, 175B (parameter count, same below), 1024 NVIDIA V100 GPUs (estimated)) Megatron-Turing NLG [4] (2022, 530B, 2240 80-GB NVIDIA A100 GPUs), PaLM [5] (2022, 540B, 6144 Google TPU v4), OPT-175B [6] (2022, 175B, 992 80-GB NVIDIA A100 GPUs), and LLaMA [7] (2023, 65B, 2048 80-GB NVIDIA A100 GPUs). For such daunting multi-GPU training jobs, ML practitioners are interested in not only training performance (e.g., prediction of iteration time, query-per-sec (QPS), FLOPS, etc.) but also how to speed up training and use the hardware most efficiently. Characterizing the performance behavior of such multi-GPU training jobs is the key to identifying and optimizing performance bottlenecks, and will subsequently help ML practitioners save development time and budget, improve ML model quality provided to users, and benefit the environment by avoiding excessive emissions of CO2.
However, achieving the above goals is particularly challenging in the multi-GPU platform space for two primary reasons:
-
•
Communication collectives, like all-to-all and all-reduce across various network media (e.g., NVLink, PCIe, network cards) and topologies that connect multiple compute devices, are essential operations in multi-GPU training and commonly the performance hotspot. The performance modeling of these operations is missing in previous single-GPU and compute-op-focused work [8, 9, 10, 11, 12, 13, 14].
-
•
More importantly, the synchronization behaviors of multiple GPU streams on the same device or across multiple devices are complicated. Previous works have only inadequate or premature modeling for these behaviors, so they are not sufficient to account for all the GPU idle time on each rank caused by data dependencies and multi-GPU synchronization, and as a result, cannot accurately model workload execution time.
Also, even in single-GPU setups, the limitations of the performance modeling of certain operators (ops) in prior work inhibit us from extending it to a broader range of workloads. As an important example, embedding lookups in real-world DLRM pipelines have unknown input distributions and loads across batches and devices, resulting in unpredictable memory access patterns and thus difficulty in predicting their performance. Existing embedding lookup performance models are rigid and only able to cover limited problem sizes. Besides, extending the performance model to other workloads such as natural language processing (NLP) models requires the support of extra element-wise or minor ops.
To summarize, the performance modeling problems of communication collectives, multi-GPU stream synchronization, embedding lookups with randomly distributed input data, and additional minor ops such as layer_norm and dropout remained unsolved until we address them in this paper. We extend our previous performance-modeling work [14] and inherit its critical-path-based execution trace simulation method to model the training performance of deep learning recommendation models (DLRM) and natural language processing (NLP) workloads on multi-GPU platforms. The novel and major contributions include:
-
•
(Section III-C) Added performance models for communication operations (all-to-all and all-reduce) by improving a basic heuristic model with straightforward and efficient sigmoid curve fitting.
-
•
(Section III-D) An enhanced critical-path-based end-to-end (E2E) performance modeling algorithm.
-
•
(Section III-E) Improved embedding-table-lookup performance modeling with flexible lookup numbers and patterns (i.e., input data distribution) through an ML-based approach.
-
•
(Section III-F) Supported extra minor ops such as layer_norm and dropout for NLP models.
We claim that both inter- and intra-rank synchronizations are the keys to accurately modeling ML workloads training performance on multi-GPU, or even more broadly, all types of workloads running on multi-heterogeneous-device platforms. Therefore, the second item above is the most critical contribution of this paper. Our performance model obtains 5.21% and 3.00% geomean prediction errors on predicting the per-iteration performance of randomly generated industrial-scale DLRM workloads and Transformer-based NLP models based on BERT [15], GPT2 [16], and XLNet [17], respectively, on two different multi-GPU platforms. In addition, in a use case of choosing a (DLRM) embedding table sharding configuration without running the workloads, our performance model achieves an 85% success rate in selecting either the fastest config or predicting the execution time with less than 10% error, showcasing our performance model’s ability to generate insights for multi-GPU training optimization.
II Related Works
II-A Performance Modeling for Both Single-Device and Distributed Training
There is abundant prior art in predicting the execution time of per-batch training and/or inference of ML workloads on a single GPU. A majority of them [8, 9, 10, 11, 12, 13, 14] focus on convolutional neural networks (CNNs), while some also cover NLP [12] and recommendation models like DLRM [14]. These works developed methodologies for accurately modeling performance on the op/kernel levels, though in general did not address the challenges of multi-GPU or distributed training.
Early performance models for distributed training are mostly analytical and consider computation and communication separately. Yan et al. [18] studied data and model parallelism of CNNs on CPU clusters and modeled their performance and scalability. Oyama et al. [19] proposed a performance model for GPU-equipped supercomputers, which predicts per-batch execution time with low error based on statistics of mini-batch size and staleness for an asynchronous SGD algorithm. It also provides some generality in terms of precision and communication standards. As a use case, both approaches claimed to be able to search for the best system configurations for distributed training of CNNs. Qi et al. [20] introduced PALEO for per-layer CNN execution time estimation, and demonstrated its ability to accurately model CNN training performance at scale on cloud clusters.
However, these prior successes do not extend well to modern ML workloads. Today, the implementation of ML workloads as well as the environment and setup of training clusters have evolved significantly and thus outdated features such as sub-batch size (fewer than 16 [19] vs. considerably larger sizes in modern settings, e.g., 2048 to 65536), model workload size and diversity, and hardware settings. Prior work either has a lack of support on GPUs [18], or a complex methodology that inhibits generalizing to other pipelines [19]. As decentralized distributed training with multiple GPUs is increasingly preferred to parameter servers, the problem of modeling the communication among GPUs and subsequently accounting for interaction and overlap between GPU streams must also be addressed for accurate prediction. This rules out per-layer methods such as Qi et al. [20].
Wang et al. [21] implied a possible speed-of-light (SOL) model that the total execution time is the maximum among the time of data, computation, and communication, assuming these operations are perfectly overlapped. Inspired by this, and thanks to the detailed information we obtain from the execution trace [22], we further predict the training performance in general when these operations are not perfectly overlapped. Yang et al. [23] proposed the computational-graph simulation-based PerfEstimator running on one single device for distributed training of CV models, with computation-communication overlap estimated by an analytical scaling factor. In our methods, this overlap is estimated by critical-path-based methods that is less error-prone especially when workloads across devices are imbalanced.
II-B Model Parallelism and Sharding
As modern ML workloads have grown rapidly in size, exploiting model parallelism has become a critical tool in scaling up ML workloads. Lepikhin et al. [24] summarize the main challenges of model parallelism, which include: 1) device underutilization due to the sequential dependency of the network and gradient-based optimization; 2) superlinear compute cost vs. model size; 3) poor infra scalability; 4) non-trivial implementation of partitioning strategies. As an example of one increasingly common use of model parallelism, modern recommendation models such as industrial DLRMs often have hundreds of embedding lookup tables with up to tens of millions of rows, which are too large to be stored on a single GPU and thus must be sharded and dispatched to multiple GPUs. Load-balancing these sharded tables (to achieve uniform access latency and memory usage) thus becomes a critical problem, one which has been addressed by previous researchers. Lui et al. [25] first applied baseline (e.g., dimension-based, row-based, and size-based) heuristics to shard embedding tables in DLRMs. Sethi et al. proposed RecShard [26] that uses integer linear programming (ILP) to optimize the sharding problem. Zha et al. further improved the sharding efficiency and balance by addressing the problem with reinforcement learning in AutoShard [27] and Dreamshard [28]. In our paper, we demonstrate in a case study that our performance model is able to evaluate the performance of multiple sharding algorithms and quickly select the one that leads to the best E2E execution time for DLRM training. Notice that we are not proposing a smart sharding algorithm here as these previous works did.
III Methodology
Our previous work on single-GPU performance modeling [14] is both modular and extendable. We leverage and extend it with a focus on the performance modeling on single-node multi-GPU platforms. The reason why this makes sense is because kernel performance models are reused and shared across different ML workloads as inputs, while the E2E time prediction by simulating the execution trace of the target workload and traversing ops in it is dictated by the same critical-path-based algorithm that is both model-architecture-agnostic and platform-agnostic. In this current work, we extend this E2E performance model for new ML workloads and multi-GPU platforms by both adding kernel performance models for dominating ops/kernels of these new workloads and addressing multi-GPU execution in the E2E simulation.
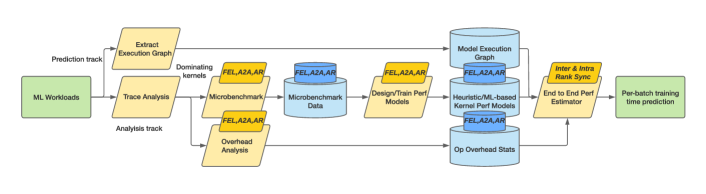
Figure 1 depicts an overview of our prediction pipeline. It inherits its main modules and procedures, and reuses both all kernel performance models (for GEMM, memcpy, transpose, etc) and the overhead estimator from the original pipeline. The logic of the prediction pipeline remains unchanged. To accumulate system assets (blue cylinders in Figure 1), we profile ML workloads written with PyTorch, extract execution traces, and analyze traces for dominating ops. Then, we collect microbenchmark data for target kernels/ops, design/train and verify performance models using this data, and extract overhead statistics for these kernels/ops as well. In the prediction phase, the pipeline takes the execution traces of a workload as the input, simulates the execution by traversing the ops in the trace, and predicts the per-iteration training time of the workload with the system assets within several seconds. We focus on DLRM and Transformer-based NLP workloads in this work, but we expect our techniques can seamlessly extend and apply to other ML workloads (details discussed in Section V-B).
III-A Dataset Exploration
The open-source DLRM dataset [29] contains synthetic embedding lookup data that resembles the memory-access reuse pattern of Meta’s production data. The 2021 data includes a batch of 65536 samples embedding lookup data of 856 tables, while the 2022 data includes a batch of 131072 samples of 788 tables. Due to the unpredictable lookup pattern in production data, the pooling factors (average number of lookups per data sample, denoted with ) vary significantly across all tables. This is very different from what has been studied in previous work [30, 14], which considers as a fixed value across data batches and even tables in the same workload. Our exploratory analysis (Figure 3) shows that average values of tables in the dataset tend to concentrate in the range of , especially , while there are still a number of tables with average value spreading to a few hundred. We define tables with an average equal to greater than 20 as “heavy tables”. As shown in Figure 3, there are 103 and 166 heavy tables in the 2021 and 2022 data respectively.

III-B Multi-GPU Training Benchmark and Analysis
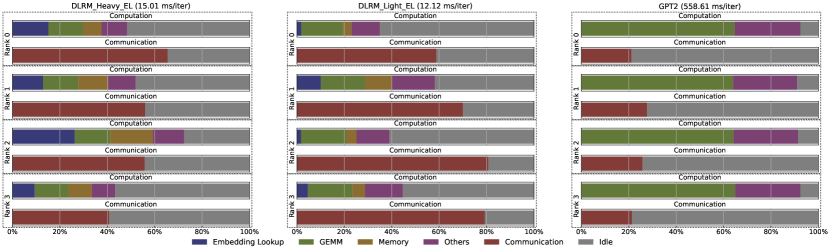
We first benchmark several ML workloads that will be further analyzed in later sections to understand the behavior of multi-GPU training performance. Figure 2 shows the per-GPU-stream execution time breakdown of three workloads: DLRM_Heavy_EL with a batch size of 4096 (Task_14 in Section IV-B1, involving heavy embedding tables only), DLRM_Light_EL with a batch size of 4096 (Task_5 in Section IV-B1, involving random embedding tables), and GPT2 with a batch size of 64 on each rank of the 4xGV100 platform (details shown in Section IV). The runtime is contributed by a few groups of kernels and types: embedding lookup (forward and backward), GEMM (forward and backward), memory operations (concat, copy, transpose, etc), others (normalizations, elementwise, etc), communication (all-to-all and all-reduce), and idle time. We summarize the following insights from our benchmarking:
-
•
Communication operations can be but are not always a performance bottleneck. It is obvious that communication operations dominate the two DLRM models. This is mainly because in addition to the normal all-reduce caused by accumulating gradients in the backward pass, training the embedding lookup module in DLRM with model-parallelism introduces the all-to-all operations for merging data with that from the bottom and top multilayer perceptron (MLP) modules trained with data parallelism. In most of the stream pairs shown here, except for DLRM_Heavy_EL’s rank 2, the communication stream has a longer GPU active time than that of the computation stream, which means it can never be fully overlapped by the computation and thus similar workloads tend to thrash the communication network of the interconnected multi-GPU platform. In contrast, GPT2 is quite compute-dominated; all-reduce time is minor and can theoretically be fully overlapped.
-
•
Load balance substantially varies across the workloads. DLRM models experience load imbalance across ranks due to the existence of embedding lookup tables with various compute and communication loads. Notice that instead of the forward and backward computation of embedding lookup itself, it is in fact the all-to-all it introduces that dominates, especially when the embedding lookup is light. Examples such as DLRM_Light_EL’s rank 3 and 4 show that communication can occupy up to 80% of the execution time, in which case GPU computation resources are wasted by sitting idle. In contrast, we see an almost-perfect load balance for GPT2 as it is purely DDP-trained and the load is evenly distributed.
-
•
The significance of GPU stream idle time is way more than “being non-negligible”. What we see in single-GPU training is that idle time is contributed mostly by CPU op calls and overheads that block the scheduling of GPU kernels; data dependencies play a less important role given there is only one stream. On the contrary, in the case of multi-GPU training data dependencies of ops lead to streams that wait on each other and thus dominate waiting times. This time cannot be predicted in the same way (i.e., statistically) as the previous work such as Lin et al. [14] did. As we show later, the kernel execution time on each stream varies and thus the overlap of these kernels on different GPU streams is complicated and case-by-case. Therefore, to understand and simulate how GPU streams interact and synchronize with each other is the key to accurately predicting the per-iteration time of training.
-
•
As we support more kinds of ML workloads such as (Transformer-based) NLP models, we will see an increasing number of ops that must be modeled accurately to get an accurate result. We see that “other” ops (layer-norm, dropout, gelu, tanh, etc.) contribute to more than 20% of execution time on GPT2, although each one of them only contributes a tiny amount of time every time it is executed. This might not be a surprise, given the performance of Transformer-based models has been profoundly studied these years. Techniques such as advanced layer fusion may be able to effectively optimize and reduce their execution time, but that is beyond the scope of this paper. Under our experiment settings and from the performance-modeling point of view, this observation basically means more ops from this category should be supported than the previous work did.
The lessons from the above two subsections guide the direction of our research, which includes the following novel components or improvements of our performance model:
-
•
Communication operations like all-to-all and all-reduce;
-
•
Advanced E2E performance modeling for multi-GPU training.
-
•
Embedding table lookup with flexible lookup numbers and patterns (input data distribution);
-
•
Additional ops in (Transformer-based) NLP models, such as layer-norm, dropout, gelu, and tanh, etc;
III-C Communication Collective Performance Modeling
All-to-all and all-reduce are two communication collectives commonly seen in multi-GPU training of recommendation workloads and contribute significantly to the per-iteration time of multi-GPU training. The difficulty of modeling the performance of these two ops is that their performance highly depends on how multiple devices are connected (e.g., network connection pattern and medium such as NVLink and PCIe), while this configuration differs from platform to platform.
We devise a simple way to model the performance of all-to-all and all-reduce based on the message passing cost model defined by Grama et al. [31]:
| (1) |
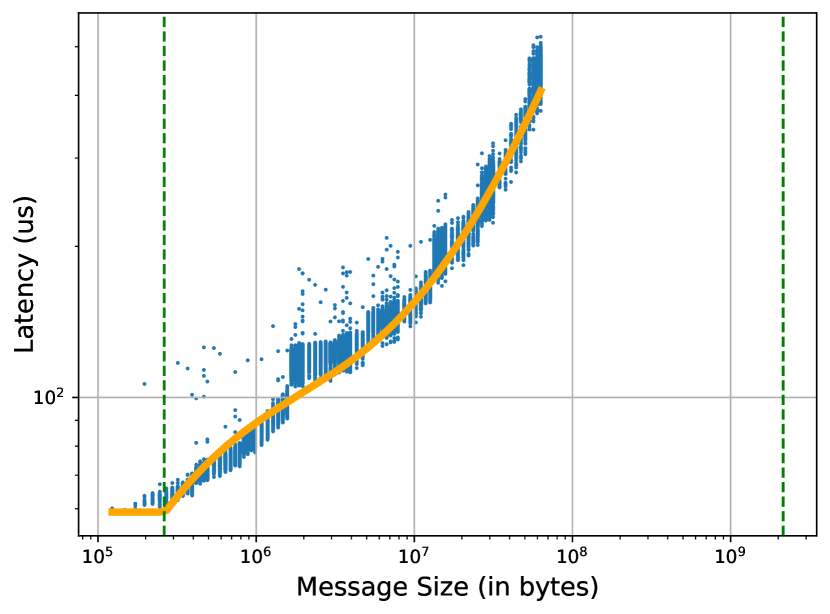
Distilled from a comprehensive study on multi-GPU communication on platforms by Li et al. [32] and a prior performance model work (LogCA [33]), we make a critical observation that eventually leads to the improvement of the above model:
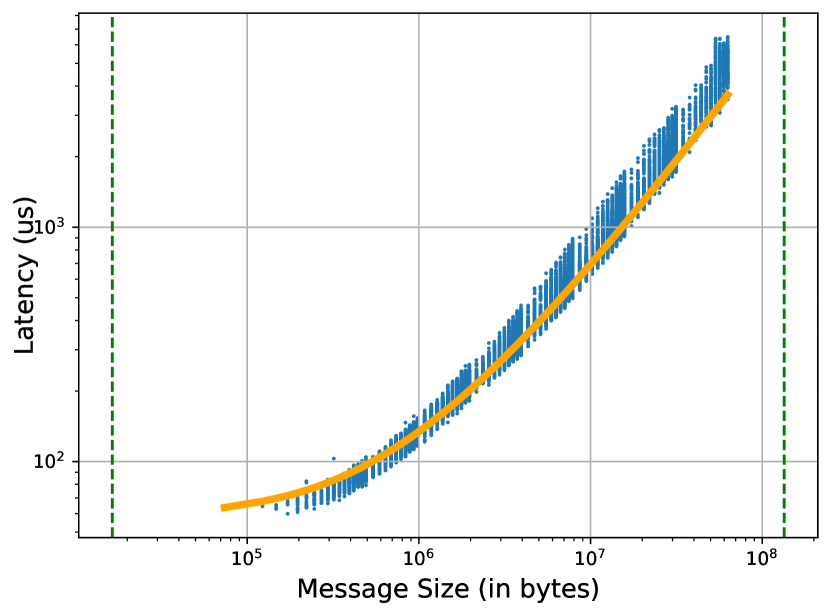
Regardless of the ops, network connection pattern, and network medium, as shown in Figure 4 the curve of message size versus bandwidth can always be divided into three regions as the message size increases: 1) linear bandwidth with constant latency; 2) S-shape bandwidth curve with non-linear latency; 3) constant (saturated) bandwidth with linear latency.
Therefore, we model the data movement latency as a piece-wise function of message size :
| (5) |
where
| (6) |
and include 4 parameters , , , and that define the function
| (7) |
This method only involves 8 parameters for each op (4 for sigmoid, 2 for region boundaries, 1 for startup latency, and 1 for maximum bandwidth). It is fast and simple for both curve fitting and prediction; it is also topology-agnostic and thus able to generalize to any communication pattern. We utilize the PARAM benchmark [34] and generate microbenchmark data for curve-fitting of both ops with equal message size starting from 4 bytes on each device and doubling it until exceeding the device memory. Test data is generated with random per-device message size for all-to-all and equal per-device message size for all-reduce. We calculate the input message size to the performance model as “the maximum of (the maximum of sent/received message size per device) across all devices”.
III-D Multi-GPU E2E Performance Modeling
As we mentioned, the main difference between single-GPU and multi-GPU performance modeling is that in multi-GPU scenarios, communication collectives like all-to-all and all-reduce simultaneously execute on multiple devices and trigger synchronizations and waiting across ranks and streams. This additional behavior significantly impacts runtime; this subsection describes how we simulate synchronizations and waiting during the execution analysis.
Before we dive deep into the multi-GPU E2E performance modeling algorithm, we need to first understand two types of synchronization in distributed training. They are:
-
•
inter-rank synchronization that occurs at the termination of a communication collective kernel, and
-
•
intra-rank or inter-stream synchronization that happens at the launch of a compute/memory kernel that depends on the last communication kernel.
These two types of synchronization are depicted in Figure 5. We expect that communication kernels’ launch time is different across ranks because of the different latency each rank takes to reach these ops due to unbalanced prior loads, such as data movement and computation. However, since communication kernels are synchronous, theoretically they must terminate at the same moment, while in reality they also terminate almost at the same time with negligible variance. This is the inter-rank synchronization, marked by the red dashed line in the plot. When it occurs, the time front of the communication stream on different ranks should be set to the same value during analysis. On the other hand, since the output data of the communication ops are used as inputs to certain successive ops, successive communication kernels, e.g., the last communication kernels on on both ranks in Figure 5, should be launched at least after the first dependent kernel of the previous communication kernel (marked in blue dashed lines) rather than right after the previous communication kernel. This is called intra-rank/inter-stream synchronization. To reflect it, we set the communication stream time front to the same value as the launch time of the first dependent kernel.
We claim that both inter-rank and intra-rank synchronizations are the keys to accurately modeling ML workloads training performance on multi-GPU, or even more broadly, all types of workloads running on multi-heterogeneous-device platforms. This is because the best modeling method without them is to sum the kernel time per GPU stream and take the maximum as the E2E prediction result. It can possibly work for a few workloads that are completely dominated by one certain type of stream, e.g., GPT2 being dominated by the compute stream as shown above. However, in most cases, this will miss a large amount of GPU idle time (e.g., the gap between the red and blue lines in Figure 5) created by data dependencies and other possible waiting conditions during the execution, which will result in a significant and unacceptable underestimation of execution time, i.e., up to 60% as we show later in Section IV-B1.
To take these synchronizations into consideration, we need the information on data dependency between ops in the ML model/workload, which is thankfully provided by the PyTorch execution graph (EG). We extend the critical-path-based algorithm proposed by Lin et al. [14] for single-GPU performance modeling to adapt to multi-GPU scenarios by incorporating inter-rank and intra-rank synchronizations, as shown in Algorithm 1. The new algorithm has a similar basic structure to the single-GPU version. Based on our observation, we assume two streams (one for compute and memory kernels and one for communication kernels) on each rank as that is the case for a vast majority of ML workloads. Instead of running one single process for training time prediction on a single GPU, the new algorithm runs processes in parallel, processing EGs and predicting execution time for ranks simultaneously (line 4). In addition to CPU time and GPU active time, we also track communication stream time and compute/memory stream time per process (line 6). At line 7, we also initialize a variable to keep track of the dependencies between compute/memory ops and the last communication op. During the traversal of EGs, we detect intra-rank synchronization when a dependent op of the last communication op or a new communication op is encountered (lines 12–15); when the current op is a communication op, we do inter-rank synchronization after processing all kernels of it (lines 29–31) and update for the next iteration (lines 36–38). At the end (lines 40–41), we calculate the local total time and GPU active time and do an all_gather operation across all ranks to collect their values, the maximums of which are returned as the predicted total time and GPU active time.
In our experiments to predict the multi-GPU training performance of DLRM models, we first generate 20 tasks with embedding tables randomly sampled from the DLRM open-source dataset. Among these 20 tasks, each of the 2021 and 2022 parts of the dataset contributes 5 heavy tasks (i.e., all sampled tables are heavy) and 5 normal tasks (i.e., tables can either be heavy or light). The total number of embedding tables per task is in the range of to resemble real-world workloads. To prevent out-of-memory errors, for each task we limit the total memory footprint of all embedding tables on each rank to be less than 80% of the GPU’s DRAM size. We set the embedding table sharder to size_lookup_greedy based, i.e., the cost of each table is estimated as . For each training iteration in the E2E test of each task, we randomly sample a mini-batch of data (with batch size set to 512/1024/2048/4096) corresponding to each table selected in the task from the dataset and distribute it to each rank based on the sharding scheme. The overhead statistics (mean latency, etc) of PyTorch ops are aggregated from all collected traces and shared by all tested workloads. The actual/predicted time is measured/calculated by averaging over 30 iterations. It takes about a day to run the benchmark and analysis for all 80 (20 workloads 4 batch sizes) tasks, while it takes less than 20 minutes to predict their performance.
III-E Embedding Lookup Kernel Modeling
The performance modeling of Embedding lookup (EL), an indispensable and commonly dominating [14] operator in many recommendation models including DLRM, is challenging in a few aspects. First, the dimensions and parameters of every single embedding table, specifically the number of embeddings (), the embedding dimension (), and the pooling factor () can all be different in real workloads and data. Second, the distribution of input data to each table varies considerably across each batch. Both these two factors significantly increase the difficulty of applying a heuristic-based performance model to the EL op, since it is almost impossible to accurately estimate the L2 cache hit rate and data movement and thus predict the latency of the op. Previous work such as Lin et al. [14] only considers modeling the performance of the case when , , and are all fixed for each table and data distribution is uniform. Therefore their solution is not sufficient to deal with real-world workloads and data.
To address this issue, we adopt a straightforward and clear expression of describing EL’s input data distribution using reuse factors (RF), as introduced by Meta’s open-source DLRM dataset [29]. Figure 6 shows an example of generating reuse factors (RF) from embedding lookup indices. First, the histogram of per-table index counts in a batch of input data is calculated ((a) to (b)). Then, the “histogram of histogram”, i.e., how many indices are accessed once, twice, thrice, etc., is calculated, which is thus the RF of this batch on a certain table ((b) to (c)). In practice, the bins for this step have sizes of exponents of 2, e.g., , , , , etc. Finally, the counts of every bin are normalized into the range of . In this way, the distribution of lookup indices is described as by what probability any row of a table is hit by a certain range of times, such as to times where and are both integers and . Meta’s DLRM dataset provides the RF of 17 bins for each data file, and we follow this convention in our experiments. The advantages of RF are its low overhead in terms of both processing time and parameter size. The calculation is relatively simple, and thus it is trivial to obtain RF values of each batch of input data on the fly before the training of a batch is actually started. Because each table has 17 RF values and the number of tables residing on each rank is usually limited, e.g., around 10, the total number of RF values for each batch of input data remains acceptable.
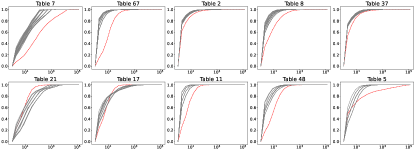
We adapt the cost model proposed by Zha et al. [28] for our use of real-time performance modeling of EL. Zha et al. create a multi-head MLP cost model to simultaneously predict the cost of the forward time, backward time, and communication time of a sharding scheme of EL as a whole on multiple devices. Our method is different from theirs in two aspects. 1) We handle these three constituent times separately in the granularity of ops to accommodate our robust E2E algorithm shown in Section III-D. This better simulates and models the actual execution since considering these three times as a whole misses the opportunity to explain the computation-communication overlaps (also described in Section III-D). 2) Instead of using RF values of each table, we use RF values of each batch for better prediction based on the reason stated in the last paragraph. We construct our MLP performance model resembling one of the heads in Zha et al.’s cost model and match those used for other kernels for convenient training and inference. To enable EL’s execution incorporating flexible , , and , in this work, we use a popular, efficient, and flexible batched-EL implementation provided by FBGEMM [35], an open-source high-performance kernel library for training and inference on both CPUs and GPUs. We first create a microbenchmark dataset by randomly sampling tables and batches (e.g., 10 tables out of 856, and a batch of 1024 lookups out of 65536) from the DLRM open-source dataset, and make sure that the size of the sampled tables in each sample will not exceed the DRAM memory size of the selected GPU. Note that while in the previous work, the cost model is trained with RF values of the whole dataset, it is improper to do so for real-time performance modeling because RF values tend to spread in a larger range. This fact is easy to understand intuitively. Suppose the batch size is small, the number of times each row in a table is hit tends to concentrate close to 0 because there are few indices in the batch. If we consider the whole dataset as a huge batch (e.g., size 65536 for the DLRM dataset we use), it is very likely that there are some rows in a table to be hit many times, such as 500 times, which could never appear with a small batch size such as 256. In a word, these two distributions are different (as shown in Figure 7), and thus the distribution of the whole dataset is not representative of a batch of data sampled from it. Therefore, we calculate the RF values of each batch and store them together with the execution time as part of the training data. Finally, we train and validate the performance models with the microbenchmark results as the input dataset that is split into a training set and a test set with a split factor of 0.8.
III-F Additional Ops Performance Modeling Support
To support Transformer-based NLP models, We also add kernel performance models for additional ops including layer_norm, dropout, and element-wise ops such as gelu and tanh. Using the same approach as the base model[14], we predict the latency of layer_norm and dropout with ML-based models trained with microbenchmark data of PyTorch ops and predict element-wise ops using the roofline model.
IV Evaluation and Analysis
We evaluate our kernel and E2E performance models with PyTorch v2.0 along with FBGEMM v0.4.1, CUDA 11.7, and Python 3.9. The performance model of FBGEMM’s embedding lookup kernel is evaluated on single NVIDIA GV100 and A100 (40 GB) GPUs, while that of both communication kernels and multi-GPU E2E are evaluated on two multi-GPU platforms, including 4xGV100 equipped with 48-core Intel(R) Xeon(R) Gold 6146 CPU @ 3.20 GHz, and 4xA100 equipped with GCP’s a2-highgpu-4g with 48-vCPU. The GPU communication topologies of these two platforms are shown in Figure 8. We use data sampled from the DLRM open-source dataset [29] as both microbenchmark data for FBGEMM embedding lookup kernel performance model training and verification, and input data for embedding lookup of the DLRM models in E2E tests. Multiple pieces (.pt files) of the dataset are merged for later use. The multi-GPU E2E evaluation in this work covers DLRM model training (code adapted from https://github.com/facebookresearch/dlrm) and fine-tuning of natural language processing (NLP) models such as BERT [15], GPT2 [16], and XLNet [17] (all model implementations called from HuggingFace’s Transformers library [36]). We use PyTorch’s DistributedDataParallel (DDP) in distributed training of ML workloads in our experiments for no GIL contention and less model replication and data movement overheads [37]. In addition, we manually insert a barrier at the beginning of each batch for better profiling of communication ops; we set the bucket size of gradient bucketing [38] to the default value (25) for all our experiments, as we observe that varying it only causes negligible change of performance.
| Kernel | 4xGV100 | 4xA100 | ||||
|---|---|---|---|---|---|---|
| GMAE | MAPE | std | GMAE | MAPE | std | |
| A2A | 6.28% | 9.42% | 7.76% | 5.25% | 7.14% | 4.72% |
| AR | 6.35% | 9.17% | 8.23% | 4.98% | 6.77% | 4.11% |
| ELF | 4.37% | 7.11% | 7.44% | 5.64% | 9.17% | 9.52% |
| ELB | 3.08% | 4.42% | 3.39% | 3.63% | 5.44% | 4.33% |
IV-A Kernel Performance Modeling
We obtain less than 10% GMAE and MAPE prediction errors for all kernel performance models shown in Table I. Particularly, the adjustment of all-to-all message size yields a low prediction error of latency, implying that the operation is bounded by the biggest per-device data bulk sent from or received by one certain device. Specifically, we present the fitted curves for all-to-all benchmark data on both platforms in Figure 9. We observe that the practical problem size for all-to-all in DLRM workloads lies in section 2 (the transitional section), which justifies our improvement on Equation 1.
IV-B Multi-GPU E2E Performance Modeling
IV-B1 DLRM on Multi-GPU Platforms
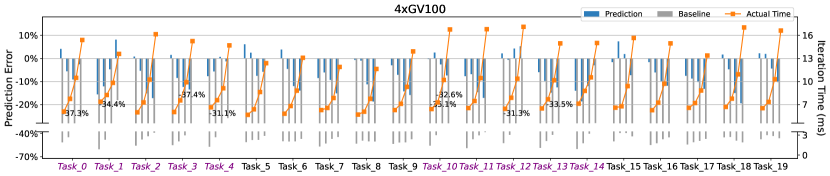
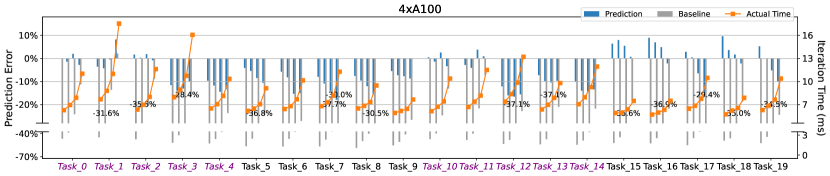
We present the statistics of all E2E performance modeling tests on the two multi-GPU platforms in Table II, and the prediction error and the reference time of each task in Figure 10. The baseline result to be compared with our prediction in Figure 10 is given by the maximum sum of kernel active time of each GPU stream. We can see that this baseline prediction, yielding error values higher than 60%, is not sufficient to be used as the predicted E2E time per iteration because no idle time nor waiting time caused by data dependency between the streams is considered. Instead, our enhanced algorithm can accurately predict both normal and heavy tasks with high accuracy, with an overall geomean prediction error of 5.21%. The majority of prediction results on both devices underestimate the actual time. One possible reason is that with big batch sizes, the communication time dominates the per-iteration time so the syncing and waiting time among all ranks also increases and contributes to the per-iteration time. The remaining tests that overestimate might be explained by the overestimation of GPU idle time caused by CPU overheads when the workload is latency-bound. Device-wise, the behavior of prediction errors, such as geomean/minimum/maximum error and trends when the batch size changes, does not deviate much, which justifies the consistency and stability of our prediction algorithm across platforms.
| Overall | 4xGV100 | 4xA100 | ||||||
|---|---|---|---|---|---|---|---|---|
| g.m. | min | max | g.m. | min | max | g.m. | min | max |
| 5.21% | 0.05% | 19.38% | 5.60% | 0.27% | 19.38% | 4.85% | 0.05% | 17.87% |
IV-B2 NLP Models Performance Modeling
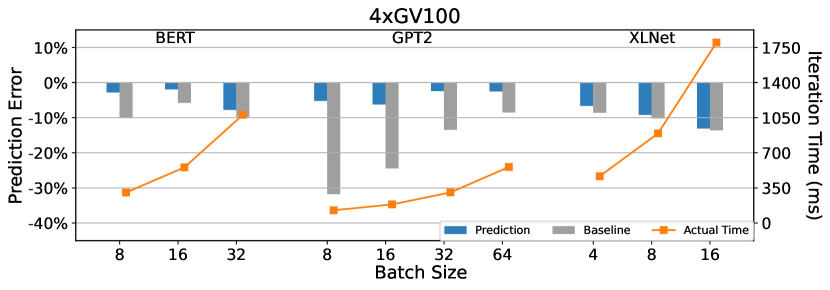
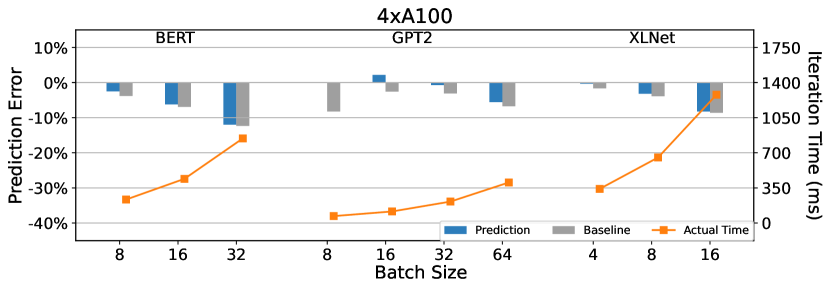
We also test our E2E performance model on Transformer-based NLP models including BERT, GPT2, and XLNet. In Figure 11, we see that the absolute prediction errors are less than 10% in all tests except two, which are slightly larger. The geomean prediction error of all the presented tests is 3.00%. Also, the variance of the prediction errors is obviously lower than that of DLRM workloads. The reasons are 1) these NLP models are compute (GEMM) dominated with the communication stream being well-overlapped by the compute stream, and 2) the loads across devices are more balanced than the DLRM workloads, thus intra-rank and inter-rank synchronizations are rare and have little interference in the prediction. With our highly accurate kernel performance models, we are able to precisely predict the aggregation of compute kernel time and subsequently the E2E time of these models.
V Application and Discussion
V-A Case Study: Fast Sharding Config Selection Using Performance Modeling
Industrial DLRM models can take days to train. Therefore, selecting a sharding configuration (i.e., the way to distribute embedding tables to multiple GPUs) that balances the loads on GPUs and speeds up the E2E per-iteration time is critical to reducing their training costs. Industrial sharding configs might consist of a sharding algorithm (greedy, multi-cost greedy, etc.), cost functions (multi-cost, memory-based, compute-based, etc.), table partition (column-based or row-based), and memory placement of tables (HBM/UVM). Previously, the best configs were selected by benchmarking and grid-searching over a big search space formed by these factors, which can take as long as one day per workload. We consider using our performance model for this task so that without running the workload, the selection time can be shortened to around 1 minute, with E2E per-iteration time predicted in seconds for each config. Notice again that we are not proposing a smart sharding algorithm here like some previous works did [27, 28, 26]. Instead, our goal is to quickly evaluate these sharding algorithms or configs and pick the fastest one for a specific problem size without benchmarking the model.
| Sharders | Functions |
|---|---|
| naive | (i) |
| random | (i) |
| size_greedy | (c) |
| lookup_greedy | (c) |
| norm_lookup_greedy | (c) |
| size_lookup_greedy | (c) |
We conduct an experiment to demonstrate how our performance model can quickly select the best sharding config for DLRM training on a multi-GPU system. To demonstrate the idea with simplicity, we only consider sharding algorithms as the config and omit all other factors mentioned above. We also do not include recently sophisticated sharders [27, 28, 26], although it is straightforward to integrate and test them in the future from an engineering point of view. We use six sharders listed in Table III for the experiment. In addition, we pick the 10 heavy tasks from the 20 tasks on each device generated in Section IV-B1 and run them again with the batch size 4096 and all sharders except for size_lookup_greedy. This is to guarantee that embedding lookup latency dominates the E2E time and thus the sharding config is likely to make a difference.
| Platforms | Tasks | Fastest (P) | Time (P, us) | Time (AP, us) | Fastest (A) | Time (A, us) | Abs Error | Meets Criterion? |
|---|---|---|---|---|---|---|---|---|
| 4xGV100 | Task 0 | naive | 13.40 | 15.80 | size_lookup_greedy | 15.39 | 2.66% | ✓ |
| Task 1 | naive | 12.13 | 15.46 | size_lookup_greedy | 13.59 | 13.76% | ✗ | |
| Task 2 | naive | 12.40 | 15.81 | random | 14.74 | 7.26% | ✓ | |
| Task 3 | size_lookup_greedy | 13.13 | 15.25 | random | 14.47 | 5.39% | ✓ | |
| Task 4 | norm_lookup_greedy | 12.26 | 15.54 | lookup_greedy | 14.00 | 11.00% | ✗ | |
| Task 10 | naive | 11.77 | 15.13 | naive | 15.13 | 0.00% | ✓ | |
| Task 11 | naive | 11.75 | 14.22 | naive | 14.22 | 0.00% | ✓ | |
| Task 12 | naive | 12.39 | 15.07 | naive | 15.07 | 0.00% | ✓ | |
| Task 13 | norm_lookup_greedy | 12.61 | 16.04 | size_lookup_greedy | 14.96 | 7.22% | ✓ | |
| Task 14 | naive | 11.87 | 14.46 | lookup_greedy | 13.13 | 10.13% | ✗ | |
| 4xA100 | Task 0 | naive | 8.68 | 10.62 | naive | 10.62 | 0.00% | ✓ |
| Task 1 | lookup_greedy | 13.15 | 15.05 | random | 14.52 | 3.65% | ✓ | |
| Task 2 | naive | 9.81 | 11.43 | naive | 11.43 | 0.00% | ✓ | |
| Task 3 | naive | 11.31 | 14.04 | random | 13.85 | 1.37% | ✓ | |
| Task 4 | naive | 8.64 | 10.10 | naive | 10.10 | 0.00% | ✓ | |
| Task 10 | random | 8.69 | 10.85 | size_lookup_greedy | 10.38 | 4.53% | ✓ | |
| Task 11 | naive | 9.18 | 11.40 | naive | 11.40 | 0.00% | ✓ | |
| Task 12 | naive | 9.26 | 11.76 | size_greedy | 11.54 | 1.91% | ✓ | |
| Task 13 | naive | 8.08 | 10.32 | size_lookup_greedy | 9.79 | 5.41% | ✓ | |
| Task 14 | naive | 8.13 | 9.67 | norm_lookup_greedy | 9.18 | 5.34% | ✓ |
Table IV shows the actual and prediction time of using different sharding configs in selected tasks trained with platforms 4xGV100 and 4xA100. We set the success criterion to be either the performance model accurately selects the fastest config, or the absolute error between the actual time of the predicted fastest config and the time of the actual fastest config is less than 10%. The reason for this criterion is that we not only care about if the fastest config is selected, but also how close the actual time of the predicted fastest config is from the actual fastest time when the fastest config is not selected. This is because in practice it is tolerable to fail to select the fastest config as long as the actual time of the selected config is close enough to the actual fastest time. We can see in the rightmost column that the prediction result of our performance model meets the criterion in 17 out of 20 (85%) tasks. In the rest 3 tasks, the absolute errors are only 13.76% at most. This demonstrates that our performance model is accurate enough to aid multi-GPU training optimization with low time and compute cost. Since we have demonstrated that our performance model’s prediction error is low both generally and in individual cases, we are confident that it can also perform well in unseen future cases.
V-B Discussion
The biggest advantage of our performance model is its strong adaptability to new ML models. It is essentially an execution simulator built in the granularity of kernels and ops. Supporting new ML models is straightforward, requiring only adding the missing performance models and overhead statistics of any new kernels and ops. The library of supported kernels and ops grows as the system evolves, making it even easier to support new models later. More importantly, from the performance perspective, how the workload is executed is more fundamental than how it is constructed, because the same ML model can be trained with different strategies—e.g., DP, DDP, MP, pipelining, etc.—with completely different performance. But our performance model can still handle all these cases because the easy-to-obtain execution trace (the input to our performance model) has information on both the model architecture and the execution. This means our performance model will extend well to unseen future workloads and execution paradigms.
Currently, this work has the following limitations:
-
•
Our prediction pipeline only supports ML workloads in FP32 precision. However, it can be seamlessly adapted for workloads in other precision types (FP16, INT8, etc.) by preparing kernel performance models for all ops in these types.
-
•
This work currently only covers single-node multi-GPU performance modeling. To extend it to multi-node multi-GPU platforms, kernel performance models of all-to-all and all-reduce for the multi-node communication network must be prepared. Algorithm 1 should also be slightly modified to track multiple processes from all nodes. This will further adapt the performance prediction pipeline to the industrial environment for enormous ML workloads such as large language models (LLM).
-
•
Some additional infrastructure features, such as the support of capturing dynamic tensor sizes and fused ops information in the execution trace, can increase the robustness of this work on various types of ML workloads (such as training NLP models with variable-input-length and no padding) and cooperate with modern ML compilation and optimization techniques.
We plan to extend our current code base to support these features.
VI Conclusion and Future Work
We extend our previous work of single-GPU performance model with two critical components for more accurate single- and multiple-GPU performance modeling: support for input-data-distribution-aware performance modeling of embedding lookup as a general enhancement, and performance modeling of communication collectives and E2E training time prediction with inter-rank and intra-rank synchronization to enable multi-GPU training performance modeling of ML workloads. We demonstrate that we achieve high prediction accuracy on various types of ML workloads such as randomly generated DLRM and NLP models, and also demonstrate the performance model’s ability to speed up DLRM training through the use case of embedding table sharding config selection.
There are a series of future works to be derived from this work. Beyond the issues identified in Section V-B, the data-distribution-aware method we use to model the performance of FBGEMM embedding lookup can be generalized to other sparse ops such as SpMM and SpGEMM to handle the training and inference performance prediction of future sparsified neural networks.
Acknowledgement
We would like to sincerely thank Daochen Zha, Valentin Andrei, and Yufei Zhu for their constructive feedback on this work.
References
- [1] M. Naumov, D. Mudigere, H. M. Shi, J. Huang, N. Sundaraman, J. Park, X. Wang, U. Gupta, C. Wu, A. G. Azzolini, D. Dzhulgakov, A. Mallevich, I. Cherniavskii, Y. Lu, R. Krishnamoorthi, A. Yu, V. Kondratenko, S. Pereira, X. Chen, W. Chen, V. Rao, B. Jia, L. Xiong, and M. Smelyanskiy, “Deep learning recommendation model for personalization and recommendation systems,” CoRR, vol. abs/1906.00091, 2019.
- [2] D. Mudigere, Y. Hao, J. Huang, Z. Jia, A. Tulloch, S. Sridharan, X. Liu, M. Ozdal, J. Nie, J. Park, L. Luo, J. A. Yang, L. Gao, D. Ivchenko, A. Basant, Y. Hu, J. Yang, E. K. Ardestani, X. Wang, R. Komuravelli, C.-H. Chu, S. Yilmaz, H. Li, J. Qian, Z. Feng, Y. Ma, J. Yang, E. Wen, H. Li, L. Yang, C. Sun, W. Zhao, D. Melts, K. Dhulipala, K. Kishore, T. Graf, A. Eisenman, K. K. Matam, A. Gangidi, G. J. Chen, M. Krishnan, A. Nayak, K. Nair, B. Muthiah, M. khorashadi, P. Bhattacharya, P. Lapukhov, M. Naumov, A. Mathews, L. Qiao, M. Smelyanskiy, B. Jia, and V. Rao, “Software-hardware co-design for fast and scalable training of deep learning recommendation models,” in Proceedings of the 49th Annual International Symposium on Computer Architecture, ser. ISCA ’22. New York, NY, USA: Association for Computing Machinery, 2022, p. 993–1011.
- [3] T. Brown, B. Mann, N. Ryder, M. Subbiah, J. D. Kaplan, P. Dhariwal, A. Neelakantan, P. Shyam, G. Sastry, A. Askell, S. Agarwal, A. Herbert-Voss, G. Krueger, T. Henighan, R. Child, A. Ramesh, D. Ziegler, J. Wu, C. Winter, C. Hesse, M. Chen, E. Sigler, M. Litwin, S. Gray, B. Chess, J. Clark, C. Berner, S. McCandlish, A. Radford, I. Sutskever, and D. Amodei, “Language models are few-shot learners,” in Advances in Neural Information Processing Systems, H. Larochelle, M. Ranzato, R. Hadsell, M. Balcan, and H. Lin, Eds., vol. 33. Curran Associates, Inc., 2020, pp. 1877–1901. [Online]. Available: https://proceedings.neurips.cc/paper_files/paper/2020/file/1457c0d6bfcb4967418bfb8ac142f64a-Paper.pdf
- [4] S. Smith, M. Patwary, B. Norick, P. LeGresley, S. Rajbhandari, J. Casper, Z. Liu, S. Prabhumoye, G. Zerveas, V. Korthikanti, E. Zheng, R. Child, R. Y. Aminabadi, J. Bernauer, X. Song, M. Shoeybi, Y. He, M. Houston, S. Tiwary, and B. Catanzaro, “Using DeepSpeed and Megatron to train Megatron-Turing NLG 530B, A large-scale generative language model,” CoRR, vol. abs/2201.11990, 2022.
- [5] A. Chowdhery, S. Narang, J. Devlin, M. Bosma, G. Mishra, A. Roberts, P. Barham, H. W. Chung, C. Sutton, S. Gehrmann, P. Schuh, K. Shi, S. Tsvyashchenko, J. Maynez, A. Rao, P. Barnes, Y. Tay, N. Shazeer, V. Prabhakaran, E. Reif, N. Du, B. Hutchinson, R. Pope, J. Bradbury, J. Austin, M. Isard, G. Gur-Ari, P. Yin, T. Duke, A. Levskaya, S. Ghemawat, S. Dev, H. Michalewski, X. Garcia, V. Misra, K. Robinson, L. Fedus, D. Zhou, D. Ippolito, D. Luan, H. Lim, B. Zoph, A. Spiridonov, R. Sepassi, D. Dohan, S. Agrawal, M. Omernick, A. M. Dai, T. S. Pillai, M. Pellat, A. Lewkowycz, E. Moreira, R. Child, O. Polozov, K. Lee, Z. Zhou, X. Wang, B. Saeta, M. Diaz, O. Firat, M. Catasta, J. Wei, K. Meier-Hellstern, D. Eck, J. Dean, S. Petrov, and N. Fiedel, “Palm: Scaling language modeling with pathways,” CoRR, vol. abs/2204.02311, 2022.
- [6] S. Zhang, S. Roller, N. Goyal, M. Artetxe, M. Chen, S. Chen, C. Dewan, M. Diab, X. Li, X. V. Lin, T. Mihaylov, M. Ott, S. Shleifer, K. Shuster, D. Simig, P. S. Koura, A. Sridhar, T. Wang, and L. Zettlemoyer, “OPT: Open pre-trained transformer language models,” 2022.
- [7] H. Touvron, T. Lavril, G. Izacard, X. Martinet, M.-A. Lachaux, T. Lacroix, B. Rozière, N. Goyal, E. Hambro, F. Azhar, A. Rodriguez, A. Joulin, E. Grave, and G. Lample, “LLaMA: Open and efficient foundation language models,” 2023.
- [8] D. Justus, J. Brennan, S. Bonner, and A. S. McGough, “Predicting the computational cost of deep learning models,” in 2018 IEEE International Conference on Big Data, ser. BigData 2018, Dec. 2018, pp. 3873–3882.
- [9] Z. Pei, C. Li, X. Qin, X. Chen, and G. Wei, “Iteration time prediction for CNN in multi-GPU platform: Modeling and analysis,” IEEE Access, vol. 7, pp. 64 788–64 797, 14 May 2019.
- [10] S. Li, R. J. Walls, and T. Guo, “Characterizing and modeling distributed training with transient cloud GPU servers,” in 2020 IEEE 40th International Conference on Distributed Computing Systems, ser. ICDCS 2020, Nov. 2020, pp. 943–953.
- [11] Y.-C. Liao, C.-C. Wang, C.-H. Tu, M.-C. Kao, W.-Y. Liang, and S.-H. Hung, “PerfNetRT: Platform-aware performance modeling for optimized deep neural networks,” in 2020 International Computer Symposium, ser. ICS 2020, Dec. 2020, pp. 153–158.
- [12] G. X. Yu, Y. Gao, P. Golikov, and G. Pekhimenko, “Habitat: A Runtime-Based computational performance predictor for deep neural network training,” in 2021 USENIX Annual Technical Conference (USENIX ATC 21). USENIX Association, Jul. 2021, pp. 503–521. [Online]. Available: https://www.usenix.org/conference/atc21/presentation/yu
- [13] A. Rajagopal and C. Bouganis, “perf4sight: A toolflow to model CNN training performance on edge GPUs,” in 2021 IEEE/CVF International Conference on Computer Vision Workshops (ICCVW). Los Alamitos, CA, USA: IEEE Computer Society, Oct. 2021, pp. 963–971.
- [14] Z. Lin, L. Feng, E. K. Ardestani, J. Lee, J. Lundell, C. Kim, A. Kejariwal, and J. D. Owens, “Building a performance model for deep learning recommendation model training on GPUs,” in 2022 IEEE 29th International Conference on High Performance Computing, Data, and Analytics, ser. HiPC 2022. IEEE, Dec. 2022, pp. 48–58.
- [15] J. Devlin, M. Chang, K. Lee, and K. Toutanova, “BERT: pre-training of deep bidirectional transformers for language understanding,” in Proceedings of the 2019 Conference of the North American Chapter of the Association for Computational Linguistics: Human Language Technologies, ser. NAACL-HLT 2019, J. Burstein, C. Doran, and T. Solorio, Eds., vol. 1. Association for Computational Linguistics, Jun. 2019, pp. 4171–4186.
- [16] A. Radford, J. Wu, R. Child, D. Luan, D. Amodei, and I. Sutskever, “Language models are unsupervised multitask learners,” OpenAI Blog, 14 Feb. 2019. [Online]. Available: https://openai.com/blog/better-language-models/
- [17] Z. Yang, Z. Dai, Y. Yang, J. Carbonell, R. R. Salakhutdinov, and Q. V. Le, “Xlnet: Generalized autoregressive pretraining for language understanding,” in Advances in Neural Information Processing Systems, H. Wallach, H. Larochelle, A. Beygelzimer, F. d'Alché-Buc, E. Fox, and R. Garnett, Eds., vol. 32. Curran Associates, Inc., 2019.
- [18] F. Yan, O. Ruwase, Y. He, and T. Chilimbi, “Performance modeling and scalability optimization of distributed deep learning systems,” in Proceedings of the 21th ACM SIGKDD International Conference on Knowledge Discovery and Data Mining, ser. KDD ’15. New York, NY, USA: Association for Computing Machinery, 2015, p. 1355–1364.
- [19] Y. Oyama, A. Nomura, I. Sato, H. Nishimura, Y. Tamatsu, and S. Matsuoka, “Predicting statistics of asynchronous SGD parameters for a large-scale distributed deep learning system on GPU supercomputers,” in 2016 IEEE International Conference on Big Data (Big Data), 2016, pp. 66–75.
- [20] H. Qi, E. R. Sparks, and A. Talwalkar, “Paleo: A performance model for deep neural networks,” in 5th International Conference on Learning Representations, ICLR 2017, Toulon, France, April 24-26, 2017, Conference Track Proceedings. OpenReview.net, 2017. [Online]. Available: https://openreview.net/forum?id=SyVVJ85lg
- [21] M. Wang, C. Meng, G. Long, C. Wu, J. Yang, W. Lin, and Y. Jia, “Characterizing deep learning training workloads on Alibaba-PAI,” in 2019 IEEE International Symposium on Workload Characterization (IISWC). Los Alamitos, CA, USA: IEEE Computer Society, Nov. 2019, pp. 189–202.
- [22] S. Sridharan, T. Heo, L. Feng, Z. Wang, M. Bergeron, W. Fu, S. Zheng, B. Coutinho, S. Rashidi, C. Man, and T. Krishna, “Chakra: Advancing performance benchmarking and co-design using standardized execution traces,” CoRR, vol. abs/2305.14516, 2023.
- [23] C. Yang, Z. Li, C. Ruan, G. Xu, C. Li, R. Chen, and F. Yan, “Perfestimator: A generic and extensible performance estimator for data parallel dnn training,” in 2021 IEEE/ACM International Workshop on Cloud Intelligence (CloudIntelligence), 2021, pp. 13–18.
- [24] D. Lepikhin, H. Lee, Y. Xu, D. Chen, O. Firat, Y. Huang, M. Krikun, N. Shazeer, and Z. Chen, “Gshard: Scaling giant models with conditional computation and automatic sharding,” in 9th International Conference on Learning Representations, ICLR 2021, Virtual Event, Austria, May 3-7, 2021. OpenReview.net, 2021. [Online]. Available: https://openreview.net/forum?id=qrwe7XHTmYb
- [25] M. Lui, Y. Yetim, O. Özkan, Z. Zhao, S.-Y. Tsai, C.-J. Wu, and M. Hempstead, “Understanding capacity-driven scale-out neural recommendation inference,” in 2021 IEEE International Symposium on Performance Analysis of Systems and Software (ISPASS), 2021, pp. 162–171.
- [26] G. Sethi, B. Acun, N. Agarwal, C. Kozyrakis, C. Trippel, and C.-J. Wu, “RecShard: Statistical feature-based memory optimization for industry-scale neural recommendation,” in Proceedings of the 27th ACM International Conference on Architectural Support for Programming Languages and Operating Systems, ser. ASPLOS ’22. New York, NY, USA: Association for Computing Machinery, 2022, pp. 344–358.
- [27] D. Zha, L. Feng, B. Bhushanam, D. Choudhary, J. Nie, Y. Tian, J. Chae, Y. Ma, A. Kejariwal, and X. Hu, “Autoshard: Automated embedding table sharding for recommender systems,” in Proceedings of the 28th ACM SIGKDD Conference on Knowledge Discovery and Data Mining, ser. KDD ’22. New York, NY, USA: Association for Computing Machinery, 2022, p. 4461–4471.
- [28] D. Zha, L. Feng, Q. Tan, Z. Liu, K.-H. Lai, B. Bhushanam, Y. Tian, A. Kejariwal, and X. Hu, “Dreamshard: Generalizable embedding table placement for recommender systems,” in Advances in Neural Information Processing Systems, A. H. Oh, A. Agarwal, D. Belgrave, and K. Cho, Eds., 2022. [Online]. Available: https://openreview.net/forum?id=_atSgd9Np52
- [29] Meta, “DLRM open-source datasets,” Dec. 2021. [Online]. Available: https://github.com/facebookresearch/dlrm_datasets
- [30] A. Tulloch. (2020, May) Batch embedding lookup GPU kernel and more. [Online]. Available: https://github.com/ajtulloch/sparse-ads-baselines
- [31] A. Grama and A. Gupta, Introduction to parallel computing, 2nd ed. Noida: Pearson, 2003.
- [32] A. Li, S. Song, J. Chen, J. Li, X. Liu, N. R. Tallent, and K. J. Barker, “Evaluating modern GPU interconnect: PCIe, NVLink, NV-SLI, NVSwitch and GPUDirect,” IEEE Transactions on Parallel and Distributed Systems, vol. 31, no. 01, pp. 94–110, Jan. 2020.
- [33] M. S. B. Altaf and D. A. Wood, “LogCA: A high-level performance model for hardware accelerators,” in 2017 ACM/IEEE 44th Annual International Symposium on Computer Architecture (ISCA), 2017, pp. 375–388.
- [34] Meta, “PARAM benchmark,” Sep. 2020. [Online]. Available: https://github.com/facebookresearch/param
- [35] D. S. Khudia, J. Huang, P. Basu, S. Deng, H. Liu, J. Park, and M. Smelyanskiy, “FBGEMM: enabling high-performance low-precision deep learning inference,” CoRR, vol. abs/2101.05615, 2021.
- [36] T. Wolf, L. Debut, V. Sanh, J. Chaumond, C. Delangue, A. Moi, P. Cistac, T. Rault, R. Louf, M. Funtowicz, J. Davison, S. Shleifer, P. von Platen, C. Ma, Y. Jernite, J. Plu, C. Xu, T. L. Scao, S. Gugger, M. Drame, Q. Lhoest, and A. M. Rush, “Transformers: State-of-the-art natural language processing,” in Proceedings of the 2020 Conference on Empirical Methods in Natural Language Processing: System Demonstrations. Online: Association for Computational Linguistics, Oct. 2020, pp. 38–45.
- [37] Meta, “Comparison between DataParallel and DistributedDataParallel,” May 2023. [Online]. Available: https://pytorch.org/tutorials/intermediate/ddp_tutorial.html#comparison-between-dataparallel-and-distributeddataparallel
- [38] S. Li, Y. Zhao, R. Varma, O. Salpekar, P. Noordhuis, T. Li, A. Paszke, J. Smith, B. Vaughan, P. Damania, and S. Chintala, “PyTorch distributed: Experiences on accelerating data parallel training,” Proc. VLDB Endow., vol. 13, no. 12, pp. 3005–3018, Aug. 2020.