Enhanced plasma ion heating by lasers in inhomogeneous external magnetic field
Abstract
Recent studies have shown direct ion heating (Vashistha et al. (2020); Juneja et al. (2023)) by lasers EM (Electromagnetic) wave interacting with a plasma threaded by an external uniform magnetic field. The EM wave frequency was near the lower hybrid (LH) resonance frequency. The LH resonance occurs at the edge of the pass band of the magnetized dispersion relation. The group speed of the wave is negligible at resonance. In these studies, the energy absorption remains essentially confined at the plasma surface. However, to heat the ions in the bulk plasma and at a desired location, a tailored inhomogeneous external magnetic field profile has been chosen here. The strength of the magnetic field at the plasma edge is such that the EM wave frequency lies inside the pass band, where the group velocity has a significant value. It enables the wave to enter the bulk plasma. The external magnetic field is then spatially tailored appropriately to have the LH resonance at a desired spatial location inside the plasma. The Particle-In-Cell (PIC) simulations using the OSIRIS4.0 platform have been carried out, which demonstrates that the EM wave pulse comes to a standstill at the location of the resonance. The wave pulse is observed to break down subsequently, and the energy consequently goes dominantly to the local plasma ions. The absorption is significantly enhanced compared to the case in which the magnetic field profile was homogeneous. The dependence of absorption on the choice of magnetic field profile, the laser intensity, etc., has also been carried out.
keywords:
Laser-Plasma interaction , Ion heating , Lower hybrid resonance , Wave breaking , Localized absorption1 Introduction
Laser energy absorption by plasma is crucial for a variety of applications. There are various mechanisms by which plasma heating can be obtained by a laser pulse (Kaw and Dawson (1969); Kaw (2017); Das (2020); Yabuuchi et al. (2009)). In some applications such as fusion, medical, etc., (Borghesi et al. (2010); Roth et al. (2001); Atzeni et al. (2002); Bulanov and Khoroshkov (2002); Naumova et al. (2009); Steward and Koehler (1973)) energetic ions are of paramount importance. Furthermore, there is always an interest in seeking efficient schemes for the creation of energetic ions. (Esirkepov et al. (2004); Kumar et al. (2019); Turrell et al. (2015); Pfotenhauer et al. (2010); Macchi et al. (2013); Henig et al. (2009); Robson et al. (2007); Snavely et al. (2000); Fuchs et al. (2006); Robinson et al. (2008); Haberberger et al. (2012); Wilks et al. (2001)). In un-magnetized plasma, the energetic ions are created by a two-step process wherein the laser dumps its energy into the lighter electron species, which subsequently gets transferred to ions by collisional and/or collective processes (Kruer and Estabrook (1985); Brunel (1987); Ping et al. (2008); Wilks et al. (1992); Chopineau et al. (2019); Freidberg et al. (1972); Stix (1965); Gibbon and Bell (1992)). Schemes like Radiation pressure acceleration (RPA) (Wilks et al. (1992); Esirkepov et al. (2004); Macchi et al. (2013)) and Target normal sheath acceleration (TNSA)(Wilks et al. (2001); Snavely et al. (2000)) are also employed for ion acceleration. Recently, our group has proposed novel schemes (Vashistha et al. (2020); Juneja et al. (2023)) of ion heating by applying an external magnetic field. The magnetic field strength was chosen to be appropriate so as to have a magnetized response from the lighter electron species in a laser cycle. The ions behaved as un-magnetized fluid as their gyrofrequency was much smaller than the laser cycle. The required strength of the magnetic field to achieve this is quite high. However, technological developments towards increasing the strength of magnetic fields (Nakamura et al. (2018); Korneev et al. (2015)) along with the arrival of long-wavelength intense lasers (e.g., CO2 lasers), very soon, this regime will be experimentally realizable. This has led to a lot of research interest lately in this particular regime (Maity et al. (2022); Mandal et al. (2021); Dhalia et al. (2023); Goswami et al. (2022)). In this study, we demonstrate using Particle-In-Cell (PIC) simulations that by appropriate spatial tailoring of the applied external magnetic field, the efficiency of energy transfer from the laser to the ions can be significantly enhanced. Furthermore, the technique also helps in heating the ions at a localized region of choice. This is often desirable in the context of several applications. This paper contains the following sections. In section 2, simulation details, along with the choice of various simulation parameters, have been provided. In section 3, simulation observations have been presented. In particular, the influence of the inhomogeneous magnetic field on EM wave propagation inside the bulk plasma and the enhanced ion heating at the LH resonance layer in the plasma is discussed. The influence of the spatial variation of the magnetic field profile on ion heating has also been studied. A comparison between the non-relativistic and relativistic intensity of the laser pulse has been provided. Finally, in section 4, we summarize our findings.
| Parameters | Normalized value | Value in standard units |
|---|---|---|
| Laser Parameters | ||
| Frequency () | ||
| Wavelength () | 31.4 | 9.42 |
| Intensity () | ||
| Plasma Parameters | ||
| Number density () | 1 | |
| Electron plasma frequency () | 1 | |
| Skin depth () | ||
| Simulation Parameters | ||
2 Simulation details
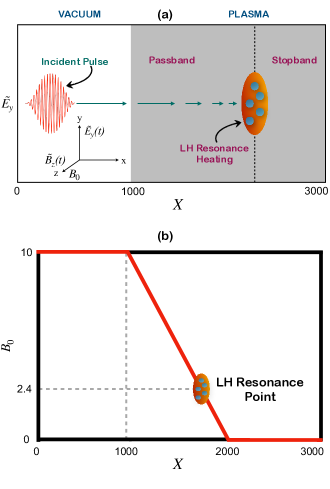
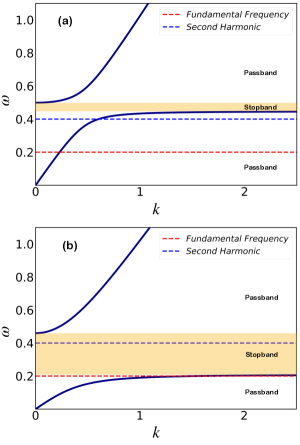
This study employed a massively parallel Particle-In-Cell code, OSIRIS 4.0 (Hemker (2000); Fonseca et al. (2002, 2008)), to conduct one-dimensional (1D) Particle-In-Cell (PIC) simulations. A one-dimensional simulation box with a length of has been considered. Here, denotes the speed of light in a vacuum, while represents the electron-plasma frequency. In all our simulations the time has been normalized by = . For length, the skin depth has been chosen. Normalization of the electric and magnetic fields is done by , where is the mass of the electron and represents the magnitude of the electronic charge. Absorbing boundary conditions have been taken for both fields and particles in both directions. We have considered grid points (cells) in our simulations, which correspond to the grid size , while the temporal resolution is chosen to be as . The number of particles per cell is taken to be 8. From to , there is a vacuum region, and the plasma boundary starts from . These have also been shown in Table 1, along with the possible realistic values that this choice of parameters can correspond to. The schematic of the simulation geometry is shown in Fig. 1. The laser pulse propagation is in the -direction. The electric and magnetic field components of the laser pulse are in and -direction, respectively. The applied magnetic field is also along the direction. It is chosen to be high at the plasma edge, as depicted in the schematic, and falls linearly with . This geometry essentially supports the extraordinary EM modes. Even though the plasma is overdense, the presence of the externally applied magnetic field permits the propagation of electromagnetic wave if its frequency lies in the pass band of the dispersion curve depicted in Fig. 2. The (a) and (b) subplots have been drawn for the magnetic field values and . The chosen fundamental laser frequency and its second harmonic lie in the pass band of the dispersion curve for the case of . For , the fundamental laser frequency hits the LH resonance. The second harmonic lies in the stop band. Thus, the external magnetic field allows the laser to penetrate inside the bulk of the target. Subsequently, as the magnetic field decreases and hits the value of , the fundamental frequency hits the stop band. The second harmonic is observed to be generated at this location. However, it is also unable to propagate deeper inside the target as it lies in the stop band.

3 Observations
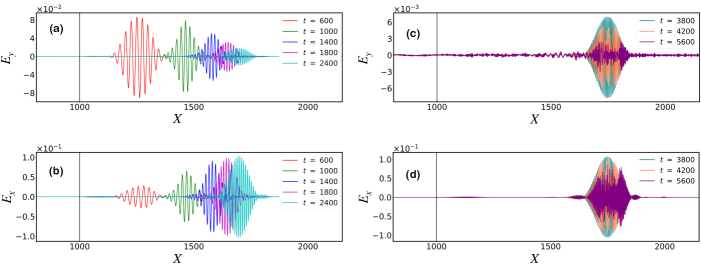
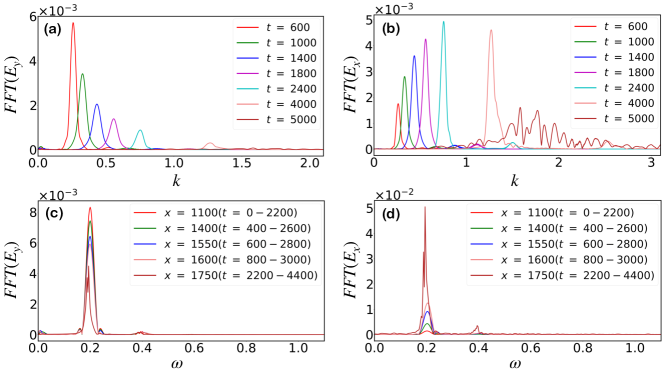
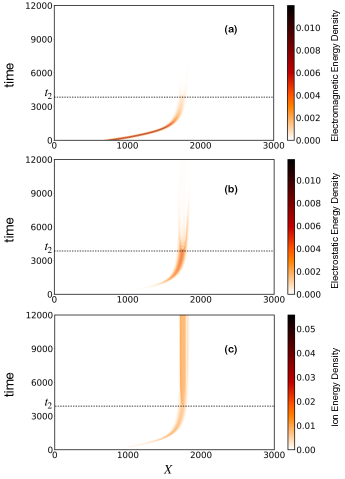
In this section, the simulation results are presented along with its understanding. The incident laser pulse is plane polarised with its electric field along the direction. The plasma is overdense for the chosen laser frequency. However, the laser frequency lies in the pass band of the X mode and hence propagates inside the plasma. This is shown in Fig. 3(a) and Fig. 3(c), which show the snapshots of at various times. As the pulse encounters an inhomogeneous magnetic field inside the plasma, the amplitude of the component is observed to diminish. However, concomitantly, there is a growth of (the component of the electric field ) as seen from the subplot (b) of the same figure. Thus, the electrostatic character of the wave keeps increasing. Ultimately, the laser pulse encounters the LH resonance layer, and the EM wave propagation stops completely, with group velocity being zero at the resonance layer. Both the electrostatic and the electromagnetic pulses (e.g. and is this geometry) are subsequently observed to suffer wave-breaking (see in Fig. 3(c), and Fig. 3(d)). The generation of shorter scales is evident from the figure. We also have Fourier analyzed these fields to show the formation of short-scale spatial structures with time in Fig. 4. The time FFT at this location also shows the generation of the second harmonic. However, since the second harmonic is in the stop band for , it also does not propagate further inside.
The emission of higher harmonic and their propagation details can be observed from Fig. 5. We have considered two spatial locations, , before the resonance layer and at , around the resonance layer where the mode has stopped. The fundamental frequency of the mode is the same as that of the incident laser pulse, i.e., . At the location, , second, third, and fourth harmonics are observed with efficiencies in descending order, but no fundamental frequency is observed. This location is far from the resonance layer on the left side. This shows that there is a generation of harmonics of the fundamental frequency from the resonance point by the EM pulse. The fundamental mode does not get reflected but the harmonics that get generated get transmitted in the backward direction to reach this point. In contrast, at the location , which is around the resonance layer, the presence of fundamental as well as second harmonic is clearly observed. No signal was observed from the locations which are at the right-hand side of the resonance where the magnetic field strength becomes considerably weak to permit any propagation of the signals, be it fundamental and/or the harmonics that get generated at resonance.
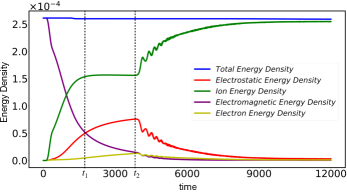
In Fig. 6, we show the evolution of various energies over time. The -axis represents time, while the -axis represents the energy density. The total energy shown by the blue-colored solid line is conserved. There is, however, a small dip at , which occurs when the reflected pulse from the plasma vacuum boundary moves out of the left boundary. Initially, all the energy is in electromagnetic fields and is shown by violet-colored solid line. However, as time progresses, the electromagnetic energy gradually decreases. A simultaneous increase in electrostatic energy accompanies this decrease. The kinetic energy of the particles (shown by the green-colored solid line) also increases during this period. The increase in ion energy is rapid compared to the increase in the energy of electrons. At time , the laser pulse hits the resonance layer and comes to a standstill. From to , there is a steady conversion of electromagnetic field energy to electrostatic fields. The wave profile in this duration remains intact (see Fig. 3). No ion energy increase is observed during this period. At , the electrostatic field acquires sufficient magnitude to undergo wave-breaking phenomena (See Fig. 3(d)). Thus, for , the pulse suffers wave-breaking, which leads to decay in both electrostatic and electromagnetic energies, as can be observed in Fig. 6. The green solid curve shows that energy is now being transferred to ions.
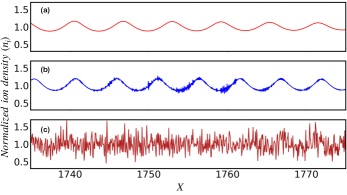
The evidence of wave-breaking is provided in Fig. 7, where the ion density around the LH resonance point as a function of space has been shown for three distinct times. At , when the waveform is intact at the resonance layer, the ion density has a nice sinusoidal form. At , when the wave starts to break, ion density in the vicinity of resonance shows the onset of short-scale generation, and the sinusoidal form begins to get disturbed. At a later time, , the waveform gets broken, and random fluctuations appear, which show spiky characteristics in ion density.
There is a strong transfer of field energy to the particles after the wave breaks. So far the electrostatic energy had been steadily rising. It now starts to decay. Electromagnetic energy continues to decay. The ion kinetic energy that had plateaued after now starts to increase. The electrostatic energy here provides a conduit for transferring field energy to particles at this particular time. This is also evident from Fig. 8, where the spatially integrated electromagnetic, electrostatic, and ion kinetic energy has been plotted as a function of time. It can be seen that the electromagnetic energy steadily decreases. The electrostatic energy and the kinetic energy increase together for some duration. Thereafter, after , when wave-breaking starts, the electrostatic energy diminishes, and the kinetic energy of the ion picks up simultaneously.

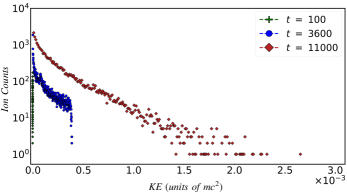
In Fig. 9, we have shown the ion counts as a function of its kinetic energy. There is a significant increase in ion energy after the wave-breaking process. Our studies thus demonstrate that by suitably choosing the spatial profile of the magnetic field, the EM wave can be enabled to enter the bulk region of the plasma, and then it can be made to dump its energy to ions at a suitable location.
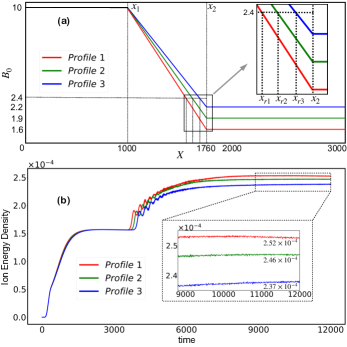
We now study the possible role, other than the resonance location, the choice of the spatial profile of the magnetic field plays in the energy absorption process. In Fig. 10(a), three choices of various magnetic field profiles have been shown. All three profiles start with . Thereafter, from , they decay linearly with different slopes till ; thereafter, the value of the magnetic field is again a constant. However, this constant magnetic field differs for the three profiles, as shown in Fig. 10(a). The energy acquired by the ions for each of these profiles has been shown alongside in Fig. 10(b). It is observed that for the steeper magnetic field profile, the location happens to be ahead compared to the resonance points defined for other cases. Thus, wave-breaking happens at an earlier time. It should also be noted that this steeper magnetic field profile helps in the higher absorption of laser energy by ions.
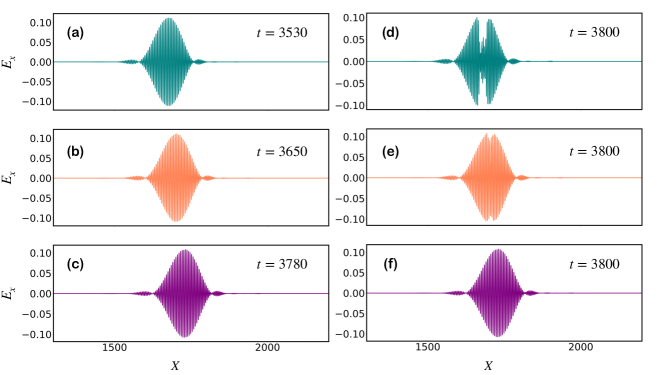
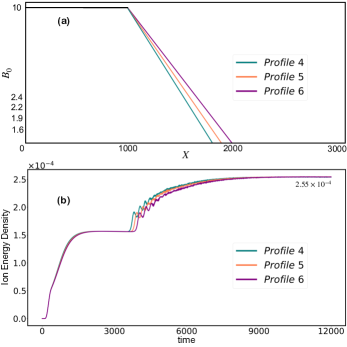
A comparison of the wave pulse profile at times just before the onset of wave-breaking phenomena in each of the cases has been depicted in Fig. 11. The plots in the right column are compared at the same time. For the choice of profile () and (), the EM wave pulse has already started degenerating. It is clearly faster for profile (). For the choice of shallower field profile (), the wave-breaking has not yet started. A comparison of subplots (c) and (f) shows that there is hardly any difference between them, though the pulse has been depicted at different times. Both the times are, however, before the onset of wave-breaking. Thus, the wave preserves its shape, standing at the resonance point for a significant time. It should also be noted that the shallower magnetic field profile shown in subplot (c) seems to be stretched toward the right-hand side compared to the other two cases shown in subplot (a) and (b). To ascertain whether this happens as a result of the (i) difference in slope or the (ii) fact that for profile (), the spatial resonance point is near compared to the spatial location where the magnetic field again attains a uniform value, we have carried out another set of simulations with the field profiles depicted in Fig. 12(a). In this set of simulations, the three slopes of the field are identical to the previous choice; however, for each of these cases (profiles , , and ), ultimately, the magnetic field value goes to zero. The pulse profile for this set of choices has been shown in Fig. 13, and it is clear that, in this case, none of the EM pulses show a stretched form. It should thus be realized that in the former set of simulations, the stretching of the EM wave profile for the profile () happens as there is a very small difference between the resonance value of and the lower constant value of and the quite small. The stretched pulse indicates that it is, in a way, trying to tunnel through.
Another feature to note is that for this particular set of simulations, the ultimate energy acquired by all three profiles is the same (See Fig. 13(b)) and comparatively higher than the previous set of simulations. Thus, the slope of the magnetic field has a limited role. The resonance location is determined by the same. The absorption, on the other hand, is governed by the final value of the magnetic field .
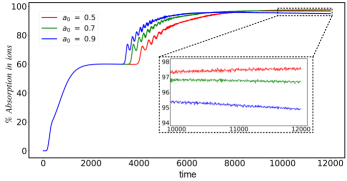
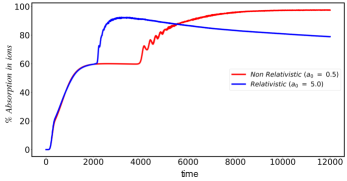
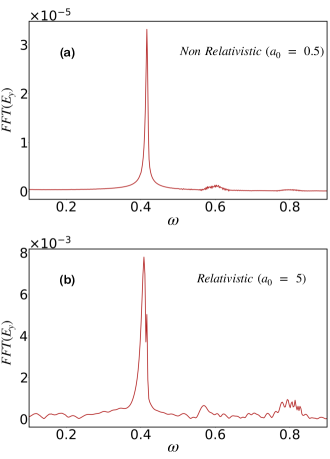
We have also studied the influence of laser intensity on the absorption process. In Fig. 14, we have chosen three distinct choices of the parameter . It is interesting to note that the onset of wave-breaking phenomena occurs earlier for the case with a higher value of . This is understandable as the electrostatic wave will reach the wave-breaking threshold earlier with higher energy available from the EM wave pulse. The percentage absorption is, however, higher for lower-intensity cases. This comparison is even more dramatic when (a highly relativistic intensity) is chosen (see Fig. 15). The explanation for this lies in the higher efficiency of the generation of harmonics when the laser intensity is higher. The harmonics reflect back from the resonance layer and escape the plasma. The FFT spectrum of the pulse near resonance in Fig. 16 shows the strength of the harmonics. It is clear that the intensity of harmonic is much higher for compared to .
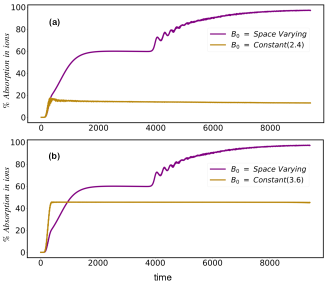
Finally, in Fig. 17, we provide a comparison of the percentage energy absorption that was achieved for the homogeneous case described in earlier publication (Juneja et al. (2023)). In subplot (a), we show the case for which the homogenous case corresponds to , the resonance value of the magnetic field. In subplot (b), the optimized strength of the homogeneous field, which is near resonance, has been chosen. The optimization of energy absorption in the context of a homogeneous field was described earlier in (Juneja et al. (2023)). The value should be close to resonance but not quite the resonance value to ensure that the EM wave frequency lies in the pass band and, at the same time, it is not too far away from the resonant value. By choosing an inhomogeneous magnetic field, one has been able to get rid of the shackles of satisfying two considerations, namely ensuring that resonance occurs and, at the same time, the EM pulse penetrates sufficiently inside the plasma, simultaneously with the same strength of the magnetic field. It is clear here that the percentage absorption in the inhomogeneous case is much higher than in the homogeneous case.
4 Conclusion
Particle-In-Cell (PIC) studies on laser/EM wave interaction with a magnetized plasma have been carried out to investigate the phenomena of laser energy absorption by plasma ions. Previous studies (Vashistha et al. (2020); Juneja et al. (2023)) in this direction have shown the possibility of ion heating in the lower Hybrid regime of operation. However, a major restriction was choosing a possible magnetic field that would ensure both the occurrence of Lower hybrid resonance and propagation of the laser/EM pulse inside the plasma. Clearly, both conditions cannot be simultaneously satisfied as the group speed of the EM pulse vanishes at the resonance. One, therefore had to choose an optimized value of the field, which is not exactly at the resonance but ensures the EM wave pulse to be in the pass band of the dispersion curve to yield the best absorption of energy. By choosing an inhomogeneous magnetic field this lacunae has been overcome. The field strength is chosen to be higher at the plasma edge to ensure smooth propagation of the laser/EM ave pulse inside the plasma. The strength of the magnetic field is decreased in space subsequently so that the pulse reaches the resonance point within the plasma. The simulation clearly shows that the laser energy gets dumped at the localized spot where the resonance condition is met. Furthermore, the efficiency of laser energy absorption improves significantly as the pulse meets the exact resonance condition. The role of the spatial magnetic field profile, laser intensity, etc., have also been studied in detail.
Acknowledgements
The authors would like to acknowledge the OSIRIS Consortium, consisting of UCLA and IST (Lisbon, Portugal), for providing access to the OSIRIS-4.0 framework, which is the work supported by the NSF ACI-1339893. AD would like to acknowledge her J C Bose fellowship grant JCB/2017/000055 and CRG/2022/002782 grant of DST. The authors thank the IIT Delhi HPC facility for computational resources. Rohit Juneja thanks the Council for Scientific and Industrial Research(Grant no. 09/086(1448)/2020-EMR-I) for funding the research.
References
- Atzeni et al. (2002) Atzeni, S., Temporal, M., Honrubia, J., 2002. A first analysis of fast ignition of precompressed icf fuel by laser-accelerated protons. Nuclear fusion 42, L1.
- Borghesi et al. (2010) Borghesi, M., Sarri, G., Cecchetti, C., Kourakis, I., Hoarty, D., Stevenson, R., James, S., Brown, C., Hobbs, P., Lockyear, J., et al., 2010. Progress in proton radiography for diagnosis of icf-relevant plasmas. Laser and Particle Beams 28, 277–284.
- Brunel (1987) Brunel, 1987. Not-so-resonant, resonant absorption. Physical review letters 59 1, 52–55.
- Bulanov and Khoroshkov (2002) Bulanov, S., Khoroshkov, V., 2002. Feasibility of using laser ion accelerators in proton therapy. Plasma Physics Reports 28, 453–456.
- Chopineau et al. (2019) Chopineau, L., Leblanc, A., Blaclard, G., Denoeud, A., Thévenet, M., Vay, J., Bonnaud, G., Martin, P., Vincenti, H., Quéré, F., 2019. Identification of coupling mechanisms between ultraintense laser light and dense plasmas. Physical Review X 9, 011050.
- Das (2020) Das, A., 2020. Laser plasma session: Aapps-dpp conference, 12–17 nov 2018, kanazawa. Reviews of Modern Plasma Physics 4, 10.
- Dhalia et al. (2023) Dhalia, T., Juneja, R., Goswami, L.P., Maity, S., Das, A., 2023. Harmonic generation in magnetized plasma for electromagnetic wave propagating parallel to external magnetic field. Journal of Physics D: Applied Physics .
- Esirkepov et al. (2004) Esirkepov, T., Borghesi, M., Bulanov, S., Mourou, G., Tajima, T., 2004. Highly efficient relativistic-ion generation in the laser-piston regime. Physical review letters 92, 175003.
- Fonseca et al. (2008) Fonseca, R., Martins, S., Silva, L., Tonge, J., Tsung, F., Mori, W., 2008. One-to-one direct modeling of experiments and astrophysical scenarios: pushing the envelope on kinetic plasma simulations. Plasma Physics and Controlled Fusion 50, 124034.
- Fonseca et al. (2002) Fonseca, R.A., Silva, L.O., Tsung, F.S., Decyk, V.K., Lu, W., Ren, C., Mori, W.B., Deng, S., Lee, S., Katsouleas, T., et al., 2002. Osiris: A three-dimensional, fully relativistic particle in cell code for modeling plasma based accelerators, in: International Conference on Computational Science, Springer. pp. 342–351.
- Freidberg et al. (1972) Freidberg, J., Mitchell, R., Morse, R.L., Rudsinski, L., 1972. Resonant absorption of laser light by plasma targets. Physical Review Letters 28, 795.
- Fuchs et al. (2006) Fuchs, J., Antici, P., d’Humières, E., Lefebvre, E., Borghesi, M., Brambrink, E., Cecchetti, C., Kaluza, M., Malka, V., Manclossi, M., et al., 2006. Laser-driven proton scaling laws and new paths towards energy increase. Nature physics 2, 48–54.
- Gibbon and Bell (1992) Gibbon, P., Bell, A., 1992. Collisionless absorption in sharp-edged plasmas. Physical review letters 68, 1535.
- Goswami et al. (2022) Goswami, L.P., Dhalia, T., Juneja, R., Maity, S., Das, S., Das, A., 2022. Observations of brillouin scattering process in particle-in-cell simulations for laser pulse interacting with magnetized overdense plasma. Physica Scripta 98, 015602.
- Haberberger et al. (2012) Haberberger, D., Tochitsky, S., Fiuza, F., Gong, C., Fonseca, R.A., Silva, L.O., Mori, W.B., Joshi, C., 2012. Collisionless shocks in laser-produced plasma generate monoenergetic high-energy proton beams. Nature Physics 8, 95–99.
- Hemker (2000) Hemker, R.G., 2000. Particle-in-cell modeling of plasma-based accelerators in two and three dimensions. University of California, Los Angeles.
- Henig et al. (2009) Henig, A., Steinke, S., Schnürer, M., Sokollik, T., Hörlein, R., Kiefer, D., Jung, D., Schreiber, J., Hegelich, B., Yan, X., et al., 2009. Radiation-pressure acceleration of ion beams driven by circularly polarized laser pulses. Physical Review Letters 103, 245003.
- Juneja et al. (2023) Juneja, R., Dhalia, T., Goswami, L.P., Maity, S., Mandal, D., Das, A., 2023. Ion heating in laser interacting with magnetized plasma. Plasma Physics and Controlled Fusion 65, 095005.
- Kaw (2017) Kaw, P., 2017. Nonlinear laser–plasma interactions. Reviews of Modern Plasma Physics 1, 1–42.
- Kaw and Dawson (1969) Kaw, P.K., Dawson, J., 1969. Laser-induced anomalous heating of a plasma. The Physics of Fluids 12, 2586–2591.
- Korneev et al. (2015) Korneev, P., d’Humières, E., Tikhonchuk, V., 2015. Gigagauss-scale quasistatic magnetic field generation in a snail-shaped target. Physical Review E 91, 043107.
- Kruer and Estabrook (1985) Kruer, W.L., Estabrook, K.G., 1985. J×b heating by very intense laser light. Physics of Fluids 28, 430–432.
- Kumar et al. (2019) Kumar, A., Shukla, C., Verma, D., Das, A., Kaw, P., 2019. Excitation of kdv magnetosonic solitons in plasma in the presence of an external magnetic field. Plasma Physics and Controlled Fusion 61, 065009.
- Macchi et al. (2013) Macchi, A., Borghesi, M., Passoni, M., 2013. Ion acceleration by superintense laser-plasma interaction. Reviews of Modern Physics 85, 751.
- Maity et al. (2022) Maity, S., Goswami, L.P., Vashistha, A., Mandal, D., Das, A., 2022. Mode conversion and laser energy absorption by plasma under an inhomogeneous external magnetic field. Physical Review E 105, 055209.
- Mandal et al. (2021) Mandal, D., Vashistha, A., Das, A., 2021. Electromagnetic wave transparency of x-mode in strongly magnetized plasma. Scientific Reports 11, 1–11.
- Nakamura et al. (2018) Nakamura, D., Ikeda, A., Sawabe, H., Matsuda, Y., Takeyama, S., 2018. Record indoor magnetic field of 1200 t generated by electromagnetic flux-compression. Review of Scientific Instruments 89, 095106.
- Naumova et al. (2009) Naumova, N., Schlegel, T., Tikhonchuk, V., Labaune, C., Sokolov, I., Mourou, G., 2009. Hole boring in a dt pellet and fast-ion ignition with ultraintense laser pulses. Physical Review Letters 102, 025002.
- Pfotenhauer et al. (2010) Pfotenhauer, S., Jäckel, O., Polz, J., Steinke, S., Schlenvoigt, H., Heymann, J., Robinson, A., Kaluza, M., 2010. A cascaded laser acceleration scheme for the generation of spectrally controlled proton beams. New Journal of Physics 12, 103009.
- Ping et al. (2008) Ping, Y., Shepherd, R., Lasinski, B., Tabak, M., Chen, H., Chung, H., Fournier, K., Hansen, S., Kemp, A., Liedahl, D., et al., 2008. Absorption of short laser pulses on solid targets in the ultrarelativistic regime. Physical review letters 100, 085004.
- Robinson et al. (2008) Robinson, A., Zepf, M., Kar, S., Evans, R., Bellei, C., 2008. Radiation pressure acceleration of thin foils with circularly polarized laser pulses. New journal of Physics 10, 013021.
- Robson et al. (2007) Robson, L., Simpson, P., Clarke, R.J., Ledingham, K.W., Lindau, F., Lundh, O., McCanny, T., Mora, P., Neely, D., Wahlström, C.G., et al., 2007. Scaling of proton acceleration driven by petawatt-laser–plasma interactions. Nature physics 3, 58–62.
- Roth et al. (2001) Roth, M., Cowan, T., Key, M., Hatchett, S., Brown, C., Fountain, W., Johnson, J., Pennington, D., Snavely, R., Wilks, S., et al., 2001. Fast ignition by intense laser-accelerated proton beams. Physical review letters 86, 436.
- Snavely et al. (2000) Snavely, R., Key, M., Hatchett, S., Cowan, T., Roth, M., Phillips, T., Stoyer, M., Henry, E., Sangster, T., Singh, M., et al., 2000. Intense high-energy proton beams from petawatt-laser irradiation of solids. Physical review letters 85, 2945.
- Steward and Koehler (1973) Steward, V., Koehler, A., 1973. Proton beam radiography in tumor detection. Science 179, 913–914.
- Stix (1965) Stix, T.H., 1965. Radiation and absorption via mode conversion in an inhomogeneous collision-free plasma. Physical Review Letters 15, 878.
- Turrell et al. (2015) Turrell, A., Sherlock, M., Rose, S., 2015. Ultrafast collisional ion heating by electrostatic shocks. Nature communications 6, 1–7.
- Vashistha et al. (2020) Vashistha, A., Mandal, D., Kumar, A., Shukla, C., Das, A., 2020. A new mechanism of direct coupling of laser energy to ions. New Journal of Physics 22, 063023.
- Wilks et al. (1992) Wilks, S., Kruer, W., Tabak, M., Langdon, A., 1992. Absorption of ultra-intense laser pulses. Physical review letters 69, 1383.
- Wilks et al. (2001) Wilks, S., Langdon, A., Cowan, T., Roth, M., Singh, M., Hatchett, S., Key, M., Pennington, D., MacKinnon, A., Snavely, R., 2001. Energetic proton generation in ultra-intense laser–solid interactions. Physics of plasmas 8, 542–549.
- Yabuuchi et al. (2009) Yabuuchi, T., Das, A., Kumar, G., Habara, H., Kaw, P., Kodama, R., Mima, K., Norreys, P., Sengupta, S., Tanaka, K., 2009. Evidence of anomalous resistivity for hot electron propagation through a dense fusion core in fast ignition experiments. New Journal of Physics 11, 093031.