Millisecond-resolved infrared spectroscopy study of polymer brush swelling dynamics
Abstract
We present the study of millisecond-resolved polymer brush swelling dynamics using infrared spectroscopy with a custom-built quantum cascade laser-based infrared spectrometer at a sampling rate after averaging. By cycling the humidity of the environment of the polymer brush, we are able to measure the swelling dynamics sequentially at different wavenumbers. The high sampling rate provides us with information on the reconformation of the brush at a higher temporal resolution than previously reported. Using spectroscopic ellipsometry, we study the brush swelling dynamics as a reference experiment and to correct artefacts of the infrared measurement approach. This technique informs on the changes in the brush thickness and refractive index. Our results indicate that the swelling dynamics of the polymer brush are poorly described by Fickian diffusion and the Berens-Hopfenberg formalism, pointing toward more complicated underlying transport.
1 Introduction
Time-resolved infrared (TR-IR) spectroscopy is used to study the transient behaviour of IR-active bonds. On the micro- and nanosecond timescale, transient behaviour informs on the transport and kinetic behaviour of chemical systems [1]. TR-IR spectroscopy has traditionally been used in Fourier transform (FT) IR systems, with which temporal resolutions of can be achieved in step-scan mode [2, 3]. Recent advancements in quantum cascade laser (QCL) technology [4, 5, 6] have enabled higher temporal resolution sampling at discrete frequencies by providing a widely tunable, high-intensity light source [7, 8]. Moreover, QCL frequency combs have enabled the acquisition of full spectra at nanosecond timescales [9] and are now commercially available [10]. However, with all approaches, the signal-to-noise ratio deteriorates for higher temporal resolutions, forming a trade-off between spectral and temporal resolution. Using discrete-frequency infrared (DF-IR) spectroscopy, the attainable signal-to-noise ratio is higher than full spectral approaches due to a higher signal intensity at single wavelengths [11]. Thus, for single transient signals, DF-IR can provide a higher time resolution than approaches where a full spectrum is attained. Additionally, for highly repeatable systems, DF-IR can be used iteratively to acquire time-resolved information at separate wavelengths. When studying small systems using infrared spectroscopy, controlling the environment of the studied system can be challenging. One method is to place the studied system in a microfluidic environment. Microfluidics and infrared spectroscopy can be integrated through different approaches, such as thin film waveguides [12, 13], reflective measurements, transmission measurements [14, 15] and attenuated total reflection (ATR) [16, 17]. In microfluidics, the high surface-to-volume ratio leads to a larger influence of surface effects. Consequently, surface-sensitive techniques such as waveguides, infrared reflection absorption spectroscopy [18], and ATR spectroscopy are often used.
QCL-based DF-IR spectroscopy can be used to elucidate the dynamic chemical behaviour of systems on a smaller timescale than previously reported. A relevant subject to study using this principle is the water sorption dynamics in polymer films or brushes. Polymer brushes are coatings consisting of macromolecules densely grafted to a substrate. At sufficiently high grafting densities, they are forced to stretch away from the substrate, forming a ‘brush’ structure, with the chains extending away from the substrate [19, 20]. Polymer brushes exhibit properties that can be considerably different from non-grafted films or bulk polymers [21, 22], which gives rise to a broad range of applications in the (bio-)medical field [23, 24] in anti-fouling surfaces [25, 26], lubricious surfaces [27, 28], sensors [29] and separation membranes [30, 31]. In several of these applications, brushes are swollen by vapours [32], such as water [33, 34]. Understanding brush swelling dynamics is imperative for proper application of brushes in these contexts. Although time-resolved brush vapour swelling has been preliminarily reported [35, 36], the dynamics of vapour sorption have not been extensively explored. Vapour sorption dynamics is still an active area of research in non-grafted polymer films [37, 38], and grafting and the resulting anisotropic chain conformation in brushes further complicate solvent diffusion. Polymer films are typically glassy, which complicates the swelling dynamics, as they can undergo a solvent-induced glass transition during swelling, impacting the diffusivity. A glassy polymer can also contain voids, which the solvent can occupy without diluting the film [38]. Moreover, variable brush thickness, changes in the polymer matrix affecting diffusivity, and the potential gradient arising from solvent-polymer interactions lead to anomalous (or non-Fickian) diffusion. The interplay between solvent diffusion, polymer-solvent interaction energy and polymer conformation kinetics make descriptive swelling kinetic models complex. [39]
In this work, a custom-built QCL-based DF-IR spectrometer is used to study the swelling dynamics of a polymer brush in an ATR configuration. The ATR crystal coated with polymer brush is enclosed in a microfluidic flow cell to accurately control its environment. The spectrometer is configured to measure polymer brush swelling dynamics at a high time resolution while still capturing a full spectrum. By integrating high-speed infrared spectroscopy with rapid humidity switching, we are able to show swelling kinetics at a higher time resolution than previously reported (to our knowledge). The infrared spectroscopy is complimented by in-situ visible light spectroscopic ellipsometry to measure the swelling and refractive index change.
2 Methods
2.1 Brush synthesis
A poly(3-sulfopropyl methacrylate) brush is prepared in a grafting-from manner on silicon substrates by an oxygen-tolerant, surface-initiated controlled radical polymerisation known as activators regenerated by electron transfer atom transfer radical polymerisation (SI-ARGET-ATRP). The substrates are first cleaned and activated by oxygen plasma and subsequently functionalised with a silane anchor (3-aminopropyltriethoxysilane) by vapour deposition. An initiator (2-bromoisobutyryl bromide) is then coupled. Finally, the polymerisation is conducted from the initiator-functionalised substrates for , resulting in brushes with a dry height of approximately . This synthesis procedure is described in detail by [40].
For IR spectroscopy, the brushes are grown on silicon ATR crystals. For ellipsometry, the substrates are 5x2 pieces of a silicon wafer (Okmetic, Finland) thick, boron-doped with a (100) crystal lattice orientation).
2.2 Infrared spectrometer design
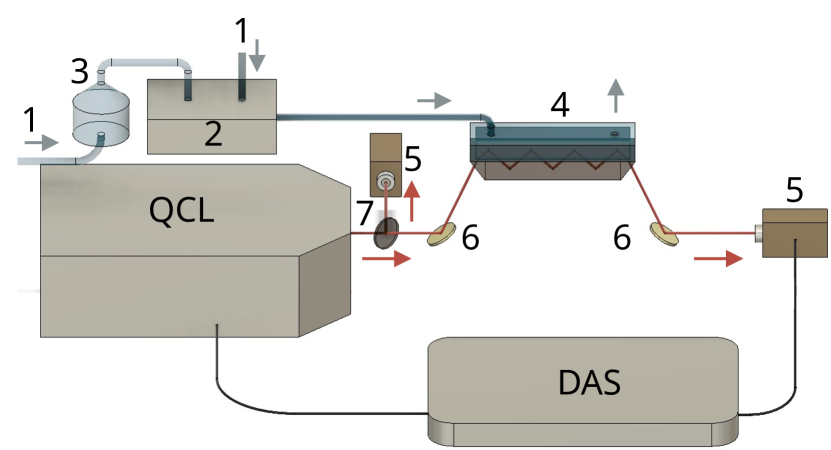
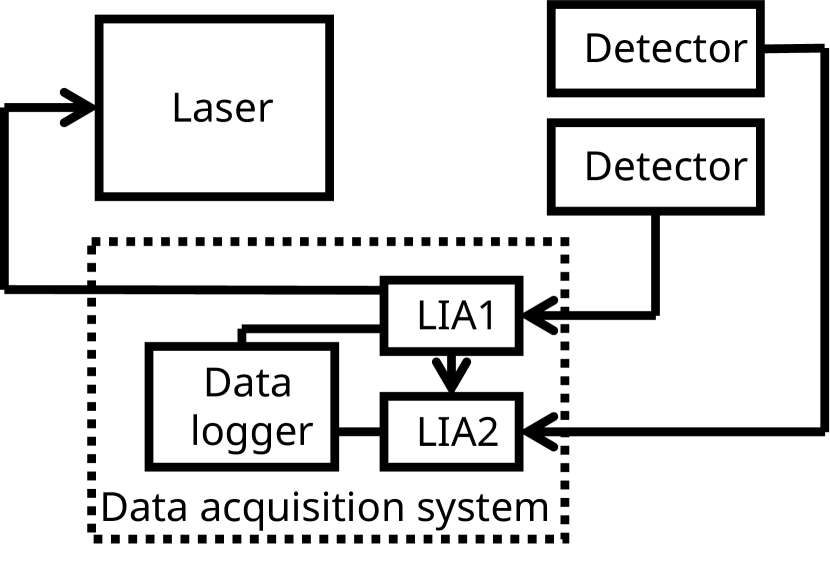
The global design of the infrared spectrometer is shown in Figure 1. The data processing and triggering schematic is shown in Figure 2. The infrared spectrometer is built up from an external cavity quantum cascade laser (two separate internal gain media, Mircat-QT, Daylight solutions, US), beam path including sample, mercury cadmium telluride (MCT) detector (PVI-4TE-10.6, Vigo Photonics, Poland) with pre-amplifier (PIP-UC-HS, Vigo Photonics, Poland) and thermoelectric controller (PTCC-01-BAS, Vigo Photonics, Poland), and an FPGA-based data acquisition system (Moku: Pro, Liquid Instruments, Australia).
The QCL has a frequency range of . The QCL has a minimum step size of and a full-width-half-maximum wavelength accuracy. The QCL is operated in an externally driven pulsed mode, pulsing at a frequency defined in the data acquisition system. The pulse width is independently set in the QCL, and can be set up to a duty cycle of 30%. The QCL is programmed to step from wavenumber to wavenumber at a fixed time interval, sweeping over the entire wavelength range in a single full experiment.
The MCT detectors used are identical. The first detector is the data acquisition detector, whereas the other detector is used to identify wavelength steps in data processing. The MCT detector pre-amplifiers are tuned identically before each experiment to maximise the signal-to-noise ratio by changing the bias voltage.
The data acquisition system contains four 600 MHz analog-to-digital converters integrated with four internal field programmable arrays (FPGAs), of which three are used: two as a lock-in amplifier and one as a data logger. This is shown in Figure 2. Data acquisition of the pulsed signal from the detectors is processed using the two lock-in amplifiers. The first lock-in amplifier generates a reference clock which is also used as a reference signal in the second, ensuring the two lock-in amplifiers do not drift with respect to each other. The clock signal in the first lock-in amplifier is also amplified and used to drive the QCL’s TTL pulse port. Before each experiment, the phase of the lock-in amplifier is tuned to maximise the signal-to-noise ratio, and only the in-phase element is logged (as opposed to the quadrature). The built-in data logger is limited to logging, so each data stream gets logged at . An inbuilt averager can be used to average data while logging when data averaging is anticipated. By using an FPGA multi-instrument system the spectrometer data processing can be reconfigured without altering hardware, depending on measurement needs.
The beam path is controlled by a zinc selenide beam-splitter, two gold mirrors, and the silicon ATR crystal. The fabrication of the silicon ATR crystal is reported by [41]. The zinc selenide beam splitter allows separate logging of the laser signal intensity and the signal intensity after passing through the ATR crystal, both of which are used in data processing. The alignment setup of the crystal through the gold mirrors is made in-house. The optical alignment of the mirrors is optimised before each measurement. Notably, a wavenumber-dependent pointing error in the QCL affects the alignment. Because of this, the alignment is tuned for both high and low wavenumbers within the spectral range of the laser. Nonetheless, a pointing error induced alignment variation results in reduced signal quality at the extremes of the spectral range.
2.3 IR spectroscopy
The infrared spectrometer is set to sweep from in steps of . The first lock-in amplifier is set at , combined with a peak width for the QCL. Both lock-in amplifiers output the in-phase component of the mixed signal after a , low-pass filter. Data is logged at , averaging the signal between data points.
To control the environment of the brush on the ATR crystal, it is bonded with a cap and turned into a flow cell. The cap is made using 2mm thick styrene-ethylene-butylene-styrene elastomer (Flexdym, Eden Microfluidics, France) thermoformed on a polytetrafluoroethylene mould at . The mould is high and has an area of . An inlet and an outlet hole are punched into the cap after forming. The cap is bonded to the brush-covered ATR crystal in an oven at while pressed. The resulting flow cell is connected to the humidistat-valve humidity control system using adhesive connectors and flexible polymer tubing.
2.4 Humidity control
To perform humidity-controlled experiments, we use our OpenHumidistat [42] humidity controller, which provides closed-loop control over the humidity of a nitrogen stream at a constant flow of . As the humidity sensor for feedback to the humidity controller cannot fit inside either the microfluidic flow cell (for IR spectroscopy) or the measurement chamber (for ellipsometry), we use a small pre-chamber containing the humidity sensor.
Because we are interested in the dynamic swelling response of our samples on a short time scale, we only use the humidity controller to provide a nitrogen stream of constant, stable 90% humidity. We use a solenoid valve system (Festo, The Netherlands) to quickly select between humidified and dry nitrogen to feed into the IR spectroscopy and ellipsometry flow cells. Using this setup, we can impose a rapid change in the humidity without being limited by the transient response of the humidistat.
The internal volume of the flow chamber is in the infrared spectrometer. The controlled flow of results in an average residence time of . The solenoid valve system switches the humidity in sync with the wavelength triggers of the QCL. Each distinct wavenumber is maintained for : for high and for low humidity.
For the IR spectroscopy, the synchronisation between the humidity control system and the spectrometer is arranged using transistor-transistor logic (TTL). Upon a wavelength change, the QCL outputs a TTL pulse. A microcontroller (Arduino Uno, Arduino, Italy) is used to listen to this pulse and trigger a Matlab script on a laptop. The script, subsequently, triggers a switch in the valve system leading the desired gas feed (humidified or dry nitrogen) into the microfluidic flow chamber.
To feed the humidity-controlled nitrogen over the brush in a controlled fashion, a flow chamber around the brush is created by bonding a cap to the ATR crystal. The outlet of the valve system is connected to the flow chamber inlet, whereas the outlet does not feature tubing, but exhausts directly into the environment.
For the time coordination between the ellipsometer and humidity control system, a Matlab script is used to set the duration of the high humidity window. The script is started manually at the same time as the ellipsometry measurement. In the ellipsometer, a compatible flow cell (Heated Liquid Cell, J.A. Woollam, US) with an internal volume of 5 mL is mounted on the silicon chip, controlling the brush environment. The cell’s heating feature is not used.
2.5 Ellipsometry
In-situ ellipsometry is conducted using a spectroscopic ellipsometer (M-2000X, J.A. Woollam, US). The measurements are performed in in-situ mode at wavelengths between nd at an angle of incidence of . During a measurement, the humidity of the air is switched from dry to a higher humidity level, and the transient swelling response of the brush is measured.
The data is fitted to a model composed of a Cauchy layer on top of a Si substrate. The thickness and Cauchy A and B coefficients are fitted. We do not use higher-order Cauchy coefficients, and we assume the polymer is optically transparent over the measured wavelength range.
2.6 Data processing
Infrared spectroscopy data processing is done in Python, the code for which can be found in SI-3. To process the infrared spectroscopy data, the twenty-second single-frequency time periods are cut into bins. Due to slight time variations in the QCL, not each twenty-second frame is equally long. Considering a small step in the wavenumber typically leads to a significant step in the laser output power, the laser power can be used to identify a wavenumber step. To identify the wavenumber steps on the relevant timescale of the measurement, the secondary detector bypassing the attenuation crystal is used to measure steps in the laser signal intensity. A peak-finding algorithm is used on the derivative in time of the secondary column signal to identify steps in the wavenumber intensity. Any bins deviating by more than 1% of the median bin length are discarded.
The infrared absorption of the brush in humid nitrogen is calculated with respect to the dry brush. The dry brush intensity is chosen within a frame where no drying effects take place (the average signal of 7.5 to 9 seconds in the drying phase is taken), where the absorption profile is constant. The absorbance is given by Equation 1. Here, and are the intensity of the reference period and of the time-resolved signal, respectively.
| (1) |
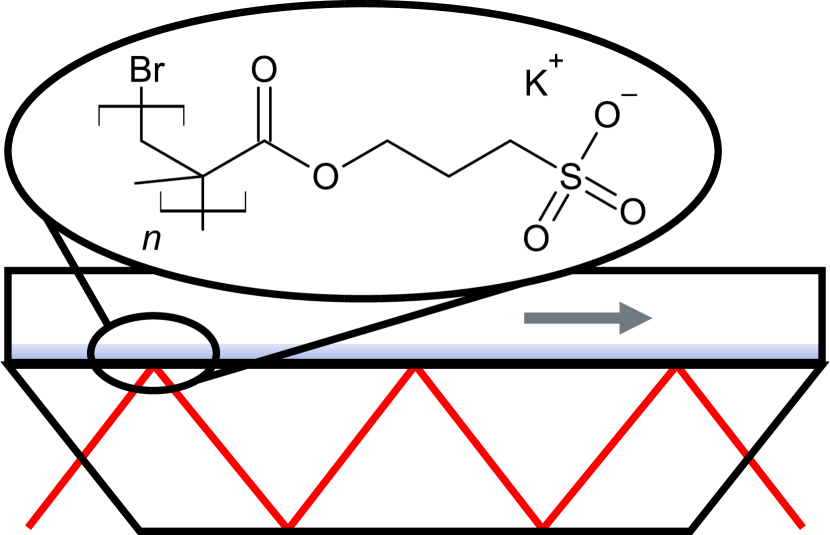
Due to the ATR measurement approach, corrections can be made based on varying parameters affecting the effective path length through the brush: a correction for the evanescent wave thickness varying with the refractive index and wavelength, and a correction for the overlap of the evanescent wave and the brush thickness. The evanescent wave thickness in ATR is given by Equation 2, where is the distance from the surface where light intensity has decayed 1/e, is the wavelength, is the incident angle, and is the ratio of the refractive indices of the sample and the crystal. [43]. Due to the variation of the refractive index of the brush as a function of the swelling, the thickness of the sensing window varies. Additionally, the sensing window depth is dependent on the wavelength. Finally, the sensing window is limited by the brush thickness. Thus, any absorption found in the polymer brush is not only molecular but also a function of these measurement artefacts.
| (2) |
The dimensionless brush thickness overlap with the evanescent wave model is given by Equation 3. Here, is the thickness of the brush.
| (3) |
Combining Equation 2 and 3, functions as a dimensionless correction factor between 0 and 1 for the aforementioned ATR artefacts, which is applied. While the ellipsometry data is taken at a different timescale and in the visible light regime, the swelling and refractive index information from it can be used to correct the ATR artefacts. Linear interpolation is used for ellipsometry between data points, and used to inform the infrared spectroscopy correction.
3 Results
3.1 Infrared spectroscopy
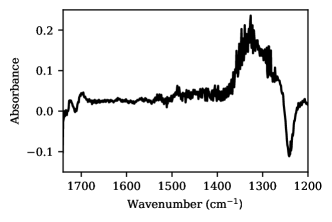
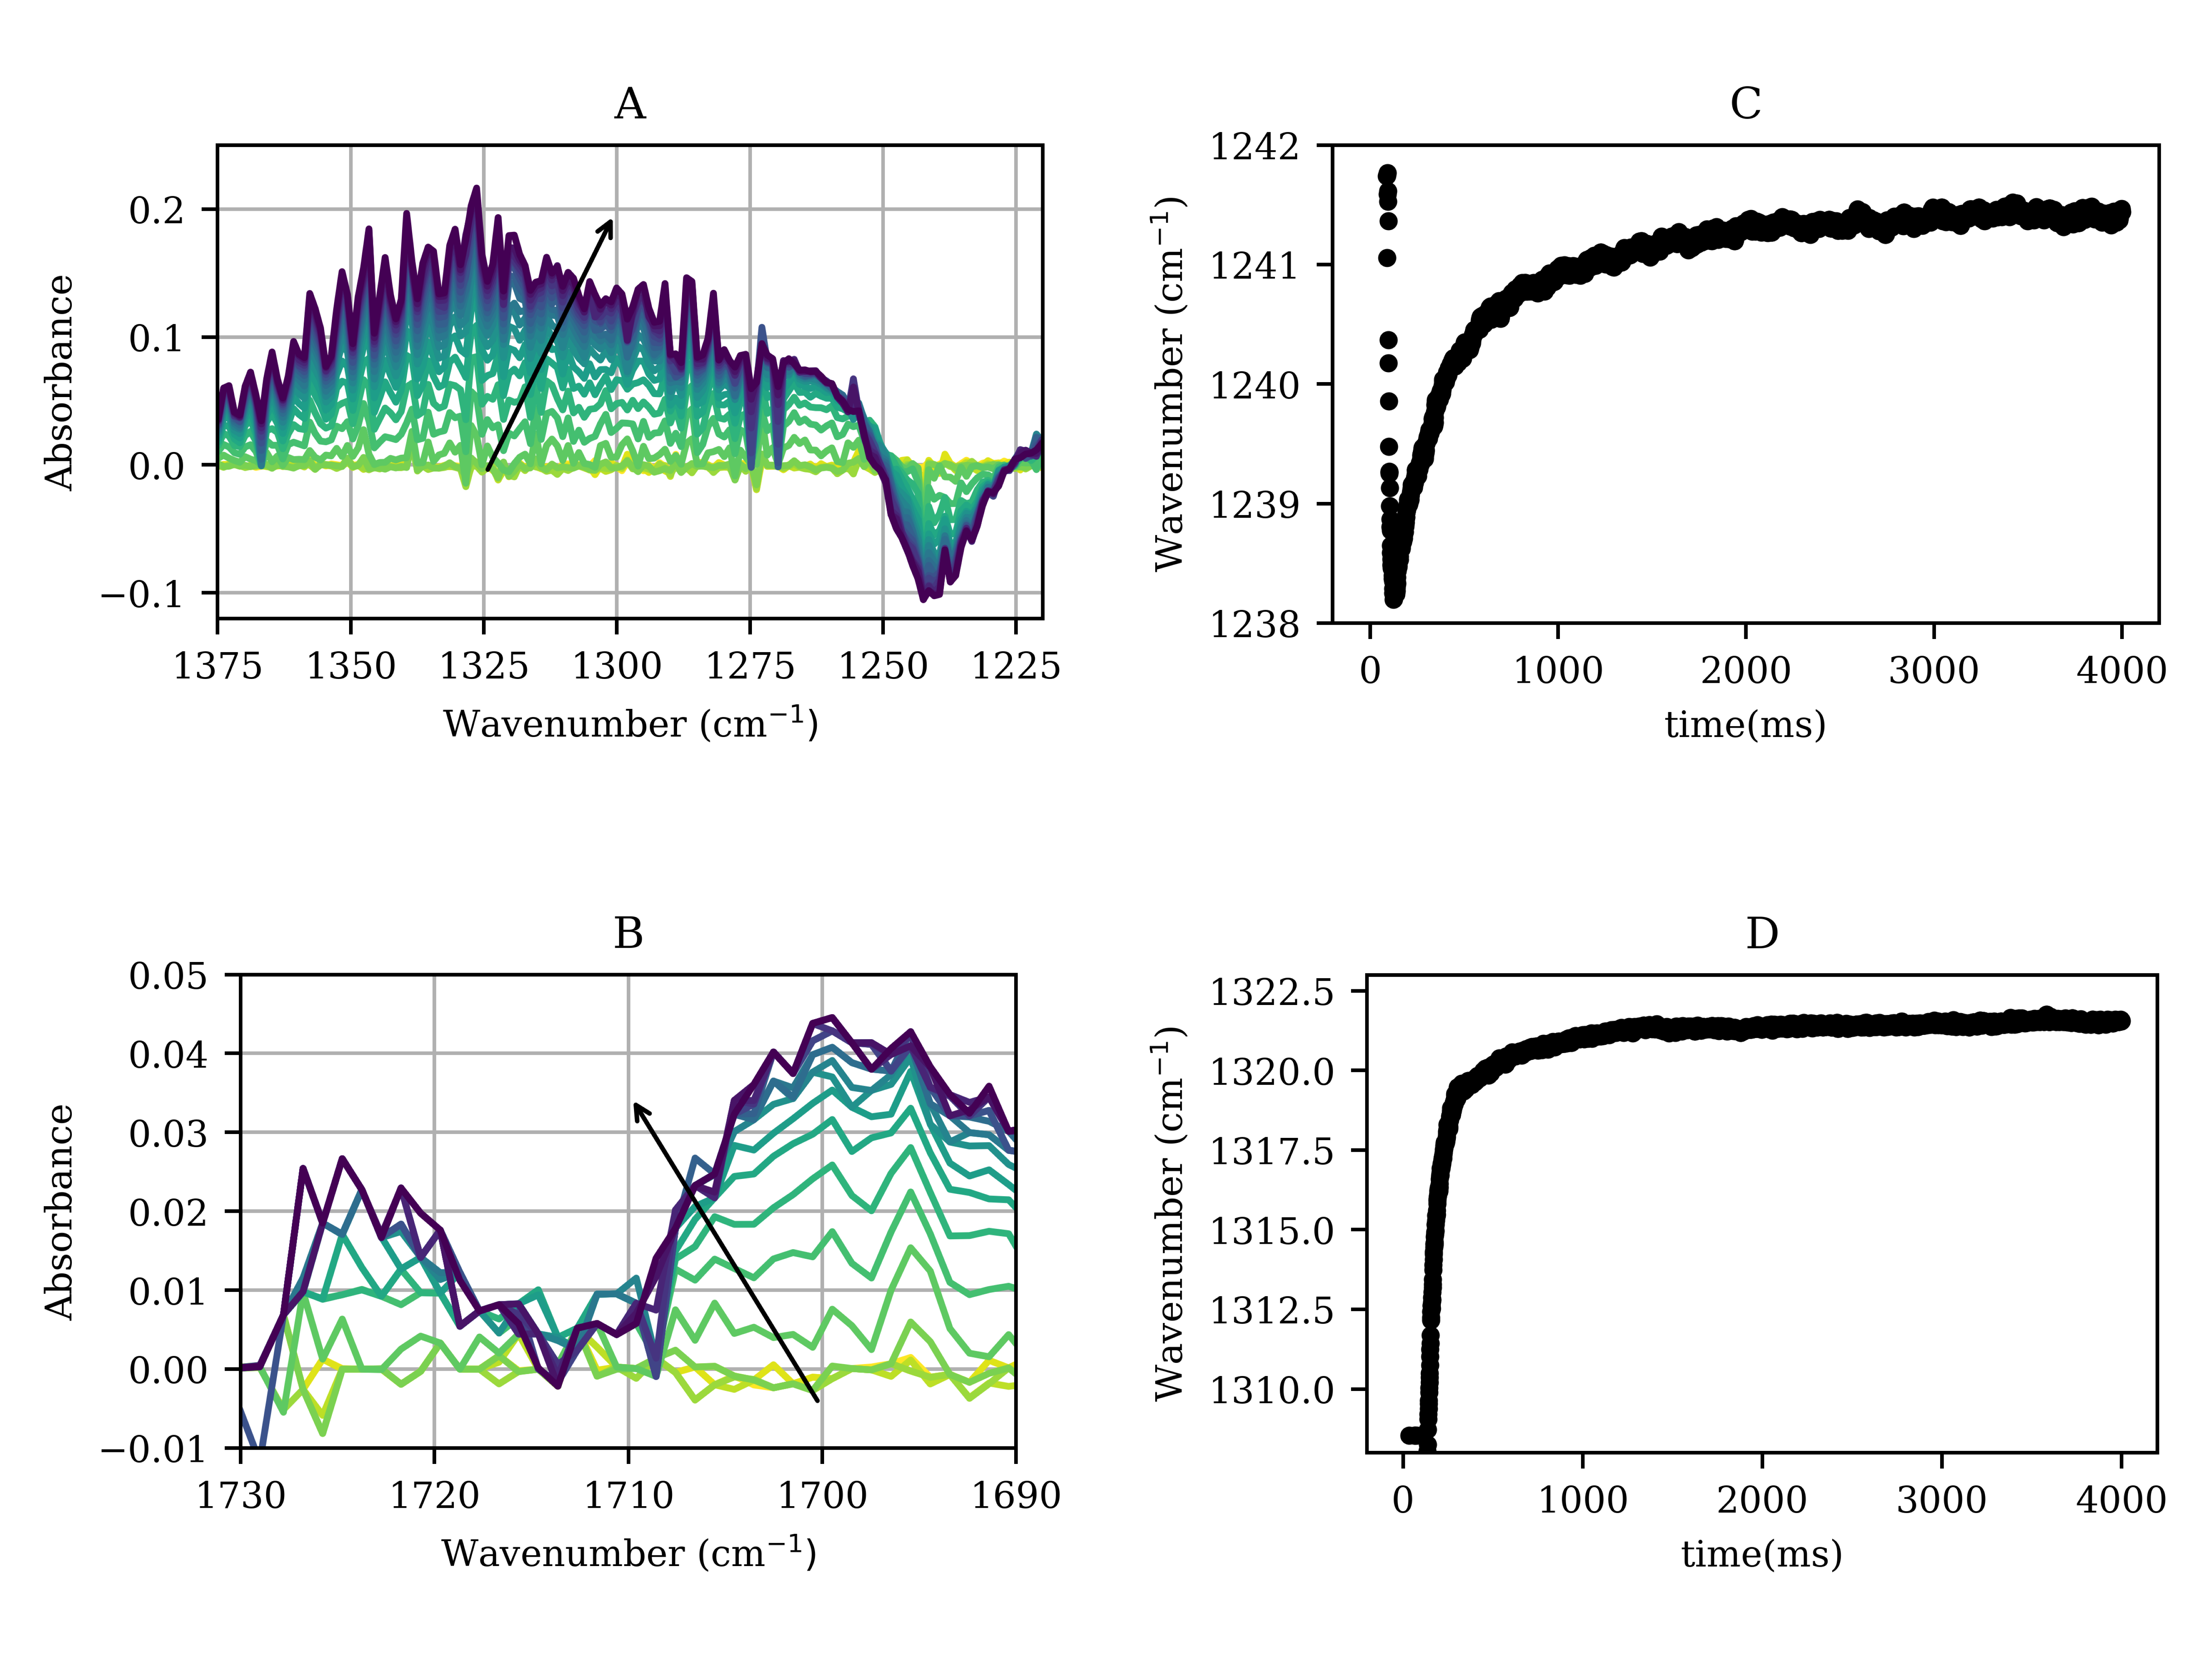
The absorption spectrum of the humid brush is shown in Figure 4. The chemical structure of poly(SPMA) can be seen in the inset of Figure 3. Note that all IR spectra shown are relative to the brush in the dry state, and therefore only show peaks changing in absorption with humidity, as opposed to all absorbing peaks. This is chosen because the alignment of the crystal is not fully reproducible. Realigning between a reference and signal measurement would introduce alignment artifacts in the absorbance signal. Additionally, this way the time between the reference and absorption measurement is smaller, minimising laser or sensor drift effects on the measurement. We focus on three peaks: the negative peak at is attributed to be a \ceC-O ester stretch and the peak at is characteristic of the ester carbonyl (\ceC=O) stretch. The peak corresponds to a sulfonate S=O stretch in anhydrous alkyl sulfonic acids. However, the peak grows in the positive direction (increased absorbance) with increasing humidity, as opposed to an expected negative band. Time-resolved IR spectra in steps of of these three peaks are shown in Figure 5 A and B. An animated plot of the developing spectrum in a higher temporal resolution can be found in SI-2. Interestingly, the bond develops as two peaks initially, one at and one at . Throughout the spectrum, a series of sharp peaks can be seen on top of the ingrowing peaks at a spacing of . These peaks are constant in time, and grow in with the underlying spectrum. This is characteristic for a signal going through a limited bandwidth medium, such as the ATR crystal. [44, 45]
Tracing the positions in time by fitting a Gaussian curve to the and peaks and logging the position, it can be seen in Figure 5 C and D that both peaks increase in wavenumber as humidity increases. Additionally, the peak reaches equilibrium quicker than the peak. Blueshift upon hydrogen bonding is typical for stretching modes as opposed to bending modes which typically red shift upon hydrogen bond formation[46], pointing towards bending modes for both the and the peaks.
3.2 Ellipsometry
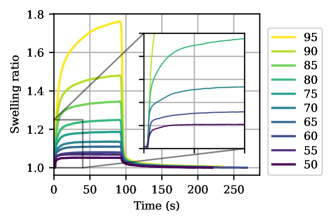
Figure 6 shows the results of the swelling experiments as measured by in-situ ellipsometry. The brushes are initially exposed to dry nitrogen and allowed to dry. At , the solenoid valve system switches the flow through the measurement cell to humidified nitrogen. After , the flow is switched back to dry nitrogen. Meanwhile, the brush thickness is measured by ellipsometry over time. This experiment is repeated for a range of humidity values between 50 and 95%. The measured thicknesses are converted to swelling ratios by dividing them by the dry height.
The (equilibrium) swelling ratios exhibit a strong superlinear relation with the humidity, in accordance with previous studies [34]; at low humidity (<60%), there is barely any swelling, while above that, small changes in humidity result in large changes in swelling. For these higher humidities, an equilibrium is not fully reached within the timeframe of the measurement.
The swelling results suggest the absorption dynamics are slower to reach equilibrium for higher humidities, while desorption is relatively quicker for brushes swollen at higher humidities. Furthermore, for low humidity values, the swelling curves show noticeable kinks, which could indicate anomalous diffusion in the brush. This is seen more clearly in the inset in Figure 6.
For simple diffusion polymer swelling systems, the Berens-Hopfenberg model [47] (Equation 4) is often used to describe the swelling characteristics. The model describes the swelling characteristics as a sum of a diffusive component and a chain relaxation component. In this equation, , , and represent the total, diffusive, and relaxation components of the swelling, is the diffusion coefficient of the solvent in the polymer matrix, is the time, is the thickness of the brush, and is the relaxation time constant of the polymer matrix [48, 49, 50].
| (4) |
A fit of the Berens-Hopfenberg model to the swelling curves in Figure 6 is shown in SI-1, but does not adequately fit the data. As more complex transport models risk over-describing the data, we choose not to fit our data to a model.
The timescale for swelling and the levelling off of the signal is much shorter for infrared spectroscopy compared to ellipsometry. This is explained by the nature of the measurement. In infrared spectroscopy, not the water absorption but the change of absorption of the brush is measured. This shift happens before the brush is saturated because this shift is dependent on the interaction of the brush with the absorbed water. Once brush-water interaction is saturated, the brush continues to swell because this is energetically favourable. However, the swelling no longer alters the brush absorption, as the studied bonds are already fully engaged in water-brush interaction.
4 Conclusion and outlook
We have shown the application of a home-built high sampling rate infrared spectrometer in the study of a highly reproducible chemical system. The transients of brush dynamics using infrared spectroscopy occur at a different timescale than the total brush swelling, as is shown from the ellipsometry reference experiment. While this discrepancy is phenomenologically explained, further inference on the physics of solvent-induced polymer brush swelling dynamics from both ellipsometry and infrared spectroscopy data requires a transport model. While more elaborate models are available in the literature, these were not used because they might overdescribe the data. The spectrometer setup, and DF-IR, is highly suitable towards the study of a single transient, or the study of a spectrum for a highly reproducible system.
Acknowledgements
The authors would like to thank Jasper Lozeman and Matthias Godejohann for their insightful input on infrared spectroscopy. Furthermore, we thank Joshua Loessberg-Zahl, Nieck Benes, and Guido Ritsema van Eck for discussions on transport theory in thin polymer layers.
References
- [1] Angel Cuesta “ATR-SEIRAS for Time-Resolved Studies of Electrode–Electrolyte Interfaces” In Current Opinion in Electrochemistry 35, 2022, pp. 101041 DOI: 10.1016/j.coelec.2022.101041
- [2] Wolfgang Uhmann, Andreas Becker, Christoph Taran and Friedrich Siebert “Time-Resolved FT-IR Absorption Spectroscopy Using a Step-Scan Interferometer” In Applied Spectroscopy 45.3 SAGE Publications Ltd STM, 1991, pp. 390–397 DOI: 10.1366/0003702914337128
- [3] T.. Johnson, A. Simon, J.. Weil and G.. Harris “Applications of Time-Resolved Step-Scan and Rapid-Scan FT-IR Spectroscopy: Dynamics from Ten Seconds to Ten Nanoseconds” In Applied Spectroscopy 47.9 SAGE Publications Ltd STM, 1993, pp. 1376–1381 DOI: 10.1366/0003702934067397
- [4] Jerome Faist et al. “Quantum Cascade Laser” In Science 264.5158 American Association for the Advancement of Science, 1994, pp. 553–556 DOI: 10.1126/science.264.5158.553
- [5] M. Razeghi et al. “Quantum Cascade Lasers: From Tool to Product” In Optics Express 23.7 Optica Publishing Group, 2015, pp. 8462–8475 DOI: 10.1364/OE.23.008462
- [6] Andreas Hugi, Richard Maulini and Jérôme Faist “External Cavity Quantum Cascade Laser” In Semiconductor Science and Technology 25.8, 2010, pp. 083001 DOI: 10.1088/0268-1242/25/8/083001
- [7] David T.. Childs et al. “Sensitivity Advantage of QCL Tunable-Laser Mid-Infrared Spectroscopy Over FTIR Spectroscopy” In Applied Spectroscopy Reviews 50.10 Taylor & Francis, 2015, pp. 822–839 DOI: 10.1080/05704928.2015.1075208
- [8] Alicja Dabrowska, Stefan Lindner, Andreas Schwaighofer and Bernhard Lendl “Mid-IR Dispersion Spectroscopy – A New Avenue for Liquid Phase Analysis” In Spectrochimica Acta Part A: Molecular and Biomolecular Spectroscopy 286, 2023, pp. 122014 DOI: 10.1016/j.saa.2022.122014
- [9] Gustavo Villares, Andreas Hugi, Stéphane Blaser and Jérôme Faist “Dual-Comb Spectroscopy Based on Quantum-Cascade-Laser Frequency Combs” In Nature Communications 5.1 Nature Publishing Group, 2014, pp. 5192 DOI: 10.1038/ncomms6192
- [10] Markus Geiser, Raphael Horvath and Jakob Hayden “QCL Dual-Comb Spectroscopy Matures for Applications” In PhotonicsViews 18.1, 2021, pp. 36–39 DOI: 10.1002/phvs.202100024
- [11] Yamuna Phal, Kevin Yeh and Rohit Bhargava “Design Considerations for Discrete Frequency Infrared Microscopy Systems” In Applied Spectroscopy 75.9 SAGE Publications Ltd STM, 2021, pp. 1067–1092 DOI: 10.1177/00037028211013372
- [12] Thomas Schädle and Boris Mizaikoff “Mid-Infrared Waveguides: A Perspective” In Applied Spectroscopy 70.10 SAGE Publications Ltd STM, 2016, pp. 1625–1638 DOI: 10.1177/0003702816659668
- [13] Xiaofeng Wang et al. “Ultra-Sensitive Mid-Infrared Evanescent Field Sensors Combining Thin-Film Strip Waveguides with Quantum Cascade Lasers” In Analyst 137.10 Royal Society of Chemistry, 2012, pp. 2322–2327 DOI: 10.1039/C1AN15787F
- [14] K.. Andrew Chan, Xize Niu, Andrew J. Mello and Sergei G. “Rapid Prototyping of Microfluidic Devices for Integrating with FT-IR Spectroscopic Imaging” In Lab on a Chip 10.16 Royal Society of Chemistry, 2010, pp. 2170–2174 DOI: 10.1039/C004246C
- [15] Monpichar Srisa-Art, Scott D. Noblitt, Amber T. Krummel and Charles S. Henry “IR-Compatible PDMS Microfluidic Devices for Monitoring of Enzyme Kinetics” In Analytica Chimica Acta 1021, 2018, pp. 95–102 DOI: 10.1016/j.aca.2018.03.006
- [16] Adeline Perro et al. “Combining Microfluidics and FT-IR Spectroscopy: Towards Spatially Resolved Information on Chemical Processes” In Reaction Chemistry & Engineering 1.6 Royal Society of Chemistry, 2016, pp. 577–594 DOI: 10.1039/C6RE00127K
- [17] K.. Chan et al. “Chemical Imaging of Microfluidic Flows Using ATR-FTIR Spectroscopy” In Lab on a Chip 9.20 The Royal Society of Chemistry, 2009, pp. 2909–2913 DOI: 10.1039/B909573J
- [18] Peter Hollins “Infrared Reflection–Absorption Spectroscopy” In Encyclopedia of Analytical Chemistry Chichester, UK: John Wiley & Sons, Ltd, 2006, pp. a5605 DOI: 10.1002/9780470027318.a5605
- [19] S.. Milner “Polymer Brushes” In Science 251.4996, 1991, pp. 905–914 DOI: 10.1126/science.251.4996.905
- [20] B Zhao and W. Brittain “Polymer Brushes: Surface-Immobilized Macromolecules” In Progress in Polymer Science 25.5, 2000, pp. 677–710 DOI: 10.1016/S0079-6700(00)00012-5
- [21] William J. Brittain and Sergiy Minko “A Structural Definition of Polymer Brushes” In Journal of Polymer Science Part A: Polymer Chemistry 45.16, 2007, pp. 3505–3512 DOI: 10.1002/pola.22180
- [22] Adnan Murad Bhayo, Yang Yang and Xiangming He “Polymer brushes: Synthesis, characterization, properties and applications” In Progress in Materials Science 130, 2022, pp. 101000 DOI: https://doi.org/10.1016/j.pmatsci.2022.101000
- [23] Danyang Li, Lizhou Xu, Jing Wang and Julien E. Gautrot “Responsive Polymer Brush Design and Emerging Applications for Nanotheranostics” In Advanced Healthcare Materials 10.5, 2021, pp. 2000953 DOI: https://doi.org/10.1002/adhm.202000953
- [24] Svyatoslav Nastyshyn et al. “Temperature-Responsive Polymer Brush Coatings for Advanced Biomedical Applications” In Polymers 14.19, 2022 DOI: 10.3390/polym14194245
- [25] Yuji Higaki, Motoyasu Kobayashi, Daiki Murakami and Atsushi Takahara “Anti-Fouling Behavior of Polymer Brush Immobilized Surfaces” In Polymer Journal 48.4, 2016, pp. 325–331 DOI: 10.1038/pj.2015.137
- [26] Anna M.. Maan, Anton H. Hofman, Wiebe M. Vos and Marleen Kamperman “Recent Developments and Practical Feasibility of Polymer-Based Antifouling Coatings” In Advanced Functional Materials 30.32, 2020, pp. 2000936 DOI: https://doi.org/10.1002/adfm.202000936
- [27] T. Kreer “Polymer-Brush Lubrication: A Review of Recent Theoretical Advances” In Soft Matter 12.15 The Royal Society of Chemistry, 2016, pp. 3479–3501 DOI: 10.1039/C5SM02919H
- [28] Wenqing Yan, Shivaprakash N. Ramakrishna, Matteo Romio and Edmondo M. Benetti “Bioinert and Lubricious Surfaces by Macromolecular Design” In Langmuir 35.42, 2019, pp. 13521–13535 DOI: 10.1021/acs.langmuir.9b02316
- [29] Andrés B. Sánchez-Alvarado, Jackeline Iturbe-Ek, Narsimha Mamidi and Alan O. Sustaita “Polymer Brush-Based Thin Films via Cu(0)-Mediated Surface-Initiated Atom Transfer Radical Polymerization for Sensing Applications” In ACS Applied Polymer Materials 3.11, 2021, pp. 5339–5354 DOI: 10.1021/acsapm.1c01037
- [30] John J. Keating, Joseph Imbrogno and Georges Belfort “Polymer Brushes for Membrane Separations: A Review” In ACS Applied Materials & Interfaces 8.42 American Chemical Society, 2016, pp. 28383–28399 DOI: 10.1021/acsami.6b09068
- [31] Elif Nur Durmaz et al. “Polyelectrolytes as Building Blocks for Next-Generation Membranes with Advanced Functionalities” In ACS Applied Polymer Materials 3.9, 2021, pp. 4347–4374 DOI: 10.1021/acsapm.1c00654
- [32] Guido C. Ritsema van Eck, Leonardo Chiappisi and Sissi Beer “Fundamentals and Applications of Polymer Brushes in Air” In ACS Applied Polymer Materials 4.5, 2022, pp. 3062–3087 DOI: 10.1021/acsapm.1c01615
- [33] Casey J. Galvin, Michael D. Dimitriou, Sushil K. Satija and Jan Genzer “Swelling of Polyelectrolyte and Polyzwitterion Brushes by Humid Vapors” In Journal of the American Chemical Society 136.36, 2014, pp. 12737–12745 DOI: 10.1021/ja5065334
- [34] Guido C. Ritsema van Eck et al. “Vapor Swelling of Polymer Brushes Compared to Nongrafted Films” In Langmuir American Chemical Society, 2022 DOI: 10.1021/acs.langmuir.2c01889
- [35] Rens J. Horst et al. “Swelling of Poly(Methyl Acrylate) Brushes in Acetone Vapor” In Langmuir 36.40 American Chemical Society, 2020, pp. 12053–12060 DOI: 10.1021/acs.langmuir.0c02510
- [36] Özlem Kap et al. “Nonequilibrium Configurations of Swelling Polymer Brush Layers Induced by Spreading Drops of Weakly Volatile Oil” In The Journal of Chemical Physics 158.17, 2023, pp. 174903 DOI: 10.1063/5.0146779
- [37] Wojciech Ogieglo et al. “In Situ Ellipsometry Studies on Swelling of Thin Polymer Films: A Review” In Progress in Polymer Science 42, Topical Issue on Polymer Physics, 2015, pp. 42–78 DOI: 10.1016/j.progpolymsci.2014.09.004
- [38] Kristianne Tempelman “Swelling of Thin Polymer Films: Understanding the Mechanisms and Dynamics”, 2019 DOI: 10.3990/1.9789036547093
- [39] J.. Papanu, D.. Soane (Soong), A.. Bell and D.. Hess “Transport Models for Swelling and Dissolution of Thin Polymer Films” In Journal of Applied Polymer Science 38.5, 1989, pp. 859–885 DOI: 10.1002/app.1989.070380509
- [40] Lars B. Veldscholte and Sissi de Beer “Scalable Air-Tolerant L-Volume Synthesis of Thick Poly(SPMA) Brushes Using SI-ARGET-ATRP” In ACS Applied Polymer Materials 5.9 American Chemical Society, 2023, pp. 7652–7657 DOI: 10.1021/acsapm.3c01628
- [41] Jasper J.. Lozeman et al. “Modular Microreactor with Integrated Reflection Element for Online Reaction Monitoring Using Infrared Spectroscopy” In Lab on a Chip 20.22 The Royal Society of Chemistry, 2020, pp. 4166–4174 DOI: 10.1039/D0LC00704H
- [42] Lars B. Veldscholte and Sissi Beer “OpenHumidistat: Humidity-controlled Experiments for Everyone” In HardwareX 11, 2022, pp. e00288 DOI: 10.1016/j.ohx.2022.e00288
- [43] Frank L. Pedrotti, Leno M. Pedrotti and Leno S. Pedrotti “Introduction to Optics” In Higher Education from Cambridge University Press, 2017 DOI: 10.1017/9781108552493
- [44] Daimay Lin-Vien, Norman B. Colthup, William G. Fateley and Jeanette G. Grasselli “The Handbook of Infrared and Raman Characteristic Frequencies of Organic Molecules” Elsevier, 1991
- [45] George Socrates “Infrared and Raman Characteristic Group Frequencies: Tables and Charts” John Wiley & Sons, 2004
- [46] H Susi “[17] The Strength of Hydrogen Bonding: Infrared Spectroscopy” In Methods in Enzymology 26, Enzyme Structure, Part C Academic Press, 1972, pp. 381–391 DOI: 10.1016/S0076-6879(72)26019-0
- [47] A. Berens and H. Hopfenberg “Diffusion and Relaxation in Glassy Polymer Powders: 2. Separation of Diffusion and Relaxation Parameters” In Polymer 19.5, 1978, pp. 489–496 DOI: 10.1016/0032-3861(78)90269-0
- [48] John Crank “The Mathematics of Diffusion” Clarendon Press, 1979
- [49] Wojciech Ogieglo, Herbert Wormeester, Matthias Wessling and Nieck E. Benes “Temperature-Induced Transition of the Diffusion Mechanism of n-Hexane in Ultra-Thin Polystyrene Films, Resolved by in-Situ Spectroscopic Ellipsometry” In Polymer 54.1, 2013, pp. 341–348 DOI: 10.1016/j.polymer.2012.11.038
- [50] T. Visser and M. Wessling “When Do Sorption-Induced Relaxations in Glassy Polymers Set In?” In Macromolecules 40.14 American Chemical Society, 2007, pp. 4992–5000 DOI: 10.1021/ma070202g