2023
[1]\fnmAlina \surGlaubitz
[1]\orgdivDepartment of Mathematics, \orgnameDartmouth College, \cityHanover, \postcode03755, \stateNH, \countryUSA
2]\orgdivDepartment of Biomedical Data Science, \orgnameGeisel School of Medicine at Dartmouth, \cityLebanon, \postcode03756, \stateNH, \countryUSA
Social Dilemma of Non-Pharmaceutical Interventions
Abstract
In fighting infectious diseases posing a global health threat, ranging from influenza to Zika, non-pharmaceutical interventions (NPI), such as social distancing and face covering, remain mitigation measures public health can resort to. However, the success of NPI lies in sufficiently high levels of collective compliance, otherwise giving rise to waves of infection incidences that are not only driven by pathogen evolution but also changing vigilance in the population. Here we show that compliance with each NPI measure can be highly dynamic and context-dependent during an ongoing epidemic, where individuals may prefer one to another or even do nothing, leading to intricate temporal switching behavior of NPI adoptions. By characterizing dynamic regimes through the perceived costs of NPI measures and their effectiveness in particular regarding face covering and social distancing, our work offers new insights into overcoming barriers in NPI adoptions.
keywords:
Disease mitigation, Swiss cheese model, behavioral epidemiology, game theory1 Introduction
The emergence of new infectious diseases, like Zika petersen2016zika , Ebola leroy2005fruit , COVID-19 Chams2020 and Mpox Banuet2023 ; Liu2023 , presents a great challenge to global health and humanity. Mathematical models have become an increasingly important part of the understanding and the fight against infectious diseases anderson1991infectious . For an overview see for example Ref. lloyd2017infectious . These models help inform our response to these threats. Given the time required to develop and distribute pharmaceutical solutions like vaccines, we often have to rely on non-pharmaceutical interventions (NPIs) such as face covering and social distancing in the early stages of an epidemic. However, the effectiveness of these NPIs heavily depends on public compliance and adherence, making human behavior a critical factor in controlling disease spread. Therefore, it is critical to integrate the behavioral response into mathematical models to gain a deeper understanding of the initial spread of infectious diseases.
Notably there has been a growing body of work on the effect of social factors in epidemiology. For an overview of disease-behavior interaction models that have made an impact in this field, see bauch2013social ; verelst2016behavioural and references therein. From the influence of vaccines and vaccine compliance Bauch_PLoSCB12 to the role of disease awareness Wang_SR16 , these models have made important progress to understanding the role of behavior in epidemiology Fu_PRSB11 ; Reluga_MB06 ; Wang_PR16 . It has been shown that these interactions can lead to interesting dynamics, like the hysteresis effect chen2019imperfect , by using evolutionary game theory to model how behaviors evolve under the interplay between social influence and self-interest bauch2005imitation ; Fu_PRSB11 ; arefin2020vaccinating . The use of replicator dynamics has been particularly effective in exploring social learning processes and the diffusion of behaviors across various societal challenges, from enforcing norms through peer punishment sigmund2001reward to promoting responsible antibiotic usage chen2018social . In particular, prior work has demonstrated that integrating evolutionary game theory with epidemiological processes can be fruitful in shedding light on disease interventions Fu_PRSB11 ; chen2019imperfect ; Saad-Roy2023 ; Traulsen2023costs .
Undoubtedly, the COVID-19 pandemic has led to a further increase of research into the influence of NPIs Flaxman2020 ; perra2021non as well as vaccination strategies Wagner2021 on epidemics. Unlike pharmaceutical measures like vaccination, NPIs like social distancing and mask-wearing require individuals to continually assess the need to adhere to such measures Townsend2020 ; Saad-Roy2023 ; Morsky2023 . Thus, it is necessary to account for the socio-economic consequences of the disease and control measures nicola2020socio . Social distancing has been modeled as a game where individuals weigh the risk of the disease against the cost of social distancing to find the Nash equilibrium in the consistent effort to practice social distancing reluga2010game . Optimal control theory has been applied to inform social distancing and lockdown efforts maharaj2012controlling ; huberts2020optimal . Additional efforts have been made to understand the effect of social distancing on the COVID-19 epidemic aleta2020modelling ; kissler2020projecting , emphasizing the importance of aligning each individual’s goals with those of society as a whole. Further work has focused on modeling vaccination strategies Kuga2020 ; Liu2022 , employing game theory to reveal complex decision-making dynamics. While this previously mentioned work mostly focused on homogeneous populations, additional work has been done in the context of networks, examining the effects of behavioral changes and lockdowns Alam2021 ; Alam2022 , as well as the role of social distancing and adaptive behavior in curbing disease transmission Karlson2020 ; Arthur2021 . Weitz Weitz2020 emphasizes the role of awareness in disease mitigation, and Chen Chen2022 provides empirical evidence of NPI effectiveness from China’s COVID-19 response. Additionally, work has been done to understand how face covering and asymptomatic transmission changes the spread of infectious diseases Qiu2022 ; Espinoza2021 ; Espinoza2022 .
Moreover, optimal control theory has been applied to model the implementation of mandated vaccination and lockdowns, aiming to minimize outbreak costs through centralized planning sethi1978optimal ; abakuks1974optimal ; abakuks1973optimal ; wickwire1975optimal . Despite providing valuable insights into achieving population-wide optimal outcomes Morris2021 , the practical implementation of these strategies can be limited by failing to ensure widespread compliance. Our previous work glaubitz2020oscillatory emphasizes the role of individual compliance and identifies an “oscillatory tragedy of the commons” in social distancing dynamics glaubitz2020oscillatory by implementing bounded rationality simon1990bounded and loss aversion tversky1992advances .
This work builds upon our prior study glaubitz2020oscillatory and explores the intricate effects of a dual behavioral response on pandemic responses. Expanding the previous model, we introduce face covering (FC) as a less strict form of NPI compared to social distancing. FC serves as a second type of intervention strategy, contributing to a ‘Swiss cheese’ model of protection. Our findings reveal that FC as a third strategy next to social distancing (SD) and no social distancing (NSD) displays a significantly different behavior than SD. While SD is generally preferred over NSD once a threshold is passed, FC is preferred over NSD only within a range between two disease prevalence thresholds. Once the infections pass the smaller threshold, FC is preferred, but once the second threshold is passed, NSD is preferred over FC again. Additionally, FC is only adopted if its effectiveness is large enough compared to SD. Once the relative effectiveness of FC drops below a threshold, it does not get adopted at all. Moreover, we show how individuals generally opt for either SD or FC, without reverting to more stringent measures (SD) once FC is preferred.
Model and Methods
We incorporate into an epidemiological model the human behavior choices of NPI measures, using the replicator dynamics to account for the decision whether to SD, FC, or NSD. This significantly extends our prior work glaubitz2020oscillatory and results in a ‘Swiss cheese’ model of protection with a dual behavioral response.
Each individual is either susceptible (S), infected (I) or recovered (R). Those who are susceptible have a choice in how they respond to the threat of infection: they can practice SD, FC, or NSD. A susceptible without face covering gets infected in an encounter with an infected with rate , a susceptible with face covering gets only infected with rate . At any given moment, an infected recovers with rate . To account for the force of infection, we use a well-mixed population model. Extending this model to networked populations is straightforward Qiu2022 .
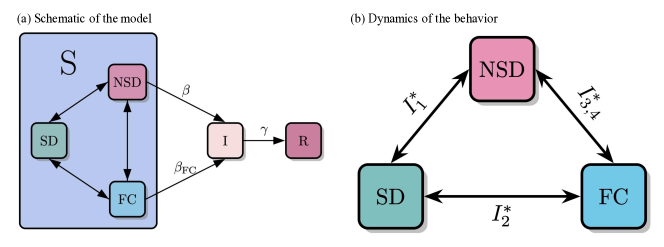
We denote the proportion of susceptible individuals at time by , the proportion of infected by , and the proportion of removed by . Furthermore, we denote by the proportion of susceptible individuals that practice SD, by the proportion of people in FC and by the proportion of in NSD. The initial conditions we denote by as well as .
A susceptible individual updates their NPI choices (behavioral strategies consisting of NSD, SD, and FC) based on a simple introspection of the costs associated with each NPI choice. Thus, by we denote the payoff of social distancing, by the payoff of wearing a face covering and by the payoff of no social distancing and no face covering. Social distancing in our model has cost at each time . Thus, we have
depends on two factors: the cost of infection that we denote by and the risk of infection. The risk of infection in time when NSD is given by
Thus, the payoff of NSD is given by
Wearing face covering has cost and analogous to we therefore have
The dynamics of our model are given by the following system of ODEs:
| (1) | ||||
as well as
| (2) | ||||
Here, is a responsiveness parameter and is a rationality parameter. Together, these parameters determine how fast the susceptible population adapts their NPI strategies to change in the prevalence of infected (see the Supplementary Information for details).
Results
The adoption behavior dynamics of the model are governed by three prevalence thresholds :
| (3) |
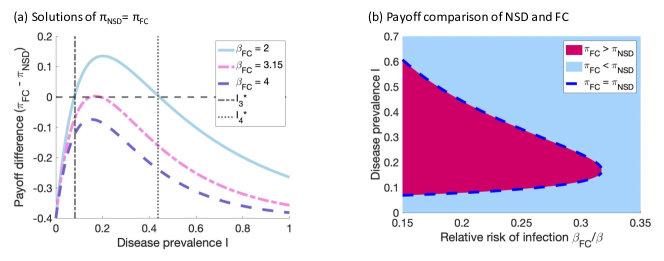
Simply put, when the infection rate () is below these thresholds (), people find it more beneficial not to engage in social distancing or face covering. They lean towards ’normal behavior’ (NSD) or using face coverings as a lighter precaution (FC) compared to SD. However, once the infection rate crosses these thresholds (), SD becomes the more attractive option due to its higher benefits in preventing disease spread.
The situation gets more complex with the third threshold, which involves a comparison between not practicing any social distancing (NSD) and opting for lighter measures (FC). This threshold, defined by two possible points, and , creates a scenario where for disease prevalence levels between these two points, wearing face coverings is more advantageous than not doing anything at all. Specifically, for lower than , people don’t see the need for face coverings. Between and , face coverings are adopted as they offer a better payoff compared to doing nothing. However, once surpasses , the incentive to continue wearing face coverings diminishes, and people stop using them. Furthermore, if FC is not effective enough compared to SD, ( too large compared to ), neither threshold exists and FC is never preferred over NSD. (See Figure 2 for an illustration.)
To determine when FC cannot be the favored strategy anymore, we define as the RHS of (3). This function attains its maximum for
.
When the peak of this function is higher than the LHS of (3) (), it means that there are two specific prevalence levels, and , between which FC is preferred over NSD. If the peak is lower than this ratio, it suggests that face coverings do not offer a better payoff compared to NSD, essentially making them undesired.
To find out the least effectiveness level of face coverings (expressed as ) for them to be considered a better strategy, we calculate the maximum value of and equate it to . Solving this equation gives us a critical threshold as the solution of
| (4) |
indicating the minimum effectiveness level required for face coverings to be beneficial. If the effectiveness of face coverings falls below this threshold, they are not considered a preferred strategy. This analysis helps us pinpoint the conditions under which individuals decide between wearing face coverings and not doing anything to prevent infection spread, providing a clearer picture of understanding NPI behavior choices during epidemics.
Additionally, if , this implies that either or . To see why that is, note that
For , this implies
Therefore, then solves (3) and if holds then we either have or . An illustration of these cases can be seen in Figure 3. Note that we will ignore the null set where or for this analysis.
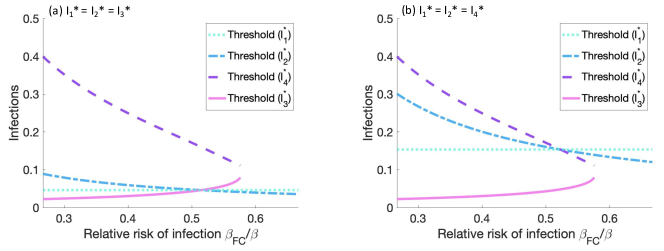
In the first scenario, where we compare whether holds or does not hold, the thresholds can only be ordered in one of the following ways:
In the second scenario, where we compare whether holds or does not hold, we can have
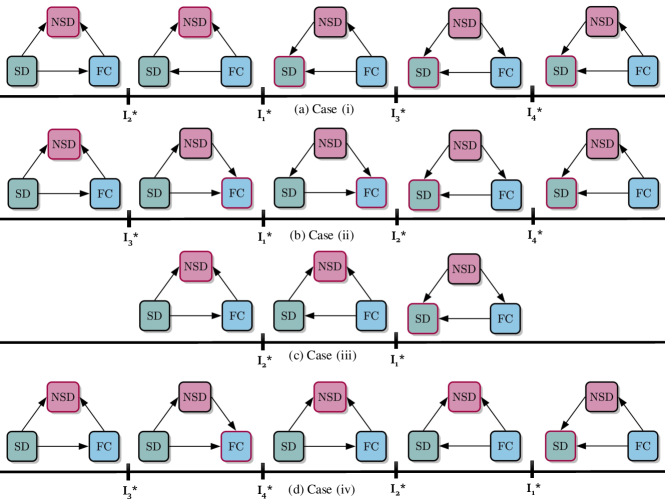
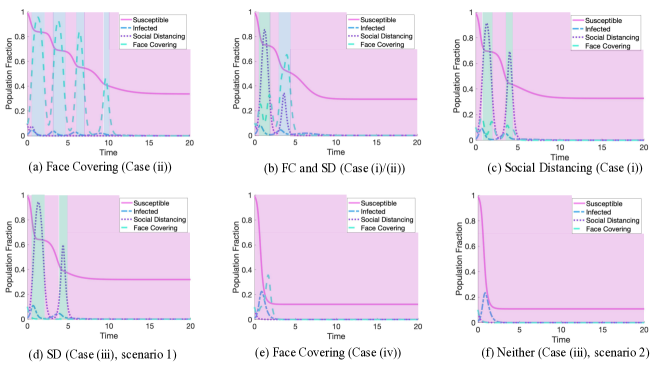
To understand the adoption dynamics of NPI measures in each of the cases, see Figure 4. Here we see the order of predominant strategies for all four cases. In case (i), the infection is mitigated through SD similar to the SIR-SD model glaubitz2020oscillatory . In case (ii), FC is the predominant strategy for mitigation, but players might also practice SD if the infection becomes more prevalent. In particular, we might see SD in the first stages/oscillations of the epidemic here and FC in the later stages. In case (iii), FC is never adopted by the population and SD is adopted in the first scenario, but not the second. In case (iv), only FC will ever be adopted as players stop FC before SD ever gets adopted.
Next, we want to derive the condition under which these scenarios occur. For the four thresholds to align, we need to be satisfied. Then, when fixing , we have a threshold such that for , the first scenario occurs and for the second scenario occurs. An illustration of this is given in Figure 5.
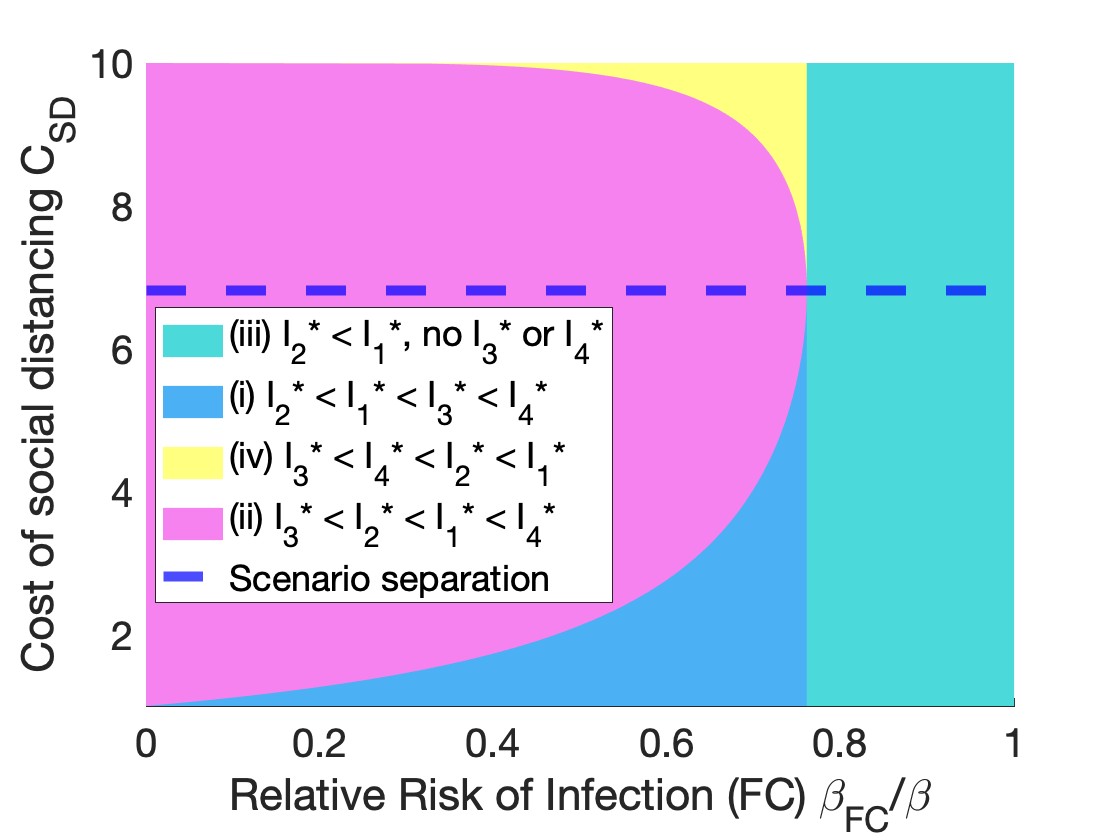
So, there are six different cases to be discussed, as demonstrated in Figure 6:
- Case (ii)
-
Case (ii)/(i)
Transition from SD to FC: As FC becomes less efficient (boundary of the magenta and blue area) and the cost of SD is still small enough, SD is followed by FC as a measure to slow down the infection (Figure 6 (b)).
-
Case (i)
SD Dominance with FC Remnants: For increasingly less efficient FC (blue area), there are still some remainders of FC, but SD is now predominantly controlling the disease dynamics (Figure 6 (c)).
-
Case (iii)
Exclusive Use of SD: In scenario 1, once FC is not efficient enough to provide any advantage (teal area), only SD as a measure is taken (Figure 6 (d)).
-
Case (iv)
Limited Use of FC: If FC is less efficient, but at the same time SD is very costly (yellow area), only a small level of FC is practiced (Figure 6 (e)).
-
Case (iii)
No Measures Adopted: In scenario 2, once FC does not provide any advantage anymore (teal area above scenario separation), players do not take any measures against infection (Figure 6 (f)).
These scenarios highlight a critical insight: once the population transitions to using face coverings due to their efficiency or as a compromise between no measures and the high cost of SD, there is no return to more stringent measures. This shift indicates a one-way trajectory in public health behavior during an epidemic, where once less stringent measures like FC are adopted due to their perceived efficiency or cost-effectiveness, the population does not revert to more restrictive interventions like SD, even as the dynamics of the infection and the relative efficiency of interventions evolve.
Discussion
This work extends upon previous studies on NPIs in infectious disease control by incorporating a dual behavioral response (SD and FC) compared to models typically with only one possible behavioral response for mitigating the spread of an infectious disease. However, the model also presents certain limitations that should be discussed.
Firstly, the model does not account for factors such as seasonality Wiemken2023 , the emergence of new strains through mutation Tanaka2002 , age-related differences in infection risk Arthur2023 , or heterogeneity in the costs associated with social distancing or face covering Espinoza2021 . Moreover, the influence of asymptomatic individuals Espinoza2022 and vaccination Jentsch2021 on the dynamics of disease spread and control measures are not considered. These factors could significantly impact the effectiveness and societal acceptance of NPIs.
Another limitation lies in the assumption that the costs of social distancing and mask-wearing are constant over time. In reality, as the pandemic evolves, public perception and tolerance of these measures may shift, leading to changes in compliance levels Shearston2021 . Additionally, the model does not incorporate top-down governmental interventions such as mask mandates or lockdown orders, which can play a crucial role in shaping population behavior.
The complexity of human behavior in response to the infection risks and intervention costs associated with infectious diseases has been investigated in related works. It has been shown that age differences in the cost of infection can introduce chaotic behavior into epidemiological models Arthur2023 . Previous studies have approached mask-wearing and social distancing from network Arthur2023 and game-theoretical perspectives Traulsen2023costs . Prior work has also incorporated vaccination Saad-Roy2023 and threshold-dependent tipping dynamics Morsky2023 into models of social distancing behavior, highlighting the complex interplay between various measures and the spread of infection.
Our work builds upon these contributions by introducing a model that considers two sorts of NPI measures — SD and FC — and their interaction. This approach allows for a more detailed exploration of the strategic decisions individuals make in the face of an epidemic and provides insights into how multiple concurrent measures (the so-called ‘Swiss cheese’ model of protection) can influence the trajectory of disease spread. The model reveals that once less stringent measures like FC are adopted due to their perceived benefits, populations do not revert to more restrictive interventions like SD, suggesting a one-way transition trajectory in NPI adoption behavior.
In conclusion, our model offers new insights into the dynamics of NPI adoption and compliance, particularly emphasizing that their context-dependent adoption preferences should be taken into account by top-down public health interventions. By extending the current work, future research aiming to overcome barriers in NPI adoptions can incorporate a broader range of factors that influence human behavior and disease spread. Understanding the interaction between different sorts of preventive measures and their impact on epidemiological outcomes will be crucial for designing effective public health strategies in response to current and future pandemics.
Supplementary information
If your article has accompanying supplementary file/s please state so here.
Authors reporting data from electrophoretic gels and blots should supply the full unprocessed scans for key as part of their Supplementary information. This may be requested by the editorial team/s if it is missing.
Please refer to Journal-level guidance for any specific requirements.
Acknowledgements
We are grateful for the support by the Bill & Melinda Gates Foundation (award no. OPP1217336), the NIH COBRE Program (grant no. 1P20GM130454), and the Burke Research Award.
If any of the sections are not relevant to your manuscript, please include the heading and write ‘Not applicable’ for that section.
Appendix A Perfect Adoption
An important factor in the SIR-SD-FC model is the assumption of bounded rationality. The parameters and in the model ensure that the model displays waves of infection. For , the population can react to each shift in the optimal strategy infinitely fast. This leads to the population always oscillating in smaller and smaller waves around the smaller of the thresholds until the population reaches herd immunity. So, there are two cases: (a) For relatively effective face covering (denoted as case (ii)/case(iii) in the main text), the fully rational population uses only face covering to fix the population at the threshold . (b) For less effective face covering (case (i)/case(iv)), the proportion of infected is fixed around until we reach herd immunity. For both cases, we obtain similar dynamics, given by the following ODEs
| (5) | ||||
with , , and with initial condition
Then, the total amount of people that get infected is given by
where denotes the Lambert function. Thus, in the case of perfect adoption, we can achieve
for the relative cost of social distancing and face covering compared to infection or . In particular, the model displays a similar behavior to the SIR-SD model in this scenario. We only either have SD or FC happening to mitigate the disease spread whenever we have a perfectly rational population as we do not observe overshooting of the infections over the lower threshold.
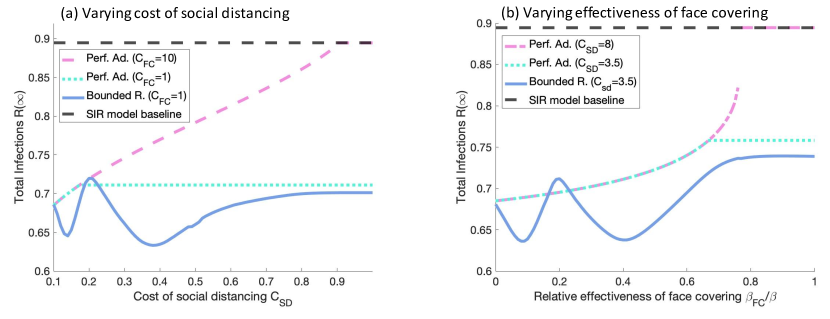
For perfect adoption, when varying the cost of SD, the total number of infections monotonically increases until the threshold for face covering is smaller than the threshold for social distancing (i.e. ). At this point, face covering becomes the strategy of choice and the total fraction of infected becomes constant. For expensive and/or ineffective face covering, this means that increases until we reach the SIR model baseline of infections. For the SIR-SD-FC model (denoted as bounded rationality in the figure), we observe oscillations similar to the SIR-SD model until the total number levels off less than or equal to the perfect adoption model. For an explanation, see glaubitz2020oscillatory . If, on the other hand, we vary the effectiveness of face covering (), there are similarities in the behavior: is increasing until (in this case) social distancing becomes the prominent strategy. The SIR-SD-FC model with bounded rationality displays oscillations until leveling off below the value for perfect adoption. However, there are also differences: The function now is convex and has a jump discontinuity at the point where face covering becomes ineffective. For any larger value, no measures are taken by the population and the total fraction of infections is equal to the SIR baseline model (if social distancing is too expensive as well). See Figure S1 for an illustration.
Face Covering
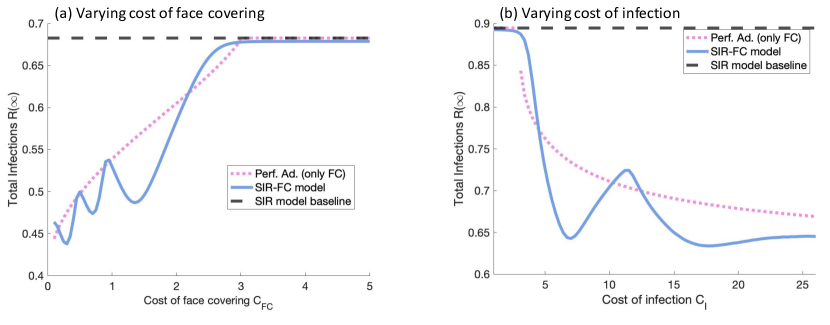
In this part, we want to show that face covering only displays bifurcation behavior if implemented along with social distancing. For this purpose, we look at the SIR-FC model, i.e. the SIR-SD-FC model with . This model displays very similar behavior to the full model. However, when we just change one parameter relating to face covering, there is no upper bound due to social distancing. Interestingly, for any of the parameters (), the total fraction of infections displays a jump discontinuity for contagious infections with slow recovery (see Figure S2).
Oscillations in total infections
Similar to glaubitz2020oscillatory , we want to emphasize here again that (i) the SIR-SD-FC model exhibits oscillations in the total infections (unlike the SIR or perfect adoption model) and (ii) the total infections are typically smaller for the model with bounded rationality than for the perfect adoption model. The explanation is related to the concept of herd immunity (HI). HI occurs when enough people have been infected to prevent the spread of infection. After HI is achieved, the total fraction of infected decreases. We refer to the total fraction of infected when herd immunity is reached as .
For to be small, has to be small. This can be achieved in several ways, like decreasing . So, reducing the perceived cost of social distancing or face covering or increasing the perceived cost of infection or the relative effectiveness of face covering decreases the infections. To understand the phenomenon of oscillations in , we note that reducing in the model with bounded rationality affects in two contradictory ways:
-
(i)
Reducing decreases the infections in each wave of infections and thus a decrease in . This causes a reduction in .
-
(ii)
Once the reduction of passes a threshold, this causes the development of a new wave of infections. Then, increases again before herd immunity is obtained which in turn increases . Therefore, increases when a new wave of infections develops.
This causes the oscillating behavior that we observe in Figures S1 and S2. When reducing , or respectively increasing , decreases at first (caused by smaller waves of infection and a smaller ) followed by an increase (induced by a new wave of infections that causes an increase in ).
Additionally, we observe that bounded rationality typically decreases the total infections compared to Perfect Adoption. This again relates to HI. For perfect adoption, herd immunity is obtained for with while often is significantly smaller than the model with bounded rationality. If infections are above the threshold when we are close to HI, a small increase in SD or FC can decrease infections below . Hence, in most cases.
References
- \bibcommenthead
- (1) Petersen, L.R., Jamieson, D.J., Powers, A.M., Honein, M.A.: Zika virus. New England Journal of Medicine 374(16), 1552–1563 (2016)
- (2) Leroy, E.M., Kumulungui, B., Pourrut, X., Rouquet, P., Hassanin, A., Yaba, P., Délicat, A., Paweska, J.T., Gonzalez, J.-P., Swanepoel, R.: Fruit bats as reservoirs of ebola virus. Nature 438(7068), 575–576 (2005)
- (3) Chams, N., Chams, S., Badran, R., Shams, A., Araji, A., Raad, M., Mukhopadhyay, S., Stroberg, E., Duval, E.J., Barton, L.M., Hajj Hussein, I.: Covid-19: A multidisciplinary review. Frontiers in Public Health 8 (2020). https://doi.org/%****␣main_submission.bbl␣Line␣100␣****10.3389/fpubh.2020.00383
- (4) Banuet-Martinez, M., Yang, R., Jafari, B., Kaur, A., Butt, Z., Chen, H., Yanushkevich, S., Moyles, I., Heffernan, J., Korosec, C.: Monkeypox: A Review of Epidemiological Modelling Studies and How Modelling Has Led to Mechanistic Insight Monkeypox: A Review of Epidemiological Modelling Studies and How Modelling Has Led to Mechanistic Insight 2 3 Calgary, AB T2N 1N4. https://doi.org/10.1017/S0950268823000791
- (5) Liu, B., ., S., Ullah, S., Altanji, M., Nawaz, R., Teklu, S.: Mathematical assessment of monkeypox disease with the impact of vaccination using a fractional epidemiological modeling approach. Scientific Reports 13 (2023). https://doi.org/10.1038/s41598-023-40745-x
- (6) Anderson, R.M., May, R.M.: Infectious Diseases of Humans: Dynamics and Control. Oxford university press, ??? (1991)
- (7) Lloyd-Smith, J.O.: Infectious diseases: predictions of virus spillover across species. Nature 546(7660), 603–604 (2017)
- (8) Bauch, C.T., Galvani, A.P.: Social factors in epidemiology. Science 342(6154), 47–49 (2013)
- (9) Verelst, F., Willem, L., Beutels, P.: Behavioural change models for infectious disease transmission: a systematic review (2010–2015). Journal of The Royal Society Interface 13(125), 20160820 (2016)
- (10) Bauch, C.T., Bhattacharyya, S.: Evolutionary game theory and social learning can determine how vaccine scares unfold. PLoS computational biology 8(4), 1002452 (2012)
- (11) Wang, W., Liu, Q.-H., Cai, S.-M., Tang, M., Braunstein, L.A., Stanley, H.E.: Suppressing disease spreading by using information diffusion on multiplex networks. Scientific reports 6 (2016)
- (12) Fu, F., Rosenbloom, D.I., Wang, L., Nowak, M.A.: Imitation dynamics of vaccination behaviour on social networks. Proceedings of the Royal Society of London B: Biological Sciences 278(1702), 42–49 (2011)
- (13) Reluga, T.C., Bauch, C.T., Galvani, A.P.: Evolving public perceptions and stability in vaccine uptake. Mathematical biosciences 204(2), 185–198 (2006)
- (14) Wang, Z., Bauch, C.T., Bhattacharyya, S., d’Onofrio, A., Manfredi, P., Perc, M., Perra, N., Salathé, M., Zhao, D.: Statistical physics of vaccination. Physics Reports 664, 1–113 (2016)
- (15) Chen, X., Fu, F.: Imperfect vaccine and hysteresis. Proceedings of the royal society B 286(1894), 20182406 (2019)
- (16) Bauch, C.T.: Imitation dynamics predict vaccinating behaviour. Proceedings of the Royal Society B: Biological Sciences 272(1573), 1669–1675 (2005)
- (17) Arefin, M.R., Masaki, T., Tanimoto, J.: Vaccinating behaviour guided by imitation and aspiration. Proceedings of the Royal Society A 476(2239), 20200327 (2020)
- (18) Sigmund, K., Hauert, C., Nowak, M.A.: Reward and punishment. Proceedings of the National Academy of Sciences 98(19), 10757–10762 (2001)
- (19) Chen, X., Fu, F.: Social learning of prescribing behavior can promote population optimum of antibiotic use. Frontiers in Physics 6, 139 (2018)
- (20) Saad-Roy, C.M., Traulsen, A.: Dynamics in a behavioral–epidemiological model for individual adherence to a nonpharmaceutical intervention. Proceedings of the National Academy of Sciences 120(44), 2311584120 (2023) https://www.pnas.org/doi/pdf/10.1073/pnas.2311584120. https://doi.org/10.1073/pnas.2311584120
- (21) Traulsen, A., Levin, S.A., Saad-Roy, C.M.: Individual costs and societal benefits of interventions during the covid-19 pandemic. Proceedings of the National Academy of Sciences 120(24), 2303546120 (2023) https://www.pnas.org/doi/pdf/10.1073/pnas.2303546120. https://doi.org/10.1073/pnas.2303546120
- (22) Flaxman, S., Mishra, S., Gandy, A., Unwin, H., Mellan, T., Coupland, H., Whittaker, C., Zhu, H., Berah, T., Eaton, J., Monod, M., Ghani, A., Donnelly, C., Riley, S., Vollmer, M., Ferguson, N., Okell, L., Bhatt, S., Perez-Guzman, P., Walker, P.: Estimating the effects of non-pharmaceutical interventions on covid-19 in europe. Nature 584 (2020). https://doi.org/10.1038/s41586-020-2405-7
- (23) Perra, N.: Non-pharmaceutical interventions during the covid-19 pandemic: A review. Physics Reports 913, 1–52 (2021)
- (24) Wagner, C., Saad-Roy, C., Morris, S., Baker, R., Mina, M., Farrar, J., Holmes, E., Pybus, O., Graham, A., Emanuel, E., Levin, S., Metcalf, C.J., Grenfell, B.: Vaccine nationalism and the dynamics and control of sars-cov-2. Science 373, (2021). https://doi.org/10.1126/science.abj7364
- (25) Townsend, A.K., Hawley, D.M., Stephenson, J.F., Williams, K.E.G.: Emerging infectious disease and the challenges of social distancing in human and non-human animals. Proceedings of the Royal Society B: Biological Sciences 287(1932), 20201039 (2020)
- (26) Morsky, B., Magpantay, F., Day, T., Akçay, E.: The impact of threshold decision mechanisms of collective behavior on disease spread. Proceedings of the National Academy of Sciences 120(19), 2221479120 (2023) https://www.pnas.org/doi/pdf/10.1073/pnas.2221479120. https://doi.org/10.1073/pnas.2221479120
- (27) Nicola, M., Alsafi, Z., Sohrabi, C., Kerwan, A., Al-Jabir, A., Iosifidis, C., Agha, M., Agha, R.: The socio-economic implications of the coronavirus and covid-19 pandemic: a review. International Journal of Surgery (2020)
- (28) Reluga, T.C.: Game theory of social distancing in response to an epidemic. PLoS Comput Biol 6(5), 1000793 (2010)
- (29) Maharaj, S., Kleczkowski, A.: Controlling epidemic spread by social distancing: Do it well or not at all. BMC Public Health 12(1), 679 (2012)
- (30) Huberts, N., Thijssen, J.: Optimal timing of interventions during an epidemic. Available at SSRN 3607048 (2020)
- (31) Aleta, A., Martín-Corral, D., y Piontti, A.P., Ajelli, M., Litvinova, M., Chinazzi, M., Dean, N.E., Halloran, M.E., Longini Jr, I.M., Merler, S., et al.: Modelling the impact of testing, contact tracing and household quarantine on second waves of covid-19. Nature Human Behaviour, 1–8 (2020)
- (32) Kissler, S.M., Tedijanto, C., Goldstein, E., Grad, Y.H., Lipsitch, M.: Projecting the transmission dynamics of sars-cov-2 through the postpandemic period. Science 368(6493), 860–868 (2020)
- (33) Kuga, K., Tanaka, M., Tanimoto, J.: Pair approximation model for the vaccination game: Predicting the dynamic process of epidemic spread and individual actions against contagion. Proceedings of the Royal Society A: Mathematical, Physical and Engineering Sciences 477(2246) (2021). https://doi.org/10.1098/rspa.2020.0769
- (34) Liu, Y., Wu, B.: Coevolution of vaccination behavior and perceived vaccination risk can lead to a stag-hunt-like game. Phys. Rev. E 106, 034308 (2022). https://doi.org/10.1103/PhysRevE.106.034308
- (35) Alam, M., Ida, Y., Tanimoto, J.: Abrupt epidemic outbreak could be well tackled by multiple pre-emptive provisions-a game approach considering structured and unstructured populations. Chaos Solitons & Fractals 143 (2021). https://doi.org/10.1016/j.chaos.2020.110584
- (36) Alam, M., Tanimoto, J.: A game-theoretic modeling approach to comprehend the advantage of dynamic health interventions in limiting the transmission of multi-strain epidemics. Journal of Applied Mathematics and Physics 10, 3700–3748 (2022). https://doi.org/10.4236/jamp.2022.1012248
- (37) Karlsson, C.-J., Rowlett, J.: Decisions and disease: a mechanism for the evolution of cooperation. Scientific Reports 10 (2020). https://doi.org/10.1038/s41598-020-69546-2
- (38) Arthur, R.F., Jones, J.H., Bonds, M.H., Ram, Y., Feldman, M.W.: Adaptive social contact rates induce complex dynamics during epidemics. PLOS Computational Biology 17(2), 1–17 (2021). https://doi.org/10.1371/journal.pcbi.1008639
- (39) Weitz, J.S., Park, S.W., Eksin, C., Dushoff, J.: Awareness-driven behavior changes can shift the shape of epidemics away from peaks and toward plateaus, shoulders, and oscillations. Proceedings of the National Academy of Sciences 117(51), 32764–32771 (2020) https://www.pnas.org/doi/pdf/10.1073/pnas.2009911117. https://doi.org/10.1073/pnas.2009911117
- (40) Chen, X., Fu, F.: Highly coordinated nationwide massive travel restrictions are central to effective mitigation and control of covid-19 outbreaks in china. Proceedings of the Royal Society A: Mathematical, Physical and Engineering Sciences 478 (2022). https://doi.org/10.1098/rspa.2022.0040
- (41) Qiu, Z., Espinoza, B., Vasconcelos, V., Chen, C., Constantino, S., Crabtree, S., Yang, L., Vullikanti, A., Chen, J., Weibull, J., Basu, K., Dixit, A., Levin, S., Marathe, M.: Understanding the coevolution of mask wearing and epidemics: A network perspective. Proceedings of the National Academy of Sciences of the United States of America 119, 2123355119 (2022). https://doi.org/10.1073/pnas.2123355119
- (42) Espinoza, B., Marathe, M., Swarup, S., Thakur, M.: Asymptomatic individuals can increase the final epidemic size under adaptive human behavior. Scientific Reports 11 (2021). https://doi.org/10.1038/s41598-021-98999-2
- (43) Espinoza, B., Swarup, S., Barrett, C., Marathe, M.: Heterogeneous adaptive behavioral responses may increase epidemic burden. Scientific Reports 12 (2022). https://doi.org/10.1038/s41598-022-15444-8
- (44) Sethi, S.P., Staats, P.W.: Optimal control of some simple deterministic epidemic models. Journal of the Operational Research Society 29(2), 129–136 (1978)
- (45) Abakuks, A.: Optimal immunisation policies for epidemics. Advances in Applied Probability, 494–511 (1974)
- (46) Abakuks, A.: An optimal isolation policy for an epidemic. Journal of Applied Probability, 247–262 (1973)
- (47) Wickwire, K.: Optimal isolation policies for deterministic and stochastic epidemics. Mathematical biosciences 26(3-4), 325–346 (1975)
- (48) Morris, D., Rossine, F., Plotkin, J., Levin, S.: Optimal, near-optimal, and robust epidemic control. Communications Physics 4 (2021). https://doi.org/10.1038/s42005-021-00570-y
- (49) Glaubitz, A., Fu, F.: Oscillatory dynamics in the dilemma of social distancing. Proceedings of the Royal Society A 476(2243), 20200686 (2020)
- (50) Simon, H.A.: Bounded rationality. In: Utility and Probability, pp. 15–18. Springer, ??? (1990)
- (51) Tversky, A., Kahneman, D.: Advances in prospect theory: Cumulative representation of uncertainty. Journal of Risk and uncertainty 5(4), 297–323 (1992)
- (52) Wiemken, T., Khan, F., Puzniak, L., Yang, W., Simmering, J., Polgreen, P., Nguyen, J., Jodar, L., McLaughlin, J.: Seasonal trends in covid-19 cases, hospitalizations, and mortality in the united states and europe. Scientific Reports 13 (2023). https://doi.org/10.1038/s41598-023-31057-1
- (53) Tanaka, M.M., Kumm, J., Feldman, M.W.: Coevolution of pathogens and cultural practices: A new look at behavioral heterogeneity in epidemics. Theoretical Population Biology 62(2), 111–119 (2002). https://doi.org/10.1006/tpbi.2002.1585
- (54) Arthur, R., Levin, M., Labrogere, A., Feldman, M.: Age-differentiated incentives for adaptive behavior during epidemics produce oscillatory and chaotic dynamics. PLoS computational biology 19, 1011217 (2023). https://doi.org/10.1371/journal.pcbi.1011217
- (55) Jentsch, P., Anand, M., Bauch, C.: Prioritising covid-19 vaccination in changing social and epidemiological landscapes: a mathematical modelling study. The Lancet Infectious Diseases 21 (2021). https://doi.org/10.1016/S1473-3099(21)00057-8
- (56) Shearston, J., Martinez, M., Nunez, Y., Hilpert, M.: Social-distancing fatigue: Evidence from real-time crowd-sourced traffic data. Science of The Total Environment 792, 148336 (2021). https://doi.org/10.1016/j.scitotenv.2021.148336