J R Soc Interface
biophysics, medical physics, biomechanics
James D. Shemilt
Non-local impact of distal airway constrictions on patterns of inhaled particle deposition
Abstract
Airway constriction and blockage in obstructive lung diseases create barriers to effective drug deposition by altering how different regions of the lungs are ventilated. Established computational particle deposition models have not accounted for these impacts of disease. We present a new particle deposition model that calculates ventilation based on the resistance of each airway, such that ventilation patterns respond to airway constriction. We incorporate distal airway constrictions representative of cystic fibrosis, and assess the resulting impact on deposition down to the single-airway scale. We demonstrate how constriction reduces deposition in the airways directly distal and proximal to the affected airways. When multiple constrictions are clustered together, deposition in the central airways proximal to the constrictions is more strongly reduced, and deposition in the other central airways is generally increased. This results in more uneven deposition in both the central and distal airways, even when constrictions affect only the distal airways. We use our model to calculate lung clearance index (LCI), a clinical measure of ventilation heterogeneity, in lungs with constrictions of various severities localised to one lobe. We find an increase in LCI coinciding with a significant drop in deposition throughout the affected lobe.
keywords:
Particle deposition, network modelling, inhaled therapies, cystic fibrosis, airway disease1 Introduction
Inhaled therapies, including mucolytics and antibiotics, are commonly used to treat cystic fibrosis (CF) [1, 2]. Recent evidence has also shown that inhaled gene therapies can also halt or slow decline of lung function [3]. Airway constriction or blockage caused by thickened mucus layers or mucus plugging can create barriers to the effective application of inhaled therapies in CF. Typically, it is desired for inhaled drugs to be deposited evenly throughout the lungs’ conducting airways, including in the distal conducting airways. These small airways can be susceptible to constriction or blockage even in early disease [4], so delivering a sufficient dose to them, particularly in more diseased and poorly ventilated regions of the lungs, can be challenging. Barriers to effective application of inhaled therapies are not unique to CF; airway blockage can also alter patterns of inhaled particle deposition in chronic obstructive pulmonary disease (COPD) or severe asthma [5, 6]. Experimental studies have shown increased particle deposition in obstructive lung diseases, potentially caused by increased flow rates through narrowed airways [7], but measuring how airway constriction affects the detailed spatial patterns of deposition is difficult. Computational particle-deposition modelling has the potential to provide detailed spatial information but, to do so, the heterogeneous ventilation induced by airway constriction must be accounted for.
Early whole-lung particle-deposition models, such as the \saytrumpet models (e.g., [8]) and \saysingle-path models (e.g., [9]), modelled the airway tree as a one-dimensional structure, with physical properties that vary by depth in the lungs but without any other spatial heterogeneity. Attempts have been made to use similar models to investigate the effects of bronchoconstriction, where a uniform reduction in radius was applied to all airways at certain depths, leading to increased deposition in those airways [10]. More realistic, spatially heterogeneous patterns of airway constriction cannot be simulated with these models.
Multiple-Path Particle Dosimetry (MPPD) models [11, 12, 13, 14] are well-established computational tools that calculate regional particle deposition in an asymmetric airway tree. They have been shown to predict total deposition well in healthy adult lungs [14]. The MPPD model assumes that the flow rate through each airway is proportional to the volume of lung subtended by that airway. This means that constricting an airway would not generally reduce the predicted flow rate through that airway since the volume of airways and acini subtended by it would not necessarily change. A more sophisticated ventilation model has previously been incorporated into MPPD [15, 16], which took into account lung compliance and resistance as well as the volume and capacity of the region distal to each airway when calculating the flow through it. The resistance of each airway was not directly related to its diameter, suggesting that constricting an airway may not have induced a significant change to the resistance or flow rate. The more complex ventilation model did allow for more heterogeneous ventilation of the lungs, but did not have a significant impact on lobar deposition rates in healthy lungs, leading the authors to recommend continued use of the simpler uniform ventilation model in subsequent versions of MPPD [15, 16]. It has been acknowledged that using a uniform ventilation model is not likely to accurately predict deposition in diseased lungs [16, 17].
Whole-lung models that combine three-dimensional computational fluid dynamics (CFD) simulations in the central airways with simpler one-dimensional models for the distal airways and acini have recently been developed [18, 19, 20]. The distal airways are treated either as several smaller trumpet [18] or multiple-path models [20]. These approaches provide models of deposition throughout the whole lung, including detailed patterns of deposition in the central airways. Air flow into each of the lungs’ lobes was inferred from experimental measurements. However, within the distal airways, the same simple ventilation models used in traditional trumpet or MPPD models were employed, so the effects of ventilation heterogeneity induced by distal airway constrictions could not easily be explored. Grill et al. [21] have recently developed a patient-specific particle-deposition model which uses a more sophisticated ventilation model. They validated their model’s outputs against experimental particle-deposition data from healthy subjects, showing good agreement, and they simulated one example of deposition in diseased lungs by increasing the stiffness of a region of lung to represent localised fibrosis. Whilst more sophisticated particle-deposition models are being developed, the impacts of distal airway constriction representative of obstructive lung disease on deposition at the whole-organ scale have not yet been investigated.
Other studies have used just CFD to model particle deposition (see, e.g., the review by Longest & Holbrook [22]). This is typically limited to modelling a relatively small number of airways. Some attempts have been made to incorporate bronchoconstriction in these models, but they have largely focused on simulating particle deposition in only two or three generations of airways [23, 24]. Walenga & Longest [25] explored the effects of airway constriction in a geometry representative of the whole lungs, in which each lobe was modelled by a single path of airways, with the other airways branching off that single path being truncated. They applied a uniform constriction to all airways in their model; thorough exploration of heterogeneous patterns of distal airway constriction are beyond the current capabilities of CFD models.
Whole-lung models that can capture ventilation heterogeneity induced by airway constriction have been developed to simulate gas transport without particle deposition. Foy et al. [26] investigated the effects of airway constriction on multiple-breath washout (MBW), a clinical measurement of ventilation heterogeneity. They showed that MBW indices are sensitive primarily to airway constriction severity corresponding to a reduction in radius of between and . It has been shown that variability in simulated MBW indices is also elevated when airways are constricted by similar amounts [27].
In this study, we present a whole-lung particle-deposition model, in which ventilation of the lungs is derived based on the resistance of each conducting airway and is driven by the expansion and contraction of individual acini. Transport of an inhaled gas and deposition of particles from that gas throughout the lungs are then calculated. An overview of the model setup is provided in §2, with full details in the supplementary material. The model can predict significant changes to patterns of ventilation and particle deposition throughout the lungs when there is bronchoconstriction. We investigate these effects by applying spatially heterogeneous patterns of distal airway constrictions, representative of airway disease. We apply several qualitatively different patterns of constriction, including constricting airways in one or two lobes only, constricting a number of localised clusters of distal airways, or constricting a number of airways distributed randomly throughout the lungs. We simulate associated clinical measures of ventilation heterogeneity (lung clearance index, LCI) and regional dosing (gamma scintigraphy).
2 Methods
2.1 Lung networks
The lungs contain a large, asymmetric network of conducting airways, with acini attached to the terminal bronchioles. We model every airway individually, and every acinus. The conducting airways are treated as rigid tubes, while the acini expand and contract as the lungs are ventilated. We use lung network geometries generated from computed tomography (CT) images of adolescents with CF but normal-range forced expiratory volume in one second. The CT images were collected clinically aligned with a previous lung imaging study [28]; local research governance was in place to use anonymised CT scans retrospectively for imaging research purposes. The dimensions and positions of the largest central airways are taken directly from CT, and the remaining conducting airways are generated using a volume-filling algorithm [29]. Each of the four geometries has approximately conducting airways.
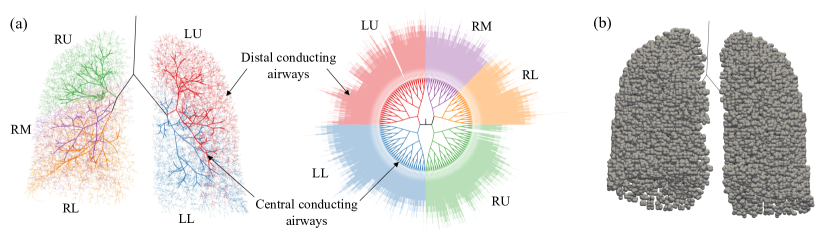
Figure 1(a) shows the conducting airways in one of the geometries. We denote the generation of an airway as one more than the number of bifurcations between it and the trachea, so that the trachea is denoted generation . \sayCentral conducting airways, are those with generation less than , and \saydistal conducting airways are the remaining conducting airways (figure 1a). The lungs are composed of five lobes which are indicated on figure 1(a). We also represent the geometry as a planar graph in figure 1(a); we will present data from simulations below in this way to enable visualisation of deposition patterns across the entire network. We generate the planar graph representation of the network as follows. In each generation, the distal ends of the airways are placed on a circle with radius , where is the generation and is a constant spacing. Given the angular position, , of the distal end of an airway in generation , the angular positions of its daughter airways’ distal ends are , which ensures that all airways in the same generation have the same length and that daughter airways remain adjacent to each other and connected to their parent.
To enable direct comparison of our model with MPPD, and to minimise differences purely due to lung size, we rescale the four lung geometries so that they are representative of an adult’s lungs with functional residual capacity (FRC) of . Given the measured FRC, , from each geometry, we uniformly increase the length and radius of each airway in that geometry by a factor of . This results in a range of airway dead-space volumes between and , which is realistic for adult lungs, noting we do not include the oral cavity [30]. In figure 2, we present data from simulations in all four geometries and compare these to MPPD to validate the model. Subsequently, we present results from simulations in one of the four geometries, chosen arbitrarily, to focus on comparing deposition in the unconstricted geometry with deposition after applying constrictions to the distal airways.
2.2 Ventilation
We assume that particle transport and deposition do not affect ventilation, so we first simulate ventilation and then use the calculated flow rates in each airway to simulate particle transport and deposition. The ventilation model is based on a previous model from Whitfield et al [31]. We provide an overview here and details in the supplementary material, §S2. We represent each lung geometry as a network of edges and vertices embedded in 3D space, with each edge representing an airway and vertices being placed at the ends of each edge. The resistance to air flow of each edge is calculated via Poiseuille’s law, providing a linear relation between the difference in pressure along each airway and the flow rate through it. Whilst Poiseuille’s law is not likely to accurately capture the complex dynamics in the large airways, it provides a computationally efficient simple approximation. We have tested a nonlinear resistance model that accounts for the formation of flow boundary layers at bifurcations [32], but found it had minimal impact on total deposition.
When simulating ventilation, each terminal vertex of the network represents an acinus. Figure 1(b) illustrates these acini as individual spheres. We model each acinus as a viscoelastic bag, defining a relation between the pressure in the acinus, its volume and the pleural pressure. We assume that the breathing rate at the top of the trachea and the pleural pressure both vary sinusoidally in time, and that the pleural pressure is spatially uniform. We assume a breath time of and a tidal volume of . All acini are assumed to have the same initial volume and compliance. The total lung elastance, combining the contributions from all acini, is taken to be , which is derived from the measured value of for lungs with FRC of [33], rescaled proportionally to the FRC of . We tested the model after incorporating the effects of gravity on acinar dynamics by imposing a pleural pressure gradient and non-linear compliance (adapted from [34]); whilst this had some effect on the fraction of particles deposited in different lobes, the effects were relatively minor and the impact on total deposition was minimal. Incorporating these gravitational effects significantly increased computational time, so they were not used.
2.3 Particle transport and deposition
We use the calculated air flow rates in each airway to solve an advection-diffusion equation for the transport of inhaled particles through the lungs. We solve for the concentration of inhaled particles throughout the lung network. Transport of particle concentration along an airway is governed by
| (1) |
where is the axial coordinate, is the cross-sectionally averaged concentration, is the mean velocity, is an effective diffusivity that takes into account axial diffusion and dispersion, and represents loss due to particle deposition. To solve (1), we first discretise each airway into several edges, thus defining a modified network. Then, we recast (1) using the machinery of discrete calculus, defining a discrete analogue of the advection-diffusion equation that can be efficiently solved on the network; this combines a finite difference approximation of (1) within each airway with mass conservation for inhaled gas and particles at bifurcations between airways. Full details are given in the supplementary material, §S3.
We define in (1) by assuming that deposition occurs via three mechanisms: inertial impaction, gravitational sedimentation and diffusion. Following the approach of many other studies [17], we assume these mechanisms act independently, and approximate deposition rates using semi-empirical or derived formulae. For impaction, we use a formula from Zhang et al. [35] derived from CFD simulations in airway bifurcation geometries. For sedimentation, we use a formula from Pich [36], which was also used by Oakes et al. [18]. For diffusion, we use a formula from Ingham [37], which has been validated against experimental results and CFD for sub-micron nanoparticles [38]. We do not model extrathoracic deposition, which is typically significant primarily for particles at least in diameter [39], focusing instead on patterns of lung deposition. We mostly present simulations of diameter particles, as this is representative of typical median particle sizes generated by nebulisers used to administer inhaled therapeutics [40].
When simulating particle deposition, each acinus is modelled as a symmetric tree of airways. Each acinar airway consists of a duct of fixed radius, and a region of alveolar space with time-varying volume. The lengths and radii of the ducts are based on data from [41], as is the relative volume of each airway within an acinar tree. The total volume of each acinus at each moment in time is taken from the ventilation simulation.
We model particle deposition during a single breath, assuming that the initial concentration of particles is zero everywhere, and that the flux of concentration into the trachea is fixed during inhalation. To solve the discrete advection-diffusion equation, we approximate the time derivative using a first-order backwards Euler finite-difference scheme, and solve the resulting system of equations using the BiCGSTAB solver in the Eigen C++ library [42]. We use a time step of , which is small enough that total deposition is independent of the exact value. To discretise the airways to solve (1), we ensure all edges within each airway have the same length, every airway, including in the acini, contains at least eight edges and edges are at most long. The four discretised lung networks have between 2.5 and 3 million edges each. This discretisation ensures convergence of both conducting and acinar airway deposition; in the simulation presented in figure 2(a), approximately doubling the total number of edges changes the total deposition by only . One typical simulation takes around two hours on a single-core processor.
In figure 2, we validate the model’s output against MPPD simulations [43]. In the MPPD simulations, we use their \saystochastic lung geometry with an airway dead space of , which is within the range of dead-space values of our four lung geometries. Breath time, tidal volume and FRC are all the same as outlined in §2.2, although MPPD uses a constant rate of inhalation and exhalation whilst we use a sinusoidal breathing profile.
2.4 Application of airway constrictions
We investigate the effects of airway disease by applying several different patterns of constrictions to the distal conducting airways in one of the lung geometries. We always constrict a subset of the generation 12-15 airways only, and constrict these airways all with the same severity (a value between 0 and 1, the proportion by which we reduce the airways’ radii). The way in which we select the airways for constriction, plus the constriction severity, determines the pattern of constriction. These choices are made both to illustrate key aspects of the physics of the system, and to represent typical features of CF disease. CF affects the small airways first [4], motivating our focus on distal airway constrictions. Ventilation MRI of patients with CF typically shows multiple small patches of poorly ventilated lung [28, 44], motivating us to apply several localised clusters of airway constrictions in §3.3. We also investigate scenarios where constrictions are distributed randomly throughout the lungs or localised to one lobe. We use the same breath time and tidal volume before and after applying constrictions. There is evidence that, in CF, the volume of air entering the lungs over a fixed time of several breaths does not change significantly as disease severity increases [45], although breathing may become faster and shallower in very severe disease. Mild disease, which we focus on simulating here, is not likely to significantly affect breathing rates, and keeping breathing parameters fixed allows us to focus on the impacts of airway constriction.
2.5 Multiple-breath washout and gamma scintigraphy
We modify the model to also simulate multiple-breath washout (MBW). We simulate many breaths instead of one, set the deposition term in (1) to zero, set the diffusivity to the value for nitrogen gas in oxygen at , and assume an initially uniform concentration of tracer gas (nitrogen) throughout the lungs. We also assume that gas is well-mixed within each acinus, as the diffusivity of nitrogen is much higher than that of any sized aerosol we consider in the deposition model, so acinar mixing is likely to be much stronger. This MBW model is effectively equivalent to that of Foy et al. [26]. Lung clearance index (LCI), a clinical measure of ventilation heterogeneity, is then calculated as follows. Suppose that after breaths, the concentration at the top of the trachea, , at end-exhalation is less than of the initial concentration, , and that this is not the case for the previous breath. Then
| (2) |
where is the cumulative expired volume of gas and is the total volume of exhaled tracer gas [46].
We use particle-deposition predictions to simulate gamma scintigraphy, a clinical measurement of regional dosing. To do so, we divide the 2D plane into many pixels, sum the deposition that occurs within each pixel (across the whole depth of the lungs), and use kernel density estimation in Matlab to generate a deposition distribution that simulates a scintigraphy image. Further details of this process are in the supplementary material, §S5.
3 Results
3.1 Particle deposition in the lungs without airway constriction
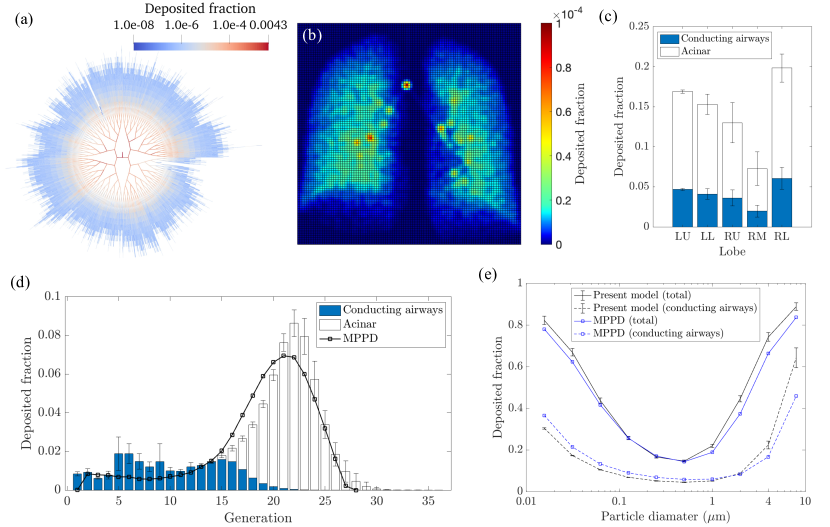
We first simulate particle deposition in all four lung geometries without applied bronchoconstriction, and compare result to MPPD for validation (figure 2). Deposition is typically much higher in larger central airways than in smaller distal airways, but there is some heterogeneity in the spatial distribution of deposition due to asymmetries in the lung geometry (figure 2a). There is a range of path lengths between the trachea and the terminal conducting airways, with the shortest path terminating at generation 8, and the longest paths extending beyond generation 20. Deposition is generally higher in regions where path lengths are longer (figure 2a). Since each terminal conducting airway connects to exactly one acinus, regions with a lot of long paths have a larger number of acini, so more particles are typically drawn through them and so more deposit. Simulated scintigraphy (figure 2b) demonstrates how the model can reproduce features of healthy deposition patterns: for example, deposition is relatively uniform spatially, with a few \sayhot spots at central-airway bifurcation points where significant inertial impaction occurs. It shows higher deposition in the centre of the image where the lung is thicker, so the cumulative deposition across the whole depth of the lungs is higher. Figure 2(c) shows the distribution of deposited particles between the lungs’ five lobes.
To validate the model in healthy lung geometries, we compare deposition in the four lung geometries against results from MPPD (figure 2d,e). Deposition in each airway generation shows generally good agreement for diameter particles (figure 2d), despite MPPD using a lung geometry based on different morphometric data. There is also good agreement with MPPD predictions of total deposition over a range of particle sizes, with only minor quantitative differences for particle diameters smaller than or larger than . Higher conducting-airways deposition for large particles in our model is likely due to the central airways being narrower on average than in the MPPD lung geometry, causing higher impaction. We use different semi-empirical formulae than in MPPD to determine deposition rates, but despite this, agreement is still good. The MPPD model has been validated against experimental data [14], so good agreement here suggests our model accurately captures deposition fractions in healthy lungs.
3.2 Effects of varying airway constriction severity
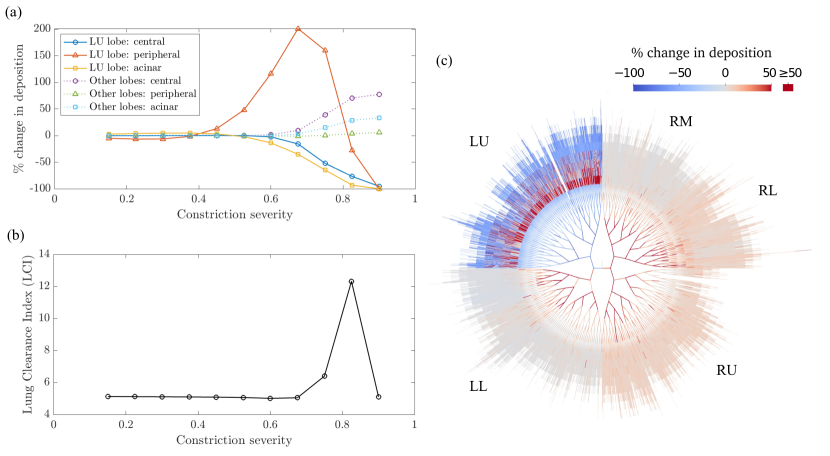
To explore how the severity of airway constriction impacts deposition, we first constrict all generation 12-15 airways in a single lobe, with a range of constriction severities. The effect of increasing constriction severity on deposition in the affected airways is non-monotonic (figure 3a). Distal-airways deposition is not significantly impacted by mild constrictions but, when the severity exceeds 0.4, it increases as impaction is significantly enhanced in the narrowed airways. As the severity is increased further beyond 0.675, the increased resistance of the affected airways causes flow to be reduced into the affected lobe to such a degree that distal deposition decreases rapidly. Increased impaction in narrowed airways has been highlighted previously in simpler models [10], but these have not captured the subsequent decrease as airway resistance is further increased and ventilation patterns are altered. Central and acinar deposition in the affected lobe decrease as the constriction severity is increased and ventilation of the lobe is reduced (figure 3a). In the other lobes, deposition increases due to a higher proportion of the inhaled particles entering these lobes and the speed of air flow through them being faster. The assumption of fixed tidal volume means that these local changes in flow rate are solely due to redistribution of lobar ventilation. The strongest increase in deposition in the unconstricted lobes is in the central airways since impaction is the dominant deposition mechanism there, and this is enhanced by faster flow. By contrast, in the distal conducting airways, where sedimentation is the dominant mechanism, there is minimal change to deposition as shorter residence times for particles leads to reduced sedimentation, enough to largely offset any increased impaction.
Figure 3(b) shows how lung clearance index (LCI) responds to the same applied constrictions. In agreement with previous modelling studies [26, 27], we find that LCI is sensitive to a narrow range of constriction severities, which correspond to a reduction of airway radius of around . Comparison with the deposition results (figure 3a) indicates that the increase in LCI coincides with where deposition is strongly reduced in the central and acinar airways in the constricted lobe, and increased elsewhere. When constriction severity is , there is significantly reduced flow through the left upper lobe, but many of the constricted airways still receive increased deposition (figure 3c). The model predicts that when LCI is raised, particle deposition is likely to be more heterogeneous due to altered ventilation patterns, but constricted airways can still receive a significant dose. However, airways proximal or distal to those severely constricted airways are likely to receive a reduced dose, and a large fraction of the inhaled dose may be diverted to unconstricted regions of the lung. In keeping with previous modelling results, figure 3(b) suggests that LCI is mainly sensitive to severe (but not total) airway constrictions. Deposition of -diameter particles is, however, sensitive to a wider range of constriction severity, with contrasting effects from mild and severe airway constrictions.
3.3 Effects of varying spatial patterns of airway constriction
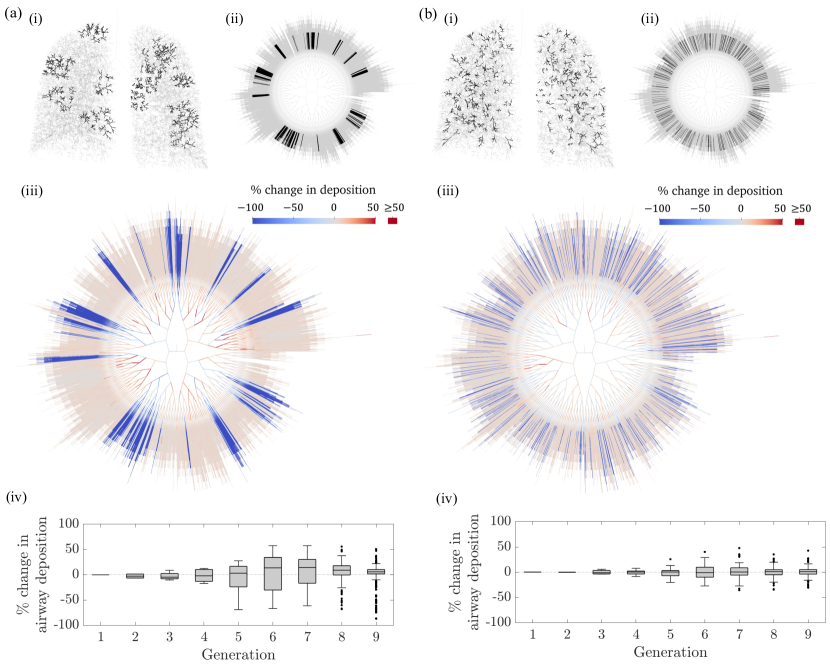
To investigate the impact of the spatial distribution of distal airway constrictions, we simulate two patterns of applied airway constrictions: clustered constrictions (figure 4a) and constrictions distributed randomly throughout the lungs (figure 4b). To generate clusters of constriction, we randomly select generation-12 airways, then constrict all generation-12 airways within a radius of of any of these airways, and constrict all of their descendants down to generation 15. We apply severe constrictions (severity 0.9) to all of these airways. The same process is also used to generate clustered constrictions in figure 5, but the number of clusters, , and the radius, , are different. We always enforce that no two clusters overlap.
Both for clustered and randomly distributed constrictions, deposition is reduced significantly in the constricted airways, and in the airways distal to the constrictions, since flow through them is strongly reduced (figures 4aiii,biii). Deposition is also reduced in the airways directly proximal to the constricted airways. This effect is stronger when multiple constricted airways are clustered together (figure 4aiii), with decreases in deposition extending more proximally and the decreases being stronger than when constrictions are not clustered (figure 4biii). This difference is also evidenced by comparison of figures 4(aiv) and 4(biv): more airways in generations 5-9 have significantly reduced deposition when constrictions are clustered than when they are not.
Both when the constrictions are clustered and when they are not, deposition typically increases in airways which are not directly proximal or distal to a constriction (figures 4c,g). This is because more of the inhaled gas is transported through these open paths once other paths are blocked, and flow through them is faster, so inertial impaction increases. When constrictions are clustered, increases in deposition in the central airways are generally larger than when constrictions are not clustered. This is evident in the comparison of figures 4(aiii) and 4(biii), and of figures 4(aiv) and 4(biv). Figure 4(aiv) shows positive, although relatively small, median increases in airway deposition in several generations of central airways. Figure 4(biv) shows almost exactly zero median change in the same generations when constrictions are not clustered. Variability in deposition in almost every generation of central airways is larger when constrictions are clustered. This highlights how clustered constrictions in the distal airways can cause more heterogeneous central-airways deposition.
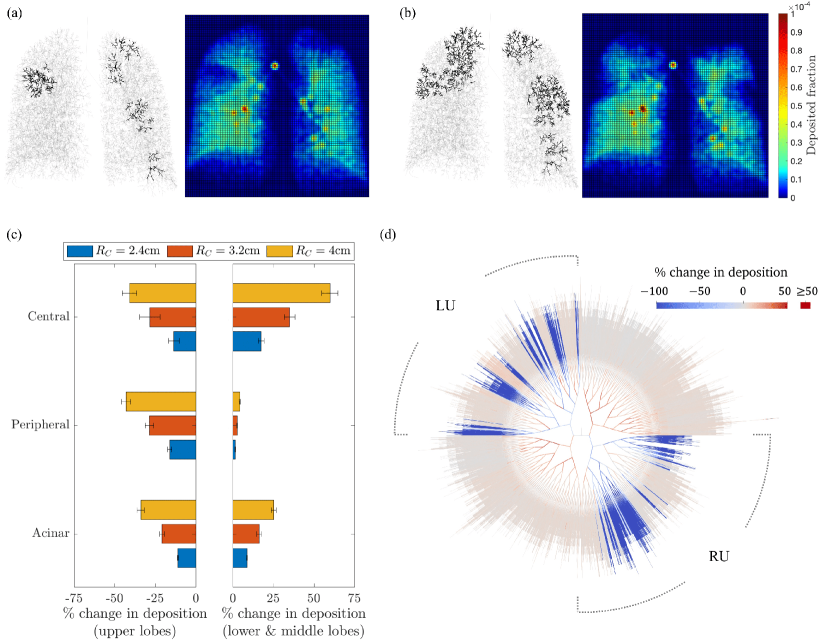
To examine the impact of increasing the size of clusters of constriction, we now apply clusters to the upper lobes, and vary the cluster radius, (figure 5). The process of generating clusters of constrictions is otherwise as described above. Simulated scintigraphy can be seen to clearly detect large clusters of constriction where many airways are blocked (figure 5b). Where clusters of constrictions are smaller and fewer airways are constricted, not all constricted regions are visible on scintigraphy (figure 5a). In figure 5(a), a patch of reduced deposition is clearly visible in the right lung, where two clusters are close together, but small clusters on the left lung, particularly those occurring in the centre of the image where lung depth is thickest, are not clear on scintigraphy. This highlights potential limitations of scintigraphy: it is more sensitive to severe blockages, and it may be more sensitive to constrictions that occur on the edges of the image field than those that occur in the centre.
Figure 5(c) quantifies how deposition changes in different regions of the lungs as the size of cluster of constrictions is increased. In the upper lobes, deposition decreases in the central, distal and acinar airways as the clusters are made larger and more airways are constricted. Elsewhere, deposition is increased as flow becomes faster through the unconstricted lobes. Central-airways deposition increases significantly, whilst there is almost no change to deposition in the distal conducting airways in the unconstricted lobes. Impaction is the dominant mechanism in the central airways, so deposition there is much more sensitive to increased flow rates. In fact, figure 5(c) suggests that the increase in deposition in the central airways in these lobes is at least as large as the decrease in the lobes with constrictions. Within the constricted lobes, there are still some open paths, and deposition in airways on these paths still tends to increase as long as they are not directly proximal to a constriction (figure 5d). Therefore, some inhaled particles continue to be deposited in a lobe even if many of its airways are constricted, although deposition then strongly favours the open airways that are not on the same path as any constriction. The lack of increase in distal-airways deposition in the lobes without constrictions (figure 5c) is due to the fact that increased flow rates mean shorter residence times for most inhaled particles so decreased sedimentation, which is the dominant deposition mechanism in the distal airways. In turn, this means residence times in the acini are longer in these lobes, leading to increased acinar deposition. In these lobes, the ratio of central to distal conducting airway deposition is increased purely by application of constrictions elsewhere in the lungs.
4 Discussion
We have developed a model of inhaled particle deposition which predicts ventilation patterns based on the resistance of every airway in the lungs. We have tested the model in several lung geometries, validating total deposition results against the Multiple-Path Particle Dosimetry (MPPD) model [43], showing good agreement even despite using different lung geometries. We investigated the impact of applying various patterns of distal airway constrictions, representative of features of CF disease. Strong changes in deposition can occur in the constricted airways themselves, but also, when changes to ventilation are taken into account, there can be significant impacts on deposition in unconstricted airways elsewhere in the lungs. Deposition in airways directly proximal or distal to constricted airways is reduced as flow rates through these paths are decreased. The severity of constriction at which this decrease becomes severe approximately coincides with a spike in the predicted LCI. We demonstrated that when distal airway constrictions are clustered together, their effects on deposition in the central airways can be heightened, with deposition becoming more heterogeneous. Central airways away from the constrictions received increased deposition, driven by enhanced inertial impaction as flow rates were increased through these open paths, since constricted airways received less flow and the flow rate into the trachea was assumed to be the same before and after applying constrictions. By contrast, the unconstricted distal conducting airways tended not to receive an increased dose since gravitational sedimentation, the dominant deposition mechanism in the small airways, is not increased by faster flow.
Our results highlight the importance of accounting for altered ventilation patterns when simulating particle deposition in lungs affected by airway disease. Experimental studies have previously established that CF disease can significantly alter sites of particle deposition [7]. We found that severe constrictions in the lungs’ upper lobes, which are often affected early in CF [47], can cause increased deposition in the central airways elsewhere in the lungs. This may partially explain the increased central-airways deposition observed in some severe CF patients [7]. However, other effects, such as increased turbulence, which our model cannot account for, may also contribute. Further work directly replicating the experiments of Anderson et al. [7] would be required to confirm this. In severe disease, breathing may become faster and shallower [45], which may also enhance central-airways deposition.
Our model provides detailed predictions of deposition down to the single-airway scale, beyond the scope of current medical imaging techniques. The physical insights we have provided, relating changes in ventilation and deposition patterns, have the potential to improve estimates of regional dosing of an inhaled therapeutic once ventilation patterns have been inferred in a patient’s lungs from clinical tests of ventilation heterogeneity, such as MBW or ventilation MRI [46, 44]. Dosing plans drawn up based on lung exposure calculated from MPPD and healthy volunteer studies may not be accurate for those with significant ventilation heterogeneity. Our data suggest there may be particular risks around higher concentrations of inhaled drug being delivered to central airways and lower doses to the most strongly affected lung regions.
The model has some limitations. Whilst the calculation of ventilation takes into account airway constriction, compliance of airways is not accounted for, so the impact of transient airway collapse and reopening during a breath is not described. This symptom of airway disease could impact deposition patterns, and so should be investigated in future studies. The model assumes that each acinus expands and contracts independently, so does not directly take into account how the motion of one acinus may modify its neighbours’ motion; this effect has been examined in previous ventilation models [48] and could be incorporated into future deposition models. Particle deposition in each airway is approximated using semi-empirical formulae, as has been done in many established whole-lung models [17]. CFD simulations may instead provide more accurate predictions of particle deposition in the central airways [18, 20]. However, our approach keeps computational time low, meaning we have been able to simulate many different airway constriction scenarios, and make insights at the airway scale throughout the lungs. We have provided detailed physical insight into the effects of simulated patterns of airway constriction, representative of typical features of early CF disease. In future, patterns of airway constriction could be inferred directly from medical imaging, in order to move towards patient-specific predictions of the effects of disease. In order to isolate the impacts of airway constriction, we have not varied other parameters such as breathing rate or tidal volume. Faster, shallower breathing rates should be incorporated in future studies if modelling patients or patient-phenotypes where this is observed [45]; this study has instead focused on features representative of mild disease, where breathing rates are unlikely to be significantly altered.
Using a novel computational model that accounts for altered ventilation induced by airway constrictions, we have established new understanding of key impacts of airway disease on patterns of inhaled particle deposition. We have demonstrated how airway constrictions localised to the distal airways can affect deposition throughout the lungs. Spatial clustering of constrictions can increase the impact on central-airways deposition, making it more heterogeneous by reducing deposition in airways directly proximal to constrictions and increasing deposition elsewhere. These results have implications for understanding how ventilation defects and airway blockage in obstructive lung diseases may affect how inhaled therapeutics deposit. This is an important step towards developing realistic simulations of particle and drug deposition that can be used to accurately model exposure in disease states as well as healthy lungs.
Code used to simulate ventilation and particle transport and deposition is available at xxxxxx. Code used to generate constriction patterns, and the network files used in all simulations presented in this study are available at xxxxxx. Code used to generate the scintigraphy plots, to calculate LCI, and to generate planar graphs from the 3D networks are available at xxxxxx. Generation of the lung networks used the same code as in [31].
J.D.S. led the investigation, wrote the paper, and contributed to the design of the study and coding of the numerical algorithms. A.H. critically revised the manuscript and contributed to the development of the study. O.E.J. contributed to the conception, design and coordination of the study, and critically revised the manuscript. A.B.T. contributed to the design and coordination of the study and critically revised the manuscript. J.M.W. collected and collated the CT data used in the study. C.A.W. carried out the CT image processing, and contributed to the conception, design and coordination of the study, the coding of the numerical algorithms, and revision of the manuscript.
We declare we have no competing interests.
J.D.S. was supported by an EPSRC doctoral training award. A.H., C.A.W., and O.E.J. are supported by the NIHR Manchester Biomedical Research Centre (NIHR203308). The numerical algorithms developed extend on previous work by CAW funded by the UK Medical Research Council (MR/R024944/1)
The views expressed are those of the authors and not necessarily those of the NIHR or the Department of Health and Social Care.
References
- [1] M O Henke and F Ratjen “Mucolytics in cystic fibrosis” In Paediatr. Respir. Rev. 8.1 Elsevier, 2007, pp. 24–29
- [2] Sherie Smith and Nicola J Rowbotham “Inhaled anti-pseudomonal antibiotics for long-term therapy in cystic fibrosis” In Cochrane Database Syst. Rev. John Wiley & Sons, Ltd, 2022
- [3] Eric WFW Alton et al. “Repeated nebulisation of non-viral CFTR gene therapy in patients with cystic fibrosis: a randomised, double-blind, placebo-controlled, phase 2b trial” In Lancet Respir. Med. 3.9 Elsevier, 2015, pp. 684–691
- [4] Harm AWM Tiddens, Scott H Donaldson, Margaret Rosenfeld and Peter D Paré “Cystic fibrosis lung disease starts in the small airways: can we treat it more effectively?” In Pediatr. Pulmonol. 45.2 Wiley Online Library, 2010, pp. 107–117
- [5] Chantal Darquenne “Aerosol deposition in health and disease” In J. Aerosol Med. Pulm. Drug Deliv. 25.3 Mary Ann Liebert, Inc. 140 Huguenot Street, 3rd Floor New Rochelle, NY 10801 USA, 2012, pp. 140–147
- [6] Nancy Renee Labiris and Myrna B Dolovich “Pulmonary drug delivery. Part I: physiological factors affecting therapeutic effectiveness of aerosolized medications” In Br. J. Clin. Pharmacol. 56.6 Wiley Online Library, 2003, pp. 588–599
- [7] Paula J Anderson, James D Blanchard, Joseph D Brain, Henry A Feldman, John J Mcnamara and Joachim Heyder “Effect of cystic fibrosis on inhaled aerosol boluses 1–3” In Am. Rev. Respir. Dis 140, 1989, pp. 1317–1324
- [8] D_ B_ Taulbee and CP Yu “A theory of aerosol deposition in the human respiratory tract” In J. Appl. Physiol. 38.1, 1975, pp. 77–85
- [9] Hsu-Chi Yeh and GM Schum “Models of human lung airways and their application to inhaled particle deposition” In Bull. Math. Biol. 42.3 Elsevier, 1980, pp. 461–480
- [10] Ted Martonen, John Fleming, Jeffry Schroeter, Joy Conway and Dongming Hwang “In silico modeling of asthma” In Adv. Drug Deliv. Rev. 55.7 Elsevier, 2003, pp. 829–849
- [11] S. Anjilvel and B. Asgharian “A Multiple-Path Model of Particle Deposition in the Rat Lung” In Fundam. Appl. Toxicol. 28.1, 1995, pp. 41–50
- [12] B Asgharian, Werner Hofmann and Rudolf Bergmann “Particle deposition in a multiple-path model of the human lung” In Aerosol Sci. Technol. 34.4 Taylor & Francis, 2001, pp. 332–339
- [13] Frederick J Miller, Bahman Asgharian, Jeffry D Schroeter and Owen Price “Improvements and additions to the multiple-path particle dosimetry model” In J. Aerosol Sci. 99 Elsevier, 2016, pp. 14–26
- [14] B. Asgharian, O. Price, A… Borojeni, A.. Kuprat, S. Colby, R.. Singh, W. Gu, R.. Corley and C. Darquenne “Influence of alveolar mixing and multiple breaths of aerosol intake on particle deposition in the human lungs” In J. Aerosol Sci. 166, 2022, pp. 106050
- [15] B Asgharian and OT Price “Airflow distribution in the human lung and its influence on particle deposition” In Inhal. Toxicol. 18.10 Taylor & Francis, 2006, pp. 795–801
- [16] B Asgharian, OT Price and Werner Hofmann “Prediction of particle deposition in the human lung using realistic models of lung ventilation” In J. Aerosol Sci. 37.10 Elsevier, 2006, pp. 1209–1221
- [17] Werner Hofmann “Modelling inhaled particle deposition in the human lung—A review” In J. Aerosol Sci. 42.10 Elsevier, 2011, pp. 693–724
- [18] J.. Oakes, S.. Shadden, C. Grandmont and I.. Vignon-Clementel “Aerosol transport throughout inspiration and expiration in the pulmonary airways” In Int. J. Num. Method. Biomed. Eng. 33.9, 2017, pp. e2847
- [19] Kamran Poorbahrami, Irene E Vignon-Clementel, Shawn C Shadden and Jessica M Oakes “A whole lung in silico model to estimate age dependent particle dosimetry” In Sci. Rep. 11.1 Nature Publishing Group UK London, 2021, pp. 11180
- [20] A P Kuprat, M Jalali, T Jan, R A Corley, B Asgharian, O Price, R K Singh, S Colby and C Darquenne “Efficient bi-directional coupling of 3D computational fluid-particle dynamics and 1D multiple path particle dosimetry lung models for multiscale modeling of aerosol dosimetry” In J. Aerosol Sci. 151 Elsevier, 2021, pp. 105647
- [21] Maximilian J Grill et al. “In silico high-resolution whole lung model to predict the locally delivered dose of inhaled drugs” In ArXiv:2307.04757, 2023
- [22] P Worth Longest and Landon T Holbrook “In silico models of aerosol delivery to the respiratory tract—development and applications” In Adv. Drug Deliv. Rev. 64.4 Elsevier, 2012, pp. 296–311
- [23] P Worth Longest, Samir Vinchurkar and Ted Martonen “Transport and deposition of respiratory aerosols in models of childhood asthma” In J. Aerosol Sci. 37.10 Elsevier, 2006, pp. 1234–1257
- [24] Arpad Farkas and Imre Balashazy “Simulation of the effect of local obstructions and blockage on airflow and aerosol deposition in central human airways” In J. Aerosol Sci. 38.8 Elsevier, 2007, pp. 865–884
- [25] Ross L Walenga and P Worth Longest “Current inhalers deliver very small doses to the lower tracheobronchial airways: assessment of healthy and constricted lungs” In J. Pharm. Sci. 105.1 Elsevier, 2016, pp. 147–159
- [26] Brody H Foy, David Kay and Rafel Bordas “Modelling responses of the inert-gas washout and MRI to bronchoconstriction” In Respir. Physiol. Neurobiol. 235 Elsevier, 2017, pp. 8–17
- [27] Carl A Whitfield, Alex Horsley and Oliver E Jensen “Modelling structural determinants of ventilation heterogeneity: A perturbative approach” In PloS one 13.11 Public Library of Science San Francisco, CA USA, 2018, pp. e0208049
- [28] Helen Marshall et al. “Detection of early subclinical lung disease in children with cystic fibrosis by lung ventilation imaging with hyperpolarised gas MRI” In Thorax 72.8 BMJ Publishing Group Ltd, 2017, pp. 760–762
- [29] Merryn H Tawhai, Peter Hunter, Juerg Tschirren, Joseph Reinhardt, Geoffrey McLennan and Eric A Hoffman “CT-based geometry analysis and finite element models of the human and ovine bronchial tree” In J. Appl. Physiol. 97.6 American Physiological Society, 2004, pp. 2310–2321
- [30] M C Hart, M M Orzalesi and C D Cook “Relation between anatomic respiratory dead space and body size and lung volume” In J. Appl. Physiol. 18.3, 1963, pp. 519–522
- [31] C.A. Whitfield, P. Latimer, A. Horsley, J.M. Wild, G.J. Collier and O.E. Jensen “Spectral graph theory efficiently characterises ventilation heterogeneity in lung airway networks” In J. Roy. Soc. Interface 17.168, 2020
- [32] T J Pedley, R C Schroter and M F Sudlow “The prediction of pressure drop and variation of resistance within the human bronchial airways” In Respir. Physiol. 9.3 Elsevier, 1970, pp. 387–405
- [33] R Scott Harris “Pressure-volume curves of the respiratory system” In Respir. care 50.1 Respir. Care, 2005, pp. 78–99
- [34] Annalisa J Swan, Alys R Clark and Merryn H Tawhai “A computational model of the topographic distribution of ventilation in healthy human lungs” In J. Theor. Biol. 300 Elsevier, 2012, pp. 222–231
- [35] L. Zhang, B. Asgharian and S. Anjilvel “Inertial deposition of particles in the human upper airway system” In Aerosol Sci. Technol. 26, 1997, pp. 97–110
- [36] Josef Pich “Theory of gravitational deposition of particles from laminar flows in channels” In J. Aerosol Sci. 3.5 Elsevier, 1972, pp. 351–361
- [37] DB Ingham “Diffusion of aerosols in the entrance region of a smooth cylindrical pipe” In J. Aerosol Sci. 22.3 Elsevier, 1991, pp. 253–257
- [38] P Worth Longest and Jinxiang Xi “Computational investigation of particle inertia effects on submicron aerosol deposition in the respiratory tract” In J. Aerosol Sci. 38.1 Elsevier, 2007, pp. 111–130
- [39] Chantal Darquenne, Wayne J. Lamm, Janelle M. Fine, Richard A. Corley and Robb W. Glenny “Total and regional deposition of inhaled aerosols in supine healthy subjects and subjects with mild-to-moderate COPD” In J. Aerosol Sci. 99, 2016, pp. 27–39
- [40] Nicola Collins “Nebulizer therapy in cystic fibrosis: an overview” In J. Roy. Soc. Med. 102.1_suppl SAGE Publications Sage UK: London, England, 2009, pp. 11–17
- [41] Beatrice Haefeli-Bleuer and Ewald R Weibel “Morphometry of the human pulmonary acinus” In Anat. Rec. 220.4 Wiley Online Library, 1988, pp. 401–414
- [42] G. Guennebaud et al. “Eigen v3” In http://eigen.tuxfamily.org, 2010
- [43] ARA Inc. “Multiple-path Particle Dosimetry Model (MPPD v3.04)” In https://www.ara.com/products/multiple-path-particle-dosimetry-model-mppd-v-304, 2015
- [44] Laurie J Smith, Guilhem J Collier, Helen Marshall, Paul JC Hughes, Alberto M Biancardi, Martin Wildman, Ina Aldag, Noreen West, Alex Horsley and Jim M Wild “Patterns of regional lung physiology in cystic fibrosis using ventilation magnetic resonance imaging and multiple-breath washout” In Eur. Respir. J. 52.5 Eur Respiratory Soc, 2018
- [45] Nicholas Hart, Michael I Polkey, Annick Clément, Michèle Boulé, John Moxham, Frédéric Lofaso and Brigitte Fauroux “Changes in pulmonary mechanics with increasing disease severity in children and young adults with cystic fibrosis” In Am. J. Respir. Crit. Care Med. 166.1 American Thoracic Society, 2002, pp. 61–66
- [46] Alex Horsley “Lung clearance index in the assessment of airways disease” In Respir. Med. 103.6 Elsevier, 2009, pp. 793–799
- [47] Nelson L Turcios “Cystic fibrosis lung disease: an overview” In Respir. Care 65.2 Respir. Care, 2020, pp. 233–251
- [48] Christian J Roth, Mahmoud Ismail, Lena Yoshihara and Wolfgang A Wall “A comprehensive computational human lung model incorporating inter-acinar dependencies: Application to spontaneous breathing and mechanical ventilation” In Int. J. Num. Method. Biomed. Eng. 33.1 Wiley Online Library, 2017, pp. e02787