Covariate-adjusted Group Sequential Comparisons of Survival Probabilities
Abstract
In confirmatory clinical trials, survival outcomes are frequently studied and interim analyses for efficacy and/or futility are often desirable. Methods such as the log rank test and Cox regression model are commonly used to compare treatments in this setting. They rely on a proportional hazards (PH) assumption and are subject to type I error rate inflation and loss of power when PH are violated. Such violations may be expected a priori, particularly when the mechanisms of treatments differ such as immunotherapy vs. chemotherapy for treating cancer. We develop group sequential tests for comparing survival curves with covariate adjustment that allow for interim analyses in the presence of non-PH and offer easily interpreted, clinically meaningful summary measures of the treatment effect. The joint distribution of repeatedly computed test statistics converges to the canonical joint distribution with a Markov structure. The asymptotic distribution of the test statistics allows marginal comparisons of survival probabilities at multiple fixed time points and facilitates both critical value specification to maintain type I error control and sample size/power determination. Simulations demonstrate that the achieved type I error rate and power of the proposed tests meet targeted levels and are robust to the PH assumption and covariate influence. The proposed tests are illustrated using a clinical trial dataset from the Blood and Marrow Transplant Clinical Trials Network 1101 trial.
Keywords Adjusted survival probability covariate adjustment group sequential design proportional hazards
1 Introduction
Group sequential (GS) designs are a popular class of adaptive designs in which one or more interim analyses are performed at preplanned milestones during a clinical trial (Jennison and Turnbull,, 1999). These multiple interim evaluations of accumulating data offer potential benefits including a reduction in the resources and monetary costs of the trial and the opportunity for new and efficacious treatments to be more rapidly identified and made available to patients. The GS method has the greatest impact on the late stage of a clinical trial program (i.e., phase III studies), where the sample sizes of trials are typically large and the benefits of early termination of the trial are most substantial (Todd,, 2007). Although the GS design can clearly be advantageous over a fixed sample design, where no interim analyses are conducted, GS trials need to be performed with care to avoid inflation of the type I error rate due to taking multiple looks at trial data. To preserve the overall type I error probability at the prespecified level, stopping rules for interim and final analyses need to be obtained based on the joint distribution of the test statistics from the different analyses. For GS analysis methods whose test statistics follow the canonical joint distribution, the critical values to use at each analysis can be calculated with standard methods (Jennison and Turnbull,, 1999), including Pocock and O’Brien-Fleming designs (Pocock,, 1977; O’Brien and Fleming,, 1979) and error spending functions (Lan and DeMets,, 1983).
Clinical trials often involve the statistical analysis of time-to-event data to determine the benefit of a treatment or therapy, particularly in oncology research. The log-rank test (Mantel,, 1972), the weighted log-rank test (Yang,, 2019), and the Cox proportional hazards (PH) model (Cox,, 1972) are widely used for data analysis in GS clinical trials with survival endpoints. The log-rank test is commonly adopted for comparing treatment groups without covariate adjustment and is well known to be efficient when survival curves have PH at all time points (Fleming and Harrington,, 2011). In the presence of baseline covariates, the hazard ratio (HR) under the Cox PH model is widely used to quantify treatment effects. When the ratio of the hazard functions of the two treatment groups is constant over time, the HR can be conveniently interpreted as the relative instantaneous risk. However, when the HR is nonproportional over time, a Cox PH model may lead to incorrect conclusions because the resulting estimates of the HR depend on the follow-up duration and censoring distribution; the interpretation of the HR estimate becomes less useful clinically in this context as well (Saad et al.,, 2018; Tian et al.,, 2018; Zhao et al.,, 2019). Nonproportional hazards (NPH) can occur when the survival curves of the two treatment arms cross or when one therapy has a delayed or diminishing treatment effect compared to the other. The crossing survival curves situation can occur when treatments operating through differing modalities are assessed; for instance, comparisons of surgical versus nonsurgical treatments have observed this pattern (Howard et al.,, 1997). Moreover, clinical trials studying immune checkpoint inhibitors (ICIs) and other cancer immunotherapies have observed NPH when contrasting these treatments to chemotherapy and radiation therapy, including delayed treatment effects (Kantoff et al.,, 2010; Venook et al.,, 2017) and crossing survival curves (Borghaei et al.,, 2015). Chen, (2013), Ferrara et al., (2018), and Hoos, (2012) discussed the scientific rationale behind the existence of these patterns in immunotherapy studies and recommended that analysis methods other than the log-rank test and Cox model be used in this context. Another case is illustrated by the Blood and Marrow Transplant Clinical Trials Network (BMT CTN) 1101 trial, which compared progression free survival (PFS) between two types of transplant. During the design stage of this trial, there were concerns about the possibility of NPH between treatment groups due to the different risk profiles of the transplant methods under study, and so a Kaplan-Meier based analysis was employed to compare PFS at 2 years post-randomization.
As an alternative summary measure to the HR for describing the magnitude of the treatment effect, the difference in survival probabilities (SPs) at a fixed follow-up time has been proposed to quantify the difference in survival outcomes between treatment arms. The SP measure remains clinically interpretable even when survival curves have NPH, facilitating communications between physicians and patients. GS tests have been developed for comparing SPs; see, for example, Lin et al., (1996); Logan and Mo, (2015). However, these GS tests do not allow adjustment for baseline covariates that may impact survival time. Gail and Byar, (1986) and Zhang et al., (2007) proposed methods for performing covariate-adjusted comparisons of SPs using stratified Kaplan-Meier estimates and a treatment-stratified Cox model; these techniques have not been studied in the group sequential setting, though.
Randomization yields balanced and comparable treatment groups on average with respect to covariate distributions. However, since a single clinical trial is subject to stochastic phenomena, it may exhibit some level of nontrivial covariate imbalance for which an analysis without covariate adjustment may compromise the aim of accomplishing an unbiased and statistically efficient treatment comparison. Ciolino et al., (2013) and Ciolino et al., (2014) have shown that, when a baseline covariate impacts the outcome of interest, an unadjusted test for the treatment effect in a randomized GS trial can suffer from an inflated type I error rate, diminished power and conditional power, and bias in treatment effect estimation when covariate values differ between treatment groups; these issues can still arise in large trials. This emphasizes the need for covariate adjustment in randomized clinical trials. According to Pocock et al., (2002), when the baseline covariates are highly predictive of the survival outcomes, covariate adjustment can also increase the precision of the estimated treatment difference, thereby improving the power to detect a treatment effect in a clinical trial.
The current biostatistical literature lacks an analysis method that incorporates both GS testing and covariate adjustment for direct comparisons of SPs. This paper proposes an innovative GS test to account for NPH settings using covariate-adjusted estimates of SPs under a treatment-stratified Cox PH regression model, extending the method of Zhang et al., (2007) to the GS setting. This offers a robust yet effective alternative to a Cox model-based comparison of treatments for situations where proportionality is suspected or expected to be violated. It was previously shown that, if an analysis method is semiparametric efficient for the target parameter, its test statistics across analyses will asymptotically follow the canonical joint distribution (Scharfstein et al.,, 1997). The stratified Cox model is known to be semiparametric efficient for estimating its log hazard ratio parameters (Zeng and Lin,, 2006). However, because the parameter of interest in the method of Zhang et al., (2007) is a difference in SPs, each of which is a function of both the log hazard parameters and the infinite dimensional, unspecified baseline hazard function of the Cox model, these findings do not imply that the test statistics from differences in adjusted SPs will also follow the canonical distribution in a GS setting. Therefore, we employ a direct approach via martingale theory to derive the large sample distribution of these test statistics, showing that they follow the canonical joint distribution asymptotically. This allows marginal comparisons of adjusted SPs between treatment arms at multiple fixed time points for many different trial settings, using readily available methods to determine critical values to meet type I error rate and power specifications.
This paper is organized as follows. Section 2 proposes a GS test for treatment comparisons via covariate-adjusted SPs and studies the asymptotic behaviors of repeatedly computed test statistics over time. Section 3 presents a simulation study that investigates the finite-sample performance of the proposed GS test in terms of meeting type I error rate and power specifications for a randomized group sequential trial. Section 4 applies the covariate-adjusted test to a real clinical trial dataset from the BMT CTN 1101 study. We conclude with a discussion in Section 5.
2 Methods
2.1 Survival Data Notation
Consider a randomized clinical trial designed to compare a survival endpoint between two treatment groups, a control group indexed by and an intervention group indexed by . The treatment group is composed of individuals with being the total sample size. In many experiments, subjects under study may be recruited over a period of time. Suppose that staggered enrollment into the trial is occurring under a group sequential study design, such that patients are gradually entering the study at differing calendar times. Because patient data are accumulating over calendar time, we need to consider what information will be available for each patient at a given calendar time of interim analysis. Thus, there are two time scales in group sequential tests; one is the survival time, denoted by , and the other one is the calendar time, denoted by . Assume that the calendar age of the study is bounded above by .
For the th individual in group , let denote the calendar time of enrollment when the individual is randomized and let and be the time from entry to event and time from entry to right censoring, respectively. Thus, the individuals in group enter the trial at times and have event times , possibly unobserved, measured from time of entry. If the data are analyzed at calendar time , then individual in group will be censored if . Effectively, the calendar time serves as a form of administrative censoring for patients who enrolled before . However, censoring may also occur randomly from other causes, and represents the corresponding potential random right-censoring time for individual in group . Denote .
The observed data in group sequential testing problems with right-censored failure time data are independent observations , where represents the follow-up time observed for individual in group at calendar time and is the minimum of the failure time, random censoring time, and calendar time from entry; is the indicator that an event has been observed by calendar time ; and is a column vector of baseline covariates.
For survival time , let denote the survival function under treatment arm with . Given a fixed time point , represents the probability that an individual in treatment group will survive beyond time . The distribution of may depend on a vector of pre-treatment covariates . Without loss of generality, we assume that the final analysis occurs at calendar time , where .
2.2 Covariate-adjusted Survival Probabilities with Staggered Entry
We aim to compare survival probabilities between treatments 0 and 1 using group sequential testing with covariate adjustment using the method of Zhang et al., (2007), which employed a treatment-stratified Cox PH model for adjusting survival probabilities in the fixed sample design setting. The use of adjustment for baseline covariates is often fruitful both in making allowance for chance covariate imbalance between treatment arms and in improving power to detect a treatment effect by exploiting information provided through the covariate and hazard rate relationships. We focus on group sequentially testing the SP difference, the parameter quantifying the treatment effect.
Specifically, we adjust the comparison of SPs between two treatment arms for the effects of baseline covariates through use of the following treatment-stratified Cox PH regression model (Kalbfleisch and Prentice,, 2011; Zucker,, 1998) with group status serving as the stratification variable:
| (1) |
where represents an unknown treatment-specific baseline hazard function of for treatment group and is a column vector of parameters to be estimated. For group , the treatment-specific baseline cumulative hazard function is denoted as and the corresponding treatment-specific baseline survival function is given by . We assume throughout that is continuous for . This model assumes proportional effects on the hazard for covariates, but avoids this assumption on the treatment effect through stratification by group.
Under model (1), the maximum partial likelihood estimator (MPLE) of is obtained by finding the root of the partial score function at calendar time , , where is the simple counting process for the number of failures observed in for the th individual in the th group at calendar time , is the corresponding at-risk process, , , and . The partial observed information matrix at calendar time is found as , where and We can show that the expected partial information matrix is equal to
The following assumptions are made about the data:
-
1.
For each , the set of quadruples are independent and identically distributed;
-
2.
The random vectors and are independent;
-
3.
is independent of for ;
-
4.
For each , there exists such that ;
-
5.
Model (1) holds.
Assumption (3) is similar to that made in Sellke and Siegmund, (1983) for a sequential analysis of the Cox model and presumes that the distributions of covariates and event and censoring times do not change over calendar time.
Under model (1), the treatment-specific baseline cumulative hazard function can be estimated at analysis using the standard method of Breslow, (1974). Let denote the maximum partial likelihood estimator of at calendar time for . Then we can obtain an estimator of at analysis in a similar manner to the estimator of in the fixed sample design setting, given by for . Because for , the treatment-specific baseline survival function is estimated by at calendar time for .
Let and denote, respectively, the cumulative hazard function and the survival function for treatment group conditional on covariates . Under model (1), the treatment-specific conditional cumulative hazard function is and the conditional treatment-specific survival function is calculated as , where is the true value of . At analysis , and can be estimated by and for and .
Since , the survival probability at a fixed survival time is a marginal survival probability for group at that averages the conditional survival probabilities over all patients in the target population. This is naturally estimated at analysis by the covariate-adjusted survival probability
which is an average of survival probability estimates under treatment over all patients in the study population.
2.3 Group Sequential Test of Treatment Effect
A two-sample comparison of survival probabilities at a fixed time point between the control group and the intervention group is established in the two-sided hypothesis: versus . One-sided testing of the alternative hypothesis or can be considered for testing superiority or inferiority at time of group 1 relative to 0. We aim to extend the covariate-adjusted survival probabilities described in Section 2.2 to the group sequential design setting for testing the null hypothesis based on accumulating survival data at calendar times, denoted by . It is assumed that which ensures a positive probability exists of observing some events in the survival time interval for each analysis.
At each calendar analysis time , the successive estimators and of the treatment-specific survival probabilities and can be used as a basis to conduct this test through the sequence of standardized statistics for and , where is a consistent estimator for the asymptotic variance of the estimated SP difference at analysis . The expressions for and are provided in and following Theorem 1 below. The associated information level at calendar time is defined as the reciprocal of the estimated variance of , i.e. . The validity of the group sequential design using the test statistics relies on the correct determination of the group-sequential boundaries based on information fraction accrued at each interim look, which requires knowledge of the joint distribution of the test statistics. To permit flexibility in the choice of analysis times, whose number and timing is often not predetermined, the following theorem establishes the asymptotic joint null distribution of the stochastic process .
Theorem 1
Let the survival time be given. Suppose that the regularity conditions (A)-(H) in the Appendix are satisfied for . Then under the stratified PH model (1) and under the null hypothesis , the stochastic process converges weakly to a Gaussian process with continuous sample paths, mean 0, and covariance function
where
,
and
In particular, .
The derivation of Theorem 1 is included in the Supplementary Materials. This result constitutes a basis for the design and analysis of group sequential clinical trials
using the difference of covariate-adjusted survival probabilities.
Under the null hypothesis,
the joint distribution of
possesses asymptotically a normal independent (reverse) increments covariance structure in that
where ACov and AVar stand for asymptotic covariance and asymptotic variance, respectively.
This implies that, like many other group sequential analysis methods discussed in Jennison and Turnbull (2000),
the repeatedly computed Wald test statistics
follow asymptotically the canonical joint distribution with a Markov structure, i.e.
Because this asymptotic distribution has exactly the same structure
as many commonly-used sequentially computed test statistics,
standard methodology can be used to design and analyze group sequential tests
using the test statistics .
As a result, we will use the large-sample joint null distribution of
to obtain appropriate critical values for conducting covariate-adjusted group sequential testing of SPs.
This allows the use of standard group sequential methods for early stopping.
The asymptotic variance
can be estimated consistently by
where
,
and
for .
3 Simulations
Simulation studies were conducted with the following objectives: (1) investigate the performance of the proposed test in meeting type I error and power specifications with practical sample sizes, and (2) compare the achieved type I error rate and power from the proposed method to existing methods. The survival probability at a pre-specified time point was compared between treatment groups using the proposed method, Kaplan-Meier estimation, which does not adjust for covariates, and the Cox PH model, which assumes proportionality between treatment groups. We simulated randomized group sequential trials to compare the treatment effect between an experimental treatment group and a control group by testing for the proposed test and Kaplan-Meier based test. For the Cox PH model based test, we included the treatment indicator and covariates in a Cox model and evaluated , where is the parameter for .
Subjects were randomized between the treatment and control groups at a 1:1 ratio and were uniformly enrolled during an accrual period [0, A]. Let the length of the study be . Group sequential tests were performed at a significance level of using the proposed test with three interim analyses. We used the alpha spending function , where is the information fraction, i.e., the fraction of total information for the trial. Calendar times for the three interim analyses were pre-specified so that the expected information fraction at each analysis would be , and . The total information level and interim analysis times were computed using Monte Carlo estimation for each simulation scenario.
Trial data were simulated as follows. Assume the event time for each subject follows a Weibull distribution with survival function , where the shape and rate parameters and depend on and through the forms and . The hazard function for the Weibull distribution has the form . Then, the hazard ratio of the treatment groups has the form . Note that the hazard ratio equals when , and that there are PH in this case; when , the PH assumption is violated. Furthermore, under , it can be shown that .
Simulation parameters were chosen to be: equal sample sizes per treatment group of or 400; or 3 years; either no random censoring, or random censoring following a distribution to yield 5% censoring per year; accrual period A = 2 or 4. was set to under ; under the alternative hypothesis , was set to , the value of which corresponds to the treatment effect at which the proposed test should have 80% power. We consider two possible distributions for the set of influential covariates, : a single covariate following the standard normal distribution, and two covariates following standardized Bernoulli(0.3) and Bernoulli(0.5) distributions. The covariate effects were specified as for each covariate distribution, where is the number of covariates and is a parameter controlling the level of covariate influence; under this specification, the variance of the linear predictor is the same under both covariate distributions for a given value of . Possible choices of were , , and . These simulation parameter settings yield 96 possible parameter specifications for each of the treatment group and control group. We performed 10,000 simulated trials for each parameter specification and obtained Monte Carlo estimates to evaluate the empirical type I error rate and power of the proposed tests.
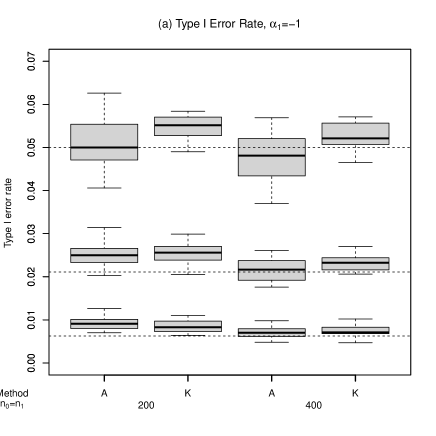
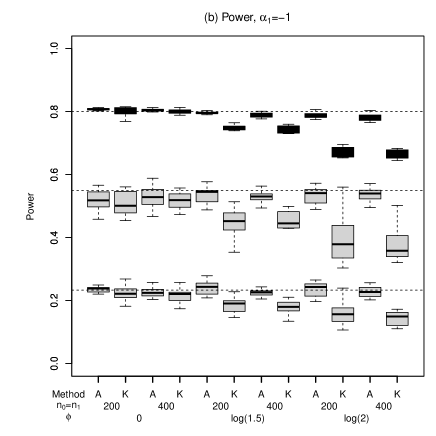
A - Adjusted Survival Probability, K - Kaplan-Meier
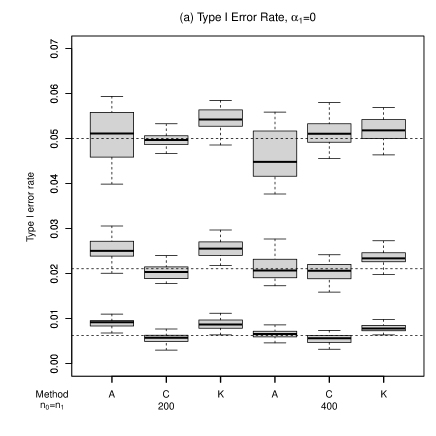
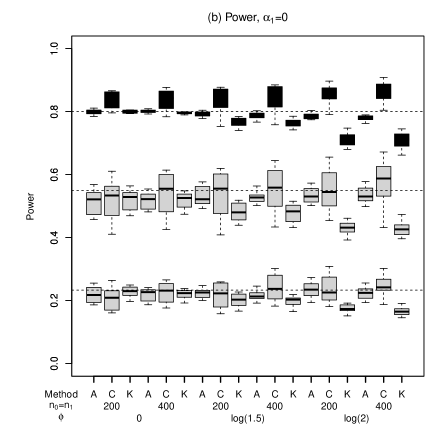
A - Adjusted Survival Probability, C - Cox Model, K - Kaplan-Meier
Estimates of the cumulative type I error rate and power at each of the three stages were obtained for each method. Figures 1a and 1b summarize achieved stagewise type I error rates and power, respectively, for the proposed method and Kaplan-Meier based test under the NPH setting . We observed the following trends. Stagewise empirical type I error of the proposed method were lower than those of the Kaplan-Meier based analysis, and met the targeted type I error rate of . In Figure 1b, stagewise empirical power of the proposed method were higher than those of the Kaplan-Meier based analysis for non-zero values of ; adjusting for the covariate(s) increases power compared to not adjusting. In addition, the proposed test is more robust to covariate effect size than the test using a Kaplan-Meier based analysis. The Cox model produced type I error rates of 70% or higher for all scenarios in the NPH setting and, unexpectedly, had type I error rates exceeding its corresponding power levels; given its abysmal performance in this setting, we omitted type I error and power for the Cox model from Figure 1.
Figures 2a and 2b show achieved stagewise type I error and power, respectively, for the three methods under the PH setting (). Similar trends were found in comparing type I error rates and power between the proposed method and Kaplan-Meier based analysis for the NPH setting. In the PH setting, the Cox model based test provided a modest boost in power compared to the proposed method and met the targeted type I error rate of .
4 Example
Concerns about the possibility of NPH were factored into the design of the Blood and Marrow Transplant Clinical Trials Network (BMT CTN) trial 1101, a randomized multicenter phase 3 trial (Fuchs et al.,, 2020). In patients with poor prognosis or who experience relapse of hematologic malignancies, allogeneic bone marrow or blood stem cell transplant can be a curative treatment option. A human leukocyte antigen (HLA)-matched unrelated donor or sibling is favored since HLA mismatches between donor and recipient are associated with a higher chance of graft-versus-host-disease (GVHD) and non-relapse mortality as well as inferior survival. However, for some patients a suitable HLA-matched donor may not be available. In these situations, alternative donor options include unrelated donor umbilical cord blood and an HLA-mismatched relative. These methods motivated the BMT CTN 1101 trial, which compared double umbilical cord blood (UCB) and haploidentical (Haplo) related donor transplantation for the treatment of leukemia and lymphoma in adults. The primary endpoint was progression-free survival (PFS) and key secondary endpoints were overall survival (OS), non-relapse mortality, and malignancy relapse/progression. Because investigators had concerns that the treatment groups may have NPH, the analysis of PFS employed a fixed time point comparison of survival probabilities at 2 years post-randomization. Furthermore, since the trial was expected to have a 6 year duration, a GS design was used with 3 planned interim efficacy analyses. The results from this trial indicate that (1) there is no significant difference in PFS between umbilical cord blood (UCB) and Haplo transplantation for leukemia or lymphoma and (2) Haplo transplantation provides lower non-relapse mortality and superior OS compared to UCB transplantation.
We re-visit the 1101 trial data by re-analyzing the data using the proposed methods and comparing the results with those of the original analysis. A total of 368 patients were randomized at a 1:1 ratio to the two treatment arms, UCB and Haplo. The original trial analysis of PFS employed a comparison of survival at 2 years post-randomization by Kaplan-Meier estimates, which do not adjust for covariates. The actual trial duration was 8 years, longer than originally planned, with an enrollment period of 6 years and all patients followed for 2 years post-randomization. To allow the possibility of declaring efficacy early and stopping the trial, a group sequential Kaplan-Meier based comparison with six planned interim analyses annually from years 3 to 8 was utilized to compare PFS between treatment groups. The treatment groups did not differ significantly on PFS at any interim analyses, and hence the trial was not stopped early. At the final analysis, 2 year PFS estimates were 35% for the UCB arm and 41% for the Haplo arm, and did not differ significantly (=0.41). OS at 2 years was found to be higher for the Haplo group at the final analysis compared to UCB (estimates 57% and 46% for Haplo and UCB, respectively; =0.04).
Several covariates are known or suspected to affect progression and mortality risk in the patient population of interest: age, gender, race, ethnicity, primary disease of lymphoma or leukemia, Karnofsky performance score, disease risk index, hematopoietic cell transplantation comorbidity index, and patient cytomegalovirus status at transplant. A previous secondary analysis showed that there was not significant evidence that the PH assumption was violated for these covariates. Therefore, we re-analyze the 1101 trial data to compare PFS and OS at 2 years post-randomization between the treatment arms with group sequential testing using both the proposed method to account for these influential covariates and a Kaplan-Meier analysis. The same interim analysis schedule is employed as designed for the original trial, with analyses annually from years 3 to 8. Alpha spending functions were used to allow for early stopping for efficacy and were chosen from the power family in Jennison and Turnbull, (1999) with . Information fractions for both PFS and OS were calculated using the observed information at each stage. For PFS, the total information was set at 450.550 as per trial protocol; for OS the total information was set at 386.066, the observed information at year 8 since the original study used a single analysis for OS at the end of study and did not specify a target information level for this endpoint. Note that the information fractions are different for the two methods, leading to different critical values from the alpha spending function.
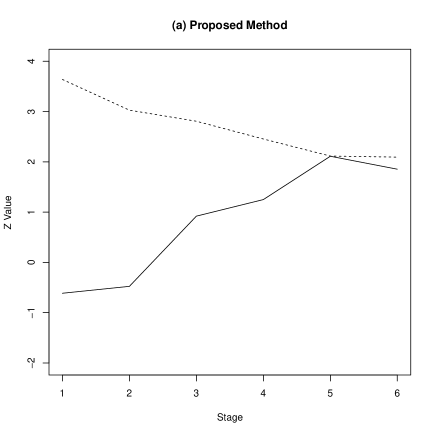
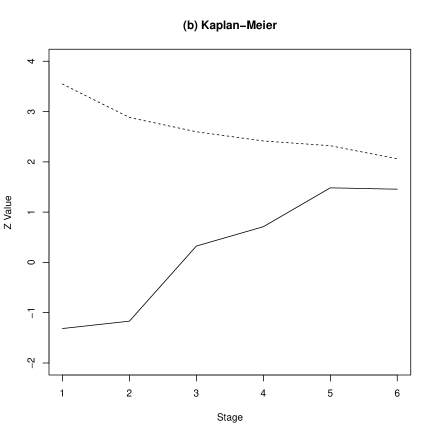
For PFS, standardized test statistics for the group sequential test using the proposed adjusted survival probability method are shown in Figure 3a; the group sequential Kaplan-Meier based test estimates are shown in Figure 3b. Both methods found no significant difference at any stage. Using a group sequential design with the proposed method yielded consistent results with the original group sequential Kaplan-Meier analysis, but also takes into account potentially influential covariates.
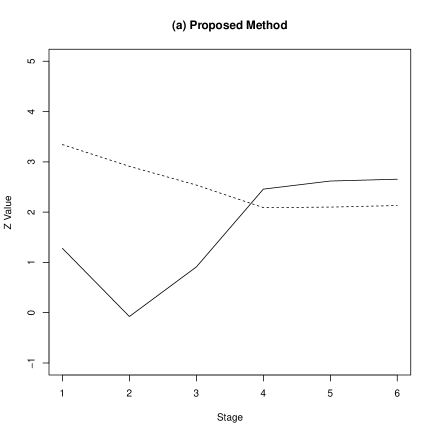
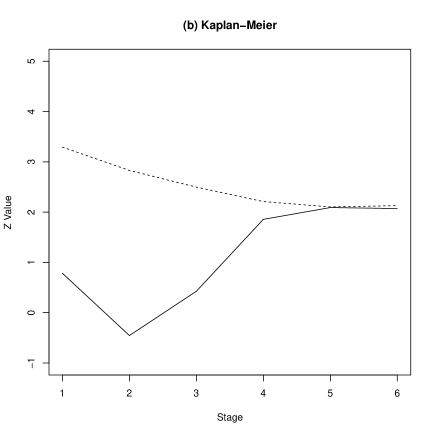
For OS, the proposed covariate-adjusted GS test statistics are shown in Figure 4a, whereas the Kaplan-Meier based GS test statistics are shown in Figure 4b. The Kaplan-Meier GS test found no significant difference in survival probabilities between the two groups at any stage. For the proposed method, a significant difference was found at 6 years, showing higher 2 year survival for the Haplo arm compared to UCB. By adjusting for covariates and employing a group sequential design with the proposed method, a significant difference in overall survival would be found 2 years before the original study ended, while a GS Kaplan-Meier analysis would not have found a notable difference at any point during the trial.
5 Discussion
In this paper, we have developed covariate-adjusted group sequential tests for comparing survival probabilities at a fixed time point under a NPH setting. The proposed covariate-adjusted group sequential test statistics under the treatment stratified PH model enjoy an independent increments structure asymptotically, allowing for the application of available methods to determine critical values for testing. Simulations demonstrate that the proposed GS tests met targeted type I error rate and power specifications and were robust to both the PH assumption and covariate effect size. A re-analysis of the BMT CTN 1101 trial illustrated the application of these methods.
There are a couple extensions to the methods discussed in this paper. First, it is of interest to investigate methods for sample size and power calculation that use adjusted survival probability methods to assist with designing clinical trials that will use the adjusted survival probability as an endpoint. A future study will examine potential methods for accurate sample size and power calculations for fixed sample and group sequential studies that use the adjusted survival probability methods. Approaches using sample size formulas and simulations will be explored for generating sample size/power estimates and will be compared using empirical studies. Second, we are interested in investigating GS testing of another endpoint, the restricted mean survival time (RMST), which is useful in NPH settings. The RMST is defined as the expected time survived over a specified interval of time and can be shown to be equal to the area under the survival curve over this interval. When comparing RMSTs between treatment groups, the treatment effect has a clear and clinically useful interpretation as the amount of lifetime saved over an interval for one group compared to another. The RMST is an alternative to the hazard ratio in the design and analyses of clinical trials with time to event outcomes, and has been studied in fixed sample designs (Royston and Parmar,, 2013). GS tests for comparing unadjusted RMSTs between treatments have been investigated (Murray and Tsiatis,, 1999), but covariate adjustment has yet to be incorporated for restricted mean comparisons in the sequential design setting. A group sequential, covariate-adjusted test of the equality of RMSTs will be studied in future work.
Acknowledgements
The authors are grateful to the Blood and Marrow Transplant Clinical Trials Network (BMT CTN) for permission to use and re-analyze the 1101 trial data. Support for the BMT CTN 1101 trial was provided by grants U10HL069294 and U24HL138660 to the BMT CTN from the National Heart, Lung, and Blood Institute (NHLBI) and the National Cancer Institute (NCI). The Center for International Blood and Marrow Transplant Research (CIBMTR) is supported primarily by NCI, NHLBI, and the National Institute of Allergy and Infectious Diseases grant 5U24CA076518; and from HHSH234200637015C (HRSA/DHHS) to the Center for International Blood and Marrow Transplant Research; NHLBI and NCI grant 4U10HL069294; the Health Resources and Services Administration, Department of Health and Human Services contract HHSH250201200016C; and the Office of Naval Research grants N00014-17-1-2388 and N00014-16-1-2020. The content is solely the responsibility of the authors and does not necessarily represent the official views of the aformentioned parties.
Data Availability Statement
The data used for the examples in Section 4 are available from the Blood and Marrow Transplant Clinical Trials Network. Restrictions apply to the availability of these data, which were permitted to be analyzed by the authors in this paper. Data are available from the authors with the permission of the Blood and Marrow Transplant Clinical Trials Network.
Supplementary Materials
6 Proof of Theorem 1
Regularity conditions
Throughout this paper, let denote the true value of under model (1). For a vector , write and . For a matrix , write . We assume the following regularity conditions under the treatment-stratified proportional hazards regression model (1), which are similar to those of Fleming and Harrington (1991) under the proportional hazards regression model.
-
(A)
The survival time is such that for .
-
(B)
For , , and , there exists a neighborhood of and, respectively, scalar, vector, and matrix functions , , and defined on such that, for and ,
Write
Then, for all and ,
-
(C)
There exists a such that, for ,
-
(D)
For and , the functions are bounded and is bounded away from 0 on . The family of functions , , is an equicontinuous family at . See Definition 8.2.1 of Fleming and Harrington (1991, page 289) for the definition of an equicontinuous family of real-valued functions.
-
(E)
For each , there exists a constant such that, as ,
(4) -
(F)
There exists such that the matrix is positive definite for all , where
(5) Write .
-
(G)
For each , there exists a function with such that
as .
We remark that the quantities and defined in Condition (B) actually do not depend on the calendar time under model (1) because and are independent. Consequently, we will write throughout that and for .
Incremental counting processes
According to Tsiatis, Boucher, and Kim (1995), we define a right continuous filtration as the increasing sequence of sigma algebras generated by
where and . For each fixed calendar time , it follows from Theorem 4.2.1 of Fleming and Harrington (1991, page 131) that under model (1), is a locally square-integrable martingale with respect to with predictable variation process , where is the compensator process of the counting process with respect to at each calendar time .
Using the same device as in Tsiatis et al. (1995) and Jennison and Turnbull (1997), we define -adapted incremental counting processes associated with individual ’s observation in group between successive pairs of interim analyses, i.e. and for Under model (1), the compensator process of the counting process with respect to is given by and for , where and for . As a result, the stochastic process is a local square-integrable martingale with respect to for , where . Write and .
Notice that (i) the martingales and are orthogonal if or , because individuals are independent in the pooled sample; and (ii) the martingales and are orthogonal if , because they cannot jump at the same time. In addition, the counting process is a multivariate counting process, and the compensator of is continuous.
Finite dimensional distributions of
Under the null hypothesis , based on the asymptotic expansion of the average survival curve for each treatment group from Zucker (1998, page 704), we can write at calendar time , as ,
| (6) | ||||
| (7) | ||||
| (8) |
To establish the asymptotic joint normality of under at the calendar times , it follows from the asymptotic expansion (6) that we can consider the joint distribution of the -dimensional random vectors , , and by expressing them as stochastic integrals with respect to the martingales , i.e.
Considered as processes in , it is seen from these expressions that and are linear combinations of stochastic integrals of predictable and locally bounded processes with respect to the local square-integrable martingales for , , , and hence are also local square-integrable martingales with mean zero.
According to Theorem 8.2.1 of Fleming and Harrington (1991, page 290), the partial likelihood score vectors satisfy the Lindeberg condition (3.18) of Fleming and Harrington (1991, page 228). To show that the random vectors satisfy the Lindeberg condition for , write
where is the number at risk at survival time for and
Using Theorem 2.4.3 of Fleming and Harrington (1991, page 70) along with the linearity of , we have
where .
Condition (G) implies that
as for any ,
and hence
.
Furthermore, since is bounded away from 0 for by Condition (D),
it follows from Conditions (B) and (E) that
This implies that , which further implies that . Combining these results yields
Setting , we have proved that the random vectors , , and satisfy the Lindeberg condition (3.18) of Fleming and Harrington (1991, page 228).
Consequently, an application of Theorem 5.3.5 of Fleming and Harrington (1991, page 227) yields the asymptotic multivariate normal distribution of the -dimensional random vectors , , and by Rebolledo’s martingale central limit theorem. In particular, the -dimensional random vector
| (9) |
converges in distribution to a multivariate normal random vector with mean zero.
Since is, by (6), a linear combination of the components of the -dimensional random vector in (9), it follows from its asymptotic joint normality that the joint distribution of the -dimensional vector statistic is asymptotically multivariate normal with mean zero under the null hypothesis .
To calculate the asymptotic variances and covariances of , note first that for , , and after some lengthy calculations, where is the th component of for . As a result, and are asymptotically independent for and . Furthermore, since
for , this implies that the asymptotic covariance of and is
In particular, the asymptotic variance of is given by
For , and are asymptotically independent because the two treatment-specific samples are independent. Therefore, For , the asymptotic covariance of and is calculated as
In particular, the asymptotic variance of is given by
Tightness of
We have shown that the finite dimensional distributions of converge to those of the finite dimensional distributions of under the null hypothesis . To establish the asymptotic convergence of to the Gaussian process in distribution, we need to verify the tightness of when .
It follows from Theorem 4.3 of Bilias, Gu, and Ying (1997) that as ,
where the remainder term is uniform for under Conditions (B) and (D). According to Theorems 4.2 and 4.3 of Bilias, Gu, and Ying (1997), and converge in distribution to a vector Gaussian process and a Gaussian process, respectively, which implies that both and are tight for . Since is asymptotically a linear combination of and , the stochastic process is also tight for and . It now follows from Theorem B.1.6 of Fleming and Harrington (1991, page 340) that for every ,
| (10) | ||||
| (11) |
References
- Borghaei et al., (2015) Borghaei, H., Paz-Ares, L., Horn, L., Spigel, D. R., Steins, M., Ready, N. E., et al. (2015). Nivolumab versus docetaxel in advanced nonsquamous non-small-cell lung cancer. New Eng J Med, 373(17):1627–1639.
- Breslow, (1974) Breslow, N. (1974). Covariance analysis of censored survival data. Biometrics, pages 89–99.
- Chen, (2013) Chen, T.-T. (2013). Statistical issues and challenges in immuno-oncology. J Immunother Cancer, 1(1):1–9.
- Ciolino et al., (2013) Ciolino, J. D., Martin, R. H., Zhao, W., Jauch, E. C., Hill, M. D., and Palesch, Y. Y. (2013). Covariate imbalance and adjustment for logistic regression analysis of clinical trial data. J Biopharm Stat, 23(6):1383–1402.
- Ciolino et al., (2014) Ciolino, J. D., Martin, R. H., Zhao, W., Jauch, E. C., Hill, M. D., and Palesch, Y. Y. (2014). Continuous covariate imbalance and conditional power for clinical trial interim analyses. Contemp Clin Trials, 38(1):9–18.
- Cox, (1972) Cox, D. R. (1972). Regression models and life-tables. J R Stat Soc Series B Stat Methodol, 34(2):187–202.
- Ferrara et al., (2018) Ferrara, R., Pilotto, S., Caccese, M., Grizzi, G., Sperduti, I., Giannarelli, D., et al. (2018). Do immune checkpoint inhibitors need new studies methodology? J Thorac Dis, 10(Suppl 13):S1564.
- Fleming and Harrington, (2011) Fleming, T. R. and Harrington, D. P. (2011). Counting processes and survival analysis. John Wiley & Sons.
- Fuchs et al., (2020) Fuchs, E. J., O’Donnell, P. V., Eapen, M., Logan, B. R., Antin, J. H., Dawson, P., et al. (2020). Double unrelated umbilical cord blood versus HLA-haploidentical bone marrow transplantation (BMT CTN 1101). Blood.
- Gail and Byar, (1986) Gail, M. and Byar, D. (1986). Variance calculations for direct adjusted survival curves, with applications to testing for no treatment effect. Biom J, 28(5):587–599.
- Hoos, (2012) Hoos, A. (2012). Evolution of end points for cancer immunotherapy trials. Ann Oncol, 23:viii47–viii52.
- Howard et al., (1997) Howard, G., Chambless, L. E., and Kronmal, R. A. (1997). Assessing differences in clinical trials comparing surgical vs nonsurgical therapy: using common (statistical) sense. JAMA, 278(17):1432–1436.
- Jennison and Turnbull, (1999) Jennison, C. and Turnbull, B. W. (1999). Group sequential methods with applications to clinical trials. CRC Press.
- Kalbfleisch and Prentice, (2011) Kalbfleisch, J. D. and Prentice, R. L. (2011). The statistical analysis of failure time data. John Wiley & Sons.
- Kantoff et al., (2010) Kantoff, P. W., Higano, C. S., Shore, N. D., Berger, E. R., Small, E. J., Penson, D. F., et al. (2010). Sipuleucel-T immunotherapy for castration-resistant prostate cancer. New Eng J Med, 363(5):411–422.
- Lan and DeMets, (1983) Lan, K. K. G. and DeMets, D. L. (1983). Discrete sequential boundaries for clinical trials. Biometrika, 70(3):659–663.
- Lin et al., (1996) Lin, D., Shen, L., Ying, Z., and Breslow, N. (1996). Group sequential designs for monitoring survival probabilities. Biometrics, 52(3):1033–1041.
- Logan and Mo, (2015) Logan, B. R. and Mo, S. (2015). Group sequential tests for long-term survival comparisons. Lifetime data analysis, 21:218–240.
- Mantel, (1972) Mantel, N. (1972). Evaluation of survival data and two new rank order statistics arising in its considerations. Cancer Chemother Rep, 50:187–220.
- Murray and Tsiatis, (1999) Murray, S. and Tsiatis, A. A. (1999). Sequential methods for comparing years of life saved in the two-sample censored data problem. Biometrics, 55(4):1085–1092.
- O’Brien and Fleming, (1979) O’Brien, P. C. and Fleming, T. R. (1979). A multiple testing procedure for clinical trials. Biometrics, pages 549–556.
- Pocock, (1977) Pocock, S. J. (1977). Group sequential methods in the design and analysis of clinical trials. Biometrika, 64(2):191–199.
- Pocock et al., (2002) Pocock, S. J., Assmann, S. E., Enos, L. E., and Kasten, L. E. (2002). Subgroup analysis, covariate adjustment and baseline comparisons in clinical trial reporting: current practice and problems. Statistics in medicine, 21(19):2917–2930.
- Royston and Parmar, (2013) Royston, P. and Parmar, M. K. (2013). Restricted mean survival time: an alternative to the hazard ratio for the design and analysis of randomized trials with a time-to-event outcome. BMC medical research methodology, 13(1):1–15.
- Saad et al., (2018) Saad, E. D., Zalcberg, J. R., Péron, J., Coart, E., Burzykowski, T., and Buyse, M. (2018). Understanding and communicating measures of treatment effect on survival: can we do better? JNCI: Journal of the National Cancer Institute, 110(3):232–240.
- Scharfstein et al., (1997) Scharfstein, D. O., Tsiatis, A. A., and Robins, J. M. (1997). Semiparametric efficiency and its implication on the design and analysis of group-sequential studies. Journal of the American Statistical Association, 92(440):1342–1350.
- Sellke and Siegmund, (1983) Sellke, T. and Siegmund, D. (1983). Sequential analysis of the proportional hazards model. Biometrika, 70(2):315–326.
- Tian et al., (2018) Tian, L., Fu, H., Ruberg, S. J., Uno, H., and Wei, L.-J. (2018). Efficiency of two sample tests via the restricted mean survival time for analyzing event time observations. Biometrics, 74(2):694–702.
- Todd, (2007) Todd, S. (2007). A 25-year review of sequential methodology in clinical studies. Statistics in medicine, 26(2):237–252.
- Venook et al., (2017) Venook, A. P., Niedzwiecki, D., Lenz, H.-J., Innocenti, F., Fruth, B., Meyerhardt, J. A., et al. (2017). Effect of first-line chemotherapy combined with cetuximab or bevacizumab on overall survival in patients with KRAS wild-type advanced or metastatic colorectal cancer: a randomized clinical trial. JAMA, 317(23):2392–2401.
- Yang, (2019) Yang, S. (2019). Interim monitoring using the adaptively weighted log-rank test in clinical trials for survival outcomes. Statistics in Medicine, 38(4):601–612.
- Zeng and Lin, (2006) Zeng, D. and Lin, D. (2006). Efficient estimation of semiparametric transformation models for counting processes. Biometrika, 93(3):627–640.
- Zhang et al., (2007) Zhang, X., Loberiza, F. R., Klein, J. P., and Zhang, M.-J. (2007). A SAS macro for estimation of direct adjusted survival curves based on a stratified Cox regression model. Comput Methods Programs Biomed, 88(2):95–101.
- Zhao et al., (2019) Zhao, Y.-Q., Redman, M. W., and LeBlanc, M. L. (2019). Quantifying treatment effects using the personalized chance of longer survival. Statistics in medicine, 38(28):5317–5331.
- Zucker, (1998) Zucker, D. M. (1998). Restricted mean life with covariates: modification and extension of a useful survival analysis method. J Am Stat Assoc, 93(442):702–709.