ab, braket
Imaging quantum interference in a monolayer Kitaev quantum spin liquid candidate
Abstract
Single atomic defects are prominent windows to look into host quantum states because collective responses from the host states emerge as localized states around the defects. Friedel oscillations and Kondo clouds in Fermi liquids are quintessential examples. However, the situation is quite different for quantum spin liquid (QSL), an exotic state of matter with fractionalized quasiparticles and topological order arising from a profound impact of quantum entanglement. Elucidating the underlying local electronic property has been challenging due to the charge neutrality of fractionalized quasiparticles and the insulating nature of QSLs. Here, using spectroscopic-imaging scanning tunneling microscopy, we report atomically resolved images of monolayer \ceα-RuCl3, the most promising Kitaev QSL candidate, on metallic substrates. We find quantum interference in the insulator manifesting as incommensurate and decaying spatial oscillations of the local density of states around defects with a characteristic bias dependence. The oscillation differs from any known spatial structures in its nature and does not exist in other Mott insulators, implying it is an exotic oscillation involved with excitations unique to \ceα-RuCl3. Numerical simulations can reproduce the observed oscillation by assuming that itinerant Majorana fermions of Kitaev QSL are scattered across the Majorana Fermi surface. The oscillation provides a new approach to exploring Kitaev QSLs through the local response against defects like Friedel oscillations in metals.
I Introduction
Uniform electronic states of matter rearrange themselves in response to defects, forming characteristic spatial structures. The local electronic structure around defects is thus a fundamental fingerprint reflecting low-energy excitations of the host state. Eminent examples are screening phenomena of metals: Friedel oscillations for charged defects and Kondo clouds for magnetic defects [1, 2]. Advances in techniques of scanning tunneling microscopy allow us to directly image such defect states not only in metals but also in various quantum materials at atomic resolution unavailable by other means [3, 4, 5].
Utilizing defect states as in-situ probes is envisioned to search for quantum spin liquid (QSL), a highly entangled quantum-disordered state of insulating frustrated magnets [6, 7, 8, 9, 10, 11, 12, 13]. Depending on the symmetry of the system, several types of QSLs and accompanying fractionalized quasiparticles are predicted [6]. Among the QSLs is the Kitaev QSL, which has sparked an explosion of research because of Majorana fermions and non-abelian anyons resulting from the fractionalization of the quantum spin [6, 14, 15, 16]. The Kitaev model formulates localized spins on a two-dimensional (2D) honeycomb lattice interacting through bond-dependent Ising couplings. Noteworthy is that it possesses an exactly solvable ground state, from which Majorana fermions naturally emerge. This aspect is distinct from the unresolved ground states of triangular and kagome QSL candidate systems. Following the seminal proposal to embody the Kitaev model [17], a spin-orbit Mott insulator \ceα-RuCl3 was suggested as a promising candidate [18, 19, 20, 21]. Since then, a growing body of evidence has been accumulated to indicate the presence of Majorana fermions at low energies in this compound by measurements of Raman scattering, inelastic neutron scattering, specific heat, and thermal Hall effect [22, 23, 24, 25, 26, 27, 28, 29, 30, 31]. Despite such extensive studies, there is still room for debate on whether the Kitaev QSL is realized in \ceα-RuCl3 [32].
 \phantomcaption\phantomcaption\phantomcaption\phantomcaption
The quest for QSLs, including the Kitaev QSL, has been driven by spatially averaged probes, as exemplified above. Consequently, the experimental data and their interpretations have often been influenced by undesirable complexities due to structural disorders such as stacking faults and antisite defects [21, 34]. Exploiting spatially resolved probes is a reasonable circumvention to these difficulties. Besides the general context to investigate defect states described above, local electronic probes have been theoretically proposed to detect and control fractional magnetic excitations [35, 36, 37, 38, 39, 40]. While these previous studies underscore the need for spatially resolved experiments, an appropriate combination of probes and samples has been lacking. Recently, monolayer 1-\ceTaSe2, a candidate for another QSL in a 2D triangular lattice Mott insulator, has been examined by an scanning tunneling microscope (STM) [41, 42]. These pioneering works have suggested that the low-energy magnetic excitations could be detected experimentally at higher energies outside the Mott gap by measuring the tunneling electrons recombined from the fractionalized quasiparticles, called spinons. Motivated by these studies, we fabricated monolayer \ceα-RuCl3 films on highly oriented pyrolytic graphite (HOPG) substrates by pulsed laser deposition (Figs. 1 and 1) and conducted the electronic imaging study using an STM. (See Methods for details.)
II Results
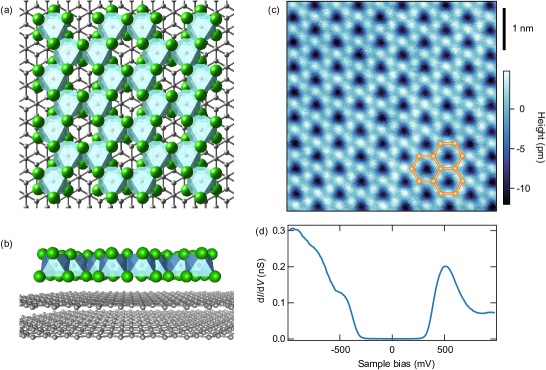
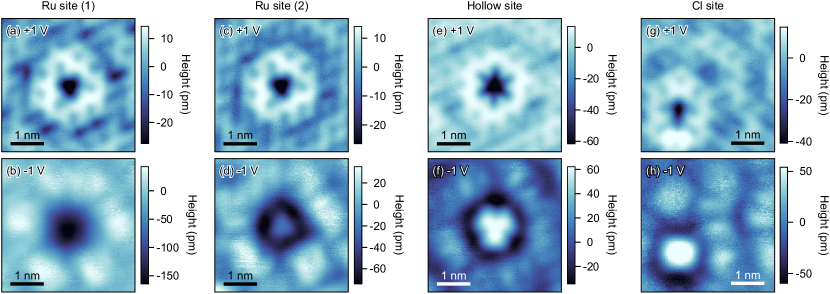
We first inspect fabricated films. Figure 1 shows an atomic-resolution topographic image of our film. Regularly-arranged circular protrusions form a Kagome-like lattice, replicating the previous study of monolayer \ceα-RuCl3 [43]. The protrusions are ascribed to mainly derive from the topmost Cl orbitals. The Ru site resides at the center of three protrusions. A Ru-honeycomb encloses a dark-colored hollow site, as shown in the overlaid illustration of Fig. 1. The conductance spectrum exemplified in Fig. 1 is also similar to the previous study. It shows an energy gap of about with the Fermi energy in the middle of the gap, indicating that the sample is an insulator with virtually no electron transfer from the substrate. From these close similarities with the previous study, we identify that the films are monolayer \ceα-RuCl3. Meanwhile, our spectra are strikingly different from those of the exfoliated films [44, 45], suggesting that our samples are free from the influence of the lattice deformation associated with the exfoliation process.
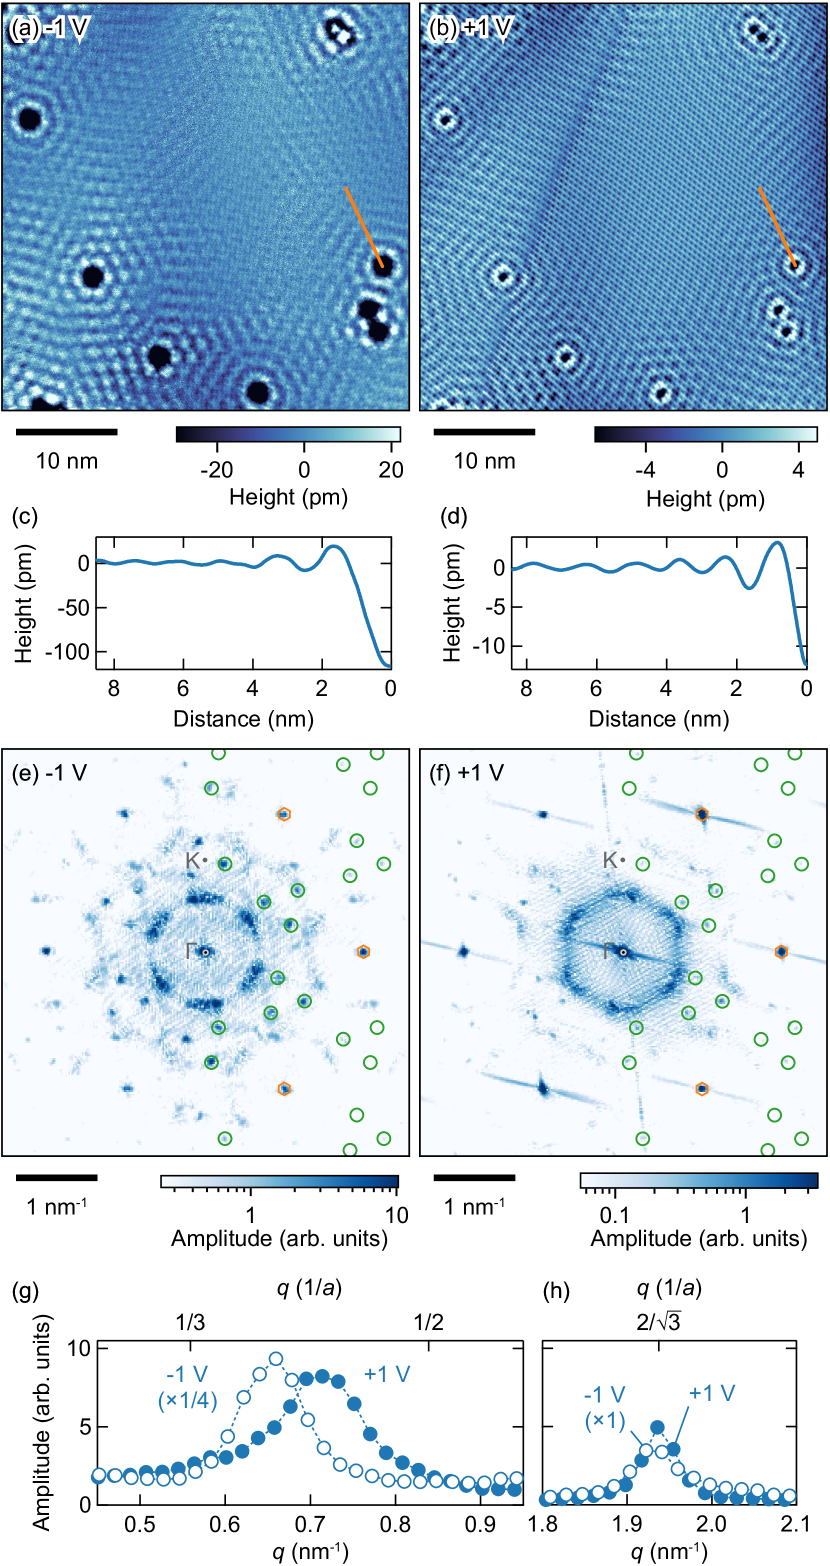
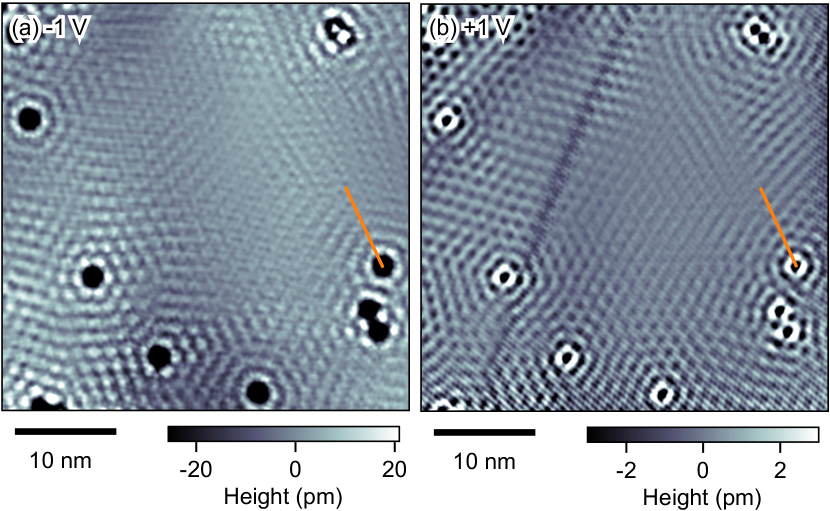
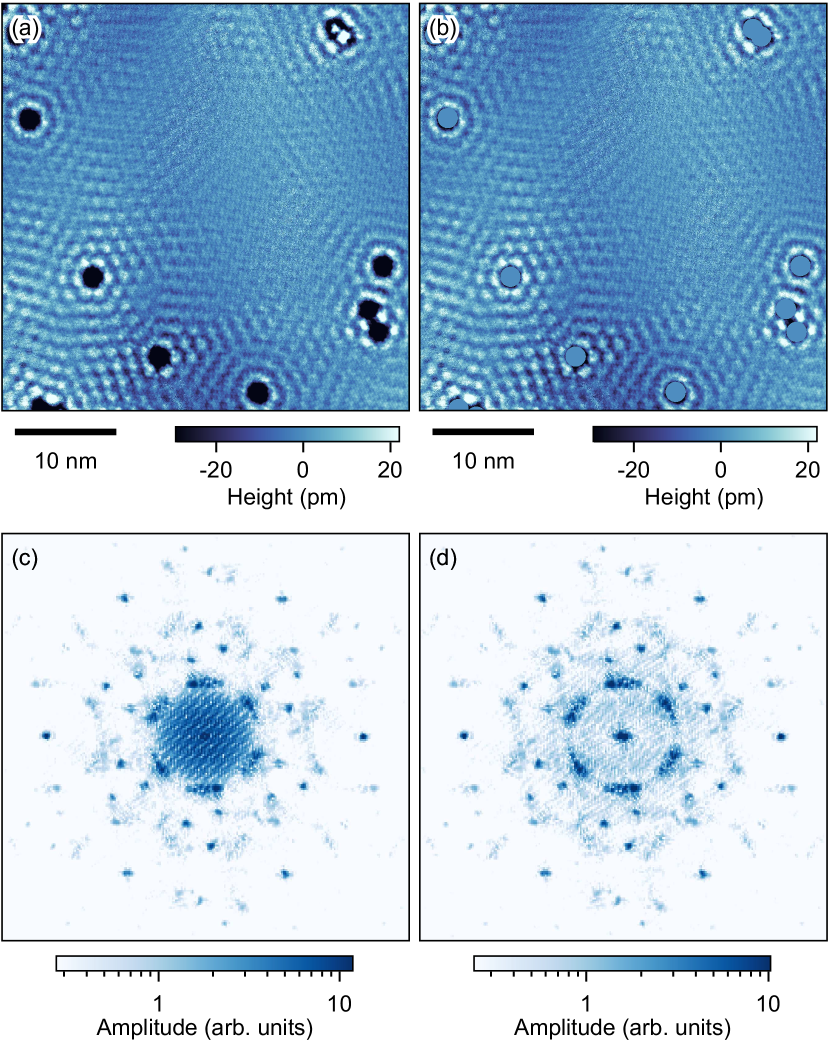
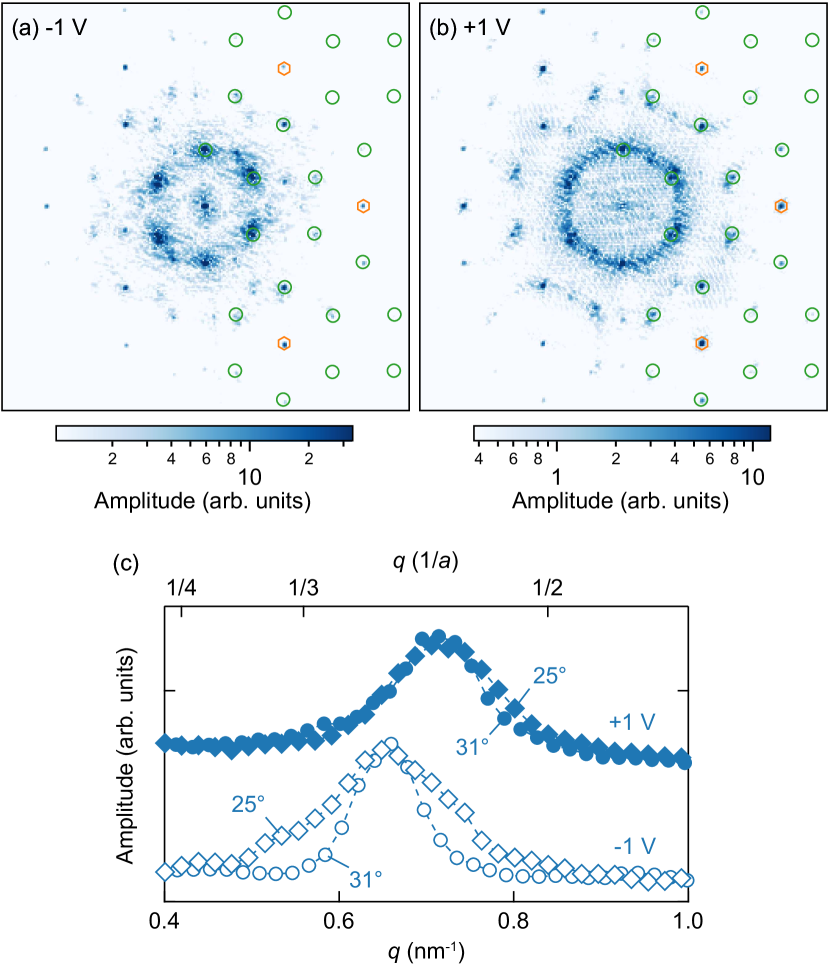
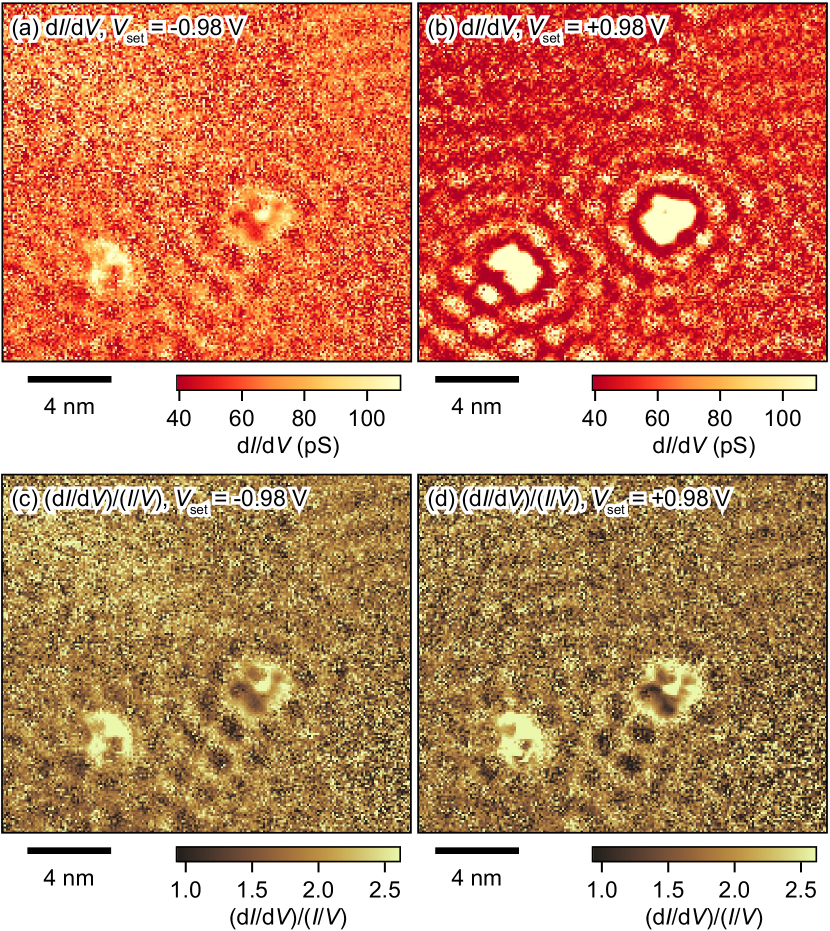
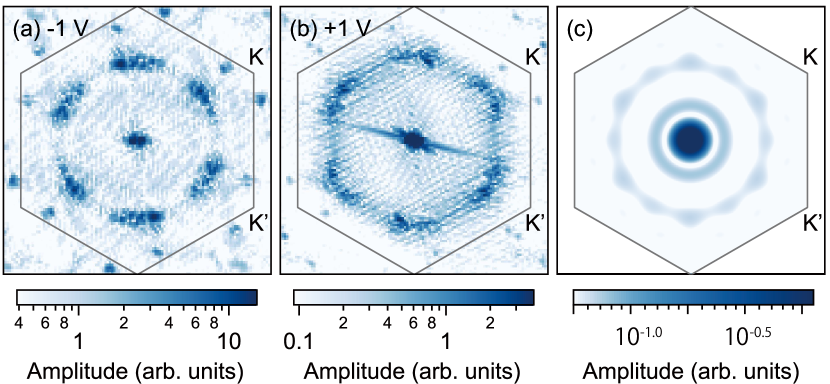
We next focus on the most peculiar feature we have observed. Figures 2 and 2 are topographic images taken at in the same field of view. We find concentric oscillatory patterns around defects. High-resolution measurements allow us to identify several types of defects (Fig. S1), showing that the oscillation appears independently of the defect sites. The oscillation is several times larger in amplitude at than at and decays away from the defects, as highlighted in Figs. 2 and 2 (see also Fig. S2). The decay means that the oscillation is not a moiré pattern between the monolayer \ceα-RuCl3 and the substrate. To analyze the wavevectors of oscillation, we calculated the Fourier transform, as shown in Figs. 2 and 2. We suppressed long-wavelength features from the defects for clarity, as demonstrated in Fig. S3. Strong peaks corresponding to the oscillations are found roughly in the –K direction at incommensurate positions. The wavenumbers of the incommensurate oscillation differ between the images, as shown in Fig. 2, while those of the Bragg peaks are the same, as shown in Fig. 2. The different wavenumbers indicate that the origin of the incommensurate oscillation is not structural but electronic. Therefore, we exclude phenomena involving lattice distortion, such as charge density waves, as the origin of the oscillation. In addition, due to the decaying feature and the different wavenumbers, the oscillation is distinguished from the long-wavelength super-modulations in monolayer -\ceTaSe2 [41].
The Fourier transforms also show many bias-independent peaks (the green circles) besides the Bragg peaks (the orange hexagons). These are satellite peaks generated by the substrate HOPG lattice with an angle of relative to the \ceα-RuCl3 lattice. We also found a monolayer \ceα-RuCl3 film with a relative angle of and observed the same oscillations (Fig. S4). The insensitivity to the relative angles demonstrates that the oscillation is irrelevant to coupling with the substrate. Moreover, electron tunneling directly from the substrate is negligibly small, as evidenced by the zero conductance in the insulating gap (Fig. 1). Therefore, the oscillation is inherent to the monolayer \ceα-RuCl3 and occurs in the monolayer \ceα-RuCl3, neither in the substrate nor at the interface between the monolayer \ceα-RuCl3 and the substrate.
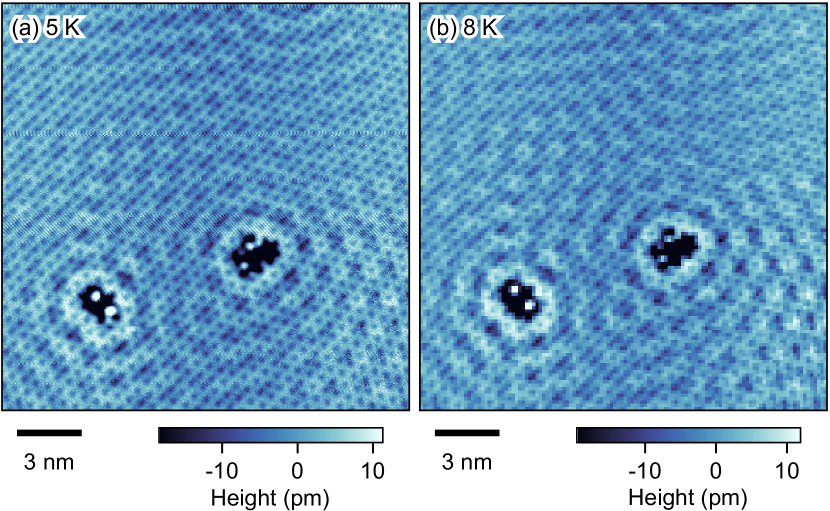
Since the oscillation is electronic in origin and occurs in \ceα-RuCl3, one may wonder if the zigzag antiferromagnetic order found in the bulk \ceα-RuCl3 is relevant to the oscillation. In the presence of the Kitaev interaction, the zigzag antiferromagnetic order arising from non-Kitaev interactions is indeed allowed even in 2D without being forbidden by the Mermin–Wagner theorem because the Kitaev interaction has symmetry [46]. However, even if it exists, the Néel temperature is expected to be lower in 2D films than in the bulk since the zigzag antiferromagnetic order is three-dimensional [47]. Moreover, the Imry–Ma argument indicates that long-range magnetic orders with symmetry are destroyed in 2D by infinitesimally weak disorders [48]. Therefore, we presume that the zigzag antiferromagnetic order is absent at , higher than the Néel temperature of in the bulk. As shown in Fig. 3, a topographic image taken at shows no discernable difference from one at , indicating that the oscillation occurs without the zigzag antiferromagnetic order. The oscillation pattern spreading out not unidirectionally but two-dimensionally also supports that the oscillation is irrelevant to the zigzag antiferromagnetic order.
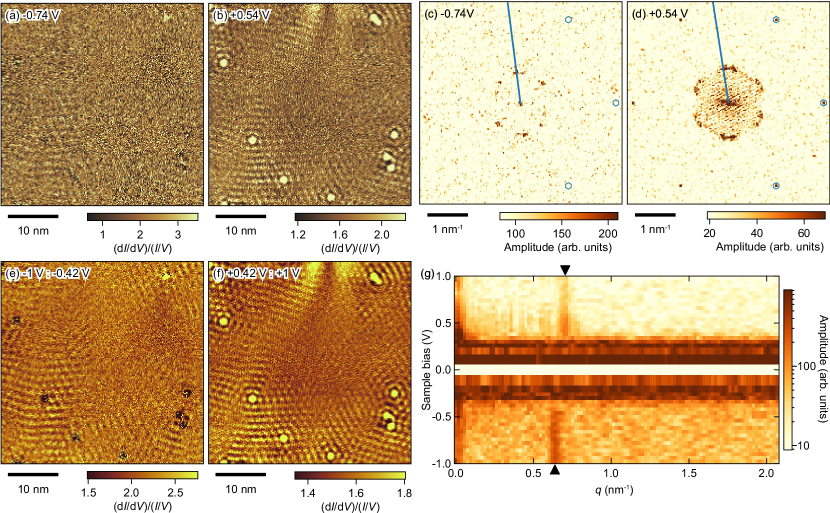
The oscillatory patterns in the STM images (and also the conductance maps as described later) decaying away from the defects imply quantum interference of fermionic quasiparticles around the defects. At first glance, the patterns resemble the Friedel oscillations in metals and quasiparticle interference. However, the former is ruled out because the monolayer \ceα-RuCl3 is insulating, as evidenced by the energy gap (Fig. 1). The latter can exist in insulators. The wavevectors of quasiparticle interference reflect the band structure and depend on the energy. Therefore, we performed spectroscopic imaging (Figs. 4 and 4) to unveil the dispersion relation of the oscillation. We adopt the normalized conductance map rather than the raw conductance map to mitigate the setpoint effect (Fig. S5). Figures 4 and 4 show Fourier transforms of conductance maps. Peaks corresponding to the oscillation are observed in the bias range outside the energy gap. Notably, the wavevectors differ between the polarities but do not change in each polarity, as shown in Fig. 4. The wavevector at each polarity is the same as that observed in the corresponding topographic image. Indeed, the normalized conductance images averaged for the negative and positive bias voltages (Figs. 4 and 4) exhibit oscillations similar to those in the topographic images (Figs. 2 and 2). We refer to this behavior of the experimental data as semi-independent of the bias voltage. The bias-independent aspect indicates that the oscillation is not quasiparticle interference because non-dispersive quasiparticle interference does not appear. Although non-dispersive quasiparticle interference requires electron bands to be parallelly shifted from one to the other, the intensity of quasiparticle interference from such bands vanishes due to destructive interference [49].
III Discussion
As mentioned above, the observed patterns differ from the known phenomena producing oscillatory patterns, such as moiré, charge density waves, Friedel oscillations, quasiparticle interference, and the super-modulation in monolayer -\ceTaSe2 [41]. Therefore, we conclude that the observed oscillation is an unprecedented oscillatory phenomenon. Since the oscillation appears in the energy range of lower and upper Hubbard bands, one could assume that the Hubbard interaction is involved in the oscillation. However, no other Mott insulators exhibit oscillations around defects [50, 51, 52]. Also, one might consider that the oscillation is special to monolayer films. However, the decaying and bias-semi-independent oscillation is not found in other insulating monolayer films [53, 41, 42, 52, 54]. Therefore, something unique to \ceα-RuCl3 is likely to be responsible for the oscillation.
Given that \ceα-RuCl3 is a promising candidate for Kitaev QSL, we would like to consider the Kitaev interaction as a possible origin of the oscillation. Then, two immediate questions arise: How are the spin properties amenable to detection using non-magnetic scanning tips, and what determines the length scale of the incommensurate oscillation? For the former, if spin–charge separation occurs, the tunneling electrons recombined from spinons and chargons may carry spin information [41, 42, 13]. However, this process is not the case for the Kitaev QSL because fractionalization occurs solely in the spin system. Instead, we consider a relationship in the Mott insulator that the charge density is tied to the spin correlation function [35, 55]. A spatial texture of the spin correlation function is then reflected in the charge density variation, which is readily imaged as a bias-independent pattern using an STM with a non-magnetic scanning tip. For the length scale of the oscillation, the incommensurability of the oscillation hints at the scattering of itinerant quasiparticles with a characteristic length akin to a Fermi wavelength. In the Kitaev QSL, the spins are fractionalized into itinerant and localized Majorana fermions; the former move around the whole crystal, while the latter form a -vortex called vison [16]. Thus, itinerant Majorana fermions could play an essential role in the oscillation. However, for the pure Kitaev model, the scattering vectors of the itinerant Majorana fermions at the Fermi energy are commensurate because the Dirac points of the Majorana band cross the Fermi energy at K and K′ points in the Brillouin zone. Nevertheless, the Majorana Fermi surface with incommensurate Fermi wavenumbers is possibly realized if there are perturbations breaking time-reversal and inversion symmetries that protect the positions of the Dirac points [56, 57]. Postulating that both symmetries are locally broken by the tunneling current injected from the scanning tip, the calculations of charge density variation reproduce the observed incommensurate oscillation, as shown in Figs. S6. In this scenario, the slightly different wavenumbers depending on the bias polarities could be attributed to the state relevant for the tunneling process only at negative bias voltages. (The discussion in this paragraph is detailed in Supplementary Material.)
While we have proposed the origin of the oscillation as described above, there may be different explanations [58] and a more comprehensive understanding is open for future research. Importantly, however, the decaying, incommensurate, and bias-semi-independent oscillation we found in the insulator manifests a new oscillatory phenomenon. The unforeseen oscillation represents the atomic-scale response of the quantum state with characteristic length scales. The absence of such oscillations in other Mott insulators and monolayer films implies that the observed oscillation may serve as a local signifier of Kitaev QSL experimentally elusive.
IV Methods
IV.1 Sample fabrication
Monolayer \ceα-RuCl3 films were deposited on HOPG substrates by pulsed laser deposition using a yttrium-aluminium-garnet laser (wavelength ). The targets were pelletized \ceα-RuCl3 single crystals grown by chemical vapor transport from commercial \ceRuCl3 powder. The chlorine partial pressure and the substrate temperature were optimized at and . This condition is essential to grow the phase separately from the phase [59] without mixing the two phases [43]. The fabricated thin films were transferred from the deposition chamber to the STM chamber without air exposure using a portable ultra-high vacuum chamber. As described in the main text, our samples are insulators, contrasting with the sizable electron transfer from the substrate and the metallic behavior of exfoliated samples [60, 61, 62]. The reason for the difference remains unidentified.
IV.2 Spectroscopic-imaging scanning tunneling microscopy
Spectroscopic imaging scanning tunneling microscopy measurements were performed using a low-temperature ultra-high vacuum system (UNISOKU USM 1300). The scanning tips were mechanically sharpened Pt-Ir wires cleaned by electron-beam heating and conditioned on clean Au(111) surfaces. All the measurements were carried out at unless otherwise noted. Topographic images were recorded in the constant-current mode. Differential conductance spectra were measured using a standard lock-in technique with a modulation amplitude of at a frequency of . The normalized conductance is obtained by numerical division. When Fourier transforms are calculated, affine transformations are applied so that the Bragg peaks are at the high symmetry positions, and no symmetrization is used.
Acknowledgements.
The authors thank J. Knolle, E. -G. Moon, Y. Motome, J. Nasu, and M. Udagawa for fruitful discussions. This work was supported by CREST (No. JPMJCR19T5) and the Center of Innovations for Sustainable Quantum AI (No. JPMJPF2221) from Japan Science and Technology (JST), and Grants-in-Aid for Scientific Research (KAKENHI) (Nos. JP20K03860, JP21H01039, JP22J20066, JP22H00105, JP22H01221, JP22K14005, JP23H00089, and JP23K17669) and Grant-in-Aid for Scientific Research on Innovative Areas “Quantum Liquid Crystals” (Nos. JP19H05824, JP22H04480) from Japan Society for the Promotion of Science (JSPS). M. O. T. acknowledges support from a JSPS Fellowship for Young Scientists. M. G. Y. acknowledges support from JST PRESTO (No. JPMJPR225B).References
- Friedel [1952] J. Friedel, The distribution of electrons round impurities in monovalent metals, Philos. Mag. J. Sci. 43, 153 (1952).
- Kondo [1964] J. Kondo, Resistance Minimum in Dilute Magnetic Alloys, Prog. Theor. Phys. 32, 37 (1964).
- Pan et al. [2000] S. H. Pan, E. W. Hudson, K. M. Lang, H. Eisaki, S. Uchida, and J. C. Davis, Imaging the effects of individual zinc impurity atoms on superconductivity in \ceBi2Sr2CaCu2O_8+δ, Nature 403, 746 (2000).
- Kitchen et al. [2006] D. Kitchen, A. Richardella, J.-M. Tang, M. E. Flatté, and A. Yazdani, Atom-by-atom substitution of Mn in \ceGaAs and visualization of their hole-mediated interactions, Nature 442, 436 (2006).
- Ji et al. [2008] S.-H. Ji, T. Zhang, Y.-S. Fu, X. Chen, X.-C. Ma, J. Li, W.-H. Duan, J.-F. Jia, and Q.-K. Xue, High-Resolution Scanning Tunneling Spectroscopy of Magnetic Impurity Induced Bound States in the Superconducting Gap of Pb Thin Films, Phys. Rev. Lett. 100, 226801 (2008).
- Savary and Balents [2016] L. Savary and L. Balents, Quantum spin liquids: a review, Rep. Prog. Phys. 80, 016502 (2016).
- Willans et al. [2010] A. J. Willans, J. T. Chalker, and R. Moessner, Disorder in a Quantum Spin Liquid: Flux Binding and Local Moment Formation, Phys. Rev. Lett. 104, 237203 (2010).
- Vojta et al. [2016] M. Vojta, A. K. Mitchell, and F. Zschocke, Kondo Impurities in the Kitaev Spin Liquid: Numerical Renormalization Group Solution and Gauge-Flux-Driven Screening, Phys. Rev. Lett. 117, 037202 (2016).
- Das et al. [2016] S. D. Das, K. Dhochak, and V. Tripathi, Kondo route to spin inhomogeneities in the honeycomb Kitaev model, Phys. Rev. B 94, 024411 (2016).
- Wang et al. [2021] R. Wang, Y. Wang, Y. X. Zhao, and B. Wang, Emergent Kondo Behavior from Gauge Fluctuations in Spin Liquids, Phys. Rev. Lett. 127, 237202 (2021).
- Kolezhuk et al. [2006] A. Kolezhuk, S. Sachdev, R. R. Biswas, and P. Chen, Theory of quantum impurities in spin liquids, Phys. Rev. B 74, 165114 (2006).
- Ribeiro and Lee [2011] P. Ribeiro and P. A. Lee, Magnetic impurity in a spin liquid with a spinon Fermi surface, Phys. Rev. B 83, 235119 (2011).
- Mross and Senthil [2011] D. F. Mross and T. Senthil, Charge Friedel oscillations in a Mott insulator, Phys. Rev. B 84, 041102(R) (2011).
- Takagi et al. [2019] H. Takagi, T. Takayama, G. Jackeli, G. Khaliullin, and S. E. Nagler, Concept and realization of Kitaev quantum spin liquids, Nat. Rev. Phys. 1, 264 (2019).
- Motome and Nasu [2020] Y. Motome and J. Nasu, Hunting Majorana fermions in Kitaev magnets, J. Phys. Soc. Jpn. 89, 012002 (2020).
- Kitaev [2006] A. Kitaev, Anyons in an exactly solved model and beyond, Ann. Phys. 321, 2 (2006).
- Jackeli and Khaliullin [2009] G. Jackeli and G. Khaliullin, Mott insulators in the strong spin-orbit coupling limit: from Heisenberg to a quantum compass and Kitaev models, Phys. Rev. Lett. 102, 017205 (2009).
- Plumb et al. [2014] K. W. Plumb, J. P. Clancy, L. J. Sandilands, V. V. Shankar, Y. F. Hu, K. S. Burch, H.-Y. Kee, and Y.-J. Kim, \ceα-RuCl3: A spin-orbit assisted Mott insulator on a honeycomb lattice, Phys. Rev. B 90, 041112(R) (2014).
- Johnson et al. [2015] R. D. Johnson, S. C. Williams, A. A. Haghighirad, J. Singleton, V. Zapf, P. Manuel, I. I. Mazin, Y. Li, H. O. Jeschke, R. Valentí, and R. Coldea, Monoclinic crystal structure of \ceα-RuCl3 and the zigzag antiferromagnetic ground state, Phys. Rev. B 92, 235119 (2015).
- Kim et al. [2015] H.-S. Kim, V. S. V., A. Catuneanu, and H.-Y. Kee, Kitaev magnetism in honeycomb \ceα-RuCl3 with intermediate spin-orbit coupling, Phys. Rev. B 91, 241110(R) (2015).
- Cao et al. [2016] H. B. Cao, A. Banerjee, J.-Q. Yan, C. A. Bridges, M. D. Lumsden, D. G. Mandrus, D. A. Tennant, B. C. Chakoumakos, and S. E. Nagler, Low-temperature crystal and magnetic structure of \ceα-RuCl3, Phys. Rev. B 93, 134423 (2016).
- Sandilands et al. [2015] L. J. Sandilands, Y. Tian, K. W. Plumb, Y.-J. Kim, and K. S. Burch, Scattering continuum and possible fractionalized excitations in \ceα-RuCl3, Phy. Rev. Lett. 114, 147201 (2015).
- Nasu et al. [2016] J. Nasu, J. Knolle, D. L. Kovrizhin, Y. Motome, and R. Moessner, Fermionic response from fractionalization in an insulating two-dimensional magnet, Nat. Phys. 12, 912 (2016).
- Banerjee et al. [2017] A. Banerjee, J. Yan, J. Knolle, C. A. Bridges, M. B. Stone, M. D. Lumsden, D. G. Mandrus, D. A. Tennant, R. Moessner, and S. E. Nagler, Neutron scattering in the proximate quantum spin liquid \ceα-RuCl3, Science 356, 1055 (2017).
- Do et al. [2017] S.-H. Do, S.-Y. Park, J. Yoshitake, J. Nasu, Y. Motome, Y. S. Kwon, D. T. Adroja, D. J. Voneshen, K. Kim, T.-H. Jang, J.-H. Park, K.-Y. Choi, and S. Ji, Majorana fermions in the Kitaev quantum spin system \ceα-RuCl3, Nat. Phys. 13, 1079 (2017).
- Widmann et al. [2019] S. Widmann, V. Tsurkan, D. A. Prishchenko, V. G. Mazurenko, A. A. Tsirlin, and A. Loidl, Thermodynamic evidence of fractionalized excitations in \ceα-RuCl3, Phys. Rev. B 99, 094415 (2019).
- Tanaka et al. [2022] O. Tanaka, Y. Mizukami, R. Harasawa, K. Hashimoto, K. Hwang, N. Kurita, H. Tanaka, S. Fujimoto, Y. Matsuda, E.-G. Moon, and T. Shibauchi, Thermodynamic evidence for a field-angle-dependent Majorana gap in a Kitaev spin liquid, Nat. Phys. 18, 429 (2022).
- Kasahara et al. [2018] Y. Kasahara, T. Ohnishi, Y. Mizukami, O. Tanaka, S. Ma, K. Sugii, N. Kurita, H. Tanaka, J. Nasu, Y. Motome, T. Shibauchi, and Y. Matsuda, Majorana quantization and half-integer thermal quantum Hall effect in a Kitaev spin liquid, Nature 559, 227 (2018).
- Yamashita et al. [2020] M. Yamashita, J. Gouchi, Y. Uwatoko, N. Kurita, and H. Tanaka, Sample dependence of half-integer quantized thermal Hall effect in the Kitaev spin-liquid candidate \ceα-RuCl3, Phys. Rev. B 102, 220404(R) (2020).
- Yokoi et al. [2021] T. Yokoi, S. Ma, Y. Kasahara, S. Kasahara, T. Shibauchi, N. Kurita, H. Tanaka, J. Nasu, Y. Motome, C. Hickey, S. Trebst, and Y. Matsuda, Half-integer quantized anomalous thermal Hall effect in the Kitaev material candidate \ceα-RuCl3, Science 373, 568 (2021).
- Bruin et al. [2022] J. A. N. Bruin, R. R. Claus, Y. Matsumoto, N. Kurita, H. Tanaka, and H. Takagi, Robustness of the thermal Hall effect close to half-quantization in \ceα-RuCl3, Nat. Phys. 18, 401 (2022).
- Czajka et al. [2022] P. Czajka, T. Gao, M. Hirschberger, P. Lampen-Kelley, A. Banerjee, N. Quirk, D. G. Mandrus, S. E. Nagler, and N. P. Ong, Planar thermal Hall effect of topological bosons in the Kitaev magnet \ceα-RuCl3, Nat. Mater. 22, 36 (2022).
- Momma and Izumi [2011] K. Momma and F. Izumi, VESTA for three-dimensional visualization of crystal, volumetric and morphology data, J. Appl. Cryst 44, 1272 (2011).
- Zhu et al. [2017] Z. Zhu, P. A. Maksimov, S. R. White, and A. L. Chernyshev, Disorder-Induced Mimicry of a spin liquid in \ceYbMgGaO4, Phys. Rev. Lett. 119, 157201 (2017).
- Pereira and Egger [2020] R. G. Pereira and R. Egger, Electrical access to Ising anyons in Kitaev spin liquids, Phys. Rev. Lett. 125, 227202 (2020).
- Feldmeier et al. [2020] J. Feldmeier, W. Natori, M. Knap, and J. Knolle, Local probes for charge-neutral edge states in two-dimensional quantum magnets, Phys. Rev. B 102, 134423 (2020).
- König et al. [2020] E. J. König, M. T. Randeria, and B. Jäck, Tunneling spectroscopy of quantum spin liquids, Phys. Rev. Lett. 125, 267206 (2020).
- Udagawa et al. [2021] M. Udagawa, S. Takayoshi, and T. Oka, Scanning tunneling microscopy as a single Majorana detector of Kitaev’s chiral spin liquid, Phys. Rev. Lett. 126, 127201 (2021).
- Jang et al. [2021] S.-H. Jang, Y. Kato, and Y. Motome, Vortex creation and control in the Kitaev spin liquid by local bond modulations, Phys. Rev. B 104, 085142 (2021).
- Bauer et al. [2023] T. Bauer, L. R. D. Freitas, R. G. Pereira, and R. Egger, Scanning tunneling spectroscopy of Majorana zero modes in a Kitaev spin liquid, Phys. Rev. B 107, 054432 (2023).
- Ruan et al. [2021] W. Ruan, Y. Chen, S. Tang, J. Hwang, H.-Z. Tsai, R. L. Lee, M. Wu, H. Ryu, S. Kahn, F. Liou, C. Jia, A. Aikawa, C. Hwang, F. Wang, Y. Choi, S. G. Louie, P. A. Lee, Z.-X. Shen, S.-K. Mo, and M. F. Crommie, Evidence for quantum spin liquid behaviour in single-layer -\ceTaSe2 from scanning tunnelling microscopy, Nat. Phys. 17, 1154 (2021).
- Chen et al. [2022] Y. Chen, W.-Y. He, W. Ruan, J. Hwang, S. Tang, R. L. Lee, M. Wu, T. Zhu, C. Zhang, H. Ryu, F. Wang, S. G. Louie, Z.-X. Shen, S.-K. Mo, P. A. Lee, and M. F. Crommie, Evidence for a spinon Kondo effect in cobalt atoms on single-layer 1-\ceTaSe2, Nat. Phys. 18, 1335 (2022).
- Wang et al. [2022] Z. Wang, L. Liu, H. Zheng, M. Zhao, K. Yang, C. Wang, F. Yang, H. Wu, and C. Gao, Direct observation of the Mottness and – orbital hybridization in the epitaxial monolayer \ceα-RuCl3, Nanoscale 14, 11745 (2022).
- Zheng et al. [2023] X. Zheng, K. Jia, J. Ren, C. Yang, X. Wu, Y. Shi, K. Tanigaki, and R.-R. Du, Tunneling spectroscopic signatures of charge doping and associated Mott transition in \ceα-RuCl3 in proximity to graphite, Phys. Rev. B 107, 195107 (2023).
- Zheng et al. [2024] X. Zheng, O. Takuma, H. Zhou, C. Yang, X. Han, G. Wang, J. Ren, Y. Shi, K. Tanigaki, and R.-R. Du, Insulator-to-metal Mott transition facilitated by lattice deformation in monolayer \ceα-RuCl3 on graphite, Phys. Rev. B. 109, 035106 (2024).
- Price and Perkins [2013] C. Price and N. B. Perkins, Finite-temperature phase diagram of the classical Kitaev-Heisenberg model, Phys. Rev. B 88, 024410 (2013).
- Balz et al. [2021] C. Balz, L. Janssen, P. Lampen-Kelley, A. Banerjee, Y. H. Liu, J.-Q. Yan, D. G. Mandrus, M. Vojta, and S. E. Nagler, Field-induced intermediate ordered phase and anisotropic interlayer interactions in \ceα-RuCl3, Phys. Rev. B 103, 174417 (2021).
- Imry and Ma [1975] Y. Imry and S.-k. Ma, Random-Field Instability of the Ordered State of Continuous Symmetry, Phys. Rev. Lett. 35, 1399 (1975).
- Jolie et al. [2018] W. Jolie, J. Lux, M. Pörtner, D. Dombrowski, C. Herbig, T. Knispel, S. Simon, T. Michely, A. Rosch, and C. Busse, Suppression of quasiparticle scattering signals in bilayer graphene due to layer polarization and destructive interference, Phys. Rev. Lett. 120, 106801 (2018).
- Ye et al. [2013] C. Ye, P. Cai, R. Yu, X. Zhou, W. Ruan, Q. Liu, C. Jin, and Y. Wang, Visualizing the atomic-scale electronic structure of the \ceCa2CuO2Cl2 Mott insulator, Nat. Commun. 4, 1365 (2013).
- Dai et al. [2014] J. Dai, E. Calleja, G. Cao, and K. McElroy, Local density of states study of a spin-orbit-coupling induced Mott insulator \ceSr2IrO4, Phys. Rev. B 90, 041102(R) (2014).
- Wang et al. [2020] R.-F. Wang, J. Guan, Y.-L. Xiong, X.-F. Zhang, J.-Q. Fan, J. Zhu, C.-L. Song, X.-C. Ma, and Q.-K. Xue, Electronic inhomogeneity and band structure in superstructural \ceCuO2 planes of infinite-layer \ceSr_0.94La_0.06CuO_2+y films, Phys. Rev. B 102, 100508(R) (2020).
- Chen et al. [2019] W. Chen, Z. Sun, Z. Wang, L. Gu, X. Xu, S. Wu, and C. Gao, Direct observation of van der Waals stacking–dependent interlayer magnetism, Science 366, 983 (2019).
- Quertite et al. [2021] K. Quertite, H. Enriquez, N. Trcera, A. Bendounan, A. J. Mayne, G. Dujardin, A. E. kenz, A. Benyoussef, Y. J. Dappe, A. Kara, and H. Oughaddou, Electron beam analysis induces Cl vacancy defects in a NaCl thin film, Nanotechnology 33, 095706 (2021).
- Bulaevskii et al. [2008] L. N. Bulaevskii, C. D. Batista, M. V. Mostovoy, and D. I. Khomskii, Electronic orbital currents and polarization in Mott insulators, Phys. Rev. B 78, 024402 (2008).
- Takikawa and Fujimoto [2019] D. Takikawa and S. Fujimoto, Impact of off-diagonal exchange interactions on the Kitaev spin-liquid state of \ceα-RuCl3, Phys. Rev. B 99, 224409 (2019).
- Shiozaki et al. [2022] K. Shiozaki, M. Sato, and K. Gomi, Atiyah-Hirzebruch spectral sequence in band topology: General formalism and topological invariants for 230 space groups, Phys. Rev. B 106, 165103 (2022).
- Zhang et al. [2024] K. Zhang, S. Feng, Y. D. Lensky, N. Trivedi, and E.-A. Kim, Machine learning reveals features of spinon Fermi surface, Commun. Phys. 7, 54 (2024).
- Asaba et al. [2023] T. Asaba, L. Peng, T. Ono, S. Akutagawa, I. Tanaka, H. Murayama, S. Suetsugu, A. Razpopov, Y. Kasahara, T. Terashima, Y. Kohsaka, T. Shibauchi, M. Ichikawa, R. Valentí, S. ichi Sasa, and Y. Matsuda, Growth of self-integrated atomic quantum wires and junctions of a Mott semiconductor, Sci. Adv. 9, eabq5561 (2023).
- Mashhadi et al. [2019] S. Mashhadi, Y. Kim, J. Kim, D. Weber, T. Taniguchi, K. Watanabe, N. Park, B. Lotsch, J. H. Smet, M. Burghard, and K. Kern, Spin-split band hybridization in graphene proximitized with \ceα-RuCl3 nanosheets, Nano Lett. 19, 4659 (2019).
- Zhou et al. [2019] B. Zhou, J. Balgley, P. Lampen-Kelley, J.-Q. Yan, D. G. Mandrus, and E. A. Henriksen, Evidence for charge transfer and proximate magnetism in graphene–\ceα-RuCl3 heterostructures, Phys. Rev. B 100, 165426 (2019).
- Yang et al. [2022] B. Yang, Y. M. Goh, S. H. Sung, G. Ye, S. Biswas, D. A. S. Kaib, R. Dhakal, S. Yan, C. Li, S. Jiang, F. Chen, H. Lei, R. He, R. Valentí, S. M. Winter, R. Hovden, and A. W. Tsen, Magnetic anisotropy reversal driven by structural symmetry-breaking in monolayer \ceα-RuCl_3, Nat. Mater. 22, 50 (2022).
Supplementary Material
Majorana-based scenario for the incommensurate spatial oscillation
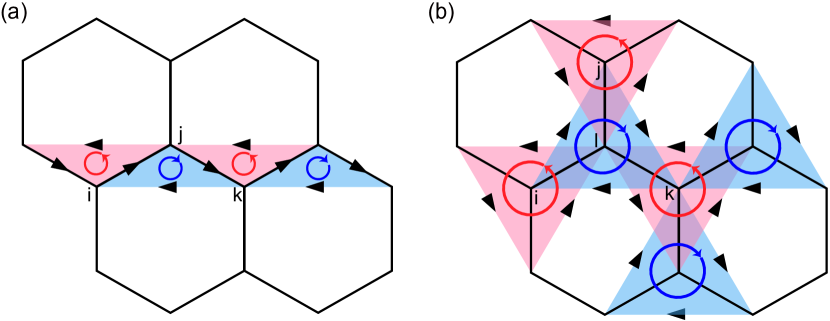
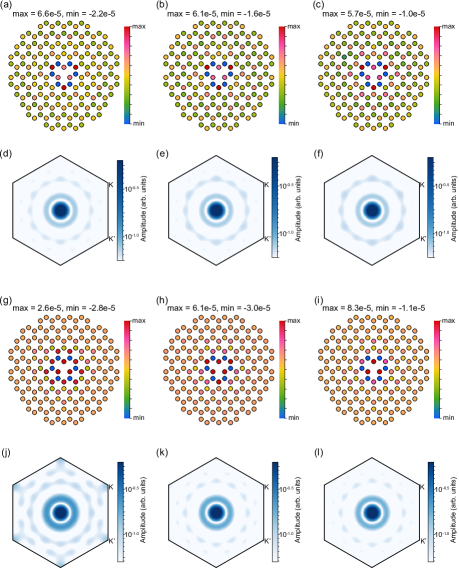
In this section, we present a scenario based on Majorana physics for the origin of the incommensurate oscillation observed via the STM measurements. Although the bias voltage imposed on the STM tip is larger than the Mott gap, electrons carrying the tunnel current injected from the STM tip may generally decay into low-energy excitations in the Kitaev monolayer, and the local density of states probed via the STM measurements is strongly affected by the spatial distributions of these excitations, showing the trace of the spin liquid state. There are two types of excitations in the Kitaev QSL; itinerant Majorana fermions and visons [16]. The incommensurate spatial structure of the density of states implies that excitations associated with this oscillation have a characteristic length scale akin to a Fermi wavelength. Then, it is natural to expect that the itinerant Majorana fermions play an essential role in the incommensurate oscillation, because of their fermionic character. However, for the pure Kitaev model, the Fermi wavelength of the itinerant Majorana fermions is commensurate, because the Dirac points of the Majorana band cross zero-energy at K and K′ points in the Brillouin zone. Nevertheless, it is possible to realize the Majorana Fermi surface with incommensurate Fermi wavenumbers, if there are perturbations which break symmetries protecting the positions of the Dirac points. According to the topological argument based on the twisted theory, in the case of the Kitaev model, these symmetries are time-reversal symmetry and inversion symmetry [57, 56]. With this insight, we postulate that tunnel currents from the STM tip, which break both time-reversal and inversion symmetries, induce circular orbital currents in the \ceRuCl3 monolayer, which flow in staggered directions on the honeycomb lattice since the total orbital angular momentum on the monolayer plane must be kept zero. (See Figs. S7 and S7.) The orbital currents flowing on edges of a triangular in the honeycomb lattice induce scalar spin chirality because of the inverse effect of the circular current generation due to spin chirality in a Mott insulator, [55]. The perturbation term of the Hamiltonian due to this effect is given by . For the staggered orbital currents shown in Fig. S7, the associated spin chirality yields the next nearest-neighbor hopping term of itinerant Majorana fermions, since in the Majorana representation of the Kitaev QSL state. Here, is the operator of an itinerant Majorana fermion, () is a gauge field, and , are next-nearest neighbor sites. On the other hand, for the current configuration shown in Fig. S7, the spin chirality results in four-Majorana interaction terms, e.g. . In the mean-field approximation, these terms also give rise to next-nearest neighbor hopping terms, e.g. . Notably, because of the alternating sign of the next nearest-neighbor hopping terms, these perturbations shift the position of the Dirac points of the Majorana band away from zero energy, resulting in the formation of Majorana Fermi surfaces with incommensurate Fermi wavenumbers. Then, the incommensurate spatial oscillation of the density of states similar to the Friedel oscillation can occur, when itinerant Majorana fermions are scattered at vacancy sites. We emphasize that although the perturbation due to the STM current is local, and the induced spin chirality decays exponentially, the incommensurate Fermi wavenumbers can be generated in the vicinity of the STM tip, if the decay length of the spin chirality is just a few times larger than the lattice constant. To demonstrate this scenario, we performed model calculations with the Majorana Hamiltonian derived from the generalized Kitaev model, , where is the Hamiltonian of the pure Kitaev model [16], and is a non-Kitaev interaction term. The expressions of and are given by,
| (S1) | |||
| (S2) |
where is the Kitaev interaction strength which defines the energy unit in our numerical calculations, and is a coupling constant. In the expression of , the sign factor arises from the staggered configuration of scalar spin chirality. This feature is crucially important for the realization of Majorana Fermi surfaces. is a damping factor which describes the decay of the spin chirality as a function of the distance between the position, , and that of the STM tip, . Since the spin chirality is induced by the tunnel currents from the STM tip in this scenario, it should decay as the distance from the STM tip increases. This effect is incorporated in the damping factor. We use the gaussian form for numerical calculations. We also assume that is sufficiently small, and does not affect the stability of the spin liquid state. However, we should note that in the case of a vacancy, gives an important effect on a bound Majorana state in the vicinity of a vacancy, which will be discussed later. As mentioned above, shifts the position of Dirac points of the itinerant Majorana band away from zero energy, which realizes the Majorana Fermi surfaces with incommensurate Fermi wavenumbers, as shown in Figs. S8, S8, and S8. We, now, examine the effects of a lattice vacancy which plays the role of a scattering potential acting on the itinerant Majorana fermions. An important observation is that at the nearest neighbor sites of a vacancy in the Kitaev model, isolated gauge Majorana fields , which do not couple to any other Majorana particles in the Kitaev QSL, appear, and furthermore, these gauge Majorana fields are coupled to nearest-neighbor itinerant Majorana fields via . (See Fig. S9.) Thus, even when is small enough, the gauge Majorana fields near the vacancy affect crucially scattering processes of itinerant Majorana fermions due to the vacancy. To take this effect into account, we assume the form of as,
| (S3) |
which describes a minimal coupling between the gauge Majoranas and itinerant Majoranas. Here, the superscript of the gauge Majorana field means that the vacancy site is connected to the site via the -bond (). Note that Eq. (S3) is microscopically derived from the 1st order perturbative expansion with respect to the symmetric off-diagonal exchange interaction, the term. It is noted that the 1st order corrections due to the term do not affect the bulk spin liquid state away from the vacancy site.
With the use of the model Hamiltonian , we calculate the spatial distribution of the charge density. Although the system is a Mott insulator with no explicit charge degrees of freedom, the charge density is expressed in terms of spin correlation functions between sites forming a triangle [55, 35],
| (S4) |
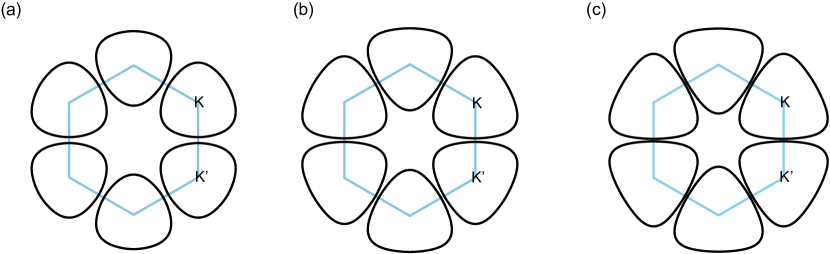
To calculate Eq. (S4), we need to specify the configuration of visons. Since the STM measurements were performed at temperatures sufficiently lower than the vison gap, it may be appropriate to assume the bound-flux sector which is the ground state of the Kitaev QSL with a vacancy; i.e. a vison exists only at the vacancy site. However, on the other hand, bias voltages used for the experiment are larger than the Mott gap, which indicates that visons may be excited in the measurements. Thus, we examine two distinct vison configurations; one is the bound-flux sector, and the other one is the full-flux sector where all of the hexagons in the honeycomb lattice are occupied by visons. As will be shown below, we can reproduce the incommensurate oscillating patterns observed in the STM measurements for both of these vison configurations, if we choose model parameters properly. Also, we chose for the characteristic length of the damping factor in Eq. (S2). We note that the period of the oscillation does not strongly depend on the value of , though the amplitude of the oscillation is affected by it. In Figs. S10, S10, and S10, we show the calculated results of the spatial distribution of the charge density for the bound-flux sector, which exhibit spatially oscillating behaviors around the vacancy. The incommensurate character of the oscillation is more clearly seen in the Fourier transform of the charge distribution shown in Figs. S10, S10, and S10. The calculated results for the full-flux sector are also shown in Figs. S10–S10. For both of the bound-flux sector and the full-flux sector, we can find parameters for which the incommensurate peaks in the first Brillouin zone are in agreement with the experimental observations. In the case of the bound-flux sector, we used the value of the -hopping parameter which is considerably large. Since this term arises from the term, and , one may expect that can not exceed to stabilize the Kitaev QSL state. However, a lattice distortion generally occurs in the vicinity of the vacancy, which lowers lattice symmetry, and leads to the enhancement of non-Kitaev interactions. Thus, it may be possible that exceeds locally preserving the bulk Kitaev QSL state. The incommensurate oscillating patterns shown in Fig. S10 may remind us of the Friedel oscillation of electrons in metals. However, there is an important difference between the oscillation in the Kitaev QSL and the Friedel oscillation. The conventional Friedel oscillation of electrons arises from the screening of a long-range Coulomb potential. On the other hand, in the Kitaev QSL state, the Majorana oscillation is caused by scatterings with the gauge -Majoranas neighboring the vacancy site, described by Eq. (S3). The Majorana Fermi surface shown in Figs. S8, S8, and S8 is slightly deformed by the existence of the vacancy via the hybridization with the gauge -Majoranas, described by Eq. (S3). The incommensurate wavenumbers found in Figs. S10–S10 and S10–S10 are mainly determined by the differences of two Fermi wavenumbers on the deformed Majorana Fermi surface. We show the comparison between the experimental observations and the numerical simulation in Fig. S6. This scenario of the Majorana oscillation provides a promising explanation for the observation of the STM measurements.
 \phantomcaption\phantomcaption\phantomcaption\phantomcaption\phantomcaption\phantomcaption\phantomcaption\phantomcaption\phantomcaption\phantomcaption\phantomcaption\phantomcaption
Now we discuss more precisely the comparison between the theoretical results and the experimental observations. The incommensurate peaks observed in the STM measurements do not depend on bias voltages, at least in the plus bias region or the minus bias region , as shown in Fig. 4. This behavior is quite different from quasiparticle interference patterns usually observed in metals. It is natural to expect that the bias independence may be attributed to the existence of the definite incommensurate Fermi wavenumbers of Majorana particles. In the above scenario, the Fermi wavenumbers of itinerant Majorana particles depend on in Eq. (S2). The coefficient can be regarded as a mean value of the scalar spin chirality, which is determined by the interplay between exchange interactions and the tunnel current which induces circular orbital currents associated with the spin chirality. The bias-independence of the oscillating period observed in the STM measurements implies that the mean value is mainly determined by the exchange interactions among relevant spins, and the tunnel current merely acts as a trigger to induce a metastable state with spin chirality configuration. On the other hand, the periods of the spatial oscillation are slightly different between the positive bias and the minus bias , as shown in Fig. 2 and Fig. 4. A possible origin of this asymmetry is the local change of the Kitaev interaction caused by the bias potential. Since the energy difference between the and states is for \ceα-RuCl3 [20], the bias may affect virtual processes associated with the Kitaev interaction, which arises from the transition between the state and the state. That is, the bias can result in virtual states with two or more holes in the state, while the bias does not generate such virtual states. This asymmetry causes the difference in the intermediate virtual processes of the Kitaev interaction between and , leading to the distinct periods of the spatial oscillations.