The Effect of Cosmic Rays on the Observational Properties of the CGM
Abstract
The circumgalactic medium (CGM) contains information on the cumulative effect of galactic outflows over time, generally thought to be caused by feedback from star formation and active galactic nuclei. Observations of such outflows via absorption in CGM gas of quasar sightlines show a significant amount of cold () gas which cosmological simulations struggle to reproduce. Here, we use the adaptive mesh refinement hydrodynamical code Ramses to investigate the effect of cosmic rays (CR) on the cold gas content of the CGM using three zoom realizations of a star-forming galaxy with supernova mechanical feedback: one with no CR feedback (referred to as no-CR), one with a medium CR diffusion coefficient (CR), and one with a high rate of diffusion of (CR). We find that, for CR, the effects of CRs are largely confined to the galaxy itself as CRs do not extend far into the CGM. However, for CR, the CGM temperature is lowered and the amount of outflowing gas is boosted. Our CR simulations fall short of the observed Mgii covering fraction, a tracer of gas at temperatures , but the CR simulation is more in agreement with covering fractions of Civ and Ovi, which trace higher temperature gas.
keywords:
galaxies: haloes – galaxies: evolution – cosmic rays – methods: numerical1 Introduction
The diffuse gas surrounding galaxies (often referred to as the circumgalactic medium, [CGM]) is made of several dynamical states (inflowing and outflow) and multiple phases (e.g. Tumlinson et al., 2017; Faucher-Giguère & Oh, 2023). At any given time, gas inflowing (such as gas accretion from the cosmic web) and outflowing (such as galactic winds from supernovae and active galactic nuclei) occur in the CGM environment. Therefore, by studying the properties of a galaxy’s CGM, it is possible to gain insights into these important processes of galaxy formation and evolution.
Observationally, the CGM is best studied using absorption line spectroscopy of quasar sightlines passing near foreground galaxies. From these quasar spectra, it is possible to infer column densities and the kinematics of gas along the line of sight. This technique has been developed and utilized over many decades to produce a rich collection of CGM observations from dedicated surveys like COS-Halos (e.g. Burchett et al., 2019), KBSS (e.g. Turner et al., 2014), and MEGAFLOW (e.g Schroetter et al., 2016). Results from these observational efforts have concluded that the CGM is composed of many different gas phases that fall into one of two broad categories. First, a cold dense phase traced by ions such as Mgii and Siiii that has multiple kinematic components along most sightlines, suggesting a clumpy distribution within the CGM111This general characterization of the cold phase is somewhat redshift dependent: at low redshifts () not considered in this paper, the inferred densities of the cold phase are significantly lower (see, e.g. Werk et al., 2014; McCourt et al., 2018)., and second, a hot diffuse phase traced by ions such as Ovi and with broader absorption lines indicating a higher velocity dispersion and fewer spatially distinct clouds (e.g. Rudie et al., 2019). In order to understand the origins of and interplay between these different gas phases, it is necessary to model the CGM environment of galaxies with numerical simulations.
In recent years, much progress has been made in simulating the CGM at many different scales, ranging from idealised simulations (e.g. Kopenhafer et al., 2023) to large cosmological simulations (e.g. Nelson et al., 2020). In all cases, it is necessary to model the effects of feedback from galaxies to produce a realistic CGM environment. Generally, modern simulations (e.g. Pillepich et al., 2018a) accomplish this with feedback from two main sources: stars and active galactic nuclei (AGN). Stellar feedback usually consists of energy from supernovae explosions, as well as radiation pressure from massive stars, and is capable of launching gas out of the galaxy where it can either exit the halo completely or reaccrete onto the galaxy at a later time, producing “fountain flows” (e.g. Übler et al., 2014; DeFelippis et al., 2017). AGN feedback is usually more dominant in massive galaxies, where supermassive black holes launch fast intermittent jets from the centres of galaxies capable of drastically affecting the composition and kinematics of CGM gas over time (e.g. Obreja et al., 2023). With these two sources of feedback, modern cosmological simulations such as the IllutrisTNG suite (Marinacci et al., 2018; Naiman et al., 2018; Nelson et al., 2018; Pillepich et al., 2018b; Springel et al., 2018; Nelson et al., 2019; Pillepich et al., 2019), EAGLE (Schaye et al., 2015), and Horizon-AGN (Dubois et al., 2016) are capable of producing realistic populations of galaxies in terms of quantities like stellar mass, angular momentum, and overall shape. They are also capable of generating predictions for the mass content of the CGM and outflows (e.g. Davies et al., 2020; Mitchell et al., 2020), but these vary significantly depending on the galaxy formation model used, and are not necessarily in agreement with CGM observations.
One of the major difficulties cosmological simulations have with respect to CGM observations is related to the content of galactic outflows. Indeed, observations show that galactic outflows are multiphase, consisting of gas at high temperatures of (e.g. Chisholm et al., 2018; Veilleux et al., 2022) as well as low temperatures of (e.g. Schroetter et al., 2019; Zabl et al., 2020; Avery et al., 2022). However, simulations have historically struggled to produce lower temperature “cold” outflows and often require outflows to be very fast and very hot in order to produce realistic galaxy populations, thus sacrificing the realism of the CGM and potentially altering the way in which the CGM and galaxy interact over longer Gyr timescales. Improvements in resolution and feedback models have reduced the gap between observed and simulated outflows (e.g. Nelson et al., 2019; Peeples et al., 2019), but it still remains very difficult for stellar and AGN feedback alone to generate substantial and consistent cold outflowing gas.
A possible solution to this problem is to include in simulations other physically-motivated mechanisms by which gas can be expelled from the galaxy that might have been overlooked. A well-studied mechanism that has received much attention in recent years are cosmic rays (CRs) from supernovae explosions. From observations of the Milky Way, energy from CRs is expected to be in equipartition with energy from other sources like gravity and turbulence (Boulares & Cox, 1990) and to represent of all the energy released by supernovae (e.g. Morlino & Caprioli, 2012), thus meaning it could significantly impact the dynamics of galaxies and the CGM. This is found to be the case: many recent studies have shown that the CGM in simulations of galaxies better reproduce absorption sightline observations from surveys like COS-Halos (e.g. Werk et al., 2016) when CR feedback is implemented (Salem et al., 2016; Butsky & Quinn, 2018; Ji et al., 2020; Butsky et al., 2022). In these works, the CGM tends to have lower average temperatures when CR feedback is included.
In these recent studies, CRs have been implemented in a variety of different ways. Nearly all of them centre on how to treat the CR diffusion coefficient , which helps set the timescale needed for the energy from CRs to escape the location they are injected in (i.e., a supernova). This diffusion can occur isotropically or anisotropically from its source, at a constant or variable rate (e.g. Butsky et al., 2023), and at a single energy bin or along a spectrum of possible energies (e.g. Hopkins et al., 2021; Girichidis et al., 2022). CRs can also be transported by streaming along magnetic field lines rather than diffusion through the ambient medium (e.g. Wiener et al., 2017), or even a combination of both methods (e.g. Jiang & Oh, 2018; Thomas & Pfrommer, 2019; Hopkins et al., 2022). These choices result in differing galaxy properties, particularly on the cold gas content and velocity of emerging outflows, the amount of regulation of star formation, and the gas temperature and density structure of the interstellar medium (ISM) and CGM, so constraining the possible implementations of CRs in simulations is crucial.
The numerical value of the diffusion coefficient has been shown to make a huge difference on the temperature distribution and outflow rates of gas, sometimes by orders of magnitude, by setting the rate of CR transport which itself determines the shape of the CR pressure gradient. While it is possible to loosely constrain the possible values of using gamma-ray luminosities from the Milky Way and local starburst galaxies (e.g. Chan et al., 2019; Nuñez-Castiñeyra et al., 2022), the resulting properties of the CGM are different enough that they can be used to set boundaries on . Following several recent analyses (e.g. Girichidis et al., 2018; Jacob et al., 2018; Dashyan & Dubois, 2020; Farcy et al., 2022; Girichidis et al., 2024), we seek to study the effect of varying the diffusion coefficient on the CGM by quantifying how the observable properties of the CGM, such as the covering fractions, change with . This will shed light on whether CR diffusion may be a key missing ingredient in galaxy formation models.
In this paper, we study the effect CRs have on the CGM using cosmological “zoom-in” simulations. In particular, we study how CRs affect the CGM by comparing the covering fraction of metal lines to CGM absorption surveys such as the MEGAFLOW survey (Zabl et al., 2019; Schroetter et al., 2021). The structure of this paper is as follows. In Section 2, we detail the galaxy formation model and simulation setup of our analysis. In Section 3, we then present results of our simulations showing the effect of CRs on the overall gas distribution in the halo (Section 3.1), properties of the galaxy (Section 3.2), properties of the CGM (Sections 3.3 and 3.4), and CGM observables (Section 3.5). In Section 4 we discuss the constraining power of CGM observations on our results and put our results in context of other recent work on CR feedback. Finally, we summarize our results and conclude in Section 5.
Throughout this work we assume a CDM universe with dark energy fraction , matter fraction , baryonic fraction , Hubble constant , and amplitude of density fluctuations . These parameters are consistent with results from Planck Collaboration et al. (2014).
2 Methods
To study the effects of CRs on the CGM, we use cosmological zoom simulations, targeting a halo of interest and its environment with high resolution. For the simulations, we use the adaptive mesh refinement (AMR) code Ramses (Teyssier, 2002). The positions of collisionless dark matter (DM) and stellar particles are evolved with a particle-mesh solver, and cloud-in-cell interpolation is used to calculate their gravitational potential. Gas evolution is computed with either an HLLC Riemann solver (Toro et al., 1994) for runs without CRs, or an HLLD Riemann solver (Miyoshi & Kusano, 2005) for runs with CRs. The anisotropic diffusion of the CR fluid along the magnetic field is performed with the methods described by Dubois & Commerçon (2016). To close the relation between gas internal energy and pressure, we assume an adiabatic index of . We initialize magnetic fields by defining a uniform grid with cells and assigning random magnetic potentials to each cell interface, such that the magnetic field that arises from the curl of the potential is divergence-free. The six magnetic field components of each cell are normalized such that the initial magnetic field magnitude at a scale of 1 cMpc is . We choose a relatively weak initial magnetic field to better focus on the role of CR feedback alone on the CGM. The magnetic fields are then evolved using the MUSCL scheme (Teyssier et al., 2006). To identify DM haloes we use the Adaptahop halo finder in the most massive submaxima mode (Aubert et al., 2004; Tweed et al., 2009). A halo is defined as region satisfying the virial theorem that contains at least 20 DM particles and has a density 200 times the critical value.
Initial conditions and refinement scheme
We use the Music package (Hahn & Abel, 2011) to generate cosmological initial conditions. Music allows refining of the DM mass resolution in a zoomed-in region of the simulation volume. We initially run a DM-only simulation with homogeneous resolution in a wide box to . Then we select a target halo to be re-simulated up to with baryons and at a higher resolution. The criteria for our halo selection are as follows. (i) The target halo must have a halo mass close to . The target mass is chosen to simulate a halo which would likely host a galaxy with a stellar mass of at , so as to be similar to galaxies from the MEGAFLOW survey (e.g. Zabl et al., 2019; Schroetter et al., 2021) 222In MEGAFLOW, the host galaxies associated with metal absorption lines have SFRs of 3-30 M⊙ yr-1 and of 10 M⊙. We refer the reader to Bouché et al., in prep. for a more detailed presentation of the survey and observational strategy.. (ii) The target halo must not contain any massive substructures, and (iii) it must also not contain a neighboring halo more massive than within three virial radii of the target halo’s centre. These last two criteria are to avoid re-simulating a very complex large-scale environment at a high resolution (and high computational cost).
Music is then used to progressively define a zoom region in the initial conditions with a DM particle mass of , corresponding to an effective fine resolution of DM particles. This is nested inside larger regions with progressively larger DM particle masses by a factor of 8 each time, up to a coarsest particle mass of , corresponding to an effective coarse resolution of particles. The process of mapping out the zoomed region in the initial conditions is iterated until we confirm that the high-resolution zoom-in region has no contamination from low-resolution DM particles out to from the centre of the targeted halo. All our production simulations use these same initial conditions and therefore model the evolution of the same galactic halo, albeit with different physics.
The resolution of the gas and gravitational potential tracks that of the DM in the zoom-in scheme, with an effective resolution that goes from cells at the coarsest level, corresponding to a physical width of 350 ckpc, and progressively increasing to an effective base resolution of cells in the innermost zoomed-in region, corresponding to a physical width of 22 ckpc. Within this innermost region, we also allow for adaptive refinement to a minimum cell width of 40 pc (physical, not co-moving). A cell is split into 8 equal-size children cells if , where and are the total DM and baryonic (gas plus stars) masses in the cell and is the baryon mass fraction, or if the cell width is larger than a quarter of the local Jeans length. In order to keep a roughly constant physical minimum cell width, within a factor of two, increasing maximum refinement levels are triggered with decreasing redshift. In our simulations, cell widths in the CGM generally range from kpc in the inner region of the halo to kpc in the outer region at the halo’s virial radius. This is comparable to CGM resolutions achieved in simulations like TNG50 (see Figure 1 of Nelson et al., 2020), although existing simulations that focus computational efforts on the CGM itself improve resolution in the inner and outer halo by factors of from our values (e.g. Hummels et al., 2019; Peeples et al., 2019; Suresh et al., 2019; van de Voort et al., 2019; Ramesh & Nelson, 2024).
Thermochemistry
We use the standard equilibrium thermochemistry of Ramses. Equilibrium hydrogen and helium cooling rates, via collisional ionization, collisional excitation, recombination, dielectric recombination, bremsstrahlung, and Compton cooling off the Cosmic Microwave Background, are applied using the rates listed in Rosdahl et al. (2013). For photoionization heating, we assume a Haardt & Madau (1996) UV background with an exponential cutoff for gas densities above due to self-shielding. For K, the cooling contribution from metals is computed using tables generated with cloudy (Ferland et al., 1998, version 6.02), assuming photo-ionization equilibrium with a Haardt & Madau (1996) UV background. For K, we use the fine structure cooling rates from Rosen & Bregman (1995), allowing the gas to cool radiatively to a density-independent temperature floor of K. We start all our simulations with an artificially non-zero gas metallicity of (we assume a Solar metal mass fraction of ). This artificially non-pristine initial metallicity compensates for our lack of molecular hydrogen cooling channels in metal-free gas, allowing the gas to cool below K, and is calibrated so that the first stars form at redshift .
Star formation
Star formation is considered in cells where all the following criteria are met: the hydrogen gas density is , the local overdensity is times the cosmic mean, the local Jeans length is smaller than one cell width, and the gas is locally convergent, and at a local maximum density. Gas is converted into stars at a rate
| (1) |
where is the free-fall time and is the efficiency of star formation, which depends on local estimates of the gas turbulence and virial parameter (for details see e.g. Trebitsch et al., 2017). To follow on average the rate of star formation given by (1), the stellar particles, each representing a stellar population, are created stochastically following a Poissonian distribution which provides the mass of the new stellar particle as an integer multiple of (see Rasera & Teyssier, 2006), and hence the minimum mass of a stellar particle is . Our simulations also include runaway stars with a kick velocity of 50 , but we expect these to have little to no impact on the properties of the CGM we study in later sections (see Rey, 2022).
Supernova feedback
Supernova (SN) feedback is implemented with the mechanical feedback model described in Kimm & Cen (2014) and Kimm et al. (2015), where the SN energy is directly injected as momentum in the gas according to how well the Sedov phase is resolved. We assume four type II SN explosions per of stellar mass formed. This is about four times larger than predicted by the Kroupa (2001) initial mass function and therefore likely unrealistic, but we do this, as in the SPHINX simulations (Rosdahl et al., 2022) to prevent overcooling and unnaturally rapid star formation. SN explosions, each releasing ergs, are sampled in each stellar particle between 3 and 50 Myrs of its lifetime (Kimm et al., 2015). Each particle returns on average 20% of its initial mass back to the gas, with a metal yield of 7.5%, roughly consistent with a Kroupa (2001) initial mass function.
Cosmic ray feedback
CRs are modelled as a relativistic fluid that propagates anisotropically along magnetic field lines following the advection-diffusion approximation developed by Dubois & Commerçon (2016); Dubois et al. (2019), and loses energy via cooling by hadronic and coulombic interactions (Guo & Oh, 2008; Dashyan & Dubois, 2020). This model has already been used in several works with Ramses (e.g. Dashyan & Dubois, 2020; Farcy et al., 2022; Nuñez-Castiñeyra et al., 2022; Martin-Alvarez et al., 2023). The CRs are tracked as a non-thermal pressure term , where is the CR energy density and is the associated adiabatic index. The CRs are injected via each SN explosion into the gas cell hosting the exploding stellar particle, reserving 10 percent of the SN energy in each explosion to CRs.333We do not lower the CR energy injection fraction to compensate for the “boosted” SN feedback as this would likely render any resulting CR feedback completely inefficient. A non-boosted SN rate would result in a higher star-formation rate and potentially more cumulative CR energy injection, but measuring the size of this effect is outside the scope of this study. We run simulations with two distinct values of the CR diffusion coefficient and in the simulations labelled CR- and CR-, respectively. These two values are both within reasonable constraints from observations, particularly those from the Milky Way (Strong et al., 2007; Trotta et al., 2011) which generally favor a diffusion coefficient , and are considered to bracket regimes of slowly- and rapidly-diffusing CRs and how each of them affects the CGM (see e.g. Chan et al., 2019; Nuñez-Castiñeyra et al., 2022). We also run a simulation without CR feedback (called no-CR), for a comparative study of their effects. The three simulations, identical except for the inclusion of MHD and CR feedback, are listed in Table 1.
| Name | MHD | |
| no-CR | No | – |
| CR | Yes | |
| CR | Yes |
3 Results
We begin with a general description of the properties of the galaxy and CGM for the three runs (Section 3.1). We then show more detailed results demonstrating the differences in baryonic content between the three runs, first for the stars and gas within the galaxy (Section 3.2), then for gas outflowing from the galaxy (Section 3.3), and finally for gas in the CGM (Section 3.4). In Section 3.5, we compare these simulations to CGM observations.
3.1 General properties
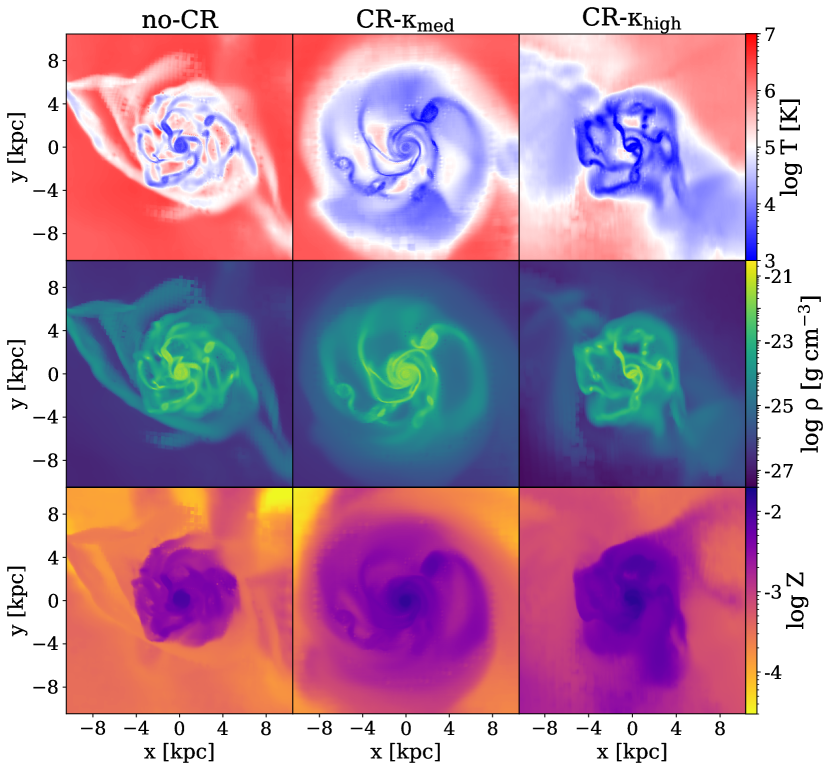
We start by showing face-on projections of the gas in the central galaxy in each run in Figure 1. Qualitatively, the addition of CRs changes the appearance and extent of the central galaxy and inner CGM. With CRs, the cold () gas is both more extended radially and distributed more smoothly within the disc, especially for CR, which also has a higher overall gas density, while the CR gas density within the central galaxy is largely unchanged. In CR, the central galaxy is also embedded in a somewhat higher metallicity environment compared to both other runs. Based on the morphology in Figure 1, for this paper we define the “galaxy” as a cylindrical region surrounding the stellar disc with a radius and a height above and below the midplane of the disc. At , the galaxy is a rotating gas disc kpc across whose ISM is metal-rich and shows a substantial amount of structure.
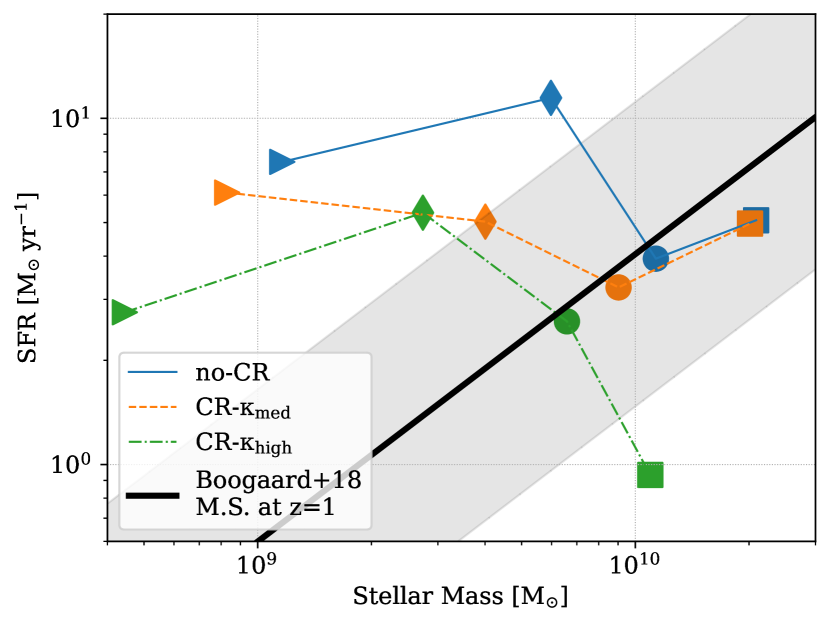
In Figure 2, we show the star formation rate (SFR) vs. stellar mass of the central galaxy in each run at a few selected redshifts and compare it to the observed star-formation Main Sequence of galaxies. We find that the galaxy is either slightly below (no-CR and CR) or significantly below (CR) the observed star-formation Main Sequence at the end of the simulations. At these later times, the no-CR and CR runs have very similar stellar masses in their central galaxies, though the central galaxy in the CR run is slightly less massive. We examine these differences in more detail in Section 3.2.
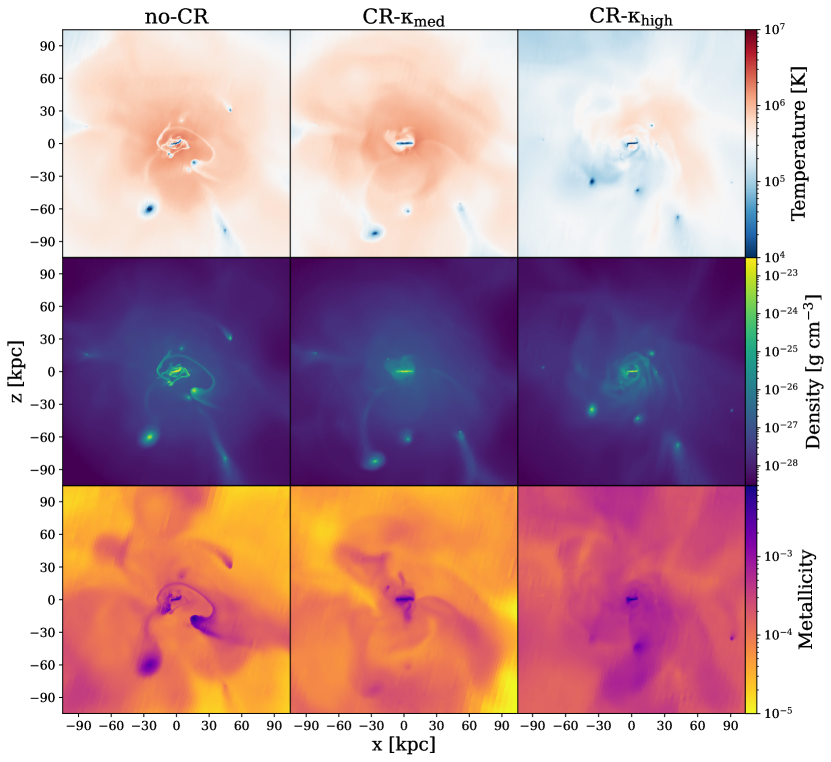
In Figure 3, we show density-weighted edge-on projections of the main halo in each of the three runs out to its virial radius, which is kpc. In all three runs, we see the cold (), dense, and metal-rich galaxy in the centre which is clearly distinct from the warmer, more diffuse, and lower metallicity CGM. However, closer inspection reveals differences between the three runs. In both the no-CR and CR runs the CGM is dominated by relatively diffuse gas with a mean temperature of around apart from cold gas-dominated satellites. The typical temperature in the halo of the CR run though is nearly 1 dex lower. This indicates that the mere addition of CRs in CR is not enough to alter the phase of the CGM: a minimum level of diffusivity must be necessary for the CRs to be able to escape from the galaxy and influence the temperature of the surrounding medium. The gas density largely follows the temperature projections: the densest gas within the galaxy and bound to satellites is also the coldest. Unlike the temperature, the gas density shows little variation between the three runs at any location in the halo, although the density distribution in the outer halo of the CR run appears slightly less smooth than it does in the other two runs. Finally, we examine the metallicity of CGM gas in the bottom panels. Here, as in the temperature projections, we find that metallicity distributions of the no-CR and CR runs are very similar, but the CR run shows a dramatically higher metallicity throughout the entire CGM.
3.2 Star formation
We start our more detailed investigation of the effects of CRs on the galaxy by examining their effect on the SFR over the entire length of each run, which we show in the top panel of Figure 4. The no-CR run is characterized by a SFR that varies between for most of its history, except for a time period around where the SFR jumps above . The galaxy in this run is therefore unambiguously star-forming with a very bursty star-formation history. In the CR run, the addition of CRs lowers the SFR at early times in the simulation, especially during the “starburst” period around , but otherwise maintains the typical value and burstiness at later times. The CR run behaves almost the same as the CR run, though the typical SFR after the starburst period is lower and drops down below at the end of the simulation. This behavior is generally consistent with the effect of CRs found in previous works such as Hopkins et al. (2020), who find that higher values of CR diffusion more effectively suppress the SFR of MW-mass galaxies.
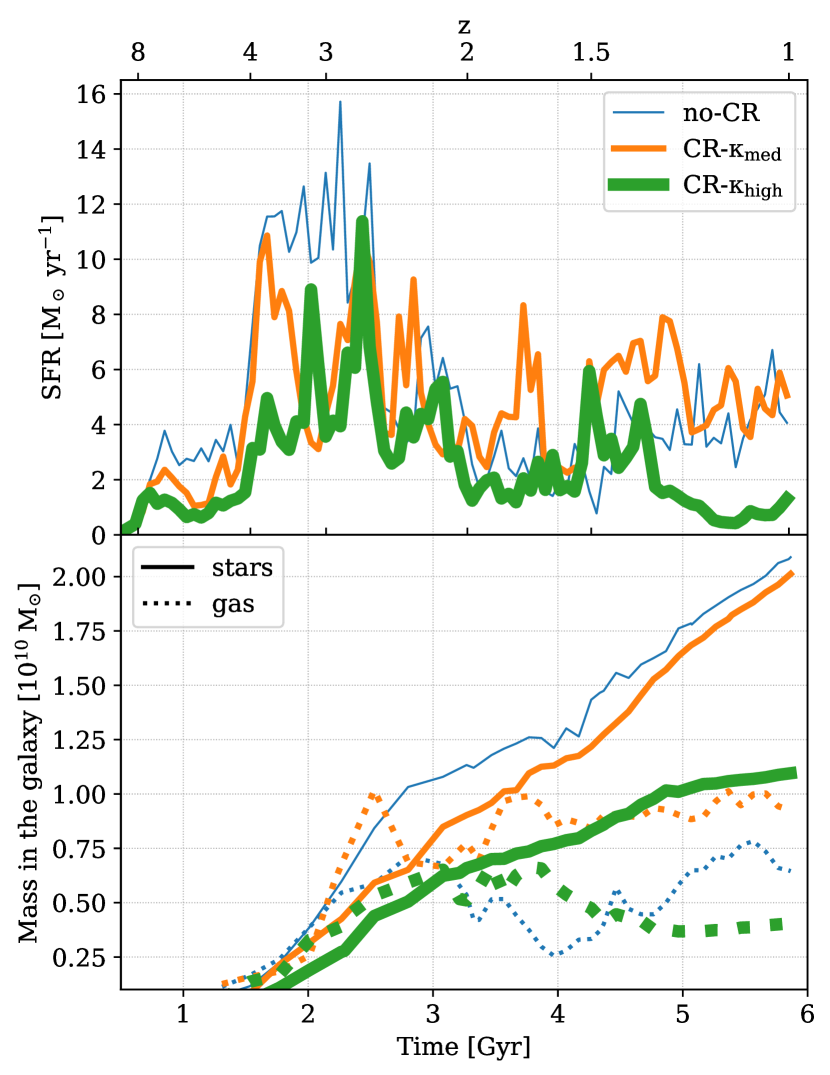
In the lower panel of Figure 4, we plot the stellar and gas masses of the central galaxy in each run over time, which shows the cumulative effect of the star formation and accretion histories. As reflected in the SFRs, the no-CR run has the strongest period of growth from before settling down slightly, while the two CR runs’ stellar masses grow more steadily throughout the simulation and are consistently below the level of the no-CR run. By the end of the simulations, no-CR has a factor of higher stellar mass than CR, whereas CR is only slightly less massive than no-CR. This factor of 2 difference appears to develop during the period of high star formation, and then it remains relatively constant afterwards. The gas mass in all three runs reaches a peak after Gyr and then either fluctuates around that value as in the no-CR and CR runs or slowly decreases with time as the CR run does.
3.3 Outflows
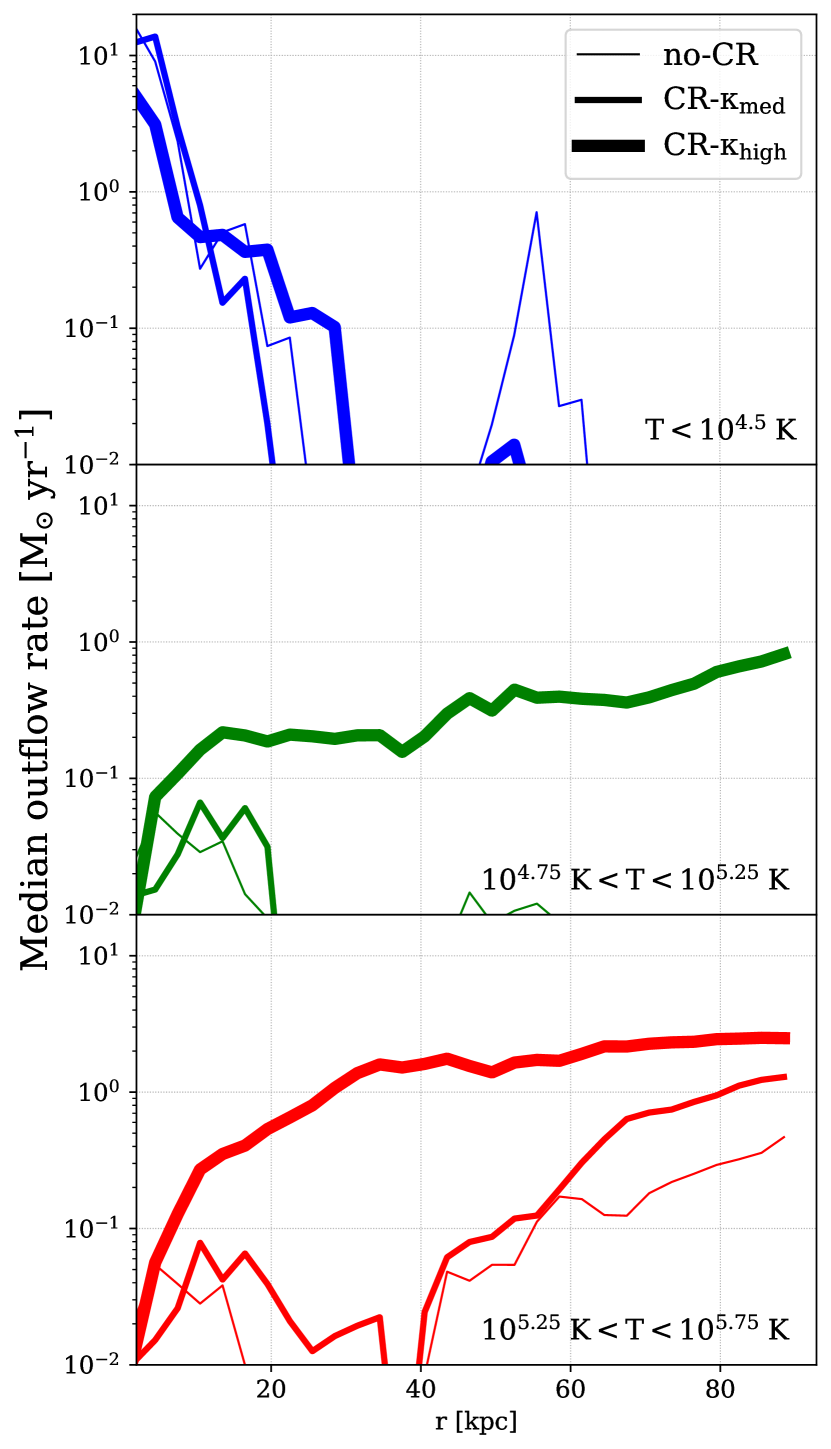
In this section, we examine the properties of outflowing gas and attempt to connect galactic outflows to star formation in the galaxy. We calculate the median outflow rate over the final five snapshots of the runs, representing a narrow redshift range of . This is a large enough number of snapshots such that transitory features of the gas distribution (e.g. a short-lived tidal tail) will be removed, and a small enough number to also ensure that we do not include cosmological evolution in the median. In Figure 5, we show these median outflow rates (i.e. gas with a positive radial velocity) in radial bins around the central galaxy for the three runs, separated by temperature ranges that roughly correspond to commonly observed ions (Mgii, Civ, and Ovi). For the coldest gas, the three runs behave very similarly overall, with high outflow rates of very close to the centre of the galaxy which quickly drop to below by 20 kpc. However, the slope of this outflow rate is noticeably shallower for the CR run, resulting in values smaller than the other two runs within kpc and larger than the other two runs at the very inner edge of the CGM. Above this radius, there is no appreciable outward-moving cold gas in any of the runs, except for that in a satellite galaxy with an overall positive radial velocity in the no-CR run. In the lower two panels, however, we see much more significant differences in the CR run compared to the other two runs. For “warm” gas, which has no substantial outflowing mass anywhere in the CGM for the no-CR and CR runs, the CR run shows an outflow rate of increasing with radius in the CGM. This is also seen in hotter gas, where the outflow rate in CR reaches and maintains order unity by kpc whereas both of the other runs remain below CR and only approach it near the virial radius.
We find (but do not show) that the gas velocities contributing to these outflow rates are typically small with median values up to 20 . In the CR run, the amount of mass moving at all positive radial velocities is larger, including some material moving above 100 , at all radii in the halo, meaning that the larger outflow rates come from both more outflowing mass and faster outflowing mass. These strong CR-driven outflows in the CR run also highlight the fact that its central galaxy’s steadily declining gas mass in Figure 4 is due to gas expulsion via CR feedback rather than consumption by star formation. We note however that all radial velocity distributions have a negative median value, indicating that slow, steady accretion remains the dominant process occurring in the halo, even when CR feedback is operating.
3.4 CGM properties
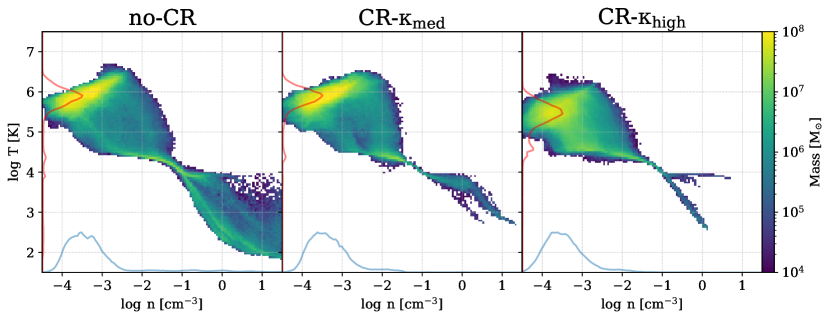
We now turn to the CGM itself and highlight similarities and differences between the three runs. In Figure 6, we show stacked mass-weighted temperature-number density phase diagrams for the CGM of the central galaxy in the three runs for the same narrow redshift range as Figure 5. In these phase diagrams, we have removed gas that is in the central galaxy as defined in Section 3.1 so as to only consider CGM gas. First, we see that the no-CR run contains a substantial amount of gas with in the CGM whereas the two CR runs contain much less gas below this temperature. We see from the maps in Figure 3 that this is due to a combination of the dense tidal tails surrounding and directly connected to the galaxy and the more massive and numerous satellites found in the no-CR run. The same structures are significantly reduced in number and density for both of the CR runs. Thus, the CRs are likely able to help dissipate the very dense and cold gas found primarily in satellites and some tidal tails. Most of the CGM gas in all of the runs, however, is . For the no-CR and CR runs, the phase structure of this hotter diffuse gas is nearly identical. The peak of these temperature distributions is , and the diffuse CGM component spans roughly 1.5 orders of magnitude in density. In the CR run however, the diffuse CGM has a noticeably cooler average temperature: it is peaked at a lower temperature of and the temperature distribution is noticeably wider, resulting in a more substantial amount of gas at temperatures between and than the other two runs have. This behavior is qualitatively similar to other recent studies of CRs, which generally find that the CGM is cooler when CR feedback is included (e.g. Ji et al., 2020; Farcy et al., 2022).
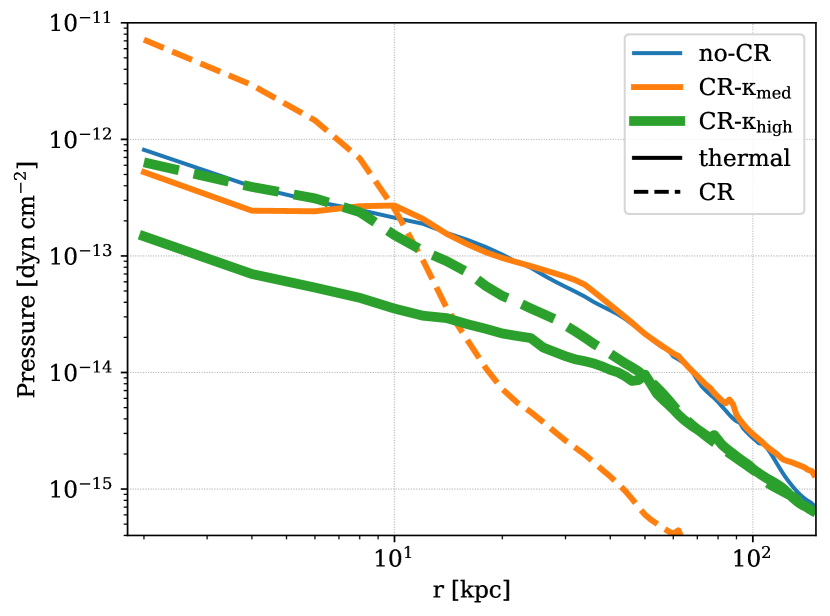
We can understand the varying effects of the CR diffusion by examining the mean pressure profiles of CGM gas. As the initial magnetic fields in these simulations are very weak, the total pressure profiles should all be roughly equal due to hydrostatic pressure equilibrium. We indeed find this to be true outside of the galaxy for kpc, but at smaller radius the CR run has a higher total pressure by nearly an order of magnitude. To see why this is, we plot mean pressure profiles (the median profiles are almost identical) separated into thermal and non-thermal components in Figure 7. Compared to the no-CR run, the CR run has a thermal pressure profile that is almost identical, likely because the similar cumulative star formation between the two runs released a similar amount of energy from supernovae. However, the CR run’s non-thermal pressure exceeds the thermal pressure within the galaxy by an order of magnitude, and is the source of the discrepancy in the total pressure profiles. While it is unrealistic for such a high non-thermal pressure to persist in the galaxy without first losing energy, it does not affect the CGM at all: beyond kpc, the thermal pressure is completely dominant, as would be expected for CRs that remain largely trapped within the galaxy due to lower diffusivity. In the CR run, however, the non-thermal pressure is the dominant source of pressure in the galaxy and the inner kpc of the CGM. At larger radii, the thermal and CR pressures are comparable, thus allowing slightly colder gas not heated up from the surrounding thermal pressure to exist in the entire CGM and boosting the amount of outflowing gas seen in ions like Civ and Ovi as shown in Figure 5. This also explains why the CR run’s CGM has the same temperature as the no-CR run’s CGM: trapped CRs only affect the properties of the ISM and largely leave the CGM unaffected.
3.5 Comparison to observations
Having provided a description of the effects CRs have on our simulated galaxy and its CGM, we now seek to compare the CGM covering fractions to those observed in quasar absorption line studies, such as the MUSE GAs FLOw and Wind (MEGAFLOW) survey 444This survey was designed to study the CGM properties around star-forming galaxies using the Multi Unit Spectroscopic Explorer (MUSE, Bacon et al. 2010) spectrograph on the Very Large Telescope (VLT) towards two dozen quasar sight-lines (Bouché et al. in prep.). for Mgii (Bouché et al. in prep.). In particular, Schroetter et al. (2021) investigated the Mgii (and Civ) covering fraction of star-forming galaxies at using Mg ii absorption lines (rest equivalent width Å) and star-forming galaxies within 250 kpc of the quasar sight-lines. In addition, we also use covering fractions for the higher ions Ovi from Kacprzak et al. (2015) and Tchernyshyov et al. (2023), whose host galaxies have a similar of M⊙ and , and Civ from Bordoloi et al. (2014), whose host galaxies have of M⊙ and .
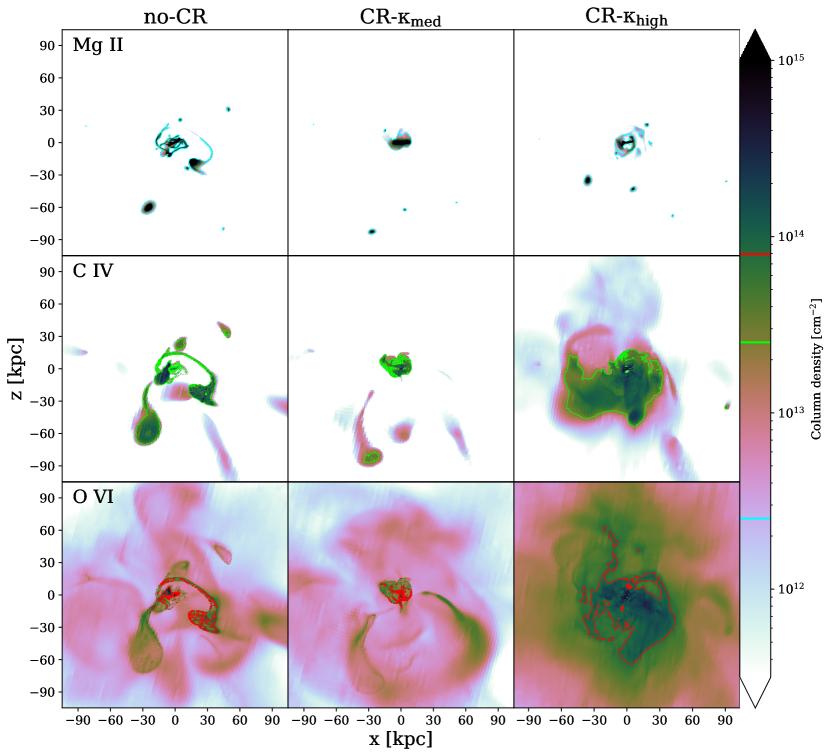
In order to compare our simulations to these quasar sightline observations, we use Trident (Hummels et al., 2017) to populate our simulations with specific ions using parameters derived from Cloudy (Ferland et al., 2013) ionization tables. For this paper, we focus on three ions commonly observed in absorption – Mgii, Civ, and Ovi – because they each trace a different temperature phase of the gas (, and respectively, from Tumlinson et al., 2017). In Figure 8, we show column density maps of these three ions for the three runs at . We show the observational column density cutoffs for the three ions (Schroetter et al. 2021 for Mgii and Civ and Kacprzak et al. 2015 for Ovi) as coloured contours. First, we see that at distances kpc from the galaxy all three runs exhibit a CGM similarly devoid of Mgii except for the presence of satellites. This indicates that in addition to not changing the phase structure, neither run with CRs is any more effective than the default feedback model at pushing Mgii gas out of the galaxy to large distances in the CGM. Within kpc from the galaxy though, all three runs have different Mgii properties. In no-CR, Mgii traces the clear tidal tails seen in Figure 3 whereas in CR those tidal tails are not cold or dense enough to absorb Mgii, and there is a sudden column density drop off at the edge of the disc. In CR, small Mgii column densities extend slightly beyond the disc but they merely approach and do not exceed current observational column density limits from MEGAFLOW.
Next, we examine the Civ distributions around the galaxy (middle row of Figure 8). For the no-CR run, most of the highest Civ column densities overlap with where the Mgii is (i.e. in satellites and tidal tails) but it extends beyond where the Mgii stops, indicating the cold structures are immediately surrounded by a warmer interface. This warmer and more diffuse gas is also being stripped from satellites further out in the CGM. In the CR run, we again see an abrupt drop off at the edge of the disc similar to what is seen in no-CR and all of the Mgii maps, as well as a diffuse envelope being stripped from satellites in the same way. However, the CR run shows a drastically different distribution of Civ with higher column densities () out to 50 kpc and lower values () that reach the virial radius and are close to volume-filling. Satellite galaxies do not stand out in this Civ map in the same way they do in no-CR and CR, indicating that this phase of gas is found more in the diffuse “smooth” component of the CGM (as suggested by Figure 6) and is not merely a warm “interface” between cold structures and hot gas. Furthermore, the highest Civ column densities in this panel also trace regions of high metallicity seen in Figure 3.
Finally in the bottom row of Figure 8, we show Ovi column densities. In all three runs, this phase of gas is volume-filling, although we again see a strong dichotomy between the CR run and the other two runs. In the former, Ovi picks up high-metallicity gas at temperatures that is distributed throughout the halo as seen in Figure 3, while in both of the latter, the highest Ovi column densities primarily overlap with satellites and tidal tails as is the case with both Mgii and Civ, and at all other locations in the halo Ovi has at least 1 dex smaller column densities.
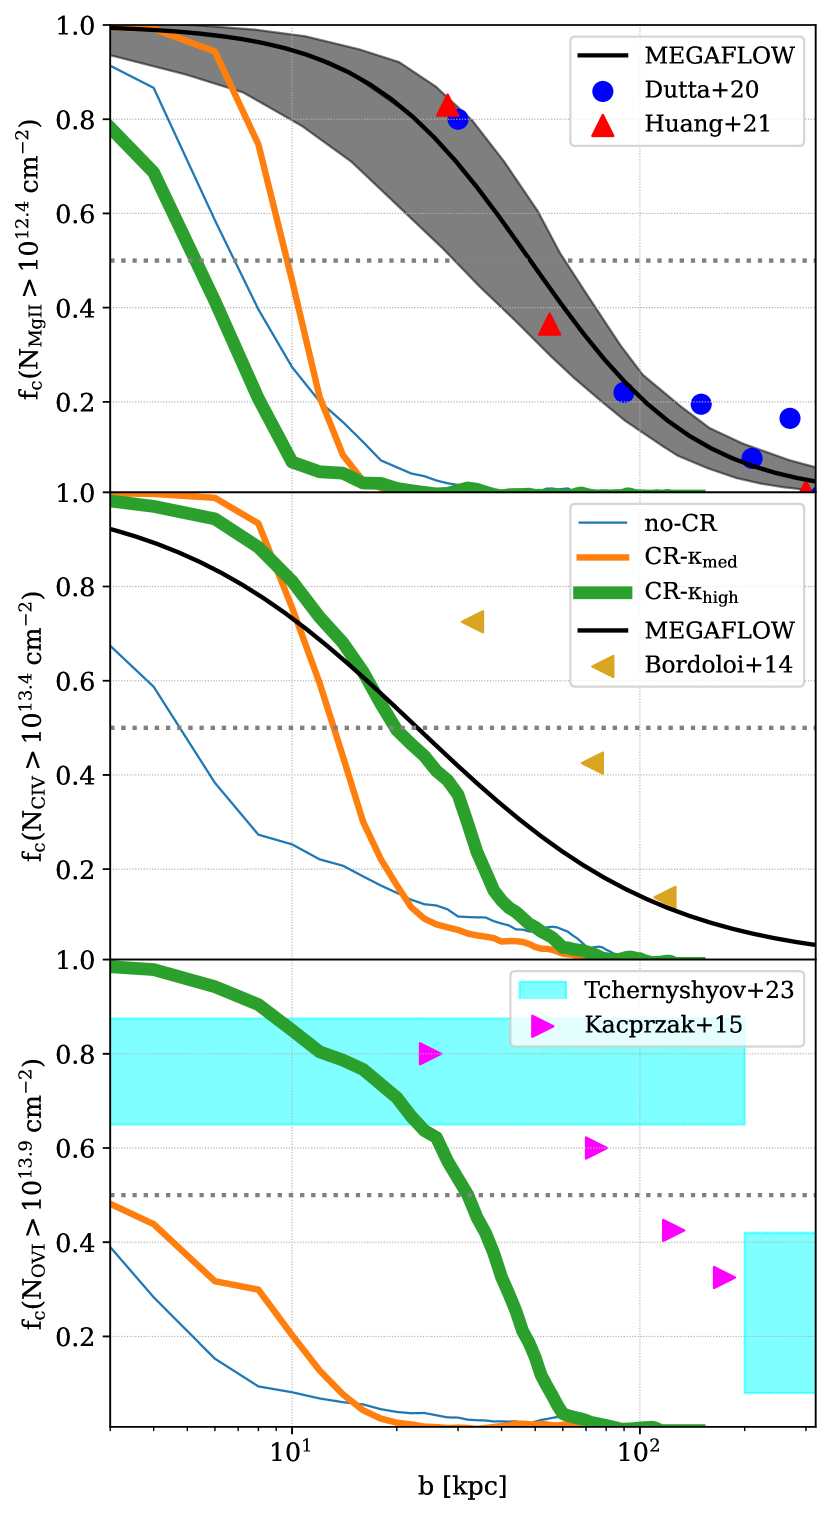
Now, we make an explicit comparison to observations by plotting the covering fraction of the different ions in the CGM of our runs. In Figure 9, we show Mgii, Civ, and Ovi covering fractions as a function of impact parameter for each run calculated using all 12-14 snapshots between and . This large sample size serves two purposes: first, to increase the number of sightlines used in the calculation and reduce the effect of transient features in the CGM (as in previous figures), and second, to better represent the spread in absorber redshifts in surveys like MEGAFLOW. For each snapshot, we choose a random orientation of the halo and measure the column density of sightlines along that orientation with impact parameters as large as the virial radius. We define a sightline to be “covered” if it exceeds the ion column density corresponding to an equivalent width threshold used by Schroetter et al. (2021) for Mgii and Civ and Kacprzak et al. (2015) for Ovi. This conversion from equivalent width to column density depends on the wavelength considered and assumes an optically thin regime (see Rey et al. 2023, in prep. for details) and results in minimum column densities of for Mgii, for Civ, and for Ovi, all roughly corresponding to equivalent widths of 0.1 Å.
From the upper panel of Figure 9, it is clear that none of the runs produce nearly enough Mgii absorption in the CGM to be consistent with observations from MEGAFLOW, as well as with similar observations from other recent Mgii surveys from Dutta et al. (2020) at and Huang et al. (2021) at . Within the galaxy ( kpc), the CR run produces the highest Mgii covering fractions, boosting a bit the typical values seen in the no-CR run. The CR run lowers the covering fraction at these impact parameters. All of the runs drop below a covering fraction of 50% by 10 kpc rather than at as in the observations. Outside of the galaxy, it is actually the no-CR run that has the highest overall covering fractions, largely coming from the high-column density tidal tails connected to the galaxy that are strongest in that run. However, all of the runs are very Mgii-deficient at these impact parameters.
The middle panel shows covering fractions for Civ as well as comparable observations from Bordoloi et al. (2014) and MEGAFLOW (Schroetter et al., 2021). All three runs are better at matching observed Civ covering fractions from MEGAFLOW than they are at matching Mgii as a function of impact parameter. Within the galaxy, both runs with CRs show an enhancement of the covering fraction. Both no-CR and CR drop below 50% at impact parameters kpc, noticeably closer to the galaxy than both MEGAFLOW and Bordoloi et al. (2014), and in the CGM both of these runs are significantly below the observed covering fractions. The CR run is different: it stays much closer to the observed values from MEGAFLOW until kpc where it starts to fall short. However, it is still significantly below the lower-redshift observations from Bordoloi et al. (2014).
Finally, we show the three runs’ covering fractions for Ovi, as well as comparisons to recent observations from Kacprzak et al. (2015) and Tchernyshyov et al. (2023). As for Mgii, the no-CR and CR runs fail to reproduce observable Ovi in the CGM. The CR run is significantly closer to observations, though at nearly all impact parameters in the CGM that run still falls very short. Interestingly, within the galaxy, only the CR run has enough Ovi to approach observed values of the covering fraction, likely indicative of the higher metallicity environment of the CR run seen in Figure 1. As with Bordoloi et al. (2014), these two Ovi surveys are at lower redshifts than our fiducial simulation outputs. Running the simulations to a matching lower redshift could allow the CRs more time to diffuse out from the galaxy and affect the CGM, resulting in a better agreement between the covering fractions of Civ or Ovi. However, this is unlikely to occur as from redshifts to none of our simulated covering fractions consistently increase or decrease.
4 Discussion
In this section, we first consider the effect of varying the column density thresholds used in deriving covering fractions from our simulations, to determine how sensitive our observational comparison is to small (and large) adjustments to these values. Then, we discuss our results in the context of other recent studies on the effects CRs have on the CGM.
4.1 Column density cutoffs
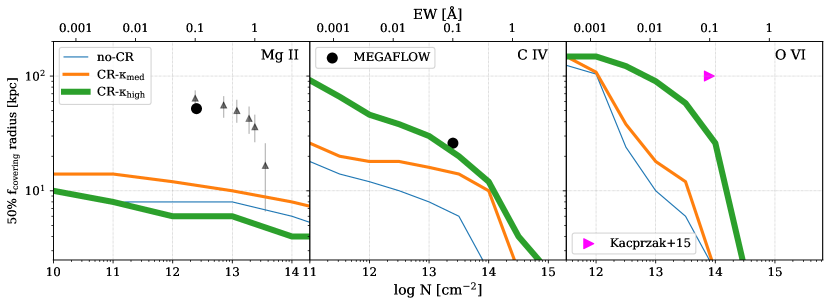
The main results of our comparison to observations in the previous section come from assuming particular column density thresholds for the different ions derived from recent observational studies and applying those to our simulations. These precise thresholds depend on specific properties of the surveys such as the length of observations, as well as the sensitivity of the actual instruments. We may therefore reach different conclusions if a deeper set of observations of any of these ions are used. To measure this possible effect, we vary the column density threshold used to derive covering fractions, thus mimicking the effect of observing the same object with different sensitivities or resolutions. We quantify this in Figure 10, by plotting the radius at which 50% of sightlines are higher than a series of thresholds for Mgii, Civ, and Ovi as a function of that column density threshold. We see that for Mgii, this radius shows little evolution over 4 dex in column density for all three runs, and reaches a maximum of only kpc for a minimum column density of . This is substantially smaller than the corresponding radius of 52 kpc from the fit to the data from Schroetter et al. (2021), as well as the radii calculated by Cherrey et al. in prep. using multiple Mgii equivalent width cutoffs Å, indicating that the simulated covering fractions are consistently below observations and not sensitive at all to the precise choice of column density (or equivalent width) used to define observable Mgii in our simulations.
Civ column densities span fewer orders of magnitude throughout the halo, so its 50% covering fraction radius shows a stronger trend with the column density threshold. Reducing the column density (or equivalent width) cutoff over a common observational range from Å to Å significantly increases the 50% covering fraction radius by at least half a dex. The CR run in particular matches the the 50% covering fraction radius of MEGAFLOW very near the survey’s minimum Civ column density of , and these simulations suggest that more sensitive Civ observations would reveal higher covering fractions for that ion that extend to larger and larger radii. Finally, we see that like Civ, the extent of Ovi coverage is also very sensitive to the column density threshold. All three of our runs’ 50% covering fraction radii vary in a similar way with column density, and slightly more strongly than in the corresponding Civ panel. The CR run in particular has a consistently larger 50% covering fraction radius at all considered column densities.
The enhancement of Civ and Ovi in the CR run at multiple column density thresholds compared to the other two runs shows that CRs can significantly contribute to the metal enrichment of the CGM and provide an environment favorable to certain ions, but only if they are able to escape the ISM so their pressure support becomes substantial at large distances. The reason Mgii behaves differently in Figure 10 is due to the lack of cold () gas in the CGM rather than a lack of metals, which itself comes from the loss of resolution of the coldest gas structures from the ISM to the CGM, resulting in very low Mgii column densities in the CGM. Simulations with increased CGM resolution such as Hummels et al. (2019) and van de Voort et al. (2019) suggest that the typical temperature of the CGM should be lower, and heavily favor the formation of low ions like Mgii. Thus, with significantly increased resolution in the CGM, we speculate that effective CR diffusion out of the ISM would produce a similar enhancement in the Mgii covering fraction as it currently does for Civ and Ovi.
4.2 Comparisons to recent work
There have been many recent efforts in adding CRs to galaxy formation simulations, and we highlight some with direct connections to our analysis of galaxy and especially CGM gas properties here. Farcy et al. (2022) modelled a set of idealised galaxies using a similar CR feedback implementation, and we compare our results to the most massive galaxy from that study as it is most similar to our simulations. In the ISM, they also find that the gas density distribution is smoother and the SFR is reduced when CRs are included. However, the effect of different diffusion coefficients changes when the galaxies are modelled from cosmological initial conditions. In Farcy et al. (2022)’s idealised galaxies, the largest reduction in the SFR occurs for lower stellar masses with , and as increases CRs are less effective at reducing the SFR. At higher stellar masses the SFR is essentially unaffected by CRs regardless of the choice of . In our simulations the trend with is different: we find that the higher diffusion in CR results in a lower SFR over time than CR. This is likely because our simulations have cosmological inflows which are slowed by CRs that diffuse out of the galaxy more effectively, thus reducing fuel for star formation. We also see a qualitatively similar result in the CGM: gas surrounding the idealised galaxies is cooler when CRs are included. This is driven entirely by the changing nature of the outflowing gas, which is dominated by both warm () and hot () gas with CRs, and only hot gas without CRs, when measured 10 kpc above the galaxy disc plane. However, in our cosmological simulations, we see that unless the CR diffusivity is high, gas at temperatures below do not extend very far into the CGM at all (see Figure 3). Furthermore, from Figure 5 we see that the highest outflow rates very close to the galaxy are in all cases dominated by cold () gas, but further out beyond 10 kpc only hot gas is outflowing. Unlike in Farcy et al. (2022), as used in CR results in very little outflow enhancement at any temperature, meaning that in a cosmological environment (i.e. with longer physical timescales and large-scale inflows), a higher level of CR diffusivity is necessary to enhance the outflow rate to distances beyond 10 kpc.
Rodríguez Montero et al. (2023) also study the effect of CR feedback on properties of the ISM and outflows using a Ramses simulation setup much more similar to ours: namely, a cosmological zoom-in simulation of a Milky Way-analogue evolved to . They use a CR diffusion coefficient of , which lies between our CR and CR, although they also include CR streaming. Though we focus our attention on circumgalactic gas, we still find many key consistencies in the effects CRs have on our simulated galaxies. For example, their CR simulation has an early reduction in the stellar mass that levels off to a factor of a few by the end of their simulation, much like what we see in Figure 4, although their inclusion of CR streaming has an impact on their star formation history that is not modelled in our analysis. CRs also smooth out the gas distribution in the disc. Furthermore, they find that CR-launched outflows are more dominated by “warm” () gas than outflows without CRs. Particularly relevant to our work, they find that a non-thermal pressure gradient similar to what we find in Figure 7 further accelerates outflowing gas in the CGM of their simulation, demonstrating how CRs can redistribute gas on galactic and circumgalactic scales concurrently.
There have also been many direct comparisons to CGM observations using various simulation codes such as Enzo, Gizmo and ChaNGa, which have found differing specific effects. While the overall temperatures of the CGM are cooler with CRs, the column density profiles of key ions do not always change in the same way. For example, in simulations from Salem et al. (2016), Ovi column densities are enhanced by nearly a factor of 100 when CRs are included in the physics model. Other studies have less drastic changes: in the inner regions of the CGM, Ji et al. (2020) finds an enhancement of the Ovi column density by a factor of for halo masses comparable to ours. However, the simulations from Butsky et al. (2022) actually have lower Ovi column densities in the CGM with CRs than without. We speculate that this opposite effect observed in Butsky et al. (2022) originates from their “blastwave” supernova feedback model, in which cooling is temporarily disabled over some timescale. Rosdahl et al. (2017) showed that turning off cooling in supernova remnants tends to produce much cooler (i.e. Ovi-poorer) outflows than other supernova feedback models, so adding CRs may not boost Ovi column densities in the CGM.
More intermediate ions like Siiii and Siiv are consistently enhanced in these simulations at levels currently probed by observations, but Mgii as measured by Ji et al. (2020) is only enhanced at column densities that are below current observational limits for radii outside the inner kpc. Importantly, this indicates that high-equivalent width Mgii observations such as those from MEGAFLOW are difficult to reproduce with CRs across multiple simulation codes. The simulations in these two studies use CR diffusion coefficients of 1 to a few , suggesting that higher values of diffusion are favored for matching CGM observations, especially at larger radii. The comparably high CR diffusion we use in our simulations is not enough to increase Mgii to the levels seen in large CGM absorption surveys, although as CR transport is fairly unconstrained the possibility of CR diffusion alone affecting the CGM at those levels cannot be ruled out. It is also likely that with higher resolution of the cold phase, CRs effect on Mgii in the CGM could be larger and bring the simulations closer to observations, even with the same CR diffusion coefficient.
5 Conclusions
In this paper, we ran three Ramses simulations in order to understand the possible range of effects that CR feedback has on the CGM of galaxies. We evolved three realizations of the same galaxy from cosmological initial conditions to with no additional CR feedback (no-CR), CR feedback with a moderate value of for the CR diffusion coefficient (CR), and CR feedback with a high value of for the CR diffusion coefficient (CR). Our conclusions are as follows:
-
1.
Over cosmological time, cosmic rays can smooth out the density distribution within the galaxy’s ISM and expand the gas disc, though if the cosmic ray diffusion coefficient is large, this effect is minimal (Figure 1).
-
2.
As is the case for galaxies of a similar mass from other idealised and zoom-in simulations, cosmic rays lower the star formation rate, resulting in a slightly lower stellar mass by (Figure 4).
-
3.
The CR run with a higher cosmic ray diffusion coefficient has a CGM that is cooler and, crucially, much richer in metals than either the no-CR run or the CR run, indicating that the “sweet spot” of CR diffusivity (see, e.g. Hopkins et al., 2020) necessary for CRs to affect the phase of the gas and the observability of metal ions beyond the immediate vicinity of the galaxy without completely decoupling the from the gas is at least (Figures 3 and 6).
-
4.
Cosmic rays with a high diffusion coefficient accelerate outflowing gas substantially further out into the CGM by enhancing such gas with temperatures at distances above kpc from the galaxy (Figure 5).
-
5.
Cosmic ray pressure dominates but remains confined to the galaxy for smaller , but it dominates or is comparable to thermal pressure in the entire halo for larger , thus allowing more low temperature gas to exist throughout the halo (Figure 7).
-
6.
Cosmic rays do not significantly increase Mgii column densities anywhere in the halo, although they do restructure Mgii found near the galaxy-halo interface. The CR run noticeably enhances ions found at higher temperatures (Civ and Ovi) throughout the halo (Figure 8).
-
7.
All three of our runs fail to match observed Mgii covering fractions in the CGM from multiple surveys at . The CR run in particular actually lowers the Mgii covering fraction at all impact parameters. However, the same run increases the covering fraction of Civ and brings it more in line with MEGAFLOW observations (Figure 9).
-
8.
By reducing the column density threshold used to define the covering fraction, the “observed” extent of Civ and Ovi moves outwards into the CGM, especially for the CR run. This does not occur for Mgii because its spread in column densities between small and large radii is much bigger than the same spread for the other measured ions (Figure 10).
With this work, we have studied how CR feedback can propagate out from the galaxy and affect the CGM differently depending on the CR diffusion coefficient. While the Mgii content of the CGM appears largely unaffected by the addition of CRs, the CGM as a whole and outflowing gas in particular have a lower temperature when CRs are able to effectively diffuse out from the galaxy. This diffusion is more relevant when modelling outflows with a cosmological zoom-in simulation rather than from an idealised galaxy without any inflows. We expect CR diffusion to be even more effective in future high-resolution studies of the CGM where there will likely be a more prominent cold phase for CRs to influence.
We note that the CRs in this study all propagate with a constant rate of diffusion. Recent work has focused on a more realistic treatment of CR transport by allowing to vary with gas properties (Farber et al., 2018; Semenov et al., 2021), or by modelling the CR spectrum which allows to vary with CR energy (Girichidis et al., 2022). Butsky et al. (2023) confirms that a constant cannot reproduce the observed complexity of the CGM of COS-Halos galaxies, showing that these more detailed models are indeed necessary for future work. Additionally, other CR transport methods we have not modelled such as streaming could significantly change how the energy from CRs affects the temperature and density structures found in the CGM (Butsky & Quinn, 2018), and the evolution of the galaxy in general (Wiener et al., 2017). The importance of CR streaming relative to diffusion is an active area of study as well (e.g. Thomas et al., 2023).
As work on this topic continues, we intend to further examine the possible constructive impact on CRs of other physical effects (e.g., radiative transfer) and sources of feedback (e.g., AGN) that are not included in our simulations, as this may help provide the physical coupling necessary to produce cold Mgii-bearing outflows that are found in observations.
Acknowledgements
We thank the anonymous referee for helpful comments that improved the paper. This work has been carried out thanks to the support of the ANR 3DGasFlows (ANR-17-CE31-0017). Simulations were run using the GENCI allocations A0070410560 from 2019 and A0070410560 from 2020, and they were stored and analysed on PSMN (Pôle Scientifique de Modélisation Numérique) of the ENS de Lyon.
Data Availability
The data generated and used in this article will be shared on reasonable request to the corresponding author.
References
- Aubert et al. (2004) Aubert D., Pichon C., Colombi S., 2004, MNRAS, 352, 376
- Avery et al. (2022) Avery C. R., et al., 2022, MNRAS, 511, 4223
- Bacon et al. (2010) Bacon R., et al., 2010, in McLean I. S., Ramsay S. K., Takami H., eds, Society of Photo-Optical Instrumentation Engineers (SPIE) Conference Series Vol. 7735, Ground-based and Airborne Instrumentation for Astronomy III. p. 773508 (arXiv:2211.16795), doi:10.1117/12.856027
- Boogaard et al. (2018) Boogaard L. A., et al., 2018, A&A, 619, A27
- Bordoloi et al. (2014) Bordoloi R., et al., 2014, ApJ, 796, 136
- Boulares & Cox (1990) Boulares A., Cox D. P., 1990, ApJ, 365, 544
- Burchett et al. (2019) Burchett J. N., et al., 2019, ApJ, 877, L20
- Butsky & Quinn (2018) Butsky I. S., Quinn T. R., 2018, ApJ, 868, 108
- Butsky et al. (2022) Butsky I. S., et al., 2022, ApJ, 935, 69
- Butsky et al. (2023) Butsky I. S., Nakum S., Ponnada S. B., Hummels C. B., Ji S., Hopkins P. F., 2023, MNRAS, 521, 2477
- Chan et al. (2019) Chan T. K., Kereš D., Hopkins P. F., Quataert E., Su K. Y., Hayward C. C., Faucher-Giguère C. A., 2019, MNRAS, 488, 3716
- Chisholm et al. (2018) Chisholm J., Bordoloi R., Rigby J. R., Bayliss M., 2018, MNRAS, 474, 1688
- Dashyan & Dubois (2020) Dashyan G., Dubois Y., 2020, A&A, 638, A123
- Davies et al. (2020) Davies J. J., Crain R. A., Oppenheimer B. D., Schaye J., 2020, MNRAS, 491, 4462
- DeFelippis et al. (2017) DeFelippis D., Genel S., Bryan G. L., Fall S. M., 2017, ApJ, 841, 16
- Dubois & Commerçon (2016) Dubois Y., Commerçon B., 2016, A&A, 585, A138
- Dubois et al. (2016) Dubois Y., Peirani S., Pichon C., Devriendt J., Gavazzi R., Welker C., Volonteri M., 2016, MNRAS, 463, 3948
- Dubois et al. (2019) Dubois Y., Commerçon B., Marcowith A., Brahimi L., 2019, A&A, 631, A121
- Dutta et al. (2020) Dutta R., et al., 2020, MNRAS, 499, 5022
- Farber et al. (2018) Farber R., Ruszkowski M., Yang H. Y. K., Zweibel E. G., 2018, ApJ, 856, 112
- Farcy et al. (2022) Farcy M., Rosdahl J., Dubois Y., Blaizot J., Martin-Alvarez S., 2022, MNRAS, 513, 5000
- Faucher-Giguère & Oh (2023) Faucher-Giguère C.-A., Oh S. P., 2023, ARA&A, 61, 131
- Ferland et al. (1998) Ferland G. J., Korista K. T., Verner D. A., Ferguson J. W., Kingdon J. B., Verner E. M., 1998, PASP, 110, 761
- Ferland et al. (2013) Ferland G. J., et al., 2013, Rev. Mex. Astron. Astrofis., 49, 137
- Girichidis et al. (2018) Girichidis P., Naab T., Hanasz M., Walch S., 2018, MNRAS, 479, 3042
- Girichidis et al. (2022) Girichidis P., Pfrommer C., Pakmor R., Springel V., 2022, MNRAS, 510, 3917
- Girichidis et al. (2024) Girichidis P., Werhahn M., Pfrommer C., Pakmor R., Springel V., 2024, MNRAS, 527, 10897
- Guo & Oh (2008) Guo F., Oh S. P., 2008, MNRAS, 384, 251
- Haardt & Madau (1996) Haardt F., Madau P., 1996, ApJ, 461, 20
- Hahn & Abel (2011) Hahn O., Abel T., 2011, MNRAS, 415, 2101
- Hopkins et al. (2020) Hopkins P. F., et al., 2020, MNRAS, 492, 3465
- Hopkins et al. (2021) Hopkins P. F., Chan T. K., Squire J., Quataert E., Ji S., Kereš D., Faucher-Giguère C.-A., 2021, MNRAS, 501, 3663
- Hopkins et al. (2022) Hopkins P. F., Squire J., Butsky I. S., 2022, MNRAS, 509, 3779
- Huang et al. (2021) Huang Y.-H., Chen H.-W., Shectman S. A., Johnson S. D., Zahedy F. S., Helsby J. E., Gauthier J.-R., Thompson I. B., 2021, MNRAS, 502, 4743
- Hummels et al. (2017) Hummels C. B., Smith B. D., Silvia D. W., 2017, ApJ, 847, 59
- Hummels et al. (2019) Hummels C. B., et al., 2019, ApJ, 882, 156
- Jacob et al. (2018) Jacob S., Pakmor R., Simpson C. M., Springel V., Pfrommer C., 2018, MNRAS, 475, 570
- Ji et al. (2020) Ji S., et al., 2020, MNRAS, 496, 4221
- Jiang & Oh (2018) Jiang Y.-F., Oh S. P., 2018, ApJ, 854, 5
- Kacprzak et al. (2015) Kacprzak G. G., Muzahid S., Churchill C. W., Nielsen N. M., Charlton J. C., 2015, ApJ, 815, 22
- Kimm & Cen (2014) Kimm T., Cen R., 2014, ApJ, 788, 121
- Kimm et al. (2015) Kimm T., Cen R., Devriendt J., Dubois Y., Slyz A., 2015, MNRAS, 451, 2900
- Kopenhafer et al. (2023) Kopenhafer C., O’Shea B. W., Voit G. M., 2023, ApJ, 951, 107
- Kroupa (2001) Kroupa P., 2001, MNRAS, 322, 231
- Marinacci et al. (2018) Marinacci F., et al., 2018, MNRAS, 480, 5113
- Martin-Alvarez et al. (2023) Martin-Alvarez S., Sijacki D., Haehnelt M. G., Farcy M., Dubois Y., Belokurov V., Rosdahl J., Lopez-Rodriguez E., 2023, MNRAS, 525, 3806
- McCourt et al. (2018) McCourt M., Oh S. P., O’Leary R., Madigan A.-M., 2018, MNRAS, 473, 5407
- Mitchell et al. (2020) Mitchell P. D., Schaye J., Bower R. G., Crain R. A., 2020, MNRAS, 494, 3971
- Miyoshi & Kusano (2005) Miyoshi T., Kusano K., 2005, Journal of Computational Physics, 208, 315
- Morlino & Caprioli (2012) Morlino G., Caprioli D., 2012, A&A, 538, A81
- Naiman et al. (2018) Naiman J. P., et al., 2018, MNRAS, 477, 1206
- Nelson et al. (2018) Nelson D., et al., 2018, MNRAS, 475, 624
- Nelson et al. (2019) Nelson D., et al., 2019, MNRAS, 490, 3234
- Nelson et al. (2020) Nelson D., et al., 2020, MNRAS, 498, 2391
- Nuñez-Castiñeyra et al. (2022) Nuñez-Castiñeyra A., Grenier I. A., Bournaud F., Dubois Y., Kamal Youssef F. R., Hennebelle P., 2022, arXiv e-prints, p. arXiv:2205.08163
- Obreja et al. (2023) Obreja A., Battaia F. A., Macciò A. V., Buck T., 2023, MNRAS,
- Peeples et al. (2019) Peeples M. S., et al., 2019, ApJ, 873, 129
- Pillepich et al. (2018a) Pillepich A., et al., 2018a, MNRAS, 473, 4077
- Pillepich et al. (2018b) Pillepich A., et al., 2018b, MNRAS, 475, 648
- Pillepich et al. (2019) Pillepich A., et al., 2019, MNRAS, 490, 3196
- Planck Collaboration et al. (2014) Planck Collaboration et al., 2014, A&A, 571, A16
- Ramesh & Nelson (2024) Ramesh R., Nelson D., 2024, MNRAS, 528, 3320
- Rasera & Teyssier (2006) Rasera Y., Teyssier R., 2006, A&A, 445, 1
- Rey (2022) Rey M., 2022, PhD thesis, Ecole Normale Superieure de Lyon, France
- Rodríguez Montero et al. (2023) Rodríguez Montero F., Martin-Alvarez S., Slyz A., Devriendt J., Dubois Y., Sijacki D., 2023, arXiv e-prints, p. arXiv:2307.13733
- Rosdahl et al. (2013) Rosdahl J., Blaizot J., Aubert D., Stranex T., Teyssier R., 2013, MNRAS, 436, 2188
- Rosdahl et al. (2017) Rosdahl J., Schaye J., Dubois Y., Kimm T., Teyssier R., 2017, MNRAS, 466, 11
- Rosdahl et al. (2022) Rosdahl J., et al., 2022, MNRAS, 515, 2386
- Rosen & Bregman (1995) Rosen A., Bregman J. N., 1995, ApJ, 440, 634
- Rudie et al. (2019) Rudie G. C., Steidel C. C., Pettini M., Trainor R. F., Strom A. L., Hummels C. B., Reddy N. A., Shapley A. E., 2019, ApJ, 885, 61
- Salem et al. (2016) Salem M., Bryan G. L., Corlies L., 2016, MNRAS, 456, 582
- Schaye et al. (2015) Schaye J., et al., 2015, MNRAS, 446, 521
- Schroetter et al. (2016) Schroetter I., et al., 2016, ApJ, 833, 39
- Schroetter et al. (2019) Schroetter I., et al., 2019, MNRAS, 490, 4368
- Schroetter et al. (2021) Schroetter I., et al., 2021, MNRAS, 506, 1355
- Semenov et al. (2021) Semenov V. A., Kravtsov A. V., Caprioli D., 2021, ApJ, 910, 126
- Springel et al. (2018) Springel V., et al., 2018, MNRAS, 475, 676
- Strong et al. (2007) Strong A. W., Moskalenko I. V., Ptuskin V. S., 2007, Annual Review of Nuclear and Particle Science, 57, 285
- Suresh et al. (2019) Suresh J., Nelson D., Genel S., Rubin K. H. R., Hernquist L., 2019, MNRAS, 483, 4040
- Tchernyshyov et al. (2023) Tchernyshyov K., et al., 2023, ApJ, 949, 41
- Teyssier (2002) Teyssier R., 2002, A&A, 385, 337
- Teyssier et al. (2006) Teyssier R., Fromang S., Dormy E., 2006, Journal of Computational Physics, 218, 44
- Thomas & Pfrommer (2019) Thomas T., Pfrommer C., 2019, MNRAS, 485, 2977
- Thomas et al. (2023) Thomas T., Pfrommer C., Pakmor R., 2023, MNRAS, 521, 3023
- Toro et al. (1994) Toro E. F., Spruce M., Speares W., 1994, Shock Waves, 4, 25
- Trebitsch et al. (2017) Trebitsch M., Blaizot J., Rosdahl J., Devriendt J., Slyz A., 2017, MNRAS, 470, 224
- Trotta et al. (2011) Trotta R., Jóhannesson G., Moskalenko I. V., Porter T. A., Ruiz de Austri R., Strong A. W., 2011, ApJ, 729, 106
- Tumlinson et al. (2017) Tumlinson J., Peeples M. S., Werk J. K., 2017, ARA&A, 55, 389
- Turner et al. (2014) Turner M. L., Schaye J., Steidel C. C., Rudie G. C., Strom A. L., 2014, MNRAS, 445, 794
- Tweed et al. (2009) Tweed D., Devriendt J., Blaizot J., Colombi S., Slyz A., 2009, A&A, 506, 647
- Übler et al. (2014) Übler H., Naab T., Oser L., Aumer M., Sales L. V., White S. D. M., 2014, MNRAS, 443, 2092
- van de Voort et al. (2019) van de Voort F., Springel V., Mandelker N., van den Bosch F. C., Pakmor R., 2019, MNRAS, 482, L85
- Veilleux et al. (2022) Veilleux S., et al., 2022, ApJ, 926, 60
- Werk et al. (2014) Werk J. K., et al., 2014, ApJ, 792, 8
- Werk et al. (2016) Werk J. K., et al., 2016, ApJ, 833, 54
- Wiener et al. (2017) Wiener J., Pfrommer C., Oh S. P., 2017, MNRAS, 467, 906
- Zabl et al. (2019) Zabl J., et al., 2019, MNRAS, 485, 1961
- Zabl et al. (2020) Zabl J., et al., 2020, MNRAS, 492, 4576