Supplementary Materials for Test-time Similarity Modification for Person Re-identification toward Temporal Distribution Shift
Abstract
The supplementary materials for “Test-time Similarity Modification for Person Re-identification toward Temporal Distribution Shift.” The detailed experimental settings (Section VII) and additional experimental results (Section VIII) are provided.
VII Experimental Settings
VII-A Evaluation Metric
We used the top-1 cumulative matching characteristics (CMC) accuracy as the evaluation metric. CMC is one of the most popular evaluation metrics in re-id. Top-1 CMC accuracy measures the ratio of the query images for which the nearest gallery feature has the same identity as the query feature:
| (1) |
where is the total number of queries, is a query feature, is the ground-truth of the person identity of , is the nearest gallery feature, is the person identity label of a given gallery feature, and is the indicator function.
VII-B Corruption
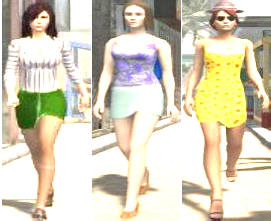
In the corruption scenario, we corrupted the query images by varying their brightness, adding Gaussian blur, and pixelate. Here, we describe these corruptions.
Brightness multiplies a factor to each pixel value of the images. The pixel values are clipped when they exceed the range of . In the experiment, we changed as follows: [0.75, 0.5, 0.75, 1, 1.25, 1.5, 1.25, 1].
Gaussian blur convolves a Gaussian filter with the images. We changed the filter size as follows: [7, 15, 29, 35, 43]. The standard deviation of the Gaussian filter was automatically determined based on . For more details, please refer to torchvision’s documentation (torchvision.transforms.functional.gaussian_blur).
Pixelate reduces the pixel information by shrinking and then expanding the images. We resized the images, first by a scale factor , then back to the original size. We changed the scale factor as follows: [0.6, 0.5, 0.4, 0.3, 0.25].
Fig. 6 illustrates examples of the corruptions.
 |
 |
 |
 |
|
| (a) | (b) | (c) | (d) | (e) |
VIII Other Results
| Corruption | Source | 0.0 | 0.0001 | 0.001 |
|---|---|---|---|---|
| Brightness | MA | |||
| MS | ||||
| PX | ||||
| Gaussian-blur | MA | |||
| MS | ||||
| PX | ||||
| Pixelate | MA | |||
| MS | ||||
| PX | ||||
| Phase | ||||
| Source | 1 | 2 | 3 | |
| Market-1501 | PX | MS | MA | |
| 0.0 | ||||
| 0.0001 | ||||
| 0.001 | ||||
| MSMT17 | MA | PX | MS | |
| 0.0 | ||||
| 0.0001 | ||||
| 0.001 | ||||
| PersonX | MS | MA | PX | |
| 0.0 | ||||
| 0.0001 | ||||
| 0.001 | ||||

VIII-A Effect of Batch Size
| Batch size | ||||||||
|---|---|---|---|---|---|---|---|---|
| Corruption | Source | Method | 64 | 32 | 16 | 8 | 2 | 1 |
| Brightness | MA | No-adapt | ||||||
| BN-adapt [2] | - | |||||||
| SourceTent | - | |||||||
| BNTA [3] | - | - | ||||||
| TEMP | ||||||||
| MS | No-adapt | |||||||
| BN-adapt [2] | - | |||||||
| SourceTent | - | |||||||
| BNTA [3] | - | - | ||||||
| TEMP | ||||||||
| PX | No-adapt | |||||||
| BN-adapt [2] | - | |||||||
| SourceTent | - | |||||||
| BNTA [3] | - | - | ||||||
| TEMP | ||||||||
| Gaussian-blur | MA | No-adapt | ||||||
| BN-adapt [2] | - | |||||||
| SourceTent | - | |||||||
| BNTA [3] | - | - | ||||||
| TEMP | ||||||||
| MS | No-adapt | |||||||
| BN-adapt [2] | - | |||||||
| SourceTent | - | |||||||
| BNTA [3] | - | - | ||||||
| TEMP | ||||||||
| PX | No-adapt | |||||||
| BN-adapt [2] | - | |||||||
| SourceTent | - | |||||||
| BNTA [3] | - | - | ||||||
| TEMP | ||||||||
| Pixelate | MA | No-adapt | ||||||
| BN-adapt [2] | - | |||||||
| SourceTent | - | |||||||
| BNTA [3] | - | - | ||||||
| TEMP | ||||||||
| MS | No-adapt | |||||||
| BN-adapt [2] | - | |||||||
| SourceTent | - | |||||||
| BNTA [3] | - | - | ||||||
| TEMP | ||||||||
| PX | No-adapt | |||||||
| BN-adapt [2] | - | |||||||
| SourceTent | - | |||||||
| BNTA [3] | - | - | ||||||
| TEMP | ||||||||
In the online setting, models often have to predict incoming data instantly rather than waiting to accumulate sufficient data for making a batch. We ran TTA with batch sizes of .
Location change: Please refer to the main paper.
Image Corruption: Table VI shows the effect of the batch size tested in the corruption case. Similar to the location change scenario, TEMP consistently outperformed the baselines in almost all cases while BN-adapt had low accuracy with a small batch size.
VIII-B Additional Results in the Corruption Scenario
 |
 |
 |
 |
 |
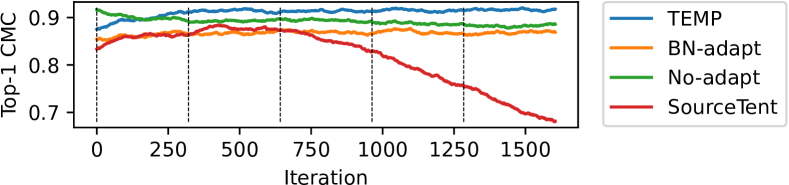 |
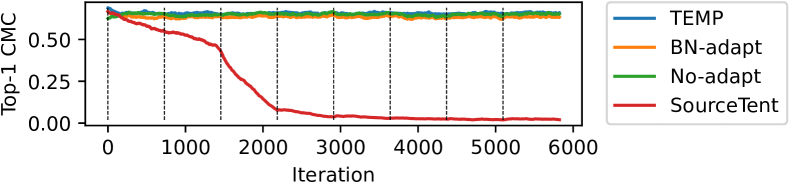
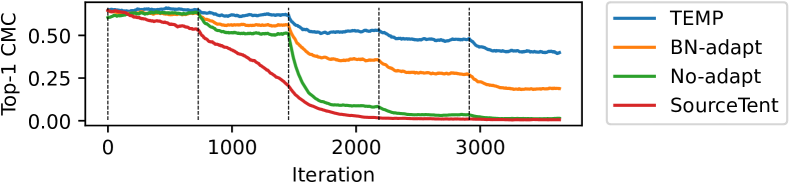
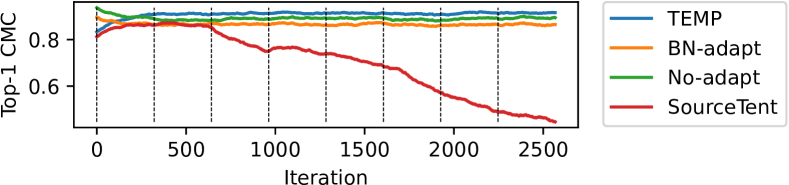
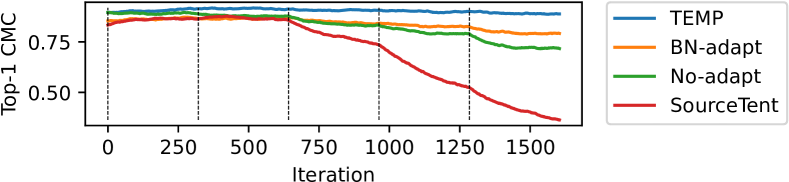
Figs. 8 and 9 show top-1 CMC accuracies for each corruption where the source dataset is MSMT17 [4] and PersonX [1]. TEMP has the best top-1 CMC accuracy in most cases.
For the location change scenario, please refer to the main paper.
VIII-C Effect of k in the Corruption Scenario
We examined the effect of varying in the corruption scenario. Fig. 7 shows the results. Similar to the location change scenario shown in the main paper, about consistently produces better results.
For the location change scenario, please refer to the main paper.
VIII-D Effect of the Anti-forgetting Regularization
We investigated the effect of the anti-forgetting regularization. We varied the weight of the regularization within and ran TEMP. Tables V and IV show the average top-1 CMC accuracy in the location change and corruption scenarios. In Table V, a larger improves accuracy when the distribution returns to the source one (phase 3) since the anti-forgetting regularization prevents the model parameters from changing drastically. On the other hand, the accuracy slightly degrades when the distribution differs from the source one (phase 1,2 in Table V and the corruption scenario in Table IV). Thus, there is a trade-off between source performance and adaptability.
 |
 |
| Location change | Corruption |
VIII-E Effect of the Similarity Modification
 |
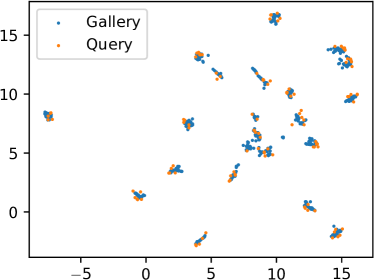 |
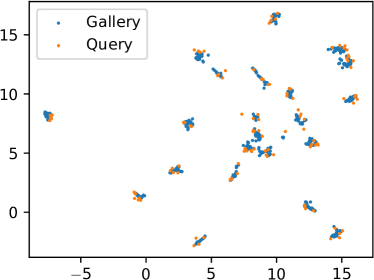
| No-adapt | TEMP |
Similarly to what was described in Sec 5.3.5 of the main paper, we visualized the query and gallery features with UMAP [5]. We extracted the gallery features of PersonX with the feature extractor trained on Market-1501. Then, we ran TTA and extracted the query features with the adapted model. Fig. 11 shows the UMAP visualization. Compared with No-adapt, TEMP reduces the number of query features that are isolated from the gallery clusters.
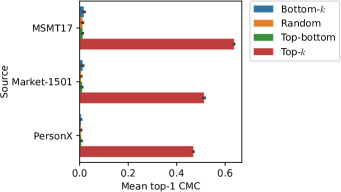
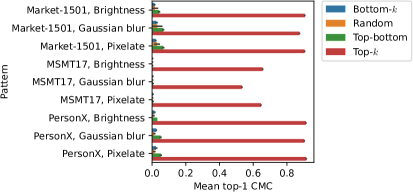
VIII-F Gallery Feature Selection Strategy
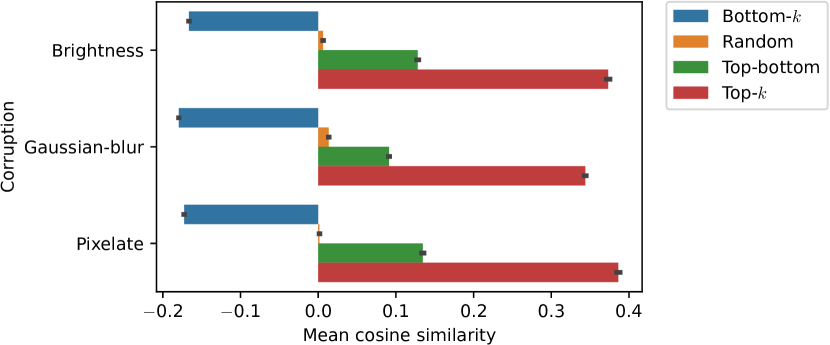
For computing the probability from the feature similarity in Eq. (3) of the main paper, we selected the top- similar gallery features in terms of the similarity . We examined other selection strategies to investigate a better one:
Top-: selects top- similar features as in the main paper.
Bottom-: selects top- dissimilar features.
Top-bottom: selects top- similar and top- dissimilar features.
Random: randomly selects features.
Fig. 10 shows the results. Only the top- worked because modifying neighbors of the query features in the feature space is important. On the other hand, using dissimilar gallery features that do not affect re-id inference negatively affected. Fig. 12 shows the mean cosine similarities between the query features and the selected gallery features. Although we expected the other strategies to make irrelevant gallery features distant from the query one, such an effect can occur within the top- similar gallery features since we used softmax for computing .
References
- [1] X. Sun and L. Zheng, “Dissecting Person Re-Identification From the Viewpoint of Viewpoint,” in Proceedings of the IEEE Conference on Computer Vision and Pattern Recognition (CVPR), 2019.
- [2] P. Benz, C. Zhang, A. Karjauv, and I. S. Kweon, “Revisiting Batch Normalization for Improving Corruption Robustness,” in Proceedings of the IEEE Winter Conference on Applications of Computer Vision (WACV), 2021.
- [3] K. Han, C. Si, Y. Huang, L. Wang, and T. Tan, “Generalizable Person Re-identification via Self-Supervised Batch Norm Test-Time Adaption,” in Proceedings of the AAAI Conference on Artificial Intelligence, 2022.
- [4] L. Wei, S. Zhang, W. Gao, and Q. Tian, “Person Transfer GAN to Bridge Domain Gap for Person Re-Identification,” in Proceedings of the IEEE Conference on Computer Vision and Pattern Recognition (CVPR), 2018.
- [5] L. McInnes, J. Healy, N. Saul, and L. Grossberger, “UMAP: Uniform Manifold Approximation and Projection,” The Journal of Open Source Software, vol. 3, no. 29, p. 861, 2018.