(eccv) Package eccv Warning: Package ‘hyperref’ is loaded with option ‘pagebackref’, which is *not* recommended for camera-ready version
Appendix
A Ablation Experiments
In this section, we conducted additional experiments to demonstrate the effectiveness of the proposed method. We evaluated the experiments for Individual Action Recognition (IAR), Social Group Activity Recognition (SGAR), GloBal Activity Recognition (GBAR), and Social Group Detection (SGDet).
A.1 Dual-Path Activity Transformer
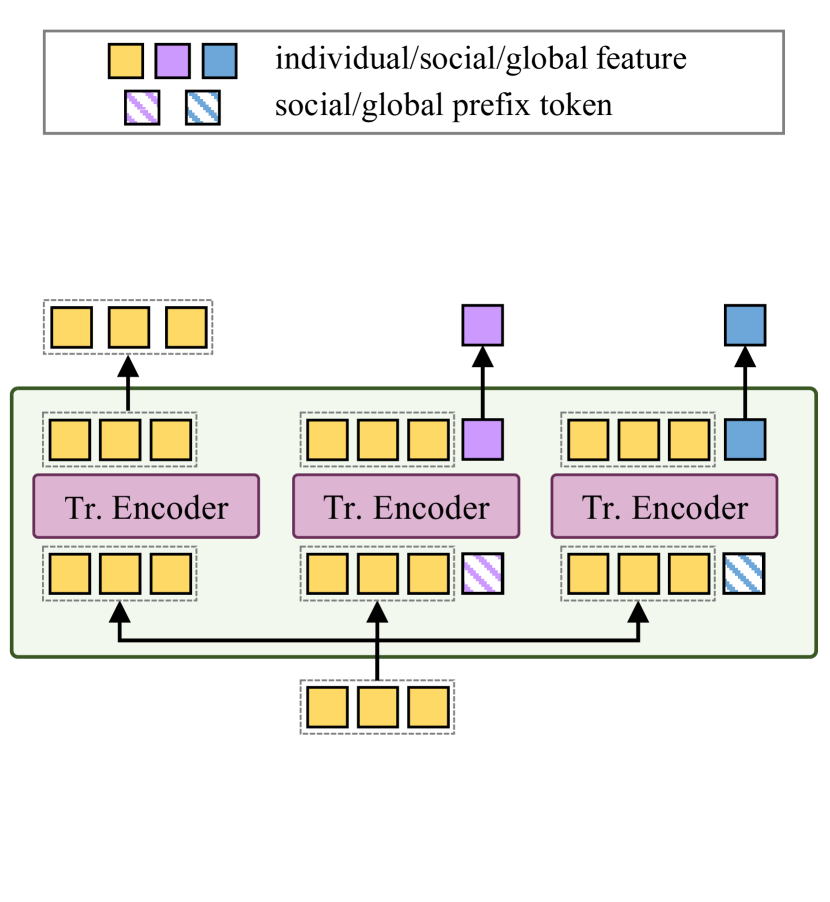
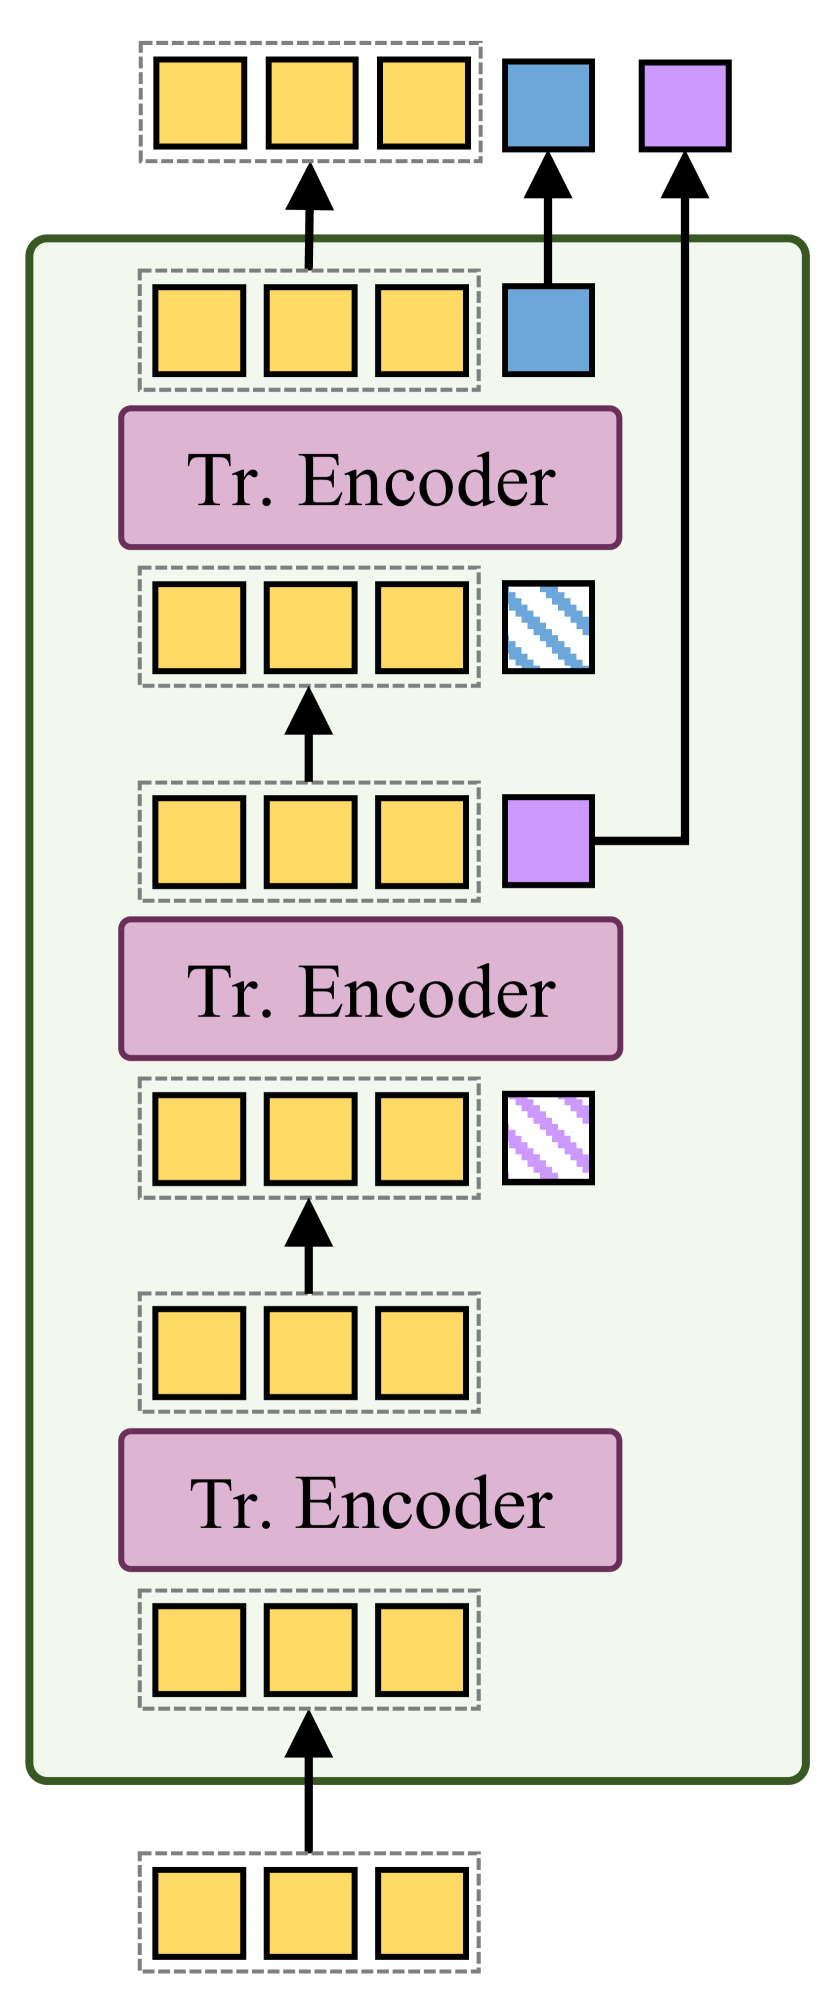
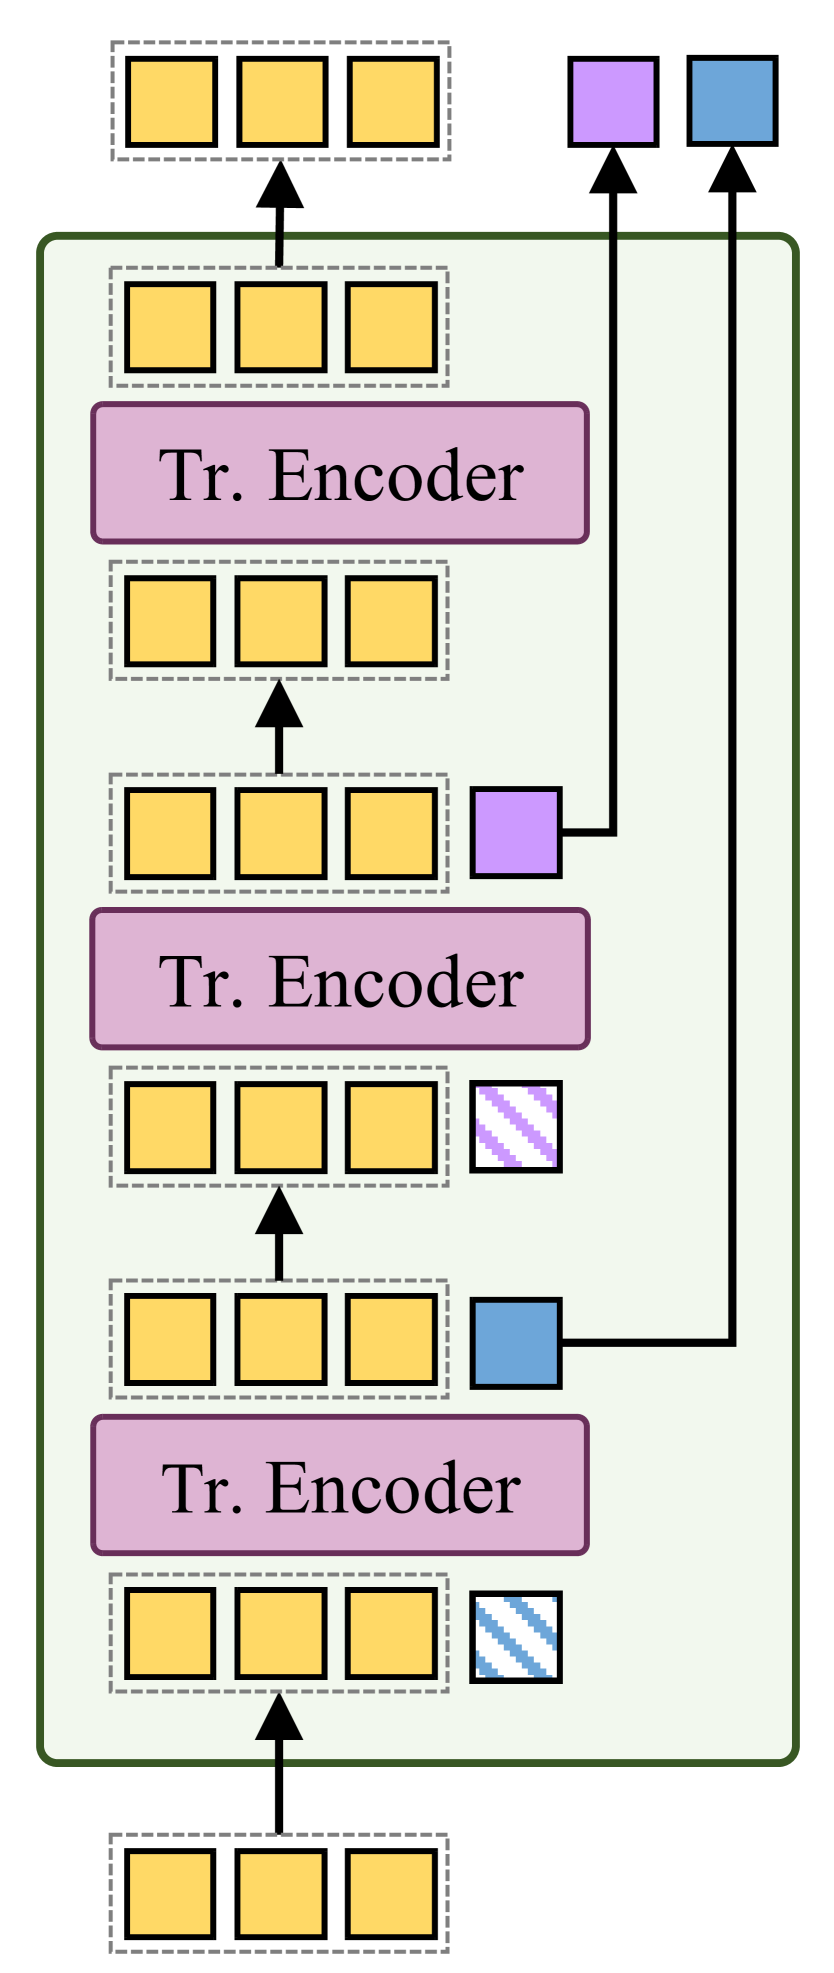
In Sec. 4.3 in the manuscript, we design three types of transformer structures to compare with the proposed Dual-Path Activity Transformer (DPATr). Figure 1 illustrates the detailed mechanism of the ablated architectures: parallel, hierarchical, and reverse hierarchical. Each of these models consists of three transformer encoder blocks [transformer] dedicated to enhancing features of individual actions, social group activities, and global activities, respectively. In the parallel architecture, these blocks operate independently to capture features related to specific granular activities from the self-attended individual features . The hierarchical structure sequentially extracts activity information from smaller to larger spatial granularity. In contrast, the reverse hierarchical structure operates conversely, extracting activity information from larger to smaller spatial granularity. As illustrated in Fig. 3.a in the manuscript, each DPATr layer comprises an individual-to-global path and an individual-to-social path. In the individual-to-social path, richer social-level representations are extracted by leveraging the global-local context explored in the individual-to-global path. By mutually reinforcing contextual understanding of multi-spatial activities through multiple layers, SPDP-Net achieves the most superior performances across all metrics (see Sec. 4.3 in the manuscript).
A.2 Spatio-Temporal Individual Attention.
We ablate three attentions across temporal, height, and width axes in the proximity-based relation encoding. The results are shown in Table 1. We observe that SPDP-Net with either the temporal attention or the spatial attention (i.e., and ) improves the performances by exploiting informative action features of each individual. Incorporating either or with improves the performance of PAR, particularly IAR and GBAR. Specifically, compared to solely using , a combination of and improves the performances of IAR and GBAR by 3.5% and 2.6% in F1 score, respectively. Similarly, using and achieves 3.3% improvement of SGAR and 1.6% improvement of GBAR, in terms of F1 score. By applying both spatial and temporal attentions, our SPDP-Net achieves the best overall performance, resulting 46.5%.
| Individual Action | Social Activity | Global Activity | Overall | |||||||||
| 51.9 | 38.9 | 42.7 | 29.8 | 23.9 | 25.6 | 54.0 | 39.2 | 44.0 | 37.4 | |||
| ✓ | ✓ | 52.4 | 46.7 | 47.0 | 30.6 | 30.4 | 29.2 | 56.2 | 44.8 | 48.3 | 41.5 | |
| ✓ | 56.4 | 44.1 | 47.5 | 29.6 | 28.5 | 27.8 | 54.2 | 42.1 | 45.6 | 40.3 | ||
| ✓ | ✓ | 57.8 | 49.5 | 51.0 | 31.3 | 30.2 | 29.6 | 59.2 | 42.8 | 48.2 | 42.9 | |
| ✓ | ✓ | 57.5 | 50.4 | 51.4 | 32.3 | 32.4 | 31.1 | 58.0 | 42.5 | 47.2 | 43.2 | |
| \cdashline 1-13 ✓ | ✓ | ✓ | 59.4 | 49.7 | 51.8 | 36.5 | 34.8 | 34.2 | 63.4 | 48.8 | 53.5 | 46.5 |
| clustering | IoU@0.5 | IoU@AUC | Mat.IoU |
| Spectral [spectral] | 49.1 | 34.8 | 27.7 |
| K-means | 56.4 | 42.5 | 34.4 |
A.3 Clustering Algorithms
Compared with previous works [par_eccv, mup] employing a graph-based Spectral clustering [spectral], we utilize a parametric-based clustering scheme with the predicted number of the social groups. Table 2 shows the results of SPDP-Net with Spectral clustering and K-means clustering, which is a parameter-based method. SPDP-Net using K-means clustering outperforms using Spectral clustering in SGDet. In particular, K-means clustering demonstrates performance improvements across various metrics: achieving 56.4% in IoU@0.5, 42.5% in IoU@AUC, and 34.4% in Mat.IoU. These results signify enhancements of 7.3%, 7.7%, and 6.7%, respectively. Spectral clustering encounters challenges in determining the optimal cluster number due to its sensitivity to the kernel function. Additionally, it may face scalability and stability issues. For these reasons, K-means clustering, which utilizes the predicted number of clusters, exhibits greater robustness than spectral clustering in social group activity detection in a crowded scene.
| Individual Action | Social Activity | Global Activity | IoU@0.5 | ||||||||
| 50.7 | 45.5 | 45.5 | 29.4 | 29.7 | 28.3 | 58.6 | 43.3 | 48.4 | 51.8 | ||
| ✓ | 53.2 | 48.7 | 47.8 | 30.4 | 29.9 | 28.9 | 59.9 | 43.9 | 49.2 | 51.4 | |
| ✓ | 56.7 | 47.3 | 49.4 | 33.9 | 31.0 | 31.2 | 60.4 | 47.7 | 51.6 | 53.3 | |
| \cdashline 1-12 ✓ | ✓ | 59.4 | 49.7 | 51.8 | 36.5 | 34.8 | 34.2 | 63.4 | 48.8 | 53.5 | 56.4 |
| Activity Recognition | Social Group Detection | ||||||
| IoU@0.5 | IoU@AUC | Mat.IoU | |||||
| 1 : 1 : 3 | 53.1 | 30.4 | 55.2 | 46.2 | 50.0 | 35.8 | 28.1 |
| 1 : 3 : 1 | 50.0 | 32.1 | 52.6 | 44.9 | 56.1 | 42.0 | 34.6 |
| 3 : 1 : 1 | 52.5 | 29.8 | 52.9 | 45.1 | 51.7 | 39.3 | 29.8 |
| \cdashline 1-8 1 : 1 : 1 | 51.8 | 34.2 | 53.5 | 46.5 | 56.4 | 42.5 | 34.3 |
A.4 Loss functions
We ablate the auxiliary loss and the relation loss functions and summarize the results in Table 3. While encourages the individual self-attention to learn individual action information, drives the visual similarity matrix to capture social relationships among individuals. While solely using results in slight improvements in multi-granular activity recognition compared with the baseline, utilizing achieves performance improvements by 3.9% in , 2.9%p in , and 3.2% in . With cooperatively synergistic effects of and , SPDP-Net achieves the best performance in both multi-granular activity recognition and social group detection.
A.5 Balancing Hyper-parameters
In Table 4, we summarize the results of experiments with varying balancing hyper-parameters of the individual action loss , the relation loss , and the auxiliary loss functions. When and are increased, we observe that a slight improvement in IAR and GBAR, but a significant performance decrease in SGAR. Conversely, when is increased, the overall performance is decreased by 1.6%. When the proportions of , , and are equal, SPDP-Net achieves the best performance in social group detection performance and overall multi-granular activity recognition ().
B Additional Visualization
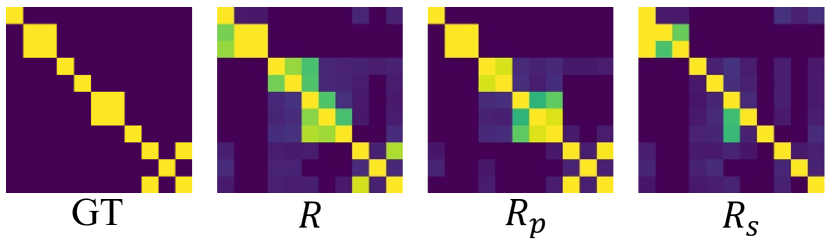
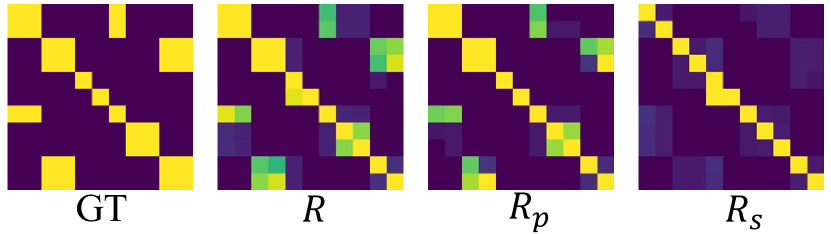
B.1 Relation Matrix
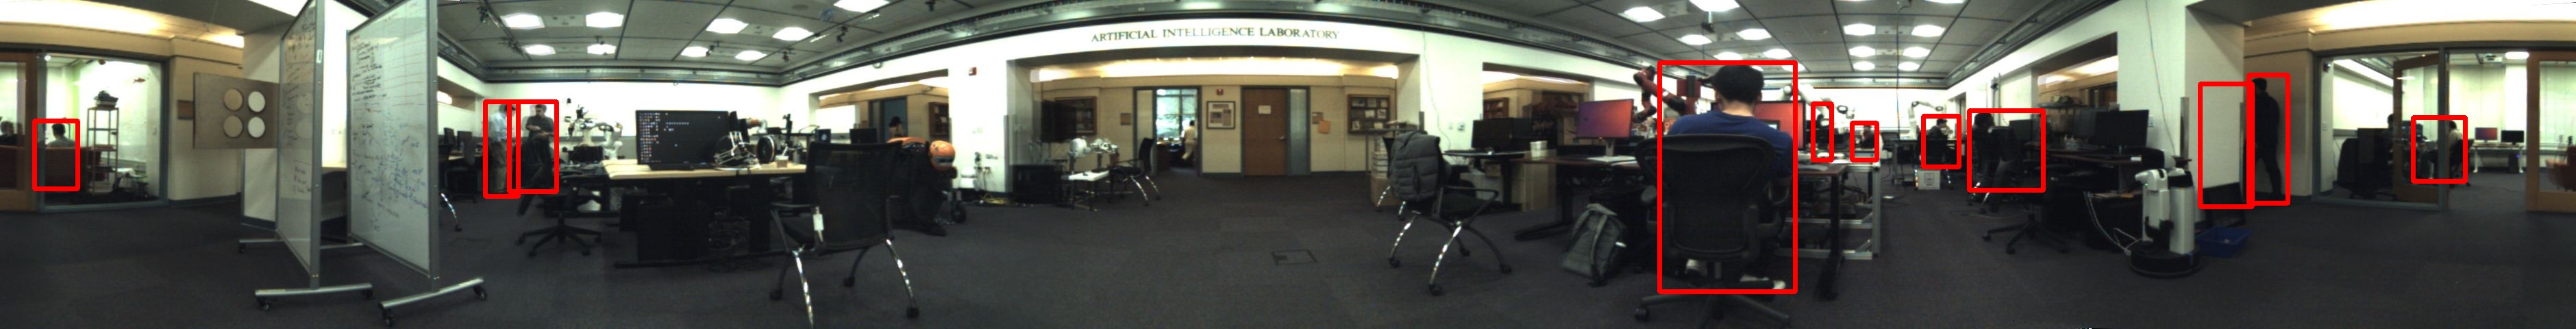
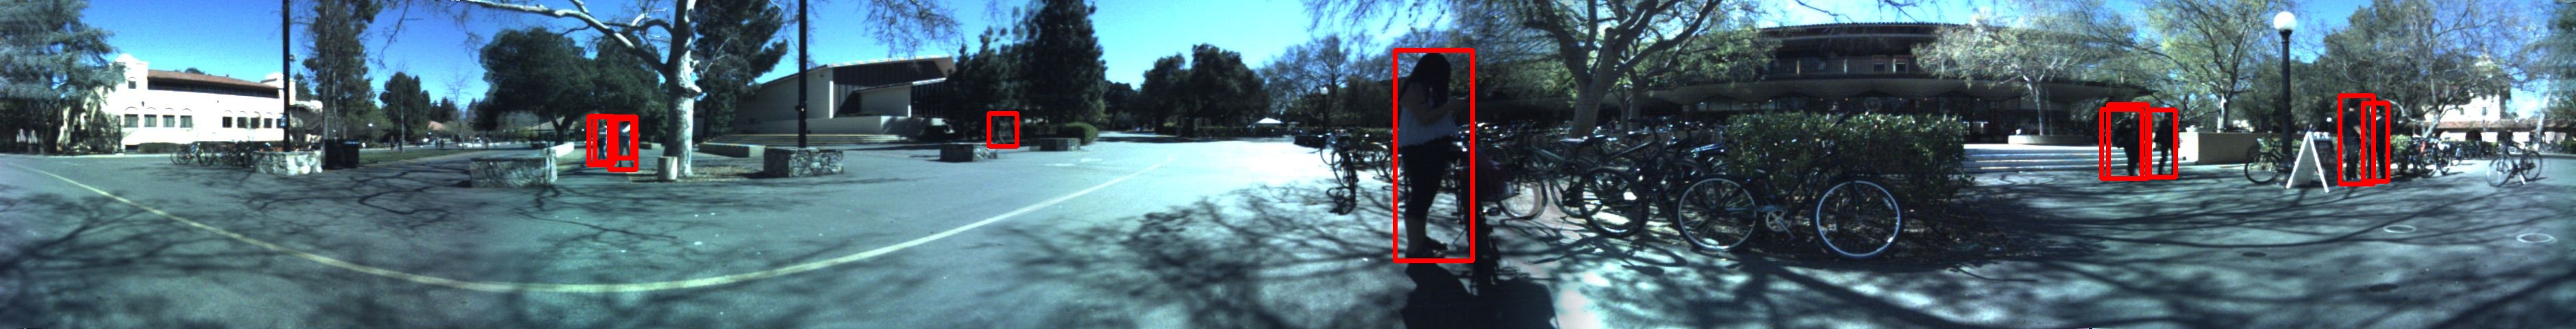
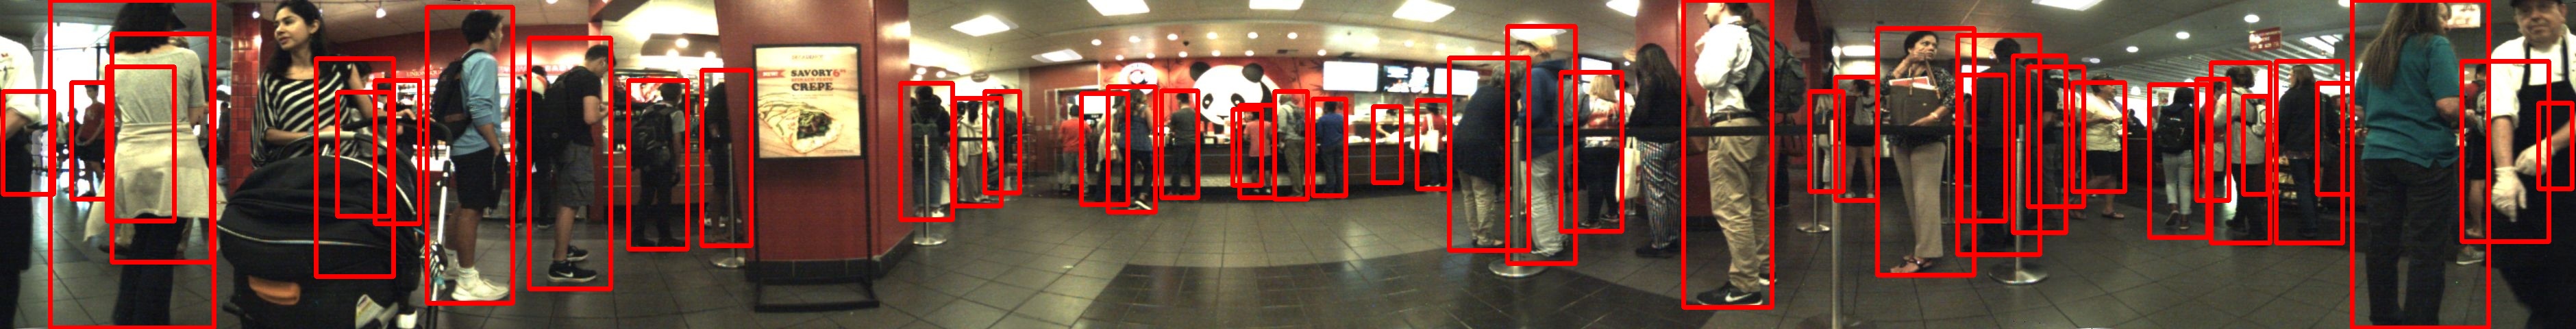
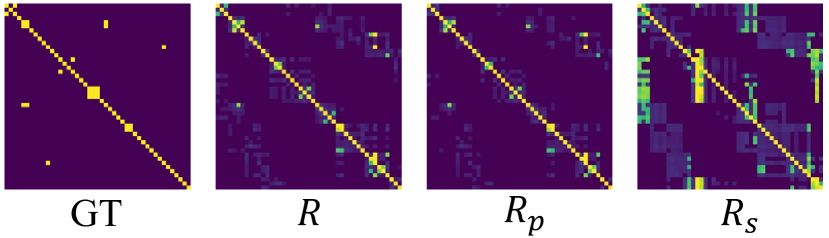
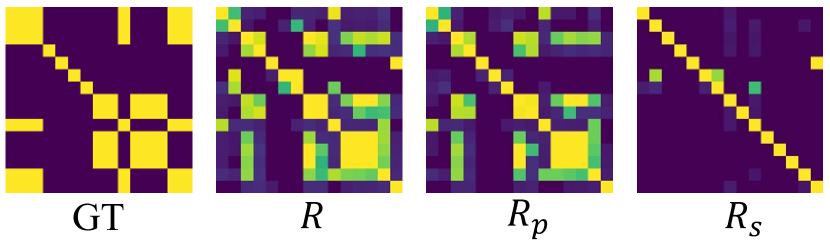
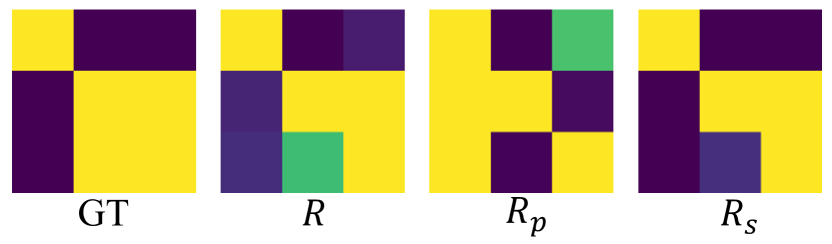
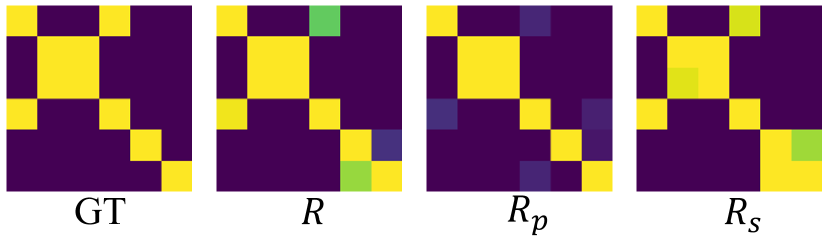
Figure 2 shows more visual comparisons between the ground truth and predicted social relation matrix with the proximity relation matrix and the similarity matrix . Those matrices have 1 for individuals belonging to the same social group and 0 for otherwise. We note that closely corresponds to the ground-truth social relation compared to (see Fig. 2(a), 2(b), 2(c), and 2(d)). In contrast, in panoramic scenes with relatively larger bounding boxes and fewer people, we observe that is effective (see Fig. 2(e) and 2(f)).
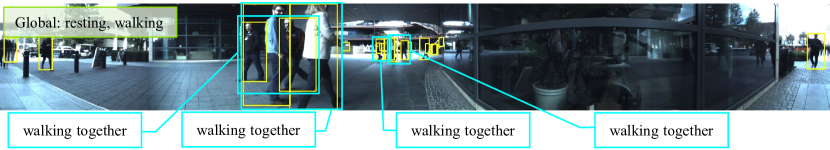
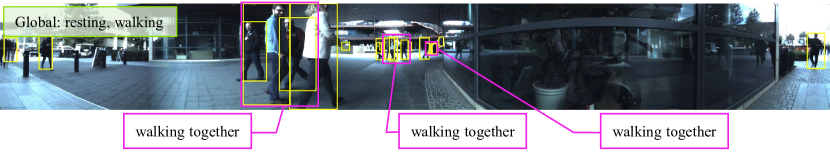
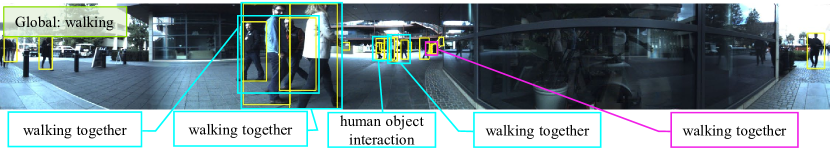
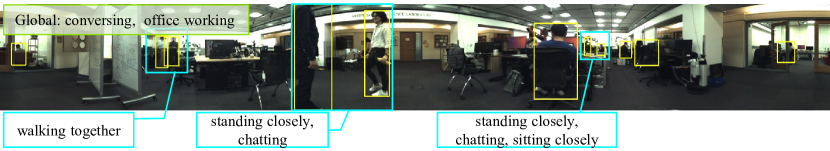
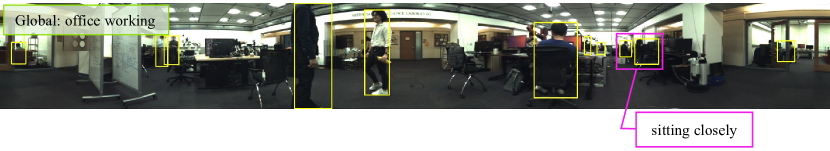
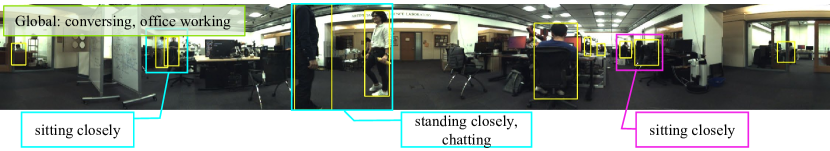
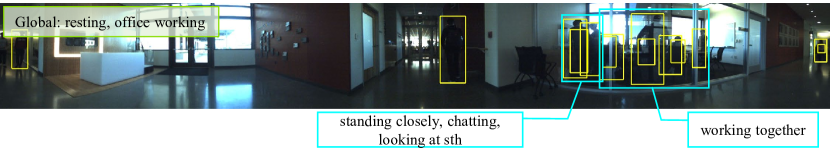
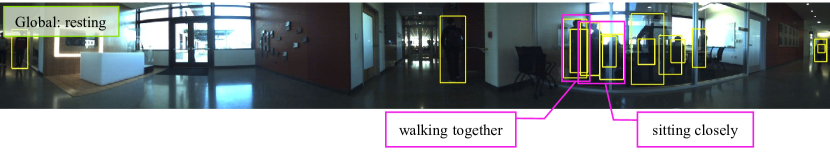
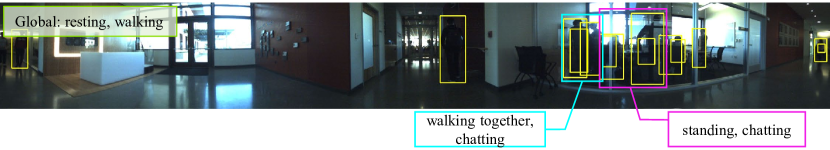
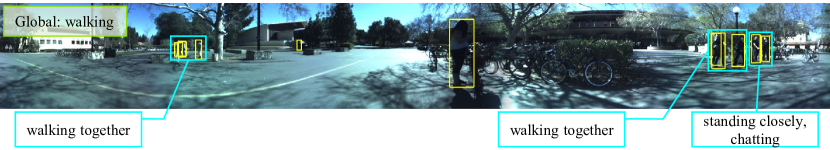
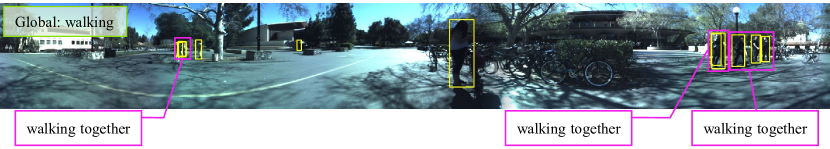
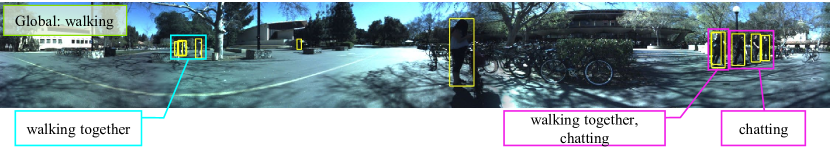
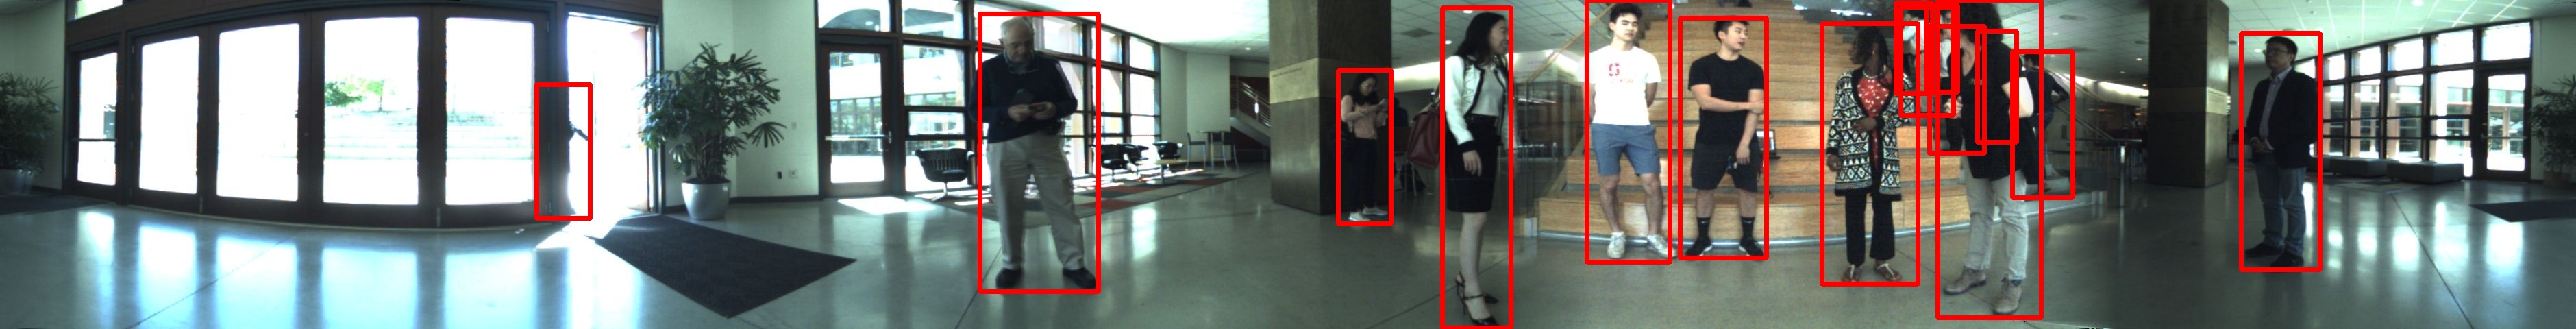
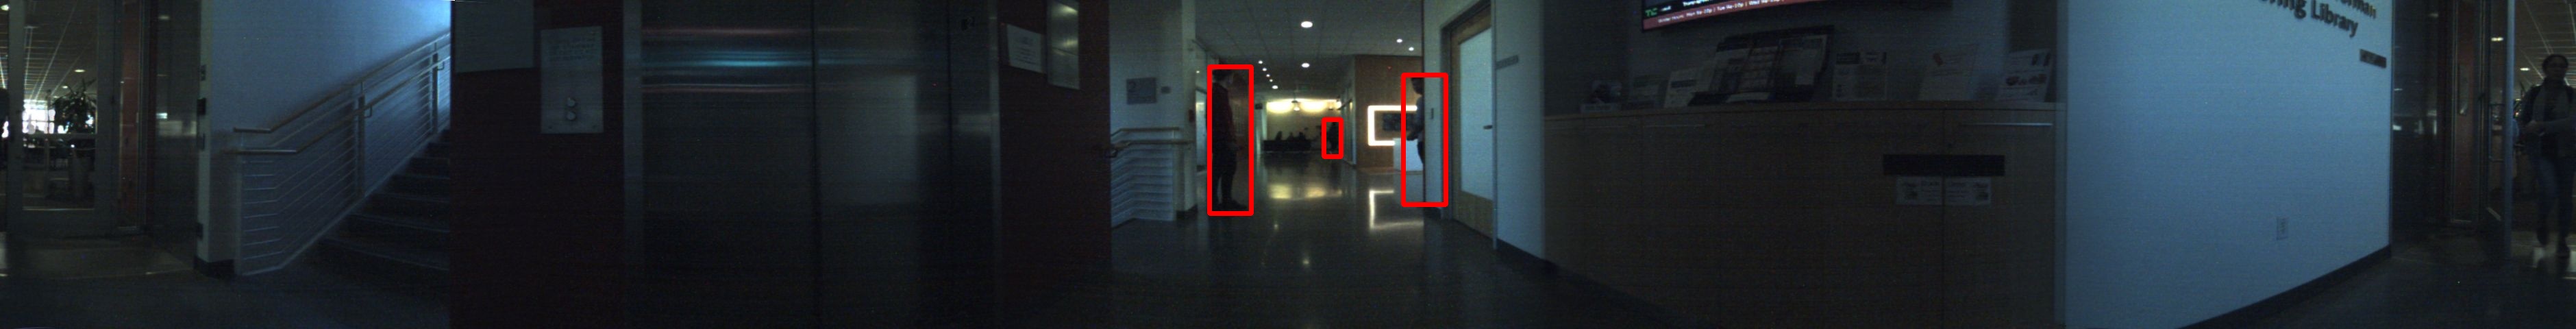
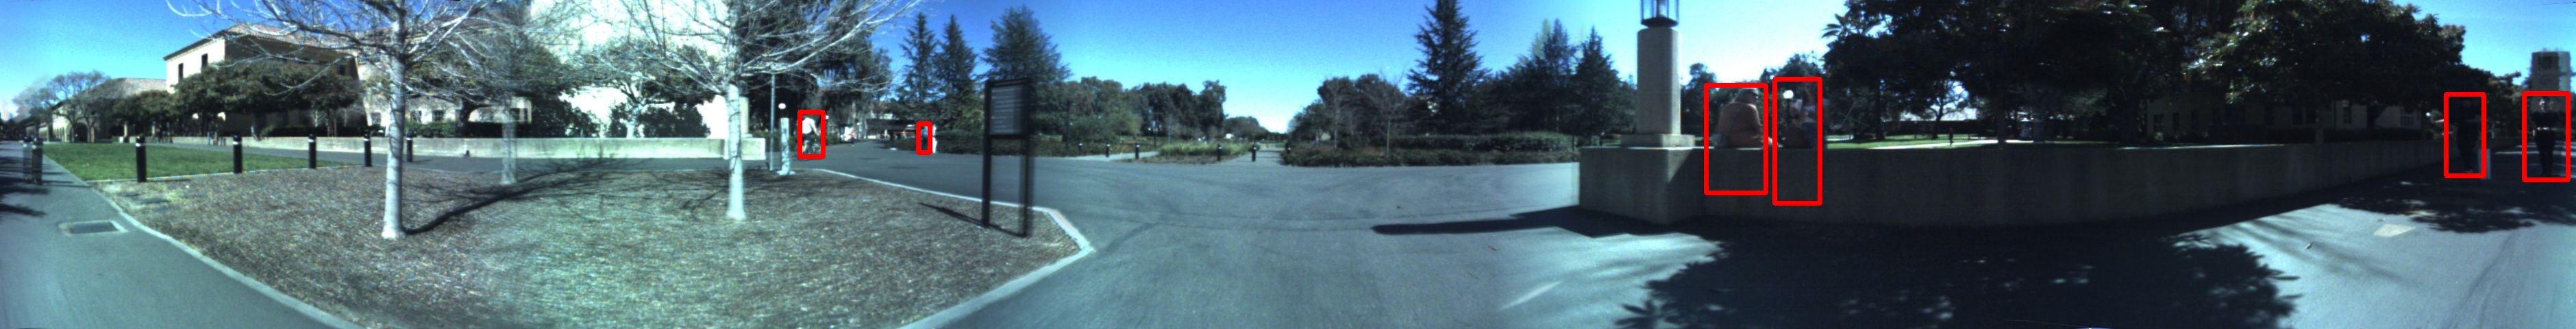
B.2 Prediction Results
C Limitation and Future Work.
There are still unresolved problems. In Table 6 in the manuscript, we observed that the performance of social group activity detection is enhanced when using the ground-truth number of social groups. To address this, it is necessary to develop strategies to adjust to varying group densities and complexities. Moreover, real-world datasets, such as JRDB-PAR [par_eccv], exhibit significant biases in their class distributions. Overcoming these biases is crucial for improving the robustness and generalization of the proposed method. We leave this intriguing challenge to future work.