The haloes that reionized the Universe
Abstract
We study the reionization of the Universe due to haloes that host galaxies undergoing bursts of star formation. By comparing the recent results from the James Webb Space Telescope (JWST) with the cosmological hydrodynamical simulation eagle at , we find that bursty galaxies have specific star formation rate, sSFR Myr-1, and magnitude, . Most of them reside in haloes of mass M⊙ and some in more massive haloes. We then construct the models of escape fraction and find that a skewed Gaussian function with a flat tail towards the high mass end best describes the mean dependence of escape fraction on halo mass, considering the haloes hosting bursty galaxies as the primary drivers of reionization. We implement the models of escape fraction in the code 21cmfast to study the progress of reionization and derive the evolution of the mean ionized fraction that agrees well with observations. We also calculate the brightness temperature, spin temperature, and kinetic temperature and further study the spatial fluctuations in these quantities to gain insights into the progress of reionization. We compute the 21 cm power spectrum and predict a peak in power at MHz corresponding to redshift, , that is testable by the upcoming Square Kilometre Array (SKA). Our findings suggest that the Universe was reionized by the haloes of M⊙, with haloes more massive than that also provided an essential contribution.
1 Introduction
The epoch of reionization (EoR) is a period in the history of the Universe when the first stars and galaxies emerged and provided the ionizing photons to reionize the neutral intergalactic medium (IGM) [1, 2]. Earlier studies based on the absorption troughs in quasar spectra indicated that reionization occurred at [3, 4, 5]. The exact timing of reionization was further narrowed down with the space-based measurements of the electron-scattering optical depth by the Planck satellite. The latest measurements from Planck indicate that the Universe was 50% ionized at redshift, [6]. Apart from the timing of reionization, identifying the sources that reionized the Universe is a major focus of research [7, 8, 9, 10, 11, 12, 13, 14]. Various studies indicate that the galaxies within the first haloes led the process of reionization [15, 16, 17, 18]. However, haloes have a range of mass, and galaxies within them also exhibit a huge diversity [19, 20].
The properties of galaxies that reionized the Universe and their host haloes are under investigation [21, 22, 23, 24, 25, 26, 27, 28]. Recent theoretical work [8, 9, 29, 30], and the latest observation by the James Webb Space Telescope (JWST) has made significant progress in revealing the galaxies that reionized the Universe [31, 25, 24, 32]. However, there is still ambiguity about the dark matter haloes that host such galaxies. Galaxies develop within the potential wells of dark matter haloes via gas cooling that leads to star formation [17, 18, 33]. The ionizing photons that drive reionization are produced by the massive stars formed during the initial bursts of star formation [18, 8, 9].
The models of reionization depend on a critical parameter known as the escape fraction [34, 25, 8, 35], which connects the number of ionizing photons produced by massive stars in a galaxy to the number that actually leak out of the galaxy [34, 36, 37, 38, 39, 40, 41]. The galaxies are complex systems. They have a reservoir of gas that fuels star formation and depletes as a result but then is replenished through cosmological infall [42, 43, 44]. A disc develops after a sufficiently long period, as is evident for galaxies at low redshifts. Almost all the photons are absorbed in such an optically thick system, indicating a negligible escape fraction that agrees with most of the attempted direct measurements of escape fraction, which have yielded null results [45, 46, 47, 48, 49, 50, 51, 52]. However, recent detection of high escape fraction in the local Universe [53, 32, 54] hints that the escape fraction is tied unsurprisingly with the nature of star formation in a galaxy [8, 9, 35].
The escape fraction is linked with the intensity of star formation and subsequent feedback by stars and supernovae [55, 56, 57]. Also, the pictures of galaxies having homogeneous discs [34] with uniform densities may be too simplistic, specifically for the galaxies at high redshift [58, 59, 25]. The cosmological simulations of galaxy formation [e.g. 60], the large-scale surveys such as the SDSS [19], and more recent breakthrough observations by the James Webb Space Telescope (JWST) [61, 62, 25]; all indicate that early galaxies were much more violent, with a significantly bursty star formation. The closest counterparts of high redshift galaxies are likely the extremely active nearby starbursts undergoing violent episodes of star formation [63, 64, 65]. The extreme starburst activity is an exception at low redshift, whereas it is a norm at high redshift prior to reionization [19, 8, 9, 66, 31, 35]. A burst of star formation, specifically in a compact galaxy at high redshift, disrupts the distribution of gas and opens up the belly of the galaxy through which almost all of the ionizing photons can leak out, and the escape fraction at that moment can easily be more than 10% [67, 53, 68].
Theoretical studies of reionization often deployed a constant escape fraction for all the galaxies [e.g. 38], or more recently, an escape fraction that decreases with increasing halo mass [69]. Naturally, the majority of the reionizing photons then would be from the low mass ‘faint’ galaxies, leading to the traditional viewpoint that faint galaxies reionized the Universe [70, 28, 21, 26, 27]. However, recent studies challenged this viewpoint through attempts at more astrophysics-oriented modelling of escape fraction by including the consequences of bursty behaviour of high redshift galaxies [8, 9]. These studies modelled the escape fraction of pre-reionization galaxies by utilising the star formation rate surface density as a criterion for bursts that puncture the gas distribution in galaxies. The outcome was intriguing, that the majority of the ionizing photons were produced by the relatively brighter galaxies rather than the faintest ones [8, 61, 31, 35]. This result is sometimes interpreted to conclude that brighter galaxies are a handful in number on the presumption that they only reside in the most massive haloes.
For the galaxies at low redshifts, it is known that statistically, high brightness or SFR indicates a galaxy with a high stellar mass that likely resides in a massive halo [71, 72, 73]; this is how after all the main-sequence of galaxies is established [71, 72, 73, 74]. However, sufficient time is needed for the emergence of a main sequence and for a correlation between the halo mass, stellar mass, and SFR to develop [74, 73]. The scatter in SFR and hence in UV magnitude increases towards the low-mass end, and it also increases with redshift. Therefore, not only do the low-mass haloes host faint galaxies, but they also host relatively brighter galaxies with magnitude, , as indicated by the recent detections of many low-mass yet brighter galaxies by the JWST [61, 23, 25, 31]. The instantaneous SFR in low-mass galaxies is not monotonous, but it fluctuates with intense bursts followed by a quiescent period of almost zero SFR [75, 56, 76, 66, 74, 77, 78, 79]. Therefore, it is unlikely that the early galaxies would precisely follow the expected Halo mass, stellar mass, and SFR correlations. Even if they show signs of such correlations, still the scatter would be the prominent feature. This crucial point is often missed in the semi-analytical models [38, 69] since one has to rely on the correlation between the halo mass, stellar mass, and the SFR to estimate the photon budget.
In this paper, we first focus on identifying the haloes that host bursty galaxies by studying the properties of galaxies detected recently by the JWST and comparing them with the early galaxies and haloes in the cosmological hydrodynamical simulation eagle [60]. We then use our findings to model the progress of reionization using the semi-numeric code 21cmfast [38, 69]. We study the progress of reionization if the Universe is reionized by the haloes that host the bursty galaxies, and we investigate in-depth the corresponding evolutions of mean neutral hydrogen, mean brightness temperature, the patchiness of these quantities, and the power spectrum at the redshifted 21 cm wavelength. Our main objective is to find the haloes that reionized the Universe (HRUs).
The paper is organized as follows. Section 2 presents our findings on the star formation in early galaxies and their host haloes based on the recent results from the JWST and cosmological simulation eagle. Section 3 describes our models that utilize specific haloes as drivers of reionization and presents our main results from 21cmfast in subsequent subsections. We discuss and summarize our findings in section 4.
2 Star formation in pre-reionization haloes
2.1 Scatter in the SFR and at the low mass end: dwarfs aren’t always faint
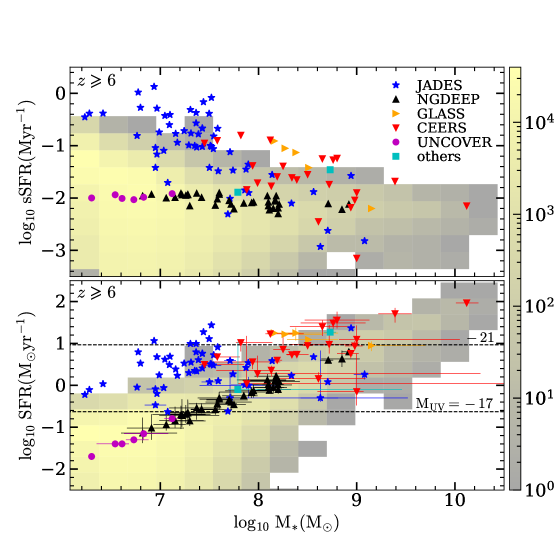
The recent observations by the JWST Advanced Deep Extragalactic Survey (JADES) report galaxies with signatures of bursty star formation [31]. The JADES galaxies have UV magnitudes roughly between and , and a majority of them have low stellar masses in the range to M⊙. Another JWST observational survey, UNCOVER, reports ‘faint’ low-mass galaxies with and claims such galaxies provided sufficient ionizing emissivity to reionize the Universe [28]. The two sets of observations differ in the brightness of galaxies despite both corresponding to the low mass end.
Figure 1 lower panel shows the SFR for the galaxies detected by various JWST programs [61, 80, 81, 82, 31, 24, 83, 28, 84, 85, 86, 87, 88, 89, 90, 91, 92, 93, 86]. For comparison, the SFRs for the galaxies in the cosmological simulation eagle are shown as a 2D histogram in the background. The most massive galaxies with stellar masses above M⊙ have highest SFRs ( M⊙yr-1), and UV magnitudes . On the other hand, at the low-mass end, there is a degeneracy in the SFR (and UV magnitudes). The data points corresponding to galaxies from NGDEEP [83], and the faint galaxies detected by [28] follow an SFR-M⋆ correlation indicating a main sequence. However, the galaxies from JADES [61, 31, 80, 81, 82] exhibit higher SFRs. Most of the JADES galaxies are brighter with in the range to . These galaxies are undergoing bursts as claimed by [31], which is the reason for their relatively high brightness despite most of them having low stellar mass, same as [28].
The picture is even clearer in the upper panel of Fig. 1. It shows the specific star formation rate, sSFR, for the JWST galaxies compared with the eagle simulation. The horizontal main sequence is apparent both in the observations and eagle. The galaxies from UNCOVER [28] follow the main sequence, and they lie at the faint low-mass tail. However, there is a large scatter at the low-mass end in the data, as the bursty galaxies from JADES occupy the upper left quadrant with their above-normal sSFR Myr-1. Some galaxies from CEERS [24, 84, 85, 86, 87, 88, 89, 90, 91, 92] and GLASS [84] with a stellar mass between and M⊙, and , also exhibit above-normal sSFRs.
Thus, it is evident that the low-mass galaxies are not always faint. During bursty episodes, they are brighter. The star formation begins in low mass haloes, and initially, the SFR fluctuates between peaks and troughs [66, 76, 78]. The Universe was likely reionized by the bursty brighter galaxies with sSFR Myr-1 and ; already being detected by the JWST [61, 31]. Indeed, in an earlier study [8], we predicted that almost all () ionizing photons required for reionization were provided by the ‘brighter’ galaxies with magnitudes , and JWST would be able to detect them.
2.2 The halo mass corresponding to the bursty galaxies with highest sSFR
Determination of halo mass observationally for high- galaxies is challenging. The existing stellar-to-halo mass relation is also uncertain at high redshift. The cosmological N-body simulations of galaxy formation are a valuable tool to relate the properties of galaxies with dark matter haloes, as the dark matter is the basic fabric of these simulations [94, 95, 60]. The eagle [60] simulation models the formation of galaxies within dark matter haloes and reproduces their properties across cosmic time. eagle is based on a modified version of the smooth particle hydrodynamic (SPH) code gadget 3 with improvements in time-stepping and subgrid physics [96, 97]. The feedback is implemented through an updated energy-based scheme that depends on gas density and metallicity. The usual inefficiency due to resolution in SPH schemes is compensated for by an additional injection of energy at the SPH particle level [98, 99, 97]. The star formation is incorporated using a version of the Kennicut-Schmidt law [100], in which the SFR for a star particle is determined from a relation between the gas surface density and the pressure governed by an equation of state [101]. Accordingly, the gas particle is converted to a collisionless star particle stochastically in time. Herein we use the eagle run L100N1504 with dark matter particle mass M⊙, and the gas-particle mass M⊙. The simulation reproduces the cosmic star formation history, the stellar-to-halo mass relation, and the physical properties of galaxies in detail [60], and it serves as a benchmark for galaxy formation and evolution.
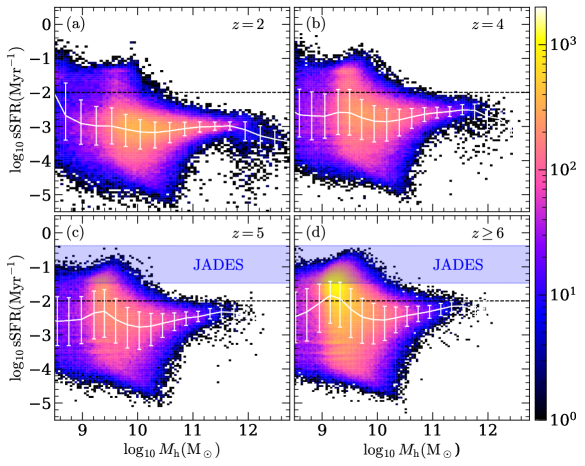
Figure 2 shows the specific star formation rate, sSFR, plotted with halo mass, , for the galaxies in the eagle simulation. At low redshift (panel a), the main feature is that most of the galaxies lie around a horizontal ridge, known as the main sequence of galaxies in the literature [71]. However, there is a striking difference at high redshift (), leading to a higher scatter and a peak in median sSFR towards the low mass end (panels c and d). Therefore, at high redshift, a significant number of galaxies exhibit extreme sSFRs ( Myr-1) both in eagle and in the real Universe (Fig. 2 and 1), and the distribution of peaks at M⊙. The same set of galaxies in Fig. 1 corresponds to a slightly wider range of stellar masses, to M⊙, as the stellar mass is sensitive to the nature of star formation.
The above normal sSFR at the low mass end reflects the violent bursty star formation. The bursts likely occur when an adequate reservoir of gas builds up. For infant galaxies, the threshold reservoir of gas for initial bursts is likely to be achieved for a specific halo mass since, before the beginning of star formation, the net baryonic accretion is tightly correlated with the dark matter accretion. The initial bursts are unique as the stellar mass is negligible; therefore, the values of sSFR are very high.
For the episodic star formation at the beginning in a newly formed galaxy [8, 77, 66], an analogy can be drawn with an engine. In the beginning, the engine cranks and has episodic breathing and puffing behaviour, and subsequently, it settles into a smooth operation. Similarly, the galaxies are initially compact and dense, waiting for star formation to ensue. The initial burst, as it occurs, is extreme for a small galaxy, and they can clear almost all of the gas, causing a quenching of the SFR. A peak in SFR followed by a rapid decay occurs repeatedly but with less and less intensity in sSFR as time progresses [78, 74, 31]. Eventually, the SFR settles into a monotonous evolution as the galaxy grows in age, mass, and size [74].
Simulations such as eagle successfully reproduce galaxies’ properties in detail. However, they may have limitations due to the resolution. The resolution may influence features such as the scatter and the peak in median sSFR at the low mass end. However, the bursty behavior is a universal feature for the newly formed galaxies in many simulations of galaxy formation [56, 102, 79, 77], and JWST also finds the same features, indicating them to be a characteristic of the star formation in the first galaxies in the real Universe [31].
The bursts, specifically the extreme ones, have significant consequences for reionization. The ionizing photons in galaxies are produced by massive stars that are short-lived ( Myr). In galaxies like the Milky Way, most ionizing photons currently produced are absorbed within a few parsecs in the dense interstellar medium. The computational studies to model the leakage of photons from discs of galaxies such as the Milky Way yield negligible escape fraction in agreement with the observational findings [34]. The trend continues even to redshifts up to where the attempts to measure the Lyman continuum from the Lyman break galaxies have returned negligible escape fractions [51, 48]. However, recently, Lyman continuum leakage with high escape fractions has been detected in starburst galaxies with high and sSFR [67, 53, 35]. Although such measurements are still a minority, there is little doubt that galaxies can have porous channels due to violent starbursts through which ionizing photons escape [58, 8, 35].
To conclude this section, the bursty galaxies have extreme sSFR Myr-1, and they are typically brighter than (Fig. 1). Comparison of the pre-reionization bursty galaxies recently detected by JADES [31] with eagle (lower panels of Fig. 2), shows that the distribution of the halo mass for bursty galaxies peaks at M⊙. These galaxies are the prime candidates to be the significant Lyman-continuum leakers [61, 24]. Whether the photons supplied by haloes in a narrow mass range are sufficient to reionize the Universe needs investigation. Moreover, if a subset of halo mass reionized the Universe, there may be intriguing observational consequences, specifically on the 21 cm power spectrum. We study these aspects in the following section.
3 Reionization of the Universe and the power spectra of neutral hydrogen
In this section, our objective is to study the progress of reionization driven by specific haloes in a narrow range of halo-mass. The main ingredient for reionization is the number of Lyman-continuum photons available in the intergalactic medium (IGM). The photons are generated by massive stars in galaxies that form within the first dark matter haloes [103]. The number of dark matter haloes of a specific mass (i.e. the halo mass function) can be obtained by the semi-analytic methods such as the extended Press-Schechter formalism [104], or from the full cosmological simulations such as millenium [94], illustris [95] or eagle [60]. The crucial step is then relating a star formation rate to a halo that ideally reproduces the luminosity functions of high-redshift galaxies from observations. Once an SFR is available corresponding to a halo, one can use a model for the fraction of photons that escape into the IGM to finally solve the radiative transfer problem in the evolving IGM to reionize the Universe and keep it ionized subsequently.
Various earlier studies have undertaken the task described above [69, 105, 38, 106, 107], with each method having its merit or demerit. In this paper, to study reionization and to get the statistical information of diminishing neutral hydrogen islands, we use the popular semi-analytic code 21cmfast [38, 69], that solves the radiative transfer problem in an evolving Universe. It first generates the statistical set of haloes using the halo mass function, an outcome of the initial density perturbation field having a Harrisson-Zeldovich power spectrum [108, 109]. Each halo is then assigned a stellar mass and an SFR as per a physical model with constraints such as the observed luminosity functions of galaxies and the observed evolution of the cosmic SFR. Finally, for each halo with a given SFR, a constant number that gives the photons per stellar baryon is used. The photon production from each halo is further multiplied by the crucial parameter of escape fraction, that may or may not depend on the halo mass [38].
3.1 Models of escape fraction as a function of halo mass
In 21cmfast [38, 69], the number of ionizing photons per baryon produced inside a region is given by,
| (3.1) |
where is the mean baryon density, is the stellar mass in a halo of mass , is the escape fraction of ionizing photons from a halo, is the duty cycle which is the fraction of the haloes that host stars, is the number of ionizing photons per stellar baryon which in 21cmfast is set to a fiducial value of 5000 [69].
It is clear that the photon budget is crucially dependent on the astrophysical parameters and , which can be further combined into a definition of the ionizing efficiency, [69], where . The earlier studies based on 21cmfast used constant values of and , hence a constant [110, 111, 112, 38]. However, a better model of stellar to halo mass ratio can be used with improved luminosity functions from the Hubble deep field (HDF) and now from JWST. Furthermore, the escape fraction too is not necessarily constant. Recent studies debate whether it decreases or increases with the halo mass [110, 113, 41]. Nonetheless, it is certain that the escape fraction depends on the halo mass. Recent 21cmfast study [69] indeed implements halo dependent motivated by the high redshift luminosity functions from HDF [114], and they also implement a halo depended . While the is considered to be increasing with the halo mass with a power-law slope , the escape fraction is considered to be decreasing with the same slope so that the ionizing efficiency is effectively constant.
Recent theoretical work and latest observations on escape fraction [8, 9, 53, 68, 115], indicate that is tied to the surface density of star formation, , which is an indicator of outflows that can open-up channels through which photons can escape [8, 9, 35]. Therefore, is likely high in compact galaxies undergoing violent episodes of star formation, which is a norm at high redshift [35]. The expected and observed dependence of the escape fraction on the properties of galaxies such as the and [35] can be used to implement the escape fraction in models of reionization [8, 9, 116].
A positive correlation between sSFR (or ) and halo mass would indicate increasing with halo mass, and a similar trait for , in contrast to [69], which was exploited in a study by [8]. However, the smooth trends between SFR and halo mass might not hold for the early infant galaxies, as discussed in the previous section (see Fig. 2). Nonetheless, the escape fraction would be high for galaxies undergoing violent bursts of star formation, and Fig. 2 shows that such galaxies reside in a narrow range of halo mass at the low-mass end.
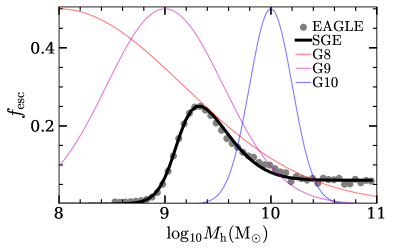
To study reionization due to the haloes of specific halo mass, we create a model of the escape fraction as a function of the halo mass, by using the galaxies in the eagle simulation with the following criteria. If a halo of mass in a bin of halo mass (in Fig. 2) satisfy Myr-1, we assign an escape fraction value of , and otherwise; and then we take a mass weighted mean of escape fractions of all the haloes in the bin of halo mass, to get, . The escape fraction corresponding to each bin of halo mass thus obtained is shown in Fig. 3 with gray-filled circles, where the constant is set such that the peak value of curve as a function of is to finish the reionization at when implemented in 21cmfast. We fit the data points with a skewed Gaussian function with a flat tail, written as,
| (3.2) |
where, , , , and . We name this skewed Gaussian model, SGE, shown as a solid black curve in Fig. 3. The flat tail at the high mass end is not truncated. The value of the escape fraction at the high mass end is approximately . We also have a variation of SGE, that we name SGET in which the flat tail is truncated at a halo mass of M⊙. The for SGET is , slightly different from SGE to finish reionization at the same redshift, .
To better understand the process of reionization by a subset of haloes and to gain insight into the mechanism of reionization by our models SGE and SGET, we create three additional models of escape fraction using the following simple Gaussian function as theoretical test cases,
| (3.3) |
where M⊙ is the mass of the specific haloes for which the escape fraction is maximum, and is the width of the Gaussian distribution. The Gaussian models can have different combinations of , and . However, not all such models for any random combinations of these parameters can finish reionization at redshift . Therefore, we fix and run several simulations for a range of and values on boxes, computed on grid till redshift 6. Then, we select three models calibrated to complete the reionization at and name them corresponding to their specific values. The models are named as G8, G9 and G10 corresponding to and . The width for these models are , , and , shown as red, magenta, and blue curves in Fig. 3 respectively.
For all the simulations throughout this work, we use the standard parameters for 21cmfast from the fiducial model of [69], except the escape fraction, for which we implement our models of escape fraction described above; the skewed-Gaussian models SGE and SGET (Eq. 3.2) and gaussian models G8, G9, G10 (Eq.3.3). We have also enabled inhomogeneous re-combinations in the simulations.
The ionizing efficiency is, , where is given by Eq.3.2 for the eagle based skewed Gaussian model and by Eq.3.3 for the simple Gaussian models. The ionizing efficiency can be written as
| (3.4) |
where normalization value is the ratio of stellar to halo mass for haloes of M⊙. In the above expression, we have used the same as in 21cmfast; however, we use the new model for (Eq.3.2), which is motivated by the bursty star formation in early galaxies in the eagle simulation [60] and the JWST [117]. However, due to bursty above-average star formation, the is also likely to be higher than the default implementation in 21cmfast, which can be improved by either implementing a realistic but complex for burstiness, or by artificially boosting to a value that would yield the same to complete the reionization at . When simulating with 21cmfast in this paper, we keep the same as the standard 21cmfast, and only vary . Therefore, our values of are artificially high to compensate for a lower in 21cmfast compared to eagle. The actual is likely higher due to the bursty nature of infant galaxies in the real Universe, and the corresponding actual can be interpreted to be even lower than what we use for our models in this paper.
3.2 Evolution of the mean neutral hydrogen fraction
We simulate the progress of reionization for our models of escape fraction, SGE, SGET, G8, G9, and G10, using 21cmfast in a box with a resolution of , up to redshift 6. All our models and simulations are calibrated to finish the reionization at the same redshift, . In Fig. 4, we compare the evolution of mean neutral fraction, , for our models with the observational constraints [6, 118, 119, 120, 121, 122, 123, 124, 125, 126, 127, 128, 129, 130, 131, 15, 132, 133, 134, 135, 136, 137, 138, 139, 140, 141, 142].
The models SGE (solid black curve) and SGET (dashed black curve) agree well with the data, and reionization in them occurs late but rapidly compared to the models G8, G9, and G10. The earlier studies by [116, 143, 70] found the progress of reionization less steep than our models SGE and SGET; however, a steeper progress is favoured given the current observational data (see Fig. 4 and [24]).
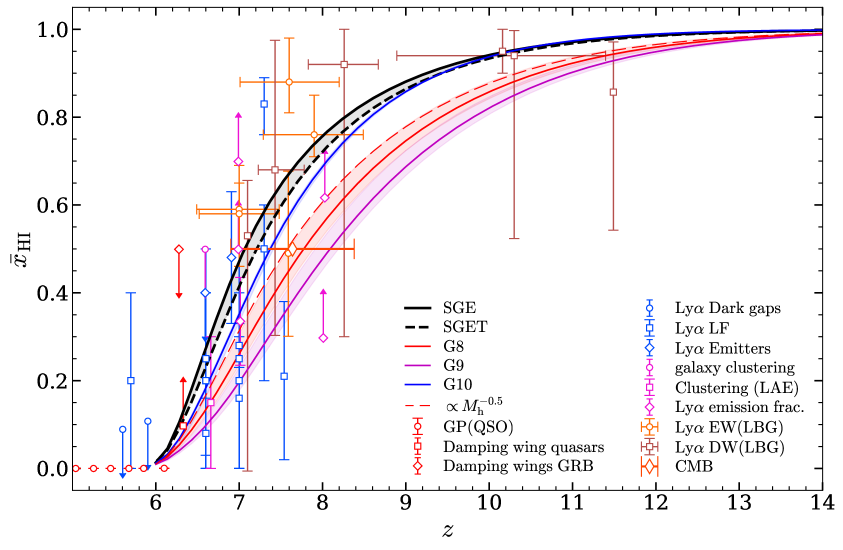
Out of the Gaussian models, the reionization is rapid for the G10 model (blue curve), similar to the SGE model, as it begins late but still finishes at , in contrast to G9 and G8. However, in the previous section, our results from a comaprison of recent JADES observations with the eagle simulation (Fig. 2) identified the haloes with mass M⊙ as the haloes undergoing violent bursts. In fact, the SGE model has a peak at M⊙ (Fig. 3), and it shows a good agreement with the observational data in Fig. 4, implying that M⊙ haloes are predominantly the haloes that reionized the Universe.
In the next section, we investigate the brightness, spin, and kinetic temperature and study the patchiness of reionization to understand the relative role of and M⊙ haloes in reionization.
3.3 Evolution of the kinetic, spin, and brightness temperature
The differential brightness temperature, , and its evolution contain significant information about the physical processes during reionization and prior to it [144]. The indicates the emission or absorption capability of neutral hydrogen. It can be written in a simple form to understand the physics [22, 145, 144, 7, 38, 103],
| (3.5) |
where is the matter over-density, is the cosmic microwave background (CMB) temperature. is the spin temperature, which can be written as,
| (3.6) |
Here, is the kinetic (gas) temperature, and is the effective temperature (colour) of Ly photons. and are the coupling coefficients for collisions and Ly scattering respectively [146, 147].
After the matter-radiation decoupling, the Universe kept on cooling until the first stars were born, a period known as the ‘dark ages’. Initially, during the dark ages, collisions between the particles coupled to . Subsequently, with the expansion of the Universe, density dropped, collisions were no longer effective, and coupled with . However, when the first sources appear, they produce Ly- photons which lead to the Wouthysen-Field effect [148, 149, 146] that induces the decoupling of from , for a subsequent coupling with again [38, 103].
Between the decoupling of from and its recouping with , , hence the differential brightness temperature is negative and neutral hydrogen is seen in absorption. After the recoupling, as the heating takes over, the signal transitions to emission as increases above [22, 103].
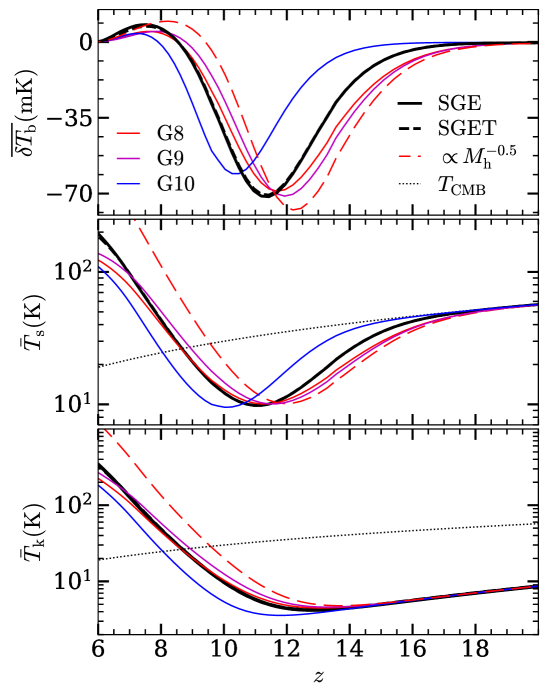
In Fig. 5, we show the evolution of the mean kinetic temperature, (bottom panel), the mean spin temperature (middle panel) and the mean brightness temperature, (top panel), for our models of the escape fraction as a function of the halo mass. The models G8 and G9 show a trend similar to SGE and SGET, and G10 is in contrast. This is surprisingly opposite to the behaviour of G10, G9, and G8 in Fig. 4, in comparison to SGE.
The G10 model has a delayed and relatively poor epoch of heating compared to the other models, as shown by the blue curve in the bottom panel of Fig. 5. The reason is evident in the middle panel as the spin temperature for G10 (blue curve) peels away from the CMB temperature much later in comparison to other models, indicating delayed decoupling of Ly- photons from . Moreover, the kinetic temperature for the G10 model (blue curve in the top panel) begins rising at a later (lower) redshift compared to other models; therefore, the coupling of the spin temperature with the kinetic temperature is also delayed. The overall effect is a shift (as well as reduction) of the absorption trough towards the lower redshift for the G10 model in comparison to other models. To some extent, the same is observed in all of our models compared to the model of [69]. However, there is a greater contrast in the behaviour of the G10 model.
3.4 Patchiness of reionization and 21 cm power spectrum
The exact detail of the contrast in the heating can be investigated by looking at the patchiness of the kinetic temperature and the progress of heating spatially. In model G10 (blue curve), rises late compared to other models, as if the heating is delayed and inefficient. The reason becomes clear when looking at spatial maps (Fig. 6). As G10 has fewer sources (massive haloes), several large portions of IGM are still neutral (dark blue regions in the top right panel). In contrast, in the G9 model (top left panel), there is a lack of large neutral regions as numerous sources of photons (lower mass haloes) lead to high porosity. Therefore, heating is much more effective. The SGE and SGET models are similar to the G9 model in these maps and different from G10 (Fig. 6), which also explains the similar trend in Fig. 5.
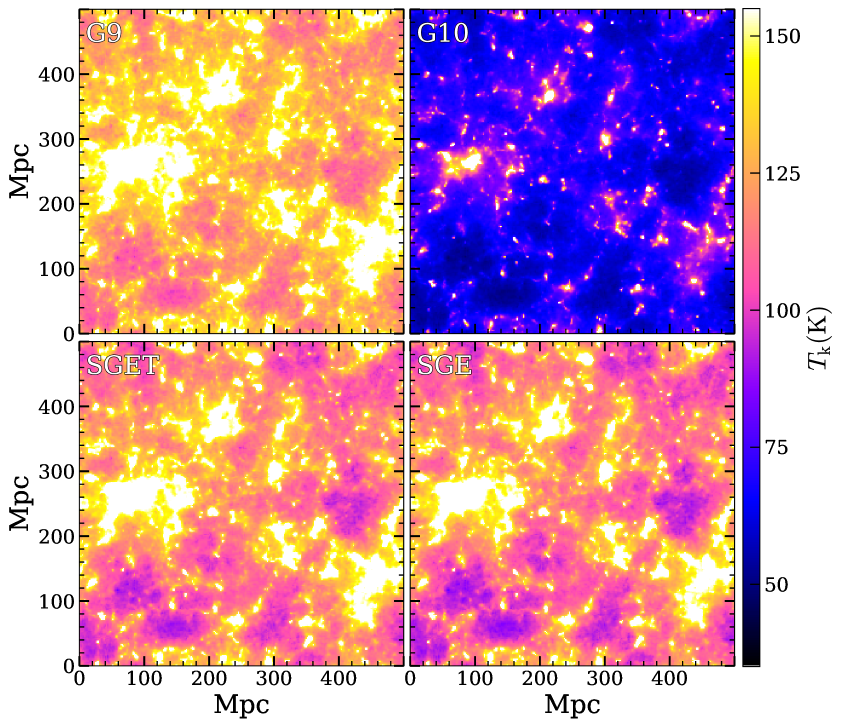
In Fig. 6, there are noticeable differences between SGE and G9 as well in the patchiness of heating (top left and bottom right panels). There was a hint of this even in Fig. 5, where the kinetic temperature of G9 is higher than that of SGE at high redshifts. However, it seems to flatten below redshift , compared to the kinetic temperature for the SGE that keeps rising with decreasing redshift, overtaking the G9 model below redshift 7. The same is reflected in the lower two panels of Fig. 5, where there is a crossover between the G9 and SGE in the trend, and a higher brightness temperature for SGE in comparison to G9.
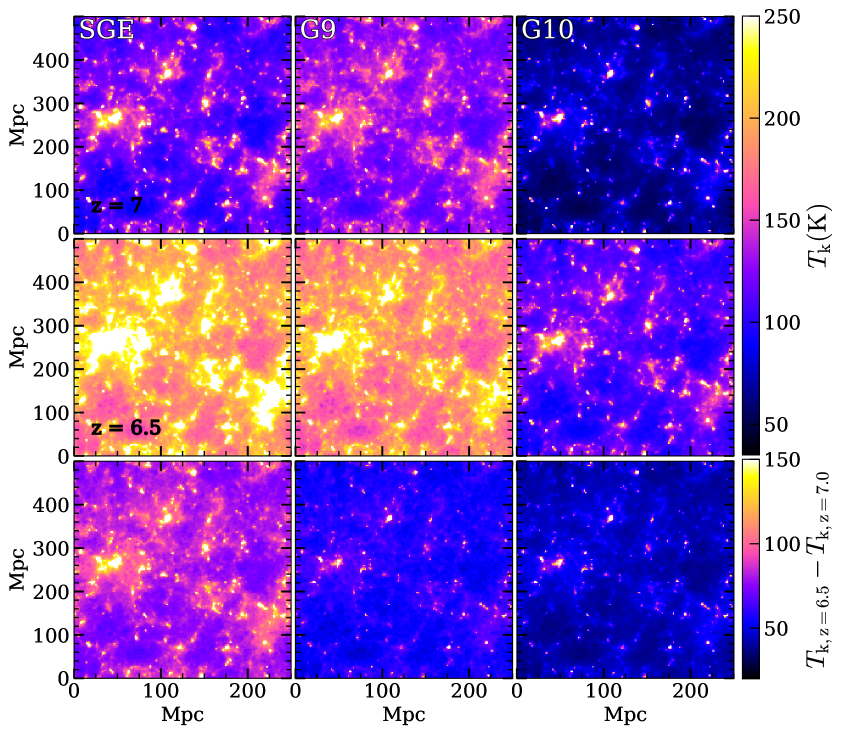
To further investigate the crossover between the SGE and G9, in Fig. 7, we compare the patchiness of kinetic temperature and neutral fraction at redshift 7 and 6.5 for our model SGE, G9, and G10. At redshift 7, SGE has a lower than G9 at almost all spatial scales; however, at redshift 6.5, this reverses. A significantly higher increase in occurs from to in SGE compared to G9 (lower row of plots in Fig. 7).
Why does the kinetic temperature reversal occur between SGE and G9 within this short time (between redshift 7 and 6.5)? A possible hint might be in the progress of reionization in these two models. Both at redshift 7 and 6.5, SGE is more neutral than G9 (Fig.4), but there is a rapid (accelerated) decrease in the neutral hydrogen in SGE within this narrow redshift range.
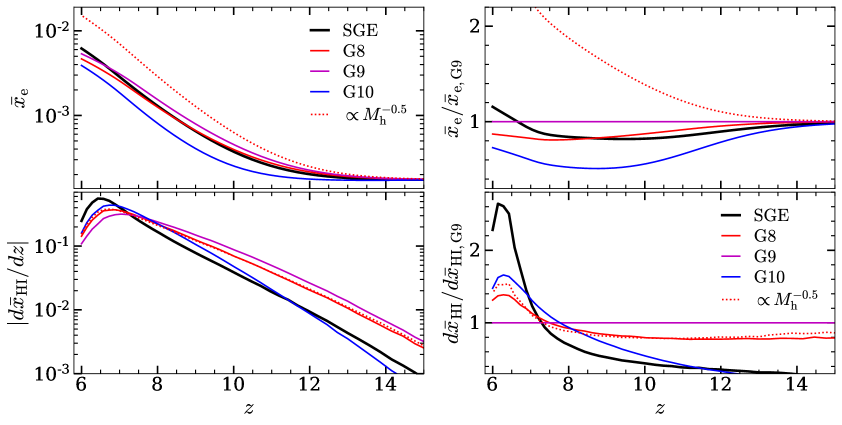
In Fig. 8, we show the trends of mean electron fraction within the neutral regions, , which are correlated with the kinetic temperature [38, 150, 69]. We also show the slope of as a function of redshift. The trends of reflect the behaviour of , as the black curve for SGE overtakes the magenta curve for G9 and keeps rising towards the lower redshifts. However, roughly at the redshift at which the crossover occurs, there is a sharp upturn in the slope of (lower panels in Fig. 8). In fact, in the lower panels, the rise in the black curve corresponding to SGE is staggering, revealing a drastic change in the SGE model between redshift 7 and 6.5, akin to a phase transition. All of a sudden, there is rapid progress in reionization within a short period, and that, added with the porosity of this model, which is at par if not more than G9, compounds X-ray photons, resulting in an increase of electron fraction in neutral regions in the entire box up to the smallest spatial scales. Consequently, the SGE overtakes G9 in the kinetic temperature between and .
We note that there is a rapid change in the slope of reionization even for the G10 model, but firstly, it is less prominent than in the SGE. Secondly, the G10 model does not feature lower mass haloes and has a lower overall porosity.
Thus, the kinetic temperature in our main model SGE is higher than our other models, which leads to a similar, or reasonably better, trend in the spin temperature, causing a prominent peak in the evolution of the brightness temperature.
The kinetic temperature of SGE is only slightly different from that of G8 and G9. Still, it has the most prominent peak in brightness temperature because the reionization occurs late in SGE, and the Universe stays neutral till late (roughly 50% neutral at ) as the Universe heats up. In contrast, in the fiducial model by [69] dominated by lowest mass haloes, the Universe begins to ionize much earlier at higher redshifts; however, this model also achieves a peak in the brightness temperature as the heating peaks earlier when the Universe was still adequately neutral. Hence, our theoretical test models G8 and G9 are similar to [69] in the evolution of ; however, they are similar to SGE in the evolution of the kinetic temperature. Therefore, in G9, the kinetic temperature maximizes later when the Universe has a lower amount of neutral hydrogen, and as a consequence, the peak in the brightness temperature is not prominent.
The model G10 is yet another extreme case in which the Universe is neutral till quite late; however, the heating is delayed so much that it fails to have a prominent peak in the brightness temperature. The model SGE is peculiar in the evolution of such that in it diminishes late but instantaneously at a very rapid rate even compared to G10 (black curve in the lower panels of Fig. 8), which is yet another major reason for its success both in explaining the observational data on as well as in having a delayed but prominent peak in the brightness temperature.
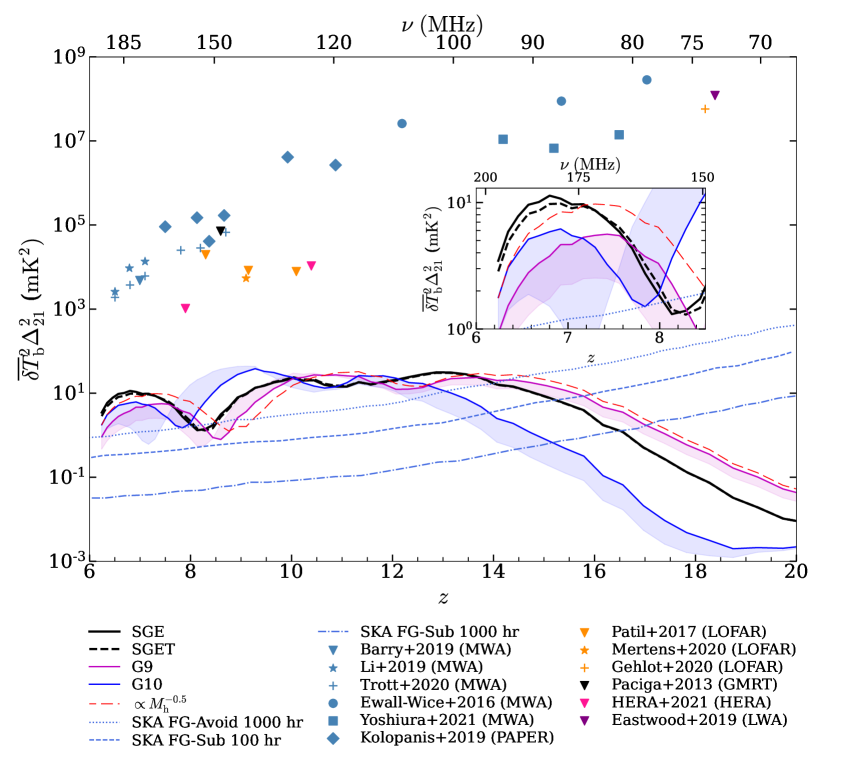
The model SGE has an appropriate combination of the evolution of neutral hydrogen and X-ray heating, such that the evolution of the kinetic temperature resonates with the delayed but rapid reionization, leading to a prominent peak in the brightness temperature. The brightness temperature directly impacts the power spectrum of neutral hydrogen at 21 cm. In Fig. 9, we show the power spectrum of the expected 21 cm signal for our model SGE compared with models G9, G10 and also compared with the sensitivities of ongoing and upcoming observational surveys [151, 152, 153, 154, 155, 156, 157, 158, 159, 160, 161, 162, 163, 164]. As expected, the power at low redshift is the highest for our model SGE. The peak in the power spectrum in the models G8 and G9 occurs roughly at , similar to that in [69]. On the other hand, for our models, SGE and G10, the maxima occur at corresponding to MHz for the redshifted 21 cm line. The maxima is prominent and has a value mK2.
The maxima in the power spectrum for our model SGE occur at a slightly lower redshift than in the fiducial model by [69] that is based on a primary contribution from the low mass haloes. The model has a different reionization morphology than the models presented in this work. Our models are physically motivated by the nature of star formation in first galaxies. We conclude that the Universe was reionized by M⊙ haloes, with an essential contribution of the high-mass haloes as shown by the escape fraction curve in Fig. 3 for our model pick SGE.
4 Summary
The shape of the halo mass function [165, 166, 167] implies that the number of haloes increases with decreasing mass. Galaxy luminosity functions also rise towards the faint end [168, 65]. Integration of the luminosity function weighted by the luminosity, and considering each galaxy contributes a fixed fraction of its ionizing photons, leads to the viewpoint that the main contribution comes from the faint low-mass galaxies due to their numerical superiority [15, 38, 70, 28]. This viewpoint has been challenged by the models based on the recent detection of ionizing photons from the starburst galaxies [53, 68], that have abnormally high SFR, or more appropriately, the high values of and sSFR [9, 35]. Such galaxies are prone to violent bursts and outflows, which facilitate the escape of photons. A natural conclusion from this line of study is that the Universe was reionized by the bursty brighter galaxies, not by the faintest ones [8]. The term ‘brighter’ is prone to an interpretation to mean ‘only the most massive’ on the assumption of a correlation without scatter between the SFR and mass, even at the highest redshifts .
Though the high-mass haloes host the brightest galaxies, the picture is more complex at the low-mass end. A significant scatter in the SFR and is observed at the low mass end. The pre-reionization low mass haloes host the expected faint galaxies, but they also host the ‘brighter’ bursty galaxies (Fig. 1). Such bursty galaxies within low-mass haloes have between and [61, 31, 80, 81, 82], which is comparable to the brightness of most massive haloes (), and is significantly higher than the expected faint magnitudes () for such low mass haloes [28]. We find that an appropriate parameter to identify the bursty galaxies that reionized the Universe is the specific star formation rate, sSFR. The bursty low-mass galaxies from JADES [61, 31], and a few slightly higher mass galaxies from CEERS [24, 84, 85, 86, 87, 88, 89, 90, 91, 92] and GLASS [84] have above-normal sSFR Myr-1.
We further use the cosmological simulation eagle [60] to investigate the haloes that host bursty galaxies with above-normal sSFR at to identify the haloes that reionized the Universe. The scatter plot of as a function of the halo mass for the galaxies in the eagle simulation (Fig. 2) compared with the JADES data [31] show that the galaxies exhibit a peak in the sSFR at a halo mass of M⊙.
By considering haloes corresponding to the peak with above-normal sSFR to have the highest escape fraction, we develop models of the escape fraction as a function of the halo mass. A skewed Gaussian function with a flat tail (Eq.3.2) is the preferred model that accurately represents the burstiness of galaxies at , which we call SGE (and SGET with a slight variation). We have three additional models, G8, G9, and G10, represented by the standard Gaussian function with variation in the location of the peak and width (Eq.3.3).
The maximum escape fraction for our main model SGE is for the M⊙ haloes and for the massive haloes. These values are the absolute upper limits. We deploy our models in 21cmfast that does not implement temporal spikes in SFR, and hence has a statistically lower SFR corresponding to a halo mass when compared to the bursty star formation in eagle and in the real Universe observed by JWST [31]. The SFR for bursty galaxies is even higher in the real Universe compared to eagle (Fig. 1). If, for low mass haloes, the episodes of high SFR are implemented in a radiative transfer study of reionization, then our model SGE will be able to reionize the Universe for much less than 25%.
We implement our models of escape fraction in the publicly available code 21cmfast [38, 69] to study the progress of reionization and the statistical signal at 21 cm wavelength. The evolution of the mean ionized fraction for our main model SGE agrees well with the observational measurements [6, 118, 119, 120, 121, 122, 123, 124, 125, 126, 127, 128, 129, 130, 131, 15, 132, 133, 134, 135, 136, 137, 138, 139, 140, 141, 142]. The SGE has a peak in the escape fraction at M⊙ similar to G9, but surprisingly in the evolution, the Gaussian model G10 lies nearest to SGE (Fig. 4). Further, in the evolution of spin, kinetic and brightness temperature, the G9 model is nearer to SGE while G10 is an outlier (Fig. 5) due to a delay in both the decoupling of the from and its rise with rising in case of the G10 model.
We further investigate this in the spatial maps of the kinetic temperature for our models (Fig. 6 and 7). The SGE model displays an efficient combination of two factors: first, the delayed heating in the model SGE that peaks at , and second factor that has a catalytic effect is the instantaneous nature of reionization in SGE that keeps the Universe neutral till late (50% neutral upto ). The late rise in heating and availability of neutral gas for heating till late, combined with a higher porosity due to the lower mass M⊙ haloes in SGE, enables a quicker increase in free electrons in the neutral regions, , compared to other models (Fig. 8). These factors are reflected in the evolution of the kinetic temperature, and they have an optimising effect on the brightness temperature. Consequently, our model SGE features a late but prominent peak in the brightness temperature when compared to other models based on the low mass haloes [e.g. 69]. To note that the model SGE is based primarily on the M⊙ haloes; however, it has an essential contribution from the most massive haloes that cause a late but a very rapid decrease in (Fig. 8).
The SGE is, therefore, the best model (Fig. 3), which is efficient at heating and also shows rapid and late progress of reionization in agreement with observations (Fig. 4). We conclude that the Universe was reionized by the haloes represented by the SGE model, as they host bursty galaxies with sSFR Myr-1 and UV magnitude, . As per the SGE model, the bursty galaxies reside predominantly in M⊙ haloes. A minority of them also reside in higher mass haloes, which play a vital role, particularly at later redshifts (), by increasing the speed of reionization. In the power spectrum of 21 cm (Fig. 9), the SGE has subtle noticeable differences from the earlier models in the literature [69], and also from our models G8, G9, and G10. It has a higher power at redshifts to , with a peak at corresponding to frequency MHz for the redshifted 21 cm line. The upcoming SKA will be able to test our predictions [169, 170].
Acknowledgements
NJ and MS thank the Department of Science and Technology (DST), Science and Engineering Research Board (SERB), India, for the support through research grants SRG/2022/001137 and MTR/2022/000548. The authors thank the Virgo Consortium for making their simulation data publicly available. The eagle simulation were performed using the DiRAC-2 facility at Durham, managed by the ICC, and the PRACE Curie facility based in France at TGCC, CEA, Bruyères-le-Châtel. MS thanks C. Trott and the EoR group at CIRA for fruitful discussions during an ASTRO-3D fellowship at ICRAR Curtin. The authors also thank the developers of the code 21cmfast to make their code publicly available.
References
- [1] S. Naoz, S. Noter and R. Barkana, The first stars in the Universe, MNRAS 373 (2006) L98 [astro-ph/0604050].
- [2] A. Loeb and R. Barkana, The Reionization of the Universe by the First Stars and Quasars, ARA&A 39 (2001) 19 [astro-ph/0010467].
- [3] M. Rauch, The Lyman Alpha Forest in the Spectra of QSOs, ARA&A 36 (1998) 267 [astro-ph/9806286].
- [4] X. Fan, M.A. Strauss, D.P. Schneider, R.H. Becker, R.L. White, Z. Haiman et al., A Survey of z>5.7 Quasars in the Sloan Digital Sky Survey. II. Discovery of Three Additional Quasars at z>6, AJ 125 (2003) 1649 [astro-ph/0301135].
- [5] X. Fan, M.A. Strauss, G.T. Richards, J.F. Hennawi, R.H. Becker, R.L. White et al., A Survey of z>5.7 Quasars in the Sloan Digital Sky Survey. IV. Discovery of Seven Additional Quasars, AJ 131 (2006) 1203 [astro-ph/0512080].
- [6] Planck Collaboration, N. Aghanim, Y. Akrami, M. Ashdown, J. Aumont, C. Baccigalupi et al., Planck 2018 results. VI. Cosmological parameters, A&A 641 (2020) A6 [1807.06209].
- [7] R. Barkana, The rise of the first stars: Supersonic streaming, radiative feedback, and 21-cm cosmology, Phys. Rep. 645 (2016) 1 [1605.04357].
- [8] M. Sharma, T. Theuns, C. Frenk, R. Bower, R. Crain, M. Schaller et al., The brighter galaxies reionized the Universe, MNRAS 458 (2016) L94 [1512.04537].
- [9] M. Sharma, T. Theuns, C. Frenk, R.G. Bower, R.A. Crain, M. Schaller et al., Winds of change: reionization by starburst galaxies, MNRAS 468 (2017) 2176 [1606.08688].
- [10] A. Sokasian, N. Yoshida, T. Abel, L. Hernquist and V. Springel, Cosmic reionization by stellar sources: population III stars, MNRAS 350 (2004) 47 [astro-ph/0307451].
- [11] F. Haardt and P. Madau, Radiative Transfer in a Clumpy Universe. IV. New Synthesis Models of the Cosmic UV/X-Ray Background, ApJ 746 (2012) 125 [1105.2039].
- [12] B.E. Robertson, S.R. Furlanetto, E. Schneider, S. Charlot, R.S. Ellis, D.P. Stark et al., New Constraints on Cosmic Reionization from the 2012 Hubble Ultra Deep Field Campaign, ApJ 768 (2013) 71 [1301.1228].
- [13] P. Madau and F. Haardt, Cosmic Reionization after Planck: Could Quasars Do It All?, ApJ 813 (2015) L8 [1507.07678].
- [14] S. Mitra, T.R. Choudhury and A. Ferrara, Cosmic reionization after Planck II: contribution from quasars, MNRAS 473 (2018) 1416 [1606.02719].
- [15] B.E. Robertson, R.S. Ellis, S.R. Furlanetto and J.S. Dunlop, Cosmic reionization and early star-forming galaxies: A joint analysis of new constraints from planck and the hubble space telescope, The Astrophysical Journal Letters 802 (2015) L19.
- [16] R.J. Bouwens, G.D. Illingworth, P.A. Oesch, J. Caruana, B. Holwerda, R. Smit et al., Reionization after planck: The derived growth of the cosmic ionizing emissivity now matches the growth of the galaxy uv luminosity density*, The Astrophysical Journal 811 (2015) 140.
- [17] V. Bromm, N. Yoshida, L. Hernquist and C.F. McKee, The formation of the first stars and galaxies, Nature 459 (2009) 49 [0905.0929].
- [18] R. Barkana and A. Loeb, In the beginning: the first sources of light and the reionization of the universe, Phys. Rep. 349 (2001) 125 [astro-ph/0010468].
- [19] T. Shibuya, M. Ouchi and Y. Harikane, Morphologies of 190,000 Galaxies at z = 0-10 Revealed with HST Legacy Data. I. Size Evolution, ApJS 219 (2015) 15 [1503.07481].
- [20] M. Furlong, R.G. Bower, T. Theuns, J. Schaye, R.A. Crain, M. Schaller et al., Evolution of galaxy stellar masses and star formation rates in the EAGLE simulations, MNRAS 450 (2015) 4486 [1410.3485].
- [21] S.L. Finkelstein, J. Ryan, Russell E., C. Papovich, M. Dickinson, M. Song, R.S. Somerville et al., The Evolution of the Galaxy Rest-frame Ultraviolet Luminosity Function over the First Two Billion Years, ApJ 810 (2015) 71 [1410.5439].
- [22] A. Cohen, A. Fialkov, R. Barkana and M. Lotem, Charting the parameter space of the global 21-cm signal, MNRAS 472 (2017) 1915 [1609.02312].
- [23] R. Endsley, D.P. Stark, L. Whitler, M.W. Topping, B.D. Johnson, B. Robertson et al., The star-forming and ionizing properties of dwarf z~ 6-9 galaxies in jades: Insights on bursty star formation and ionized bubble growth, arXiv preprint arXiv:2306.05295 (2023) .
- [24] M. Nakane, M. Ouchi, K. Nakajima, Y. Harikane, Y. Ono, H. Umeda et al., Ly Emission at : Clear Ly Equivalent Width Evolution Indicating the Late Cosmic Reionization History, arXiv e-prints (2023) arXiv:2312.06804 [2312.06804].
- [25] C. Simmonds, S. Tacchella, K. Hainline, B.D. Johnson, W. McClymont, B. Robertson et al., Low-mass bursty galaxies in JADES efficiently produce ionizing photons and could represent the main drivers of reionization, MNRAS 527 (2024) 6139 [2310.01112].
- [26] H. Atek, J. Richard, M. Jauzac, J.-P. Kneib, P. Natarajan, M. Limousin et al., Are Ultra-faint Galaxies at z = 6-8 Responsible for Cosmic Reionization? Combined Constraints from the Hubble Frontier Fields Clusters and Parallels, ApJ 814 (2015) 69 [1509.06764].
- [27] R.J. Bouwens, P.A. Oesch, G.D. Illingworth, R.S. Ellis and M. Stefanon, The z 6 Luminosity Function Fainter than -15 mag from the Hubble Frontier Fields: The Impact of Magnification Uncertainties, ApJ 843 (2017) 129 [1610.00283].
- [28] H. Atek, I. Labbé, L.J. Furtak, I. Chemerynska, S. Fujimoto, D.J. Setton et al., Most of the photons that reionized the Universe came from dwarf galaxies, Nature 626 (2024) 975.
- [29] M. Sharma, T. Theuns and C. Frenk, The duration of reionization constrains the ionizing sources, MNRAS 477 (2018) L111 [1712.06619].
- [30] Y. Qin, S. Balu and J.S.B. Wyithe, Implications of z 12 JWST galaxies for galaxy formation at high redshift, MNRAS 526 (2023) 1324 [2305.17959].
- [31] T.J. Looser, F. D’Eugenio, R. Maiolino, S. Tacchella, M. Curti, S. Arribas et al., JADES: Differing assembly histories of galaxies – Observational evidence for bursty SFHs and (mini-)quenching in the first billion years of the Universe, arXiv e-prints (2023) arXiv:2306.02470 [2306.02470].
- [32] A.U. Enders, D.J. Bomans and A. Wittje, Lyman continuum leaker candidates among highly ionised, low-redshift dwarf galaxies selected from He II, A&A 672 (2023) A11 [2302.02868].
- [33] K. Freese, P. Gondolo, J.A. Sellwood and D. Spolyar, Dark Matter Densities During the Formation of the First Stars and in Dark Stars, ApJ 693 (2009) 1563 [0805.3540].
- [34] N.Y. Gnedin, A.V. Kravtsov and H.-W. Chen, Escape of ionizing radiation from high-redshift galaxies, The Astrophysical Journal 672 (2008) 765.
- [35] A. Calabrò, L. Pentericci, P. Santini, A. Ferrara, M. Llerena, S. Mascia et al., The evolution of the SFR and of galaxies in cosmic morning (), arXiv e-prints (2024) arXiv:2402.17829 [2402.17829].
- [36] P. Ocvirk, N. Gillet, P.R. Shapiro, D. Aubert, I.T. Iliev, R. Teyssier et al., Cosmic Dawn (CoDa): the First Radiation-Hydrodynamics Simulation of Reionization and Galaxy Formation in the Local Universe, MNRAS 463 (2016) 1462 [1511.00011].
- [37] J.S.W. Lewis, P. Ocvirk, D. Aubert, J.G. Sorce, P.R. Shapiro, N. Deparis et al., Galactic ionizing photon budget during the epoch of reionization in the Cosmic Dawn II simulation, MNRAS 496 (2020) 4342 [2001.07785].
- [38] A. Mesinger, S. Furlanetto and R. Cen, 21CMFAST: a fast, seminumerical simulation of the high-redshift 21-cm signal, MNRAS 411 (2011) 955 [1003.3878].
- [39] A. Ferrara and A. Loeb, Escape fraction of the ionizing radiation from starburst galaxies at high redshifts, MNRAS 431 (2013) 2826 [1209.2123].
- [40] J.H. Wise and R. Cen, Ionizing photon escape fractions from high-redshift dwarf galaxies, The Astrophysical Journal 693 (2009) 984.
- [41] I. Kostyuk, B. Ciardi and A. Ferrara, Physically motivated modeling of LyC escape fraction during reionization, arXiv e-prints (2023) arXiv:2308.01476 [2308.01476].
- [42] C.G. Lacey and S.M. Fall, Chemical evolution of the galactic disk with radial gas flows., ApJ 290 (1985) 154.
- [43] F. Matteucci and P. François, Galactic chemical evolution: abundance gradients of individual elements, Monthly Notices of the Royal Astronomical Society 239 (1989) 885 [https://academic.oup.com/mnras/article-pdf/239/3/885/18194800/mnras239-0885.pdf].
- [44] S.D.M. White and C.S. Frenk, Galaxy Formation through Hierarchical Clustering, ApJ 379 (1991) 52.
- [45] J. Japelj, E. Vanzella, F. Fontanot, S. Cristiani, G.B. Caminha, P. Tozzi et al., Constraints on the Lyman continuum escape fraction for faint star-forming galaxies, Monthly Notices of the Royal Astronomical Society 468 (2017) 389 [https://academic.oup.com/mnras/article-pdf/468/1/389/11057672/stx477.pdf].
- [46] C. Leitherer, W.D. Vacca, P.S. Conti, A.V. Filippenko, C. Robert and W.L.W. Sargent, Hubble Space Telescope Ultraviolet Imaging and Spectroscopy of the Bright Starburst in the Wolf-Rayet Galaxy NGC 4214, ApJ 465 (1996) 717.
- [47] T.M. Heckman, S. Borthakur, R. Overzier, G. Kauffmann, A. Basu-Zych, C. Leitherer et al., Extreme Feedback and the Epoch of Reionization: Clues in the Local Universe, ApJ 730 (2011) 5 [1101.4219].
- [48] A.E. Shapley, C.C. Steidel, M. Pettini, K.L. Adelberger and D.K. Erb, The Direct Detection of Lyman Continuum Emission from Star-forming Galaxies at z~3, ApJ 651 (2006) 688 [astro-ph/0606635].
- [49] B. Siana, H.I. Teplitz, J. Colbert, H.C. Ferguson, M. Dickinson, T.M. Brown et al., New Constraints on the Lyman Continuum Escape Fraction at z~1.3, ApJ 668 (2007) 62 [0706.4093].
- [50] E. Vanzella, M. Giavalisco, A.K. Inoue, M. Nonino, F. Fontanot, S. Cristiani et al., The Great Observatories Origins Deep Survey: Constraints on the Lyman Continuum Escape Fraction Distribution of Lyman-break Galaxies at 3.4 < z < 4.5, ApJ 725 (2010) 1011 [1009.1140].
- [51] D.B. Nestor, A.E. Shapley, C.C. Steidel and B. Siana, Narrowband imaging of escaping lyman-continuum emission in the ssa22 field*,†, The Astrophysical Journal 736 (2011) 18.
- [52] K. Boutsia, A. Grazian, E. Giallongo, A. Fontana, L. Pentericci, M. Castellano et al., A Low Escape Fraction of Ionizing Photons of L > L* Lyman Break Galaxies at z = 3.3, ApJ 736 (2011) 41 [1104.5237].
- [53] Y.I. Izotov, I. Orlitová, D. Schaerer, T.X. Thuan, A. Verhamme, N.G. Guseva et al., Eight per cent leakage of Lyman continuum photons from a compact, star-forming dwarf galaxy, Nature 529 (2016) 178 [1601.03068].
- [54] J. Melinder, G. Östlin, M. Hayes, A. Rasekh, J.M. Mas-Hesse, J.M. Cannon et al., The Ly Reference Sample. XIV. Ly Imaging of 45 Low-redshift Star-forming Galaxies and Inferences on Global Emission, ApJS 266 (2023) 15 [2302.14077].
- [55] E.R. Fernandez and J.M. Shull, The Effect of Galactic Properties on the Escape Fraction of Ionizing Photons, ApJ 731 (2011) 20 [1006.3519].
- [56] M. Trebitsch, J. Blaizot, J. Rosdahl, J. Devriendt and A. Slyz, Fluctuating feedback-regulated escape fraction of ionizing radiation in low-mass, high-redshift galaxies, Monthly Notices of the Royal Astronomical Society 470 (2017) 224 [https://academic.oup.com/mnras/article-pdf/470/1/224/17843908/stx1060.pdf].
- [57] T. Kimm and R. Cen, Escape Fraction of Ionizing Photons during Reionization: Effects due to Supernova Feedback and Runaway OB Stars, ApJ 788 (2014) 121 [1405.0552].
- [58] J.H. Wise, V.G. Demchenko, M.T. Halicek, M.L. Norman, M.J. Turk, T. Abel et al., The birth of a galaxy - III. Propelling reionization with the faintest galaxies, MNRAS 442 (2014) 2560 [1403.6123].
- [59] H. Yajima, J.-H. Choi and K. Nagamine, Escape fraction of ionizing photons from high-redshift galaxies in cosmological SPH simulations, MNRAS 412 (2011) 411 [1002.3346].
- [60] J. Schaye, R.A. Crain, R.G. Bower, M. Furlong, M. Schaller, T. Theuns et al., The EAGLE project: simulating the evolution and assembly of galaxies and their environments, MNRAS 446 (2015) 521 [1407.7040].
- [61] B.E. Robertson, S. Tacchella, B.D. Johnson, K. Hainline, L. Whitler, D.J. Eisenstein et al., Identification and properties of intense star-forming galaxies at redshifts z > 10, Nature Astronomy 7 (2023) 611 [2212.04480].
- [62] B. Robertson, B.D. Johnson, S. Tacchella, D.J. Eisenstein, K. Hainline, S. Arribas et al., Earliest galaxies in the jades origins field: Luminosity function and cosmic star-formation rate density 300 myr after the big bang, 2023.
- [63] K.B.W. McQuinn, M.J.B. Newman, A. Savino, A.E. Dolphin, D.R. Weisz, B.F. Williams et al., The JWST Resolved Stellar Populations Early Release Science Program IV: The Star Formation History of the Local Group Galaxy WLM, arXiv e-prints (2023) arXiv:2312.03060 [2312.03060].
- [64] Y. Harikane, M. Ouchi, M. Oguri, Y. Ono, K. Nakajima, Y. Isobe et al., A comprehensive study of galaxies at z 9–16 found in the early jwst data: Ultraviolet luminosity functions and cosmic star formation history at the pre-reionization epoch, The Astrophysical Journal Supplement Series 265 (2023) 5.
- [65] R.J. Bouwens, M. Stefanon, G. Brammer, P.A. Oesch, T. Herard-Demanche, G.D. Illingworth et al., Evolution of the UV LF from z 15 to z 8 using new JWST NIRCam medium-band observations over the HUDF/XDF, MNRAS 523 (2023) 1036 [2211.02607].
- [66] C.-A. Faucher-Giguère, A model for the origin of bursty star formation in galaxies, MNRAS 473 (2018) 3717 [1701.04824].
- [67] S. Borthakur, T.M. Heckman, C. Leitherer and R.A. Overzier, A local clue to the reionization of the universe, Science 346 (2014) 216 [1410.3511].
- [68] D. Schaerer, T. Fragos and Y.I. Izotov, X-ray binaries as the origin of nebular He II emission in low-metallicity star-forming galaxies, A&A 622 (2019) L10 [1902.10496].
- [69] J. Park, A. Mesinger, B. Greig and N. Gillet, Inferring the astrophysics of reionization and cosmic dawn from galaxy luminosity functions and the 21-cm signal, MNRAS 484 (2019) 933 [1809.08995].
- [70] S.L. Finkelstein, A. D’Aloisio, J.-P. Paardekooper, J. Ryan, Russell, P. Behroozi, K. Finlator et al., Conditions for Reionizing the Universe with a Low Galaxy Ionizing Photon Escape Fraction, ApJ 879 (2019) 36 [1902.02792].
- [71] F. Marinacci, R. Pakmor and V. Springel, The formation of disc galaxies in high-resolution moving-mesh cosmological simulations, Monthly Notices of the Royal Astronomical Society 437 (2013) 1750 [https://academic.oup.com/mnras/article-pdf/437/2/1750/3877129/stt2003.pdf].
- [72] J.S. Speagle, C.L. Steinhardt, P.L. Capak and J.D. Silverman, A Highly Consistent Framework for the Evolution of the Star-Forming “Main Sequence” from z ~0-6, ApJS 214 (2014) 15 [1405.2041].
- [73] P. Popesso, A. Concas, G. Cresci, S. Belli, G. Rodighiero, H. Inami et al., The main sequence of star-forming galaxies across cosmic times, MNRAS 519 (2023) 1526 [2203.10487].
- [74] S. Tacchella, J.C. Forbes and N. Caplar, Stochastic modelling of star-formation histories II: star-formation variability from molecular clouds and gas inflow, MNRAS 497 (2020) 698 [2006.09382].
- [75] T. Kimm, H. Katz, M. Haehnelt, J. Rosdahl, J. Devriendt and A. Slyz, Feedback-regulated star formation and escape of LyC photons from mini-haloes during reionization, Monthly Notices of the Royal Astronomical Society 466 (2017) 4826 [https://academic.oup.com/mnras/article-pdf/466/4/4826/10873852/stx052.pdf].
- [76] S. Tacchella, A. Dekel, C.M. Carollo, D. Ceverino, C. DeGraf, S. Lapiner et al., The confinement of star-forming galaxies into a main sequence through episodes of gas compaction, depletion and replenishment, Monthly Notices of the Royal Astronomical Society 457 (2016) 2790 [https://academic.oup.com/mnras/article-pdf/457/3/2790/8000909/stw131.pdf].
- [77] M. Sharma, T. Theuns, C.S. Frenk and R.J. Cooke, Origins of carbon-enhanced metal-poor stars, MNRAS 473 (2018) 984 [1611.03868].
- [78] M. Sharma, T. Theuns and C. Frenk, The chemical imprint of the bursty nature of Milky Way’s progenitors, MNRAS 482 (2019) L145 [1805.05342].
- [79] G. Sun, C.-A. Faucher-Giguère, C.C. Hayward and X. Shen, Seen and unseen: bursty star formation and its implications for observations of high-redshift galaxies with JWST, MNRAS 526 (2023) 2665 [2305.02713].
- [80] A.J. Bunker, A.J. Cameron, E. Curtis-Lake, P. Jakobsen, S. Carniani, M. Curti et al., JADES NIRSpec Initial Data Release for the Hubble Ultra Deep Field: Redshifts and Line Fluxes of Distant Galaxies from the Deepest JWST Cycle 1 NIRSpec Multi-Object Spectroscopy, arXiv e-prints (2023) arXiv:2306.02467 [2306.02467].
- [81] G.C. Jones, A.J. Bunker, A. Saxena, J. Witstok, D.P. Stark, S. Arribas et al., JADES: The emergence and evolution of Ly emission and constraints on the IGM neutral fraction, arXiv e-prints (2023) arXiv:2306.02471 [2306.02471].
- [82] M. Curti, R. Maiolino, E. Curtis-Lake, J. Chevallard, S. Carniani, F. D’Eugenio et al., JADES: Insights on the low-mass end of the mass–metallicity–star-formation rate relation at from deep JWST/NIRSpec spectroscopy, arXiv e-prints (2023) arXiv:2304.08516 [2304.08516].
- [83] A.M. Morales, S.L. Finkelstein, G.C.K. Leung, M.B. Bagley, N.J. Cleri, R. Dave et al., Rest-Frame UV Colors for Faint Galaxies at with the JWST NGDEEP Survey, arXiv e-prints (2023) arXiv:2311.04294 [2311.04294].
- [84] K. Nakajima, M. Ouchi, Y. Isobe, Y. Harikane, Y. Zhang, Y. Ono et al., JWST Census for the Mass-Metallicity Star Formation Relations at z = 4-10 with Self-consistent Flux Calibration and Proper Metallicity Calibrators, ApJS 269 (2023) 33 [2301.12825].
- [85] I. Jung, S.L. Finkelstein, P. Arrabal Haro, M. Dickinson, H.C. Ferguson, T.A. Hutchison et al., CEERS: Diversity of Lyman-Alpha Emitters during the Epoch of Reionization, arXiv e-prints (2023) arXiv:2304.05385 [2304.05385].
- [86] P. Arrabal Haro, M. Dickinson, S.L. Finkelstein, J.S. Kartaltepe, C.T. Donnan, D. Burgarella et al., Confirmation and refutation of very luminous galaxies in the early Universe, Nature 622 (2023) 707 [2303.15431].
- [87] Y. Harikane, Y. Zhang, K. Nakajima, M. Ouchi, Y. Isobe, Y. Ono et al., A JWST/NIRSpec First Census of Broad-line AGNs at z = 4-7: Detection of 10 Faint AGNs with M BH 106-108 M ⊙ and Their Host Galaxy Properties, ApJ 959 (2023) 39 [2303.11946].
- [88] A. Zitrin, I. Labbé, S. Belli, R. Bouwens, R.S. Ellis, G. Roberts-Borsani et al., Lyman Emission from a Luminous z = 8.68 Galaxy: Implications for Galaxies as Tracers of Cosmic Reionization, ApJ 810 (2015) L12 [1507.02679].
- [89] S. Fujimoto, P. Arrabal Haro, M. Dickinson, S.L. Finkelstein, J.S. Kartaltepe, R.L. Larson et al., CEERS Spectroscopic Confirmation of NIRCam-selected z 8 Galaxy Candidates with JWST/NIRSpec: Initial Characterization of Their Properties, ApJ 949 (2023) L25 [2301.09482].
- [90] M. Tang, D.P. Stark, Z. Chen, C. Mason, M. Topping, R. Endsley et al., JWST/NIRSpec spectroscopy of z = 7–9 star-forming galaxies with CEERS: new insight into bright Ly- emitters in ionized bubbles, Monthly Notices of the Royal Astronomical Society 526 (2023) 1657 [https://academic.oup.com/mnras/article-pdf/526/2/1657/51799799/stad2763.pdf].
- [91] R.L. Larson, S.L. Finkelstein, D.D. Kocevski, T.A. Hutchison, J.R. Trump, P. Arrabal Haro et al., A CEERS Discovery of an Accreting Supermassive Black Hole 570 Myr after the Big Bang: Identifying a Progenitor of Massive z > 6 Quasars, ApJ 953 (2023) L29 [2303.08918].
- [92] R.L. Sanders, A.E. Shapley, M.W. Topping, N.A. Reddy and G.B. Brammer, Excitation and Ionization Properties of Star-forming Galaxies at z = 2.0-9.3 with JWST/NIRSpec, ApJ 955 (2023) 54 [2301.06696].
- [93] A.J. Bunker, A. Saxena, A.J. Cameron, C.J. Willott, E. Curtis-Lake, P. Jakobsen et al., JADES NIRSpec Spectroscopy of GN-z11: Lyman- emission and possible enhanced nitrogen abundance in a z = 10.60 luminous galaxy, A&A 677 (2023) A88 [2302.07256].
- [94] V. Springel, S.D.M. White, A. Jenkins, C.S. Frenk, N. Yoshida, L. Gao et al., Simulations of the formation, evolution and clustering of galaxies and quasars, Nature 435 (2005) 629 [astro-ph/0504097].
- [95] M. Vogelsberger, S. Genel, V. Springel, P. Torrey, D. Sijacki, D. Xu et al., Properties of galaxies reproduced by a hydrodynamic simulation, Nature 509 (2014) 177 [1405.1418].
- [96] M. Schaller, C. Dalla Vecchia, J. Schaye, R.G. Bower, T. Theuns, R.A. Crain et al., The EAGLE simulations of galaxy formation: the importance of the hydrodynamics scheme, MNRAS 454 (2015) 2277 [1509.05056].
- [97] R.A. Crain, J. Schaye, R.G. Bower, M. Furlong, M. Schaller, T. Theuns et al., The EAGLE simulations of galaxy formation: calibration of subgrid physics and model variations, MNRAS 450 (2015) 1937 [1501.01311].
- [98] C. Dalla Vecchia and J. Schaye, Simulating galactic outflows with kinetic supernova feedback, MNRAS 387 (2008) 1431 [0801.2770].
- [99] J. Schaye, C. Dalla Vecchia, C.M. Booth, R.P.C. Wiersma, T. Theuns, M.R. Haas et al., The physics driving the cosmic star formation history, MNRAS 402 (2010) 1536 [0909.5196].
- [100] J. Kennicutt, Robert C., The Global Schmidt Law in Star-forming Galaxies, ApJ 498 (1998) 541 [astro-ph/9712213].
- [101] J. Schaye and C. Dalla Vecchia, On the relation between the Schmidt and Kennicutt-Schmidt star formation laws and its implications for numerical simulations, MNRAS 383 (2008) 1210 [0709.0292].
- [102] M. Sparre, C.C. Hayward, R. Feldmann, C.-A. Faucher-Giguère, A.L. Muratov, D. Kereš et al., (Star)bursts of FIRE: observational signatures of bursty star formation in galaxies, Monthly Notices of the Royal Astronomical Society 466 (2016) 88 [https://academic.oup.com/mnras/article-pdf/466/1/88/10865056/stw3011.pdf].
- [103] S. Zaroubi, The Epoch of Reionization, in The First Galaxies, T. Wiklind, B. Mobasher and V. Bromm, eds., vol. 396 of Astrophysics and Space Science Library, p. 45, Jan., 2013, DOI [1206.0267].
- [104] W.H. Press and P. Schechter, Formation of Galaxies and Clusters of Galaxies by Self-Similar Gravitational Condensation, ApJ 187 (1974) 425.
- [105] A. Mesinger and S. Furlanetto, Efficient Simulations of Early Structure Formation and Reionization, ApJ 669 (2007) 663 [0704.0946].
- [106] S.J. Mutch, P.M. Geil, G.B. Poole, P.W. Angel, A.R. Duffy, A. Mesinger et al., Dark-ages reionization and galaxy formation simulation - III. Modelling galaxy formation and the epoch of reionization, MNRAS 462 (2016) 250 [1512.00562].
- [107] E. Garaldi, R. Kannan, A. Smith, V. Springel, R. Pakmor, M. Vogelsberger et al., The THESAN project: properties of the intergalactic medium and its connection to reionization-era galaxies, MNRAS 512 (2022) 4909 [2110.01628].
- [108] E.R. Harrison, Fluctuations at the threshold of classical cosmology, Phys. Rev. D 1 (1970) 2726.
- [109] Y.B. Zeldovich, A Hypothesis, Unifying the Structure and the Entropy of the Universe, Monthly Notices of the Royal Astronomical Society 160 (1972) 1P [https://academic.oup.com/mnras/article-pdf/160/1/1P/8079415/mnras160-001P.pdf].
- [110] B. Greig and A. Mesinger, 21CMMC: an MCMC analysis tool enabling astrophysical parameter studies of the cosmic 21 cm signal, MNRAS 449 (2015) 4246 [1501.06576].
- [111] B. Greig and A. Mesinger, The global history of reionization, MNRAS 465 (2017) 4838 [1605.05374].
- [112] B. Greig and A. Mesinger, 21CMMC with a 3D light-cone: the impact of the co-evolution approximation on the astrophysics of reionization and cosmic dawn, MNRAS 477 (2018) 3217 [1801.01592].
- [113] X. Ma, D. Kasen, P.F. Hopkins, C.-A. Faucher-Giguère, E. Quataert, D. Kereš et al., The difficulty of getting high escape fractions of ionizing photons from high-redshift galaxies: a view from the FIRE cosmological simulations, Monthly Notices of the Royal Astronomical Society 453 (2015) 960 [https://academic.oup.com/mnras/article-pdf/453/1/960/4935561/stv1679.pdf].
- [114] R.J. Bouwens, M. Stefanon, P.A. Oesch, G.D. Illingworth, T. Nanayakkara, G. Roberts-Borsani et al., Newly Discovered Bright z 9-10 Galaxies and Improved Constraints on Their Prevalence Using the Full CANDELS Area, ApJ 880 (2019) 25 [1905.05202].
- [115] R.P. Naidu, J. Matthee, P.A. Oesch, C. Conroy, D. Sobral, G. Pezzulli et al., The synchrony of production and escape: half the bright Ly emitters at z 2 have Lyman continuum escape fractions 50 per cent, MNRAS 510 (2022) 4582 [2110.11961].
- [116] R.P. Naidu, S. Tacchella, C.A. Mason, S. Bose, P.A. Oesch and C. Conroy, Rapid Reionization by the Oligarchs: The Case for Massive, UV-bright, Star-forming Galaxies with High Escape Fractions, ApJ 892 (2020) 109 [1907.13130].
- [117] Mascia, S., Pentericci, L., Calabrò, A., Treu, T., Santini, P., Yang, L. et al., Closing in on the sources of cosmic reionization: First results from the glass-jwst program, A&A 672 (2023) A155.
- [118] M. Ouchi, Y. Harikane, T. Shibuya, K. Shimasaku, Y. Taniguchi, A. Konno et al., Systematic Identification of LAEs for Visible Exploration and Reionization Research Using Subaru HSC (SILVERRUSH). I. Program strategy and clustering properties of 2000 Ly emitters at z = 6-7 over the 0.3-0.5 Gpc2 survey area, PASJ 70 (2018) S13 [1704.07455].
- [119] M. Ouchi, K. Shimasaku, H. Furusawa, T. Saito, M. Yoshida, M. Akiyama et al., Statistics of 207 Ly Emitters at a Redshift Near 7: Constraints on Reionization and Galaxy Formation Models, ApJ 723 (2010) 869 [1007.2961].
- [120] A.K. Inoue, K. Hasegawa, T. Ishiyama, H. Yajima, I. Shimizu, M. Umemura et al., SILVERRUSH. VI. A simulation of Ly emitters in the reionization epoch and a comparison with Subaru Hyper Suprime-Cam survey early data, PASJ 70 (2018) 55 [1801.00067].
- [121] A.M. Morales, C.A. Mason, S. Bruton, M. Gronke, F. Haardt and C. Scarlata, The Evolution of the Lyman-alpha Luminosity Function during Reionization, ApJ 919 (2021) 120 [2101.01205].
- [122] R. Itoh, M. Ouchi, H. Zhang, A.K. Inoue, K. Mawatari, T. Shibuya et al., CHORUS. II. Subaru/HSC Determination of the Ly Luminosity Function at z = 7.0: Constraints on Cosmic Reionization Model Parameter, ApJ 867 (2018) 46 [1805.05944].
- [123] H. Goto, K. Shimasaku, S. Yamanaka, R. Momose, M. Ando, Y. Harikane et al., SILVERRUSH. XI. Constraints on the Ly Luminosity Function and Cosmic Reionization at z = 7.3 with Subaru/Hyper Suprime-Cam, ApJ 923 (2021) 229 [2110.14474].
- [124] E. Curtis-Lake, S. Carniani, A. Cameron, S. Charlot, P. Jakobsen, R. Maiolino et al., Spectroscopic confirmation of four metal-poor galaxies at z = 10.3-13.2, Nature Astronomy 7 (2023) 622 [2212.04568].
- [125] T.Y.-Y. Hsiao, Abdurro’uf, D. Coe, R.L. Larson, I. Jung, M. Mingozzi et al., JWST NIRSpec spectroscopy of the triply-lensed galaxy MACS0647JD, arXiv e-prints (2023) arXiv:2305.03042 [2305.03042].
- [126] A. Hoag, M. Bradač, K. Huang, C. Mason, T. Treu, K.B. Schmidt et al., Constraining the Neutral Fraction of Hydrogen in the IGM at Redshift 7.5, ApJ 878 (2019) 12 [1901.09001].
- [127] C.A. Mason, A. Fontana, T. Treu, K.B. Schmidt, A. Hoag, L. Abramson et al., Inferences on the timeline of reionization at z 8 from the KMOS Lens-Amplified Spectroscopic Survey, MNRAS 485 (2019) 3947 [1901.11045].
- [128] I. Jung, S.L. Finkelstein, M. Dickinson, T.A. Hutchison, R.L. Larson, C. Papovich et al., Texas Spectroscopic Search for Ly Emission at the End of Reionization. III. The Ly Equivalent-width Distribution and Ionized Structures at z > 7, ApJ 904 (2020) 144 [2009.10092].
- [129] L.R. Whitler, C.A. Mason, K. Ren, M. Dijkstra, A. Mesinger, L. Pentericci et al., The impact of scatter in the galaxy UV luminosity to halo mass relation on Ly visibility during the epoch of reionization, MNRAS 495 (2020) 3602 [1911.03499].
- [130] S. Bruton, C. Scarlata, F. Haardt, M.J. Hayes, C. Mason, A.M. Morales et al., The Impact of Cosmic Variance on Inferences of Global Neutral Fraction Derived from Ly Luminosity Functions during Reionization, ApJ 953 (2023) 29 [2305.04949].
- [131] T. Morishita, G. Roberts-Borsani, T. Treu, G. Brammer, C.A. Mason, M. Trenti et al., Early Results from GLASS-JWST. XIV. A Spectroscopically Confirmed Protocluster 650 Million Years after the Big Bang, ApJ 947 (2023) L24 [2211.09097].
- [132] X. Fan, M.A. Strauss, R.H. Becker, R.L. White, J.E. Gunn, G.R. Knapp et al., Constraining the Evolution of the Ionizing Background and the Epoch of Reionization with z~6 Quasars. II. A Sample of 19 Quasars, AJ 132 (2006) 117 [astro-ph/0512082].
- [133] I.D. McGreer, A. Mesinger and V. D’Odorico, Model-independent evidence in favour of an end to reionization by z 6, MNRAS 447 (2015) 499 [1411.5375].
- [134] J. Schroeder, A. Mesinger and Z. Haiman, Evidence of Gunn-Peterson damping wings in high-z quasar spectra: strengthening the case for incomplete reionization at z 6-7, MNRAS 428 (2013) 3058 [1204.2838].
- [135] D.J. Mortlock, S.J. Warren, B.P. Venemans, M. Patel, P.C. Hewett, R.G. McMahon et al., A luminous quasar at a redshift of z = 7.085, Nature 474 (2011) 616 [1106.6088].
- [136] T. Totani, K. Aoki, T. Hattori, G. Kosugi, Y. Niino, T. Hashimoto et al., Probing intergalactic neutral hydrogen by the Lyman alpha red damping wing of gamma-ray burst 130606A afterglow spectrum at z = 5.913, PASJ 66 (2014) 63 [1312.3934].
- [137] M. McQuinn, A. Lidz, O. Zahn, S. Dutta, L. Hernquist and M. Zaldarriaga, The morphology of HII regions during reionization, MNRAS 377 (2007) 1043 [astro-ph/0610094].
- [138] M. McQuinn, L. Hernquist, M. Zaldarriaga and S. Dutta, Studying reionization with Ly emitters, MNRAS 381 (2007) 75 [0704.2239].
- [139] K. Ota, M. Iye, N. Kashikawa, K. Shimasaku, M. Kobayashi, T. Totani et al., Reionization and Galaxy Evolution Probed by z = 7 Ly Emitters, ApJ 677 (2008) 12 [0707.1561].
- [140] J. Caruana, A.J. Bunker, S.M. Wilkins, E.R. Stanway, M. Lacy, M.J. Jarvis et al., No evidence for Lyman emission in spectroscopy of z > 7 candidate galaxies, MNRAS 427 (2012) 3055 [1208.5987].
- [141] V. Tilvi, C. Papovich, S.L. Finkelstein, J. Long, M. Song, M. Dickinson et al., Rapid Decline of Ly Emission toward the Reionization Era, ApJ 794 (2014) 5 [1405.4869].
- [142] M.A. Schenker, R.S. Ellis, N.P. Konidaris and D.P. Stark, Line-emitting Galaxies beyond a Redshift of 7: An Improved Method for Estimating the Evolving Neutrality of the Intergalactic Medium, ApJ 795 (2014) 20 [1404.4632].
- [143] M. Ishigaki, R. Kawamata, M. Ouchi, M. Oguri, K. Shimasaku and Y. Ono, Full-data Results of Hubble Frontier Fields: UV Luminosity Functions at z 6-10 and a Consistent Picture of Cosmic Reionization, ApJ 854 (2018) 73 [1702.04867].
- [144] S.R. Furlanetto, M. McQuinn and L. Hernquist, Characteristic scales during reionization, MNRAS 365 (2006) 115 [astro-ph/0507524].
- [145] P. Madau, A. Meiksin and M.J. Rees, 21 Centimeter Tomography of the Intergalactic Medium at High Redshift, ApJ 475 (1997) 429 [astro-ph/9608010].
- [146] C.M. Hirata, Wouthuysen-Field coupling strength and application to high-redshift 21-cm radiation, MNRAS 367 (2006) 259 [astro-ph/0507102].
- [147] R. Barkana and A. Loeb, A Method for Separating the Physics from the Astrophysics of High-Redshift 21 Centimeter Fluctuations, ApJ 624 (2005) L65 [astro-ph/0409572].
- [148] S.A. Wouthuysen, On the excitation mechanism of the 21-cm (radio-frequency) interstellar hydrogen emission line., AJ 57 (1952) 31.
- [149] G.B. Field, Excitation of the Hydrogen 21-CM Line, Proceedings of the IRE 46 (1958) 240.
- [150] A. Mesinger, A. Ferrara and D.S. Spiegel, Signatures of X-rays in the early Universe, MNRAS 431 (2013) 621 [1210.7319].
- [151] Z. Abdurashidova, J.E. Aguirre, P. Alexander, Z.S. Ali, Y. Balfour, A.P. Beardsley et al., First Results from HERA Phase I: Upper Limits on the Epoch of Reionization 21 cm Power Spectrum, ApJ 925 (2022) 221 [2108.02263].
- [152] Z. Abdurashidova, J.E. Aguirre, P. Alexander, Z.S. Ali, Y. Balfour, R. Barkana et al., HERA Phase I Limits on the Cosmic 21 cm Signal: Constraints on Astrophysics and Cosmology during the Epoch of Reionization, ApJ 924 (2022) 51 [2108.07282].
- [153] A. Ewall-Wice, J.S. Dillon, J.N. Hewitt, A. Loeb, A. Mesinger, A.R. Neben et al., First limits on the 21 cm power spectrum during the Epoch of X-ray heating, MNRAS 460 (2016) 4320 [1605.00016].
- [154] N. Barry, M. Wilensky, C.M. Trott, B. Pindor, A.P. Beardsley, B.J. Hazelton et al., Improving the Epoch of Reionization Power Spectrum Results from Murchison Widefield Array Season 1 Observations, ApJ 884 (2019) 1 [1909.00561].
- [155] W. Li, J.C. Pober, N. Barry, B.J. Hazelton, M.F. Morales, C.M. Trott et al., First Season MWA Phase II Epoch of Reionization Power Spectrum Results at Redshift 7, ApJ 887 (2019) 141 [1911.10216].
- [156] C.M. Trott, C.H. Jordan, S. Midgley, N. Barry, B. Greig, B. Pindor et al., Deep multiredshift limits on Epoch of Reionization 21 cm power spectra from four seasons of Murchison Widefield Array observations, MNRAS 493 (2020) 4711 [2002.02575].
- [157] S. Yoshiura, B. Pindor, J.L.B. Line, N. Barry, C.M. Trott, A. Beardsley et al., A new MWA limit on the 21 cm power spectrum at redshifts 13-17, MNRAS 505 (2021) 4775 [2105.12888].
- [158] M. Kolopanis, D.C. Jacobs, C. Cheng, A.R. Parsons, S.A. Kohn, J.C. Pober et al., A Simplified, Lossless Reanalysis of PAPER-64, ApJ 883 (2019) 133 [1909.02085].
- [159] A.H. Patil, S. Yatawatta, L.V.E. Koopmans, A.G. de Bruyn, M.A. Brentjens, S. Zaroubi et al., Upper Limits on the 21 cm Epoch of Reionization Power Spectrum from One Night with LOFAR, ApJ 838 (2017) 65 [1702.08679].
- [160] F.G. Mertens, M. Mevius, L.V.E. Koopmans, A.R. Offringa, G. Mellema, S. Zaroubi et al., Improved upper limits on the 21 cm signal power spectrum of neutral hydrogen at z 9.1 from LOFAR, MNRAS 493 (2020) 1662 [2002.07196].
- [161] B.K. Gehlot, F.G. Mertens, L.V.E. Koopmans, A.R. Offringa, A. Shulevski, M. Mevius et al., The AARTFAAC Cosmic Explorer: observations of the 21-cm power spectrum in the EDGES absorption trough, MNRAS 499 (2020) 4158 [2010.02269].
- [162] G. Paciga, J.G. Albert, K. Bandura, T.-C. Chang, Y. Gupta, C. Hirata et al., A simulation-calibrated limit on the H I power spectrum from the GMRT Epoch of Reionization experiment, MNRAS 433 (2013) 639 [1301.5906].
- [163] The HERA Collaboration, Z. Abdurashidova, T. Adams, J.E. Aguirre, P. Alexander, Z.S. Ali et al., Improved Constraints on the 21 cm EoR Power Spectrum and the X-Ray Heating of the IGM with HERA Phase I Observations, arXiv e-prints (2022) arXiv:2210.04912 [2210.04912].
- [164] M.W. Eastwood, M.M. Anderson, R.M. Monroe, G. Hallinan, M. Catha, J. Dowell et al., The 21 cm Power Spectrum from the Cosmic Dawn: First Results from the OVRO-LWA, AJ 158 (2019) 84 [1906.08943].
- [165] P. Schechter, An analytic expression for the luminosity function for galaxies., ApJ 203 (1976) 297.
- [166] R.K. Sheth and G. Tormen, Large-scale bias and the peak background split, MNRAS 308 (1999) 119 [astro-ph/9901122].
- [167] A. Jenkins, C.S. Frenk, S.D.M. White, J.M. Colberg, S. Cole, A.E. Evrard et al., The mass function of dark matter haloes, MNRAS 321 (2001) 372 [astro-ph/0005260].
- [168] R.J. Bouwens, G.D. Illingworth, P.A. Oesch, M. Trenti, I. Labbé, L. Bradley et al., UV Luminosity Functions at Redshifts z 4 to z 10: 10,000 Galaxies from HST Legacy Fields, ApJ 803 (2015) 34 [1403.4295].
- [169] L. Koopmans, J. Pritchard, G. Mellema, J. Aguirre, K. Ahn, R. Barkana et al., The Cosmic Dawn and Epoch of Reionisation with SKA, in Advancing Astrophysics with the Square Kilometre Array (AASKA14), p. 1, Apr., 2015, DOI [1505.07568].
- [170] G. Mellema, L. Koopmans, H. Shukla, K.K. Datta, A. Mesinger and S. Majumdar, HI tomographic imaging of the Cosmic Dawn and Epoch of Reionization with SKA, in Advancing Astrophysics with the Square Kilometre Array (AASKA14), p. 10, Apr., 2015, DOI [1501.04203].