Simple 2D Convolutional Neural Network-based Approach
for COVID-19 Detection
Abstract
This study explores the use of deep learning techniques for analyzing lung Computed Tomography (CT) images. Classic deep learning approaches face challenges with varying slice counts and resolutions in CT images, a diversity arising from the utilization of assorted scanning equipment. Typically, predictions are made on single slices which are then combined for a comprehensive outcome. Yet, this method does not incorporate learning features specific to each slice, leading to a compromise in effectiveness. To address these challenges, we propose an advanced Spatial-Slice Feature Learning (SSFL++) framework specifically tailored for CT scans. It aims to filter out out-of-distribution (OOD) data within the entire CT scan, allowing us to select essential spatial-slice features for analysis by reducing data redundancy by 70%. Additionally, we introduce a Kernel-Density-based slice Sampling (KDS) method to enhance stability during training and inference phases, thereby accelerating convergence and enhancing overall performance. Remarkably, our experiments reveal that our model achieves promising results with a simple EfficientNet-2D (E2D) model. The effectiveness of our approach is confirmed on the COVID-19-CT-DB datasets provided by the DEF-AI-MIA workshop.
1 Introduction
Computed Tomography (CT) [1] has emerged as an indispensable tool for disease detection and management. Its capability to uncover abnormalities within the body, including ground-glass opacities and bilateral patchy shadows, is vital for the early detection and monitoring of diseases. In the context of diagnosing COVID-19, medical professionals rely heavily on the analysis of lung CT scans. However, considering that a single patient’s CT scan may comprise hundreds of images, manual inspection becomes an exceedingly time-consuming task, particularly when physicians are required to assess CT scans from a significant number of patients. This situation could lead to the occurrence of false negative samples due to the overwhelming volume of data.
The swift progress in deep learning (DL) technologies has positioned DL methods [2, 3, 4, 5, 6, 7, 8] at the forefront for their capacity to rapidly and precisely detect features of COVID-19, efficiently processing vast amounts of data. Moreover, convolutional neural networks (CNNs) have demonstrated superior effectiveness compared to both frequency-domain-based [9, 10] and low-level features-based approaches [11] for CT image analysis.
In response to the widespread outbreak of COVID-19, Kolliaz et al. introduced the COVID-19-CT-DB dataset [12, 13, 14, 15, 16, 17, 18, 19], a comprehensive collection that includes a large volume of labeled data for both COVID-19 and non-COVID-19 cases. This initiative significantly advances deep learning (DL) methodologies, addressing the critical need for high-quality datasets essential for DL-based analysis in the fight against COVID-19. Numerous researchers have subsequently developed various methods aimed at enhancing COVID-19 detection tasks, contributing valuable strategies to the ongoing effort to manage the pandemic effectively [20, 21, 22, 23].
Although CT imaging is a powerful tool for detecting abnormalities, it faces challenges related to varying resolutions and qualities arising from different data servers and scanning machines. The resolution and number of slices in CT images can differ depending on the specific scanning equipment used, potentially requiring researchers to create complex network designs. Moreover, medical analysis for COVID-19, unlike standard DL-based tasks that prioritize performance and application, necessitates maintaining the explainability of the model’s predictions [24, 25, 20].
In this study, we present the Spatial-Slice Feature Learning (SSFL++) method, an unsupervised approach aimed at reducing computational complexity by effectively eliminating out-of-distribution (OOD) slices and redundant spatial details. Prior studies [22, 20] were not able to pinpoint the most critical slices while also considering the global sequence of information. Recognizing the potential for enhancement in this area, we introduce a Kernel-Density-based slice Sampling (KDS) technique, which leverages Kernel Density Estimation to fulfill both objectives concurrently. The results from our experiments showcase the remarkable performance of our 2D model, even in scenarios characterized by a scarcity of data.
Our novelties and contributions can be listed as follow:
-
•
Improved spatial-slice feature learning module: SSFL++ is a morphology-based method tailored for CT scans that efficiently eliminates unnecessary areas in both spatial and slice dimensions. This reduction in computational complexity facilitates the identification of Regions of Interest (RoI) without the need for intricate designs or configurations. Remarkably, we achieved a 70% reduction in the area on the COVID-19-CT-DB datasets without any decline in performance.
-
•
Density-aware slice sampling method: Together with the SSFL++’s capability to selectively eliminate unnecessary spatial areas and slices, the KDS method further refines the process by adaptively identifying and sampling the most essential slices, all while maintaining the integrity of global sequence information. This approach significantly improves data efficiency and bolsters the model’s proficiency in few-shot learning scenarios. Experimental outcomes have demonstrated that our E2D model maintains strong and dependable performance, even in situations with limited CT scans and slices.
2 Related Work
2.1 Region of Interests for Computed Tomography
Background. CT imaging employs X-rays that circulate around a specific body plane, with detectors positioned on the opposite side to capture the emerging signals. This method leverages the varying degrees of X-ray attenuation by different tissues, together with signals collected from numerous angles as they pass through the body, to create a sinogram. This sinogram is instrumental in reconstructing cross-sectional images. However, the intrinsic nature of CT imaging, which requires signal collection from multiple angles for image reconstruction, results in scans filled with superfluous data, potentially leading to increased labor costs in processing and analyzing these images.
Although this technology has been around for a long time, how to design a robust and reliable RoI selection algorithm for CT-scan remains an open-problem. The noises and redundancy harm the model performance. In recent years, most researchers has still focused on how to enhance feature extraction pipeline [26], or improve the quality of image reconstruction [27], to address the aforementioned challenges. Cobo et al. [28] suggested that the standardization of medical imaging workflows could improve the performance of radiomics and DL systems. Jensen et al. [29] proposed enhancing the stability of CT radiomics using parametric feature maps. Gaidel et al. [30] introduced a greedy forward selection-based method for lung CT images, but the lack of robustness against data-shifting and noise limited its development.
Despite the long-standing presence of this technology, crafting a robust and reliable algorithm for selecting Regions of Interest (RoI) in CT scans remains an unresolved issue. The presence of noise and redundant information can adversely affect model performance. In recent years, the focus of most researchers has primarily been on enhancing the feature extraction pipeline [26] or improving the quality of image reconstruction to tackle these challenges. Cobo et al. [28] suggested that standardizing medical imaging workflows could bolster the efficacy of radiomics and deep learning (DL) systems. Jensen et al. [29] advocated for the stabilization of CT radiomics through the use of parametric feature maps. Meanwhile, Gaidel et al. [30]introduced a method based on greedy forward selection for lung CT images; however, its lack of robustness against data shifts and noise has hindered its further development.
2.2 COVID-19 Recognition
In recent years, significant advancements have been made in developing methods for the detection and recognition of COVID-19 D. Kollias et al. [14] have played a pivotal role in this area by delving into how deep learning models can be utilized to analyze prediction outcomes through latent representations. Chen et al. [20] have taken a statistical learning approach, merging maximum likelihood estimation with the Wilcoxon test, to adaptively choose slices and construct models that prioritize explainability. Additionally, Hou et al. have explored contrastive learning to refine feature representation, enhancing the model’s ability to distinguish between complex patterns. Turnbull et al. implemented a 3D ResNet [31] for classifying the severity of COVID-19 cases. Hsu et al. introduced a novel two-step model, demonstrating a 2D and (2+1)D strategy [22] that has shown remarkable success in the AI-MIA 2023 competition for COVID-19 detection.
3 Methodology
In this section, we present the method we used for COVID-19 detection, including SSFL++ and KDS. The backbone we used is also introduced.
3.1 Model Architecture
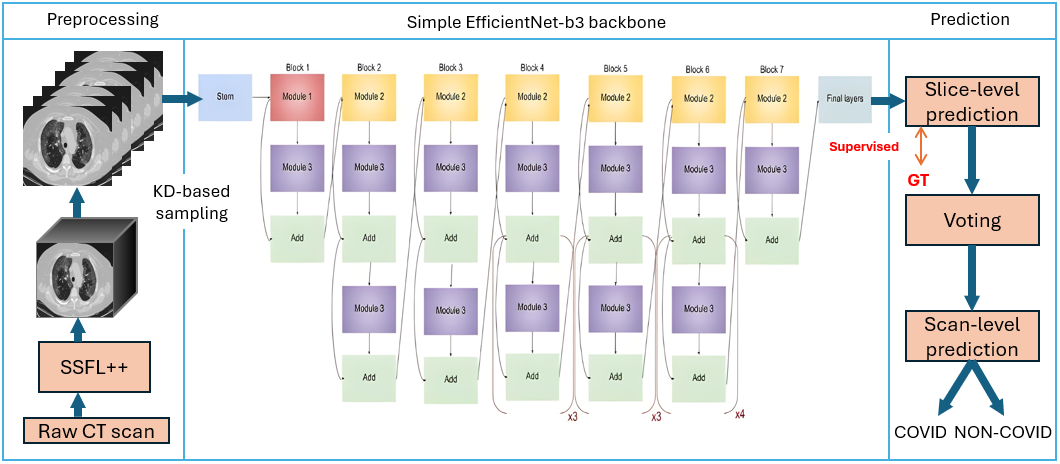
Backbone. EfficientNet [32], through its innovative compound scaling approach, has significantly influenced our perception of achieving a balance between efficiency and accuracy within the realm of deep learning. This methodology, which smartly scales the model’s width, depth, and resolution, provides a suite of models that can be efficiently adapted to different hardware limitations.
According to our observations, there is no need to use too complicated or state-of-the art model for recognize COVID-19. Just using ResNet50 [31] or other convolutional neural network like VGG can also archive ideal performance when OOD slices are removed out. In our pipeline, EfficientNet-b3 [33] is employed to focus on learning features from individual slices of CT images, utilizing only select portions of these slices. Before moving to the next phase, every slice is processed through EfficientNet to pull out embedded features. This process ensures that only crucial features of the slices are kept within the CT image.
3.2 Spatial-Slice Feature Learning
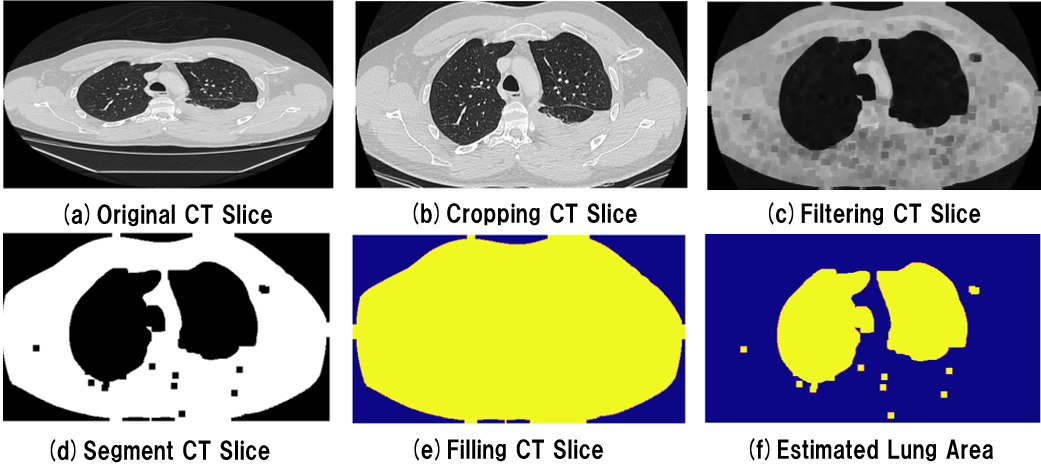
Spatial Steps. The primary concern with CT scans is the presence of large black areas between the backgrounds of each CT slice. When these images are resized to a fixed shape for input into a neural network, this can distort the RoI, potentially leading to the vanishing of important features. To address this issue, a low-pass filter with a window size of is employed across all CT slices to remove noise. The operation of the low-pass filtering can be defined as follows:
| (1) |
where represents the weight at position in the filter kernel. The above formula can determine the segmentation of the filtered slices by a threshold :
| (2) |
where i, j denote as an pixel for every single CT slice , which resolution is . A Cropped region can be calculated by:
is yielded accordingly, we can further resize the resolution of to for the slice steps and as an input of neural network. Spatial Steps in proposed 4SFL effectively filter out non-lung tissue regions (also known as RoIs in spatial dimension), and reduce computational complexity, as the Figure 2 illustrated.
Slice Steps. To find the lung tissue region in the CT scan, we used the binary dilation algorithm [34] to obtain the filled result . The difference between the and filled mask represents the lung tissue region. The above method can be summarized as the following formula:
| (3) |
After the above technique, we can finally obtain a range where and denote the starting and ending indexes, respectively, and is the constraint of the number of slices for a single CT scan to select most importance RoIs in slice dimension with proportion . The optimization problem can be formulated as following:
Following the application of the low-pass filter technique, we can identify a range where and represent the starting and ending indexes, respectively, and denotes the constraint on the number of slices to be selected from a single CT scan. This process aims to select the most important RoIs within the slice dimension based on a proportion . The optimization problem for this selection process can be formulated as follows:
| (4) |
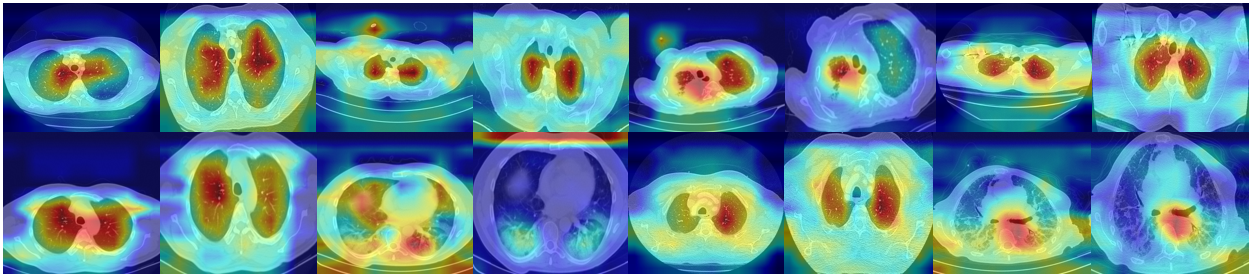
The spatial and slice steps of the proposed SSFL++ model adopt an unsupervised learning approach, relying solely on prior knowledge specific to lung CT scans. This methodology has the potential to be generalized to CT scans of other organs or body parts. However, adapting it to different contexts might necessitate adjustments in parameters to accommodate the unique characteristics of each organ or body part. Furthermore, by employing SSFL++, the visual explanation methods can focus more precisely on RoIs, making them appear more concentrated and thereby facilitating a clearer understanding and analysis of the scans, as shown in Figure 3.
3.3 Density-aware Slice Sampling
Background. The SSFL proposed by Hsu et al. [22] employs a random sampling method to select slices, which were used for the detection of COVID-19 using 2D and 2+1D CNNs. However, random sampling may potentially introduce bias and instability when training and inference, and it does not efficiently identify the most representative CT slices.
In order to address this, we propose a Kernel-Density-based Slice Sampling (KDS). It performs kernel density estimation (KDE) on the selected slices-set [,], adaptively and wisely sampling the most crucial CT-slices. Meanwhile, it also keeps the sequence information globally and alleviates the instability during training and inference stage.
Definition. KDE is a classic method to estimate the probability density function (PDF) of a random variable in a non-parametric manner. It can be defined as:
| (5) |
| (6) |
where represents the bandwidth constant, which is determined using Scott’s rule [36], denotes a Gaussian kernel, and is a smoothing factor applied to the estimated density function (with higher values resulting in smoother functions, set to 100 in this case). Given a Kernel Density Estimation (KDE), several sub-intervals can be established by evaluating its Cumulative Distribution Function (CDF), where the length of each sub-interval adaptively varies according to its -percentile. The CDF of the KDE and its -percentile are calculated using the following formulas:
| (7) |
In the proposed KDS method, the probability of selecting slices within each interval is determined by the density obtained from KDE. Additionally, this method guarantees that at least one sample is selected from each sub-interval, ensuring a comprehensive capture of global sequential information.
4 Experiment
| Spatial Area (K) | Slice Length | Spatial Slice (M) | Total | ||||||
| Before | After | Before | After | Before | After | ||||
| Training | 267.25 | 155.53 | 0.4184 | 285.32 | 142.91 | 0.4983 | 76.25 | 22.22 | 0.7085 |
| Positive | 266.42 | 157.69 | 0.4088 | 295.90 | 148.18 | 0.4985 | 78.83 | 23.36 | 0.7036 |
| Negative | 268.21 | 153.03 | 0.4296 | 273.97 | 137.26 | 0.4981 | 73.48 | 21.00 | 0.7141 |
| Validation | 265.62 | 155.23 | 0.4172 | 281.95 | 141.23 | 0.4984 | 74.89 | 21.92 | 0.7072 |
| Positive | 268.94 | 160.48 | 0.4061 | 280.53 | 140.55 | 0.4984 | 75.45 | 22.55 | 0.7010 |
| Negative | 262.12 | 149.69 | 0.4288 | 283.49 | 141.97 | 0.4984 | 74.30 | 21.25 | 0.7139 |
| (T+V) Positive | 267.25 | 155.53 | 0.4184 | 292.96 | 146.72 | 0.4985 | 78.29 | 22.81 | 0.7085 |
| (T+V) Negative | 267.01 | 152.37 | 0.4294 | 275.78 | 138.16 | 0.4982 | 73.64 | 21.05 | 0.7141 |
| Total | 266.94 | 155.47 | 0.4182 | 284.68 | 142.59 | 0.4983 | 75.99 | 22.16 | 0.7082 |
| Testing | 279.55 | 153.41 | 0.4520 | 309.39 | 154.67 | 0.5003 | 86.48 | 23.72 | 0.7256 |
Dataset description. In our experiments, we used a total of 1,684 COVID-19-CT-DB data, provided by Kollias et al. [37]. The dataset information have shown in Table 2. After a detailed examination, it was noticed that some of the training data included CT scans of the lungs that were not aligned horizontally, either in part or in full. To reduce variability in the training process, these data were manually eliminated. In order to ensure stability and fairly check performance during the experiments, group-5-fold-cross-validation is used. Data augmentation and hyperparameters are kept consistent in all experiments.
| Type | Positive Scan | Negative Scan | Total Scan |
|---|---|---|---|
| Training | 703 | 655 | 1,358 |
| Valid | 170 | 156 | 326 |
| Total | 873 | 811 | 1,684 |
| Testing | - | - | 1,413 |
| Type | Positive Slice | Negative Slice | Total Slice |
| Training | 206,608 | 178,722 | 385,330 |
| Valid | 46,042 | 43,679 | 89,721 |
| Total | 252,650 | 222,401 | 475,051 |
| Testing | - | - | 437,185 |
Hyperparameter settings. The Adam [38] optimizer was used with a learning rate of 1e-4 and a weight decay of 5e-4. The batch-size is set to 16.
Data Augmentation. In our experiments, we utilized common augmentation strategy like HorizontalFlip, RandomScaleShifting to prevent overfitting and enlarge feature space. Additionally, we find that HueSaturationValue, RandomBrightnessContrast and CoarseDropout [39] are also used.
Loss Function. The binary cross-entropy loss calculates the cross-entropy between the actual labels and the predicted probabilities, providing an average loss for each sample, where and represent the actual label and the predicted probability for the sample, respectively.
| (8) |
Evaluation Metric. We mainly used F1-score in the experiments for model evaluation. F1-score is a metric used to determine the accuracy of a binary classification model. It combines the harmonic mean of Precision and Recall.
| (9) |
where precision and recall are computed for COVID and non-COVID. The macro f1-score is the average of the f1-scores for all classes:
| (10) |
where is the number of classes, and is the f1-score for the -th class. These metrics provide a balanced evaluation of the model’s ability to classify each class accurately and its overall performance across all classes.
4.1 Model Details and Performance Evaluation
To provide a more comprehensive comparison and improve future research, we designed simple E2D in our experiments. The backbones are all based on EfficientNet-b3 [32, 33]. The baseline method and detailed pipeline are as follows:
Baseline: The baseline method is presented in [37], Kollias et al. adopted CNN-RNN to extract feature within all CT-slice. First, all CT-slices are resized to to extract feature, then RNN (GRU [40] with neurons) analyzed the 2D-CNN (ResNet-50 [31]) features. The output of the RNN element is then forwarded to a fully connected layer. In addition, this also includes a dropout layer (the dropout rate is set to ) before the fully connected layer.
E2D: From the CT-scans processed by SSFL++, subsequently, we use our proposed KDS. These sampled slices are resized to and extracted to high-representation features.
The experimental results, as presented in Table 3, highlight the E2D model’s exceptional performance when paired with KDS on the COVID-19 database 2024 validation set.
| Model type | Scans | Sampled slice |
|
|
||||
|---|---|---|---|---|---|---|---|---|
|
100% | - | - | 78.00 | ||||
| E2D | 100% | 8(random) | 92.44 | 93.18 | ||||
| 100% | 16(random) | 92.68 | 93.37 | |||||
| 100% | 8(KDS) | 93.46 | 100.00 | |||||
| 100% | 16(KDS) | 94.11 | 100.00 |
4.2 Ablation Study
| Spatial step | Slice step | KDS |
|
|
||||
| 80.41 | 81.26 | |||||||
| ✓ | 88.01 | 88.04 | ||||||
| ✓ | 90.32 | 90.48 | ||||||
| ✓ | ✓ | 92.68 | 93.37 | |||||
| ✓ | ✓ | ✓ | 94.11 | 100.00 |
To delve deeper into the effects of the SSFL++ and KDS methodologies on the task of detecting COVID-19, an ablation study was carried out, with the findings detailed in Table 4. These experiments all utilize the E2D model, maintaining consistency across experimental hyperparameters.
The outcomes reveal that the integration of SSFL++ notably boosts performance, highlighting the critical role of spatial redundancy in CT scans and the benefit of precise slice selection. Focusing solely on RoIs proves to be more efficient and effective than analyzing the entirety of CT slices. Conversely, the KDS method further refines the model’s predictive capabilities at the slice level and marks substantial advancements at the scan level, demonstrating impressive performance. KDS successfully mitigates the shortcomings of 2D-CNNs, particularly their limited global sequential modeling ability when processing CT images.
4.3 Submission for COVID-19 Detection Challenge
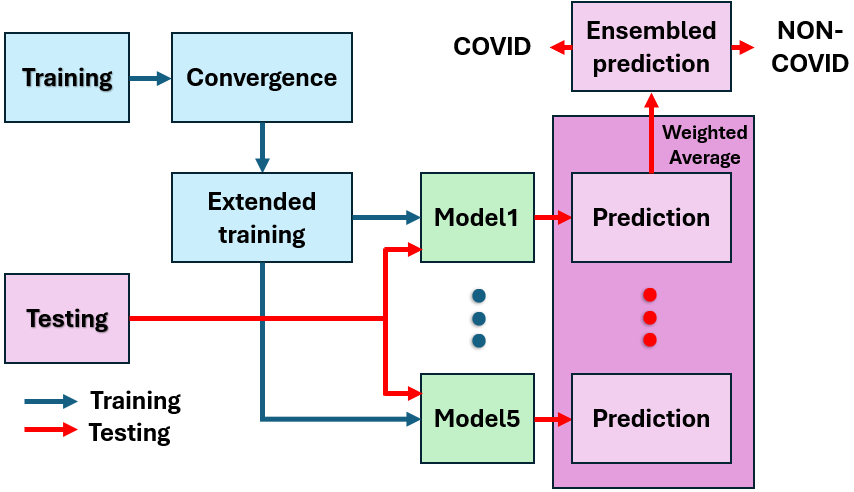
We submitted a total of five results. Following the convergence of the neural network, we continued training for several additional epochs and completed model ensembling. Overall, we employed a 5-group validation strategy and used a combination of AUC and slice-level macro F1-score for making predictions. The final output was obtained by averaging these predictive measures. The pipeline is illustrated in Figure 4.
5 Conclusion
We conducted a comprehensive analysis for the COVID-19 detection task, noting that CT scans often contain a large amount of redundant information, which limits the performance of models. To address this issue, we introduced a simple morphology-based method for CT images, named Spatial-Slice Feature Learning (SSFL++), designed to efficiently and adaptively locate the Region of Interest (RoI). This method effectively reduces redundant areas across both spatial and slice dimensions.
We combined SSFL++ with the further designed Kernel-Density-based Slice Sampling (KDS), thereby addressing the instability issues brought by random sampling during training and inference phases. Moreover, through the global sequence modeling, we activated the latent capabilities of 2D-CNNs. Finally, our proposed method demonstrated promising results on the validation dataset provided by the DEF-AI-MIA workshop.
References
- [1] Steven W. Smith, “Computed tomography,” 1999.
- [2] Saeedan Bin, Aljohani M, AO Khushaim, SQ Bukhari, and ST Elnaas, “Thyroid computed tomography imaging: pictorial review of variable pathologies,” Insights Imaging, 2016.
- [3] André Ramon, Amélie Bohm-Sigrand, Pierre Pottecher, Pascal Richette, Jean-Francis Maillefert, Herve Devilliers, and Paul. Ornetti, “Role of dual-energy ct in the diagnosis and follow-up of gout: systematic analysis of the literature,” Clinical Rheumatology, 2018.
- [4] K Gupta and Bajaj V., “Deep learning models-based ct-scan image classification for automated screening of covid-19,” Biomed Signal Process Control, 2023.
- [5] Ghosh Chilamkurthy S, Tanamala R, Biviji S, Campeau M, Venugopal NG, Mahajan VK, Rao P V, and Warier P., “Deep learning algorithms for detection of critical findings in head ct scans: a retrospective study,” Lancet, 2018.
- [6] Monika Grewal, Muktabh Mayank Srivastava, Pulkit Kumar, and Srikrishna Varadarajan, “Radnet: Radiologist level accuracy using deep learning for hemorrhage detection in ct scans,” 2018 IEEE 15th International Symposium on Biomedical Imaging (ISBI 2018), pp. 281–284, 2017.
- [7] K. Moulaei, M. Shanbehzadeh, Mohammadi-Taghiabad, and Z. et al., “Comparing machine learning algorithms for predicting covid-19 mortality,” BMC Med Inform Decis Mak, 2022.
- [8] Q. Xu, X. Zhan, and Z. et al. Zhou, “Ai-based analysis of ct images for rapid triage of covid-19 patients,” npj digital medicine, 2020.
- [9] Sun Y. Zhang Y, Zhang L, “Rigid motion artifact reduction in ct using frequency domain analysis,” J Xray Sci Technol, 2017.
- [10] Kiran Parmar, Dr. Rahul Kher, and Falgun Thakkar, “Analysis of ct and mri image fusion using wavelet transform,” 05 2012, vol. 2012, pp. 124–127.
- [11] Dong-Hoon Lee, Do-Wan Lee, and Bongsoo Han, “Possibility study of scale invariant feature transform (sift) algorithm application to spine magnetic resonance imaging,” PloS one, vol. 11, pp. e0153043, 04 2016.
- [12] Anastasios Arsenos, Dimitrios Kollias, and Stefanos Kollias, “A large imaging database and novel deep neural architecture for covid-19 diagnosis,” in 2022 IEEE 14th Image, Video, and Multidimensional Signal Processing Workshop (IVMSP). IEEE, 2022, p. 1–5.
- [13] Anastasios Arsenos, Andjoli Davidhi, Dimitrios Kollias, Panos Prassopoulos, and Stefanos Kollias, “Data-driven covid-19 detection through medical imaging,” in 2023 IEEE International Conference on Acoustics, Speech, and Signal Processing Workshops (ICASSPW). IEEE, 2023, p. 1–5.
- [14] Dimitrios Kollias, N Bouas, Y Vlaxos, V Brillakis, M Seferis, Ilianna Kollia, Levon Sukissian, James Wingate, and S Kollias, “Deep transparent prediction through latent representation analysis,” arXiv preprint arXiv:2009.07044, 2020.
- [15] Dimitris Kollias, Y Vlaxos, M Seferis, Ilianna Kollia, Levon Sukissian, James Wingate, and Stefanos D Kollias, “Transparent adaptation in deep medical image diagnosis.,” in TAILOR, 2020, p. 251–267.
- [16] Dimitrios Kollias, Anastasios Arsenos, and Stefanos Kollias, “Ai-mia: Covid-19 detection and severity analysis through medical imaging,” in European Conference on Computer Vision. Springer, 2022, p. 677–690.
- [17] Dimitrios Kollias, Anastasios Arsenos, and Stefanos Kollias, “A deep neural architecture for harmonizing 3-d input data analysis and decision making in medical imaging,” Neurocomputing, vol. 542, pp. 126244, 2023.
- [18] Dimitrios Kollias, Anastasios Arsenos, Levon Soukissian, and Stefanos Kollias, “Mia-cov19d: Covid-19 detection through 3-d chest ct image analysis,” in Proceedings of the IEEE/CVF International Conference on Computer Vision, 2021, p. 537–544.
- [19] Dimitrios Kollias, Anastasios Arsenos, and Stefanos Kollias, “Ai-enabled analysis of 3-d ct scans for diagnosis of covid-19 & its severity,” in 2023 IEEE International Conference on Acoustics, Speech, and Signal Processing Workshops (ICASSPW). IEEE, 2023, p. 1–5.
- [20] Guan-Lin Chen, Chih-Chung Hsu, and Mei-Hsuan Wu, “Adaptive distribution learning with statistical hypothesis testing for covid-19 ct scan classification,” in Proceedings of the IEEE/CVF International Conference on Computer Vision, 2021, pp. 471–479.
- [21] Chih-Chung Hsu, Chi-Han Tsai, Guan-Lin Chen, Sin-Di Ma, and Shen-Chieh Tai, “Spatiotemporal feature learning based on two-step lstm and transformer for ct scans,” arXiv preprint arXiv:2207.01579, 2022.
- [22] Chih-Chung Hsu, Chih-Yu Jian, Chia-Ming Lee, Chi-Han Tsai, and Shen-Chieh Tai, “Bag of tricks of hybrid network for covid-19 detection of ct scans,” in 2023 IEEE International Conference on Acoustics, Speech, and Signal Processing Workshops (ICASSPW). IEEE, 2023, pp. 1–4.
- [23] Shenghan Zhang, Binyi Zou, Binquan Xu, Jionglong Su, and Huafeng Hu, “An efficient deep learning framework of covid-19 ct scans using contrastive learning and ensemble strategy,” in 2021 IEEE International Conference on Progress in Informatics and Computing (PIC). IEEE, 2021, pp. 388–396.
- [24] M. Chetoui, M.A. Akhloufi, E.M. Bouattane, J. Abdulnour, S. Roux, and C.D. Bernard, “Explainable covid-19 detection based on chest x-rays using an end-to-end regnet architecture,” Viruses, 2023.
- [25] F. Mercaldo, M.P. Belfiore, and A. et al. Reginelli, “Coronavirus covid-19 detection by means of explainable deep learning,” Scientific Reports, 2023.
- [26] Lin et al. Lu, “Uncontrolled confounders may lead to false or overvalued radiomics signature: A proof of concept using survival analysis in a multicenter cohort of kidney cancer,” 2021.
- [27] Hongchao et al. He, “Computed tomography-based radiomics prediction of ctla4 expression and prognosis in clear cell renal cell carcinoma,” Cancer medicine, 2023.
- [28] M. et al Cobo, “Enhancing radiomics and deep learning systems through the standardization of medical imaging workflows,” Scientific Data, 2023.
- [29] Laura J et al. Jensen, “Enhancing the stability of ct radiomics across different volume of interest sizes using parametric feature maps: a phantom study,” European radiology experimental, 2022.
- [30] Andrey Gaidel, “Method of automatic roi selection on lung ct images,” Procedia Engineering, vol. 201, pp. 258–264, 2017, 3rd International Conference “Information Technology and Nanotechnology”, ITNT-2017, 25-27 April 2017, Samara, Russia.
- [31] Kaiming He, Xiangyu Zhang, Shaoqing Ren, and Jian Sun, “Deep residual learning for image recognition,” in Proceedings of the IEEE/CVF Conference on Computer Vision and Pattern Recognition (CVPR), 2016.
- [32] Mingxing Tan and Quoc Le, “Efficientnet: Rethinking model scaling for convolutional neural networks,” in Proceedings of the International conference on machine learning (ICML), 2019, pp. 6105–6114.
- [33] Ross Wightman, “Pytorch image models,” https://github.com/rwightman/pytorch-image-models, 2019.
- [34] Wikipedia contributors, “Mathematical morphology — Wikipedia, the free encyclopedia,” 2022, [Online; accessed 2-July-2022].
- [35] Aditya Chattopadhay, Anirban Sarkar, Prantik Howlader, and Vineeth N Balasubramanian, “Grad-cam++: Generalized gradient-based visual explanations for deep convolutional networks,” in 2018 IEEE Winter Conference on Applications of Computer Vision (WACV), 2018, pp. 839–847.
- [36] D.W. Scott, “Multivariate density estimation: Theory, practice and visualization,” John Wiley and Sons, Inc., 1992.
- [37] Dimitris Kollias, Anastasios Arsenos, and Stefanos Kollias, “Domain adaptation, explainability and fairness in ai for medical image analysis: Diagnosis of covid-19 based on 3-d chest ct-scans,” arXiv preprint arXiv:2403.02192, 2024.
- [38] Diederik P Kingma and Jimmy Ba, “Adam: A method for stochastic optimization,” arXiv preprint arXiv:1412.6980, 2014.
- [39] Terrance DeVries and Graham W Taylor, “Improved regularization of convolutional neural networks with cutout,” arXiv preprint arXiv:1708.04552, 2017.
- [40] Junyoung Chung, Caglar Gulcehre, KyungHyun Cho, and Yoshua Bengio, “Empirical evaluation of gated recurrent neural networks on sequence modeling,” arXiv preprint arXiv:1412.3555, 2014.