New insights into the origin of the first sharp diffraction peak in amorphous silica from an analysis of chemical and radial ordering
Abstract
The structural origin of the first sharp diffraction peak (FSDP) in amorphous silica is studied by analyzing chemical and radial ordering of silicon (Si) and oxygen (O) atoms in binary amorphous networks. The study shows that the chemical order involving Si–O and O–O pairs play a major role in the formation of the FSDP in amorphous silica. This is supplemented by small contributions arising from the relatively weak Si–Si correlations in the Fourier space. A shell-by-shell analysis of the radial correlations between Si–Si, Si–O and O–O atoms in the network reveals that the position and the intensity of the FSDP are largely determined by atomic pair correlations originating from the first two/three radial shells on a length scale of about 5–8 Å, whereas the fine structure of the intensity curve in the vicinity of the FSDP is perturbatively modified by atomic correlations arising from the radial shells beyond 8 Å. The study leads to a simple mathematical relationship between the position of the radial peaks () in the partial pair-correlation functions and the diffraction peaks () that can be used to obtain approximate positions of the FSDP and the principal peak. The results are complemented by numerical calculations and an accurate semi-analytical expression for the diffraction intensity obtained from the partial pair-correlation functions of amorphous silica for a given radial shell.
I Introduction
Amorphous silica (a-SiO2) is one of the most extensively studied noncrystalline solids. While the local structure of amorphous silica is well described in terms of the approximate tetrahedral arrangement of Si and O atoms leading to short-range ordering (SRO) in the network, the medium-range order (MRO) in a-SiO2 is relatively less understood as far as the real-space ordering of the atoms is concerned [1, 2, 3, 4, 5, 6]. The SRO in network glasses is readily reflected in the pair-correlation functions (PCF) and the bond-angle distributions. The appearance of the MRO in real space is much more subtle and difficult to gauge, however. In a-SiO2, the MRO is often associated with the relative position and orientation of Si[O4] tetrahedra in forming a continuous random network. In the presence of short-range ordering, driven by local chemistry and geometry, these structural motifs connect with the neighboring motifs in such a way that the resulting network exhibits atomic correlations on a nanometer length scale [7]. Although these intermediate correlations reside in the PCF in a rather obscure way [8, 9], their presence is particularly evident in the Fourier space. The radial correlations in the PCF, extending up to a few nanometers in some glasses, can manifest in the form of a sharp diffraction peak in the region of 1–2 Å-1 in the Fourier space. For a-SiO2, this leads to the presence of a sharp peak at = 1.5 Å-1, also known as the first sharp diffraction peak (FSDP), which serves as a key indicator of the presence of MRO in the network.
The FSDP in glasses has been studied extensively via X-ray and neutron diffraction experiments [10, 11, 12, 13, 14, 15, 16, 17, 18, 19], and computational modeling of glasses in simulation studies [20, 21, 22, 23, 24, 9, 25]. Although these studies have produced a wealth of structural information on glasses and established that the FSDP is a nearly universal feature of network glasses, a definitive understanding of the origin of the FSDP, and its thermodynamic behavior with respect to pressure and temperature [10, 12, 11, 26, 10, 16, 19], in terms of the real-space ordering of atoms on the medium-range length scale is yet to be achieved.
In the past decades, several explanations for the possible origin of the FSDP in network glasses were proposed in the literature [27, 21, 22, 28, 14, 29]. Among these explanations, the viewpoints presented by Gaskell and Wallis [27] and Elliott [22, 21] are most noteworthy. Following Gaskell and Wallis, the FSDP in network glasses is often attributed to the presence of diffuse quasi-Bragg planes, which are assumed to be separated by a distance of the order of in real space. These quasi-Bragg planes are believed to originate from fluctuations of order, which produce a strong scattering in the region of 1–2 Å-1 in most glasses. For a-SiO2, this translates into a value of 4 Å and experimental data obtained from high-resolution electron microscope (HREM) images of a-SiO2 appear to support the existence of these quasi-Bragg planes [27]. The presence of quasi-Bragg planes in a-SiO2 was also reported in a simulation study by Uchino et al. [24], who employed a real-reciprocal space analysis of the pair-correlation function of a-SiO2 by using a continuous wavelet transform technique.
An alternative view is provided by Elliott [3, 21]. In this approach, the chemical ordering of interstitial voids – associated with cation-centered structural motifs or clusters – in network glasses plays a central role in the formation of the FSDP. The author has shown that the FSDP in network glasses can be regarded as a prepeak in the concentration-concentration partial structure factor (obtained in the Bhatia-Thornton formalism [30]), , originating from low-atomic-occupancy zones or voids in cluster+void networks. A direct application of this cluster+void model leads to the position of the FSDP in a-SiO2 near 1.52 Å-1 [21], which includes a corrective factor due to Blétry [31]. The pressure and temperature dependence of the FSDP can be successfully described using this model for most AX2-type (A = Si, Ge; X = O, S, Se) network glasses. Although some authors [14] have disputed the applicability of the cluster+void model for a-SiO2, experimental studies on densified a-SiO2 do indicate that interstitial voids play an important part in the formation of the FSDP and its behavior upon change of pressure and temperature [16, 26]. It may be noted that these two seemingly different explanations are not totally unrelated to each other due to the presence of interstitial voids and hence the resulting fluctuations of the atomic density that can lead to strong scattering in the region of 1–2 Å-1.
In this work, we employ a simple but deftly implemented approach in real space to understand and gain new insights on the origin and structure of the FSDP in a-SiO2. Although our work is focused on a-SiO2, the approach employed here is very general in nature and it can be applied to any network-forming amorphous solids, including amorphous silicon [9]. In our approach, we shall address the problem from a real-space point of view and demonstrate that the position of the FSDP (and the principal peak [32] as well) can be explained from a knowledge of the partial PCFs and their relationship with the corresponding structure factors. In particular, we shall show that the FSDP corresponds to the minimal value of for which radial correlations originating from distant atomic shells in real space interfere constructively to produce a strong intensity peak in the region of 1–2 Å-1. A direct consequence of this approach is that it can explain why certain atomic pairs (for example, Si–Si pairs in a-SiO2) contribute very little to the FSDP, due to cancellation effects of contributions from neighboring radial shells. The key purpose of this study is to develop a quantitative approach for characterizing the radial contributions (of atomic correlations) from distant atomic shells to the FSDP, and to examine the relevant length scale(s) associated with these contributions.
The rest of the paper is presented as follows. In Sec. II, we discuss the computational method employed to generate the structure of a-SiO2, using a combination of Reverse Monte Carlo and first-principles simulations. Section III discusses the results. Starting with the validation of the models, the positions of the FSDP and the principal peak are obtained by developing a simple ansatz from a knowledge of the partial PCFs. This is followed by a discussion on the origin of the FSDP and the principal peak, with particular emphasis on the contribution arising from individual radial shells of Si–Si, Si–O and O–O pairs in real space. The results are verified numerically and semi-analytically. The latter is achieved by deriving an accurate semi-analytical expression for the diffraction intensity originating from a given radial shell in the Gaussian approximation. The conclusions are presented in Sec. IV.
II Computational method
The starting point of this study is to construct a model of a-SiO2 using a combination of reverse Monte Carlo (RMC) [33, 34] and ab initio molecular dynamics (AIMD) simulations [35, 36, 37]. To this end, we begin with a 216-atom model of amorphous silicon (a-Si) with no coordination defects. This initial ‘seed’ model is used as a framework structure, which can be augmented by adding oxygen atoms in the network. The generation of a-SiO2 models in our approach thus consists of the following steps [34, 37]:
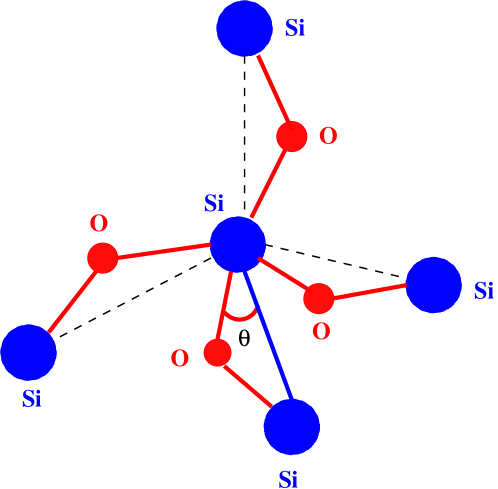
(i) The first step involves incorporation of oxygen atoms in a 216-atom a-Si network. For a given Si–Si bond, an oxygen atom was placed close to (but not at) the center of the bond so that the resulting Si–O–Si bond angle lay between 130 to 160°. This was achieved by generating a random unit vector that made an angle =10–25° with the Si–Si bond direction. An oxygen atom was then placed at a distance of approximately half of the Si–Si bond length along the unit vector. Care was taken to ensure that oxygen atoms were always placed either to the left or to the right of the four Si–Si bonds associated with a central silicon atom in order to construct an initial configuration as close as possible to the a-SiO2 geometry. This is illustrated in Fig. 1, where four oxygen atoms can be seen to appear on the right of the Si–Si bonds (viewing clockwise from above) originating from the central Si atom to produce an approximate tetrahedral unit of Si[O4]. The procedure was repeated for all Si–Si bonds in the network. The atomic positions in the resulting structure were then scaled by adjusting the length of the cubic simulation cell in order to match the mass density of the model with the experimental density of 2.2 g.cm-3 [38] of a-SiO2;
(ii) Having included the correct stoichiometry, approximate chemical ordering, topology, and geometry of the a-SiO2 structure in the network, the resulting model was subjected to RMC simulations in the second step. The RMC simulation proceeded by matching the experimental neutron-weighted total structure factor of a-SiO2 with that calculated for the model. The simulation was conducted by incorporating an additional constraint on O–Si–O bond angles and their standard deviation so that the bond-angle distribution, imposed via selective addition of oxygen atoms in the first step, could not deviate considerably from the approximate tetrahedral distribution of O–Si–O bond angles. The purpose of the RMC step here is to refine the overall radial structure of the model so that the (radial) distances between Si–O, O–O and Si–Si pairs of atoms are more or less consistent with those observed in diffraction experiments. Detailed discussions on the generation of amorphous structures using RMC simulations are given by McGreevy [33] and others [39, 40, 41, 42];
(iii) The final step of the method involves low-temperature annealing or thermalization of the RMC-refined structure at 600 K, which is followed by total-energy relaxations using density functional theory (DFT). This is to ensure that the structural information enforced into the system in the last two steps is consistent with ‘thermodynamic’ equilibrium or a strong minimum on the potential-energy surface of a-SiO2, as determined by total-energy and forces from DFT calculations. The annealing was done by conducting AIMD simulations in canonical ensembles at 600 K for a total simulation time of 5 ps using the code Siesta [43]. Siesta employs atom-centered numerical basis functions to solve the Kohn-Sham equation using the self-consistent field approximation within the framework of density functional theory (DFT). The norm-conserving pseudopotentials for silicon and oxygen atoms in the Troullier-Martins form [44] were used to describe the electron-ion interactions, and the exchange-correlation energy of the system was computed in the generalized gradient approximation (GGA) [45]. The total-energy of the thermalized/annealed models was further minimized by employing the conjugate gradient (CG) method using ab initio forces and total-energy obtained from Siesta. Throughout the calculations, we used double-zeta basis functions. The CG relaxation continued until the magnitude of the total force on each atom was less than or equal to 0.01 eV/Å.
To study the origin and structure of the FSDP and the principal peak in a-SiO2 by analyzing the radial pair correlations between constituent atoms, we assume that the disordered system is isotropic and homogeneous in nature. Following Elliott [46], the reduced scattering intensity () for such a system, consisting of atoms or scatterers, can be written as
| (1) | |||||
where is the total atomic pair-correlation function (PCF), is the average number density of the system and is the total intensity. The symbol (for =1,2) stands for the concentration-weighted average value of the -th moment of the scattering factor . Writing
| (2) |
in terms of the partial PCFs, , and noting that and are the atomic fraction and the scattering factor of atoms of type , respectively, Eq. (1) can be expressed as [46]
| (3) | |||||
In Eq. (3), is the partial interference function
and is the partial PCF between atoms of type and type . It may be noted that the coefficients and are close to each other but not identical because of the use of different denominators, and , respectively, in their definition, and . For an elemental system, Eq. (3) reduces to the well-known expression for the static structure factor
| (4) |
For our purpose, we rewrite Eq. (3) as
| (5) |
where
| (6) |
The upper limit of the integral in Eq. (6) is generally truncated and replaced by a finite cutoff value of . The latter is usually taken to be the half of the cubic simulation cell length or a value of for which = 0. The value for the present models is about 10.7 Å. For neutron scattering, the expressions in this section are valid provided that one replaces the scattering factors, , by the corresponding neutron-scattering lengths, , for -wave scattering [47, 48]. The values of and are given by 4.149 and 5.803 fm, respectively.
III Results and Discussion
III.1 Validation of structural models
Before addressing the results, we briefly examine the static structure factor of the model and compare the results with those from experiments in order to validate the model used in our calculations. For binary a-SiO2, it suffices to examine the distributions of Si–O–Si and O–Si–O bond angles, and the full structure factor for the purpose of validating a model.
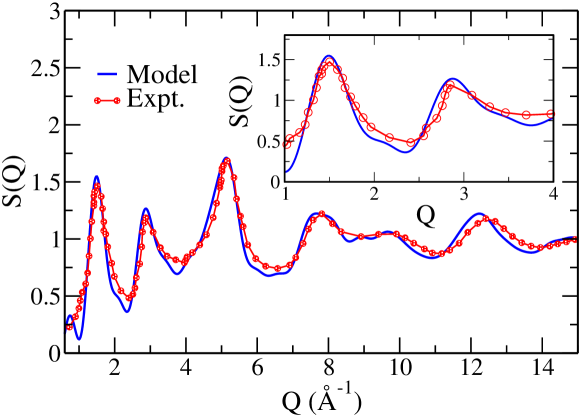
Figure 2 shows the neutron-weighted static structure factor obtained from two 648-atom models of a-SiO2. Here, has been computed following the Faber-Ziman approach [49] using Eq. (6). The corresponding experimental data for a-SiO2 from neutron diffraction measurements by Susman et al. [11] are also included in the figure. It is evident from the plots that the computed and experimental values agree well in the scattering-vector region from 0.6 to 15 Å-1. A small deviation below 1 Å-1 can be attributed to finite-size effects on obtained from small models. The presence of numerical noise in at large distances can make particularly sensitive in the small-angle region of 1 Å-1 [50] for small finite-size models.
The FSDP and the principal peak are found to be at 1.5 and 2.8 Å-1, respectively, which are shown in the figure more closely as an inset along with their experimental counterparts. The position of the FSDP at 1.5 Å-1 is also consistent with those from the X-ray diffraction measurements by Tan and Arndt [26] and MD simulations reported in the literature by others [20, 23]. The average value of the Si–O bond length is found to be 1.640.013 Å, which is a bit larger than the experimental value of 1.610.09 Å [14, 51] and 1.620.08Å from first-principles MD simulations reported in the literature [20, 37, 23]. Likewise, the average nearest-neighbor distances between Si–Si and O–O pairs are found to be 3.140.14 Å and 2.630.06 Å. These values compare well with the average Si–Si distance of 3.1 Å and the average O–O distance of 2.64 Å obtained from classical MD simulations [20, 52], and 3.12 Å and 2.65 Å, respectively, from ab initio MD simulations [37]. The computed values are close to the experimental values of Si–Si and O–O distance of 3.080.1 and 2.630.089 Å, respectively, which were obtained by Johnson et al. [51] by assuming that the radial peaks are symmetric and can be fitted by a Gaussian function [51].
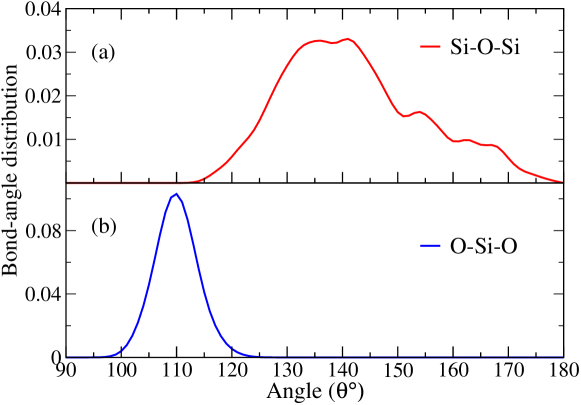
Turning to bond angles, the O–Si–O and Si–O–Si angles play a critical role in building the local structure and topology of a-SiO2, and the connectivity between SiO tetrahedra in the network. These two angles provide the relative shape and orientation of two neighboring SiO tetrahedra that form the structural basis of amorphous silica networks. The distributions of these angles are presented in Fig. 3. The average value of O–Si–O angles in this work is found to be 109.53.5°. By contrast, the Si–O–Si angles exhibit a somewhat broader distribution, with an average value of 141.512.5°. These values match closely with those from earlier MD simulation studies [23, 37, 20] and experiments [53, 51]. In particular, the Car-Parrinello simulations of a-SiO2 using 72-atom models by Sarnthein et al. [23] obtained the average values for the O–Si–O and Si–O–Si angles to be 1096° and 13615°, respectively. The corresponding experimental values from X-ray and neutron diffraction are reported to be about 109° and 140–150° [53, 51].
III.2 Chemical order in a-SiO2 and the FSDP
In studying the FSDP in network glasses, a question of considerable importance is to what extent the presence of chemical ordering between constituent atoms/species can affect the position and the intensity of the diffraction peak. It is also necessary to ascertain the characteristic length scale of radial correlations that plays the most decisive role in forming the shape of the intensity curve near the FSDP. While it is an established fact that the FSDP originates from medium-range ordering on the length scale of 5–10 Å, a quantitative characterization of the contributions arising from different radial shells and atomic species is still missing in the literature. For a binary a-SiO2 system, this entails examining the role of radial atomic correlations that originate from chemically ordered Si–Si, Si–O and O–O pairs in forming the FSDP. To address this question, we write
and
| (7) |
where is the neutron-weighted reduced atomic pair-correlation function. Equation (7) provides a convenient starting point to determine the contribution to the total FSDP arising from , or its Fourier counterpart in real space.
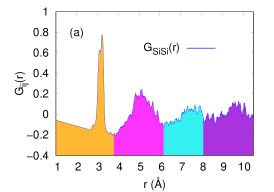
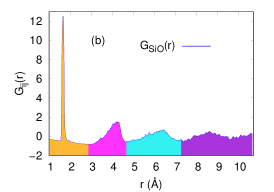
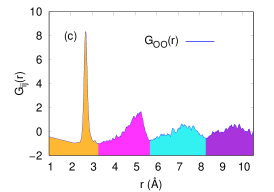
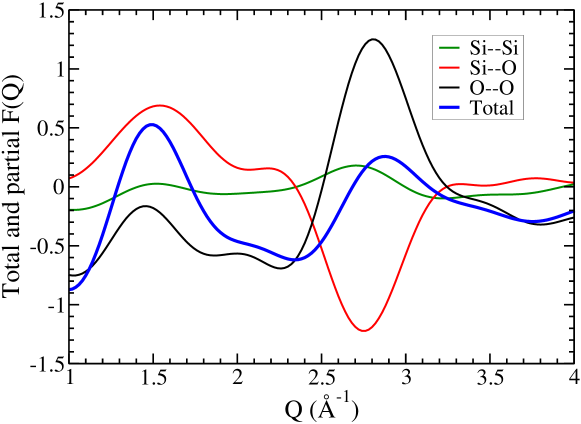
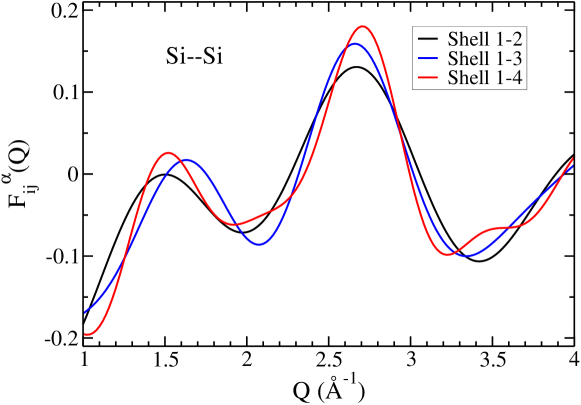
Figure 4 shows the three neutron-weighted partial PCFs, , for a-SiO2. It is apparent from the plots that neutron-weighted Si–Si correlations are considerably weaker than their Si–O and O–O counterparts, with the first two peaks of being about ten times smaller than the corresponding values of and . In view of this, it is not inapposite to surmise that the Si–Si correlations may not play a significant role in determining the overall structure of the FSDP. This surmise can be verified by computing from Eq. (7). Figure 5 shows the contribution to from its three partial components . The major contribution to the FSDP at 1.5 Å-1 can be seen to originate from the Si–O correlations, which are followed by the O–O correlations in real space. This statement applies to the principal peak near 2.8 Å-1 as well. The presence of weak Si–Si correlations, relative to the magnitude of its Si–O and O–O counterparts, produces an almost flat structure factor in the Fourier space, with two small bulges near 1.5 and 2.7 Å-1. An analysis of Eq. (7), with the aid of Fig. 4 in the next section, will reveal that the first bulge in near the FSDP arises from the second radial shell of Si–Si correlations (depicted in pink-purple color in Fig. 4a), whereas the principal peak in gets its contribution from both the first and second radial shells of silicon, extending as far as 6 Å.
By contrast, the position of the principal peak in (in Fig. 5) is determined by atomic correlations originating from , and as follows. The contribution from produces a strong peak or maximum near 2.8 Å-1 in , whereas yields an equally strong minimum near 2.76 Å-1 in . These two contributions effectively cancel out each other. The resulting intensity obtained from the sum of , and a small positive contribution from near 2.74 Å-1 produces the principal peak near 2.8 Å-1 in . It thus appears that the chemical ordering of Si–O and O–O pairs plays an important role by competing with each other in determining the final position and intensity of the principal peak in amorphous silica. On the other hand, the Si–Si pairs provide a small but nontrivial contribution to those originating from Si–O and O–O pairs. Below, we discuss this in detail by developing an ansatz to obtain the approximate positions of the FSDP and the principal peak from Eq. (7).
III.3 Origin of the FSDP and the principal peak in a-SiO2
The structural origin of the FSDP and the principal peak in a-SiO2 at 1.5 and 2.8 Å-1, respectively, can be intuitively understood from the approximate behavior of Eq. (7) and a knowledge of the partial PCFs. To this end, we rewrite Eq. (7) as
| (8) |
and postulate – following the saddle-point approximation of the integral in Eq. (8) – that the maxima (minima) of should roughly correspond to those values of for which is maximum (minimum), where the values of are given by the dominant peaks in . Noting that the position of peaks in and are very close to each other [54], and that the maxima (minima) of can be expressed in terms of the maxima (minima) of , one can write in the first-order approximation
| (9) |
where corresponds to the -th peak in and the plus (minus) sign applies to the maxima (minima). This can be shown by solving the optimality condition, , () for the maxima/minima of in terms of the solutions of or for Writing , where is a small correction, one arrives at the first-order correction via power series expansion of and for small in the expression for the optimality condition. For practical purposes, the second term in Eq. (9), which is of the order of 0.1 Å-1 [55] for a-SiO2, can be ignored and the approximate values of then read
| (10) |
The validity of the result above rests on the assumption that the first few peaks in are well defined and that they progressively decay so that the contribution from distant radial shells/peaks have a decreasing influence on the resultant FSDP and the principal peak in . For elemental systems, such as a-Si, it has been shown recently that Eq. (10) provides a good estimate of the positions of the FSDP and the principal peak [9]. However, complications can arise for multinary systems where one must take into account not only the contributions from the distant radial shells but also those that originate from different partial components of . Since the contributions from the first few peaks of different could be similar in magnitude but out of phase to varying degrees, the resultant FSDP and the principal peak may or may not appear in the vicinity of as determined by Eq. (10), due to the cancellation of out-of-phase contributions. This is apparent in Fig. 5, where the position of the principal peak is determined by the sum of the intensity from the neutron-weighted Si–Si, Si–O and O–O pair correlations in the Fourier space. The intensity from Si–O and O–O correlations cancel each other out for the most part near the principal peak, leaving behind a resulting nontrivial part that combines with the small contribution from Si–Si correlations to determine the final position and the shape of the principal peak at 2.8 Å-1. This observation suggests that a knowledge of the intensity of near the FSDP and the principal peak can be very useful in determining the exact final position of the peak in multinary systems. We shall delve into this point in the next section. For now, we focus on Eq. (10) to obtain the approximate positions of the FSDP and the principal peak of a-SiO2 with the aid of the neutron-weighted partial PCFs shown in Fig. 4.
Starting with the Si–Si PCF, one notes from Fig. 4 that the positions of the first three peaks (at ) are at 3.14, 5.1 and 7.7 Å, respectively. Following Eq. (10), the first radial peak at 3.14 Å is expected to produce a peak at 2.5 Å-1 (for = 1) in the Si–Si partial structure factor. Likewise, the second radial peak at 5.1 Å should produce peaks at 1.54 and 2.77 Å-1 for = 1,2, respectively. A similar calculation for the third radial peak at 7.7 Å suggests that a peak should appear at 1.83 Å-1 (for =2) and 2.65 Å-1 (for =3). An examination of the Si–Si partial structure factor in Fig. 5 does confirm the presence of peaks near 1.5 and 2.7 Å-1. In view of this observation, it is apposite to conclude that the Si–Si principal peak near 2.7 Å-1 in Fig. 5 gets its contribution mostly from the second and third Si–Si radial shells, whereas only the second shell contributes to the FSDP near 1.5 Å-1. The weak intensity associated with these peaks can be attributed to the relatively small values of neutron-weighted (compared to its Si–O and O–O counterparts), the largest absolute value of which over the entire radial range is found to be less than unity in Fig. 4a.
The foregoing analysis applies to the O–O pairs as well. Figure 4c shows that the first three peaks in appear at 2.65, 5.2 and 7.2 Å. Following the same reasoning as before, the first radial peak at 2.65 Å should give rise to a peak at 2.96 Å-1 (for = 1) and the second radial peak at 5.2 Å leads to 1.51 and 2.72 Å-1 in for =1,2, respectively. Similarly, the third peak at 7.2 Å is expected to produce peaks at 1.96 and 2.83 Å-1 for = 2,3, respectively. A comparison of the results with in Fig. 5 shows that the suggested peaks appear near 1.5 and 2.8 Å-1, including a weak quasi-peak near 2 Å-1. Table 1 lists the approximate positions of the FSDP and the principal peak of and obtained from using Eq. (10) and the location of the first three radial peaks of and . The values of that contribute to the FSDP and the principal peak are highlighted in Table 1 in orange and green colors, respectively.
The case for Si–O correlations is a bit confusing, however. In contrast to and , there is no principal peak or maximum in but a minimum near 2.8 Å-1 (see Fig. 5). The preceding argument works well to determine this minimum using the position of the minima obtained from Eq. (10). In particular, the first three peaks of , appearing at 1.65, 4.27 and 6.4 Å, are expected to produce three minima at 2.86 Å-1 (for = 1), 2.58 Å-1 (for = 2) and 2.7 Å-1 (for = 3), respectively. The combined effect of these minima is expected to reflect in by producing a strong minimum near 2.8 Å-1. Figure 5 does corroborate this expectation. We shall further confirm this observation using numerical results in Sec. IIID. However, the argument appears to fail in locating the FSDP of at 1.5 Å-1. Equation (10) suggests that the second radial shell should produce a peak at 1.84 Å-1 (for = 1) and for the third shell at 1.23 Å-1 (for =1). But none of these positions is close enough to the observed peak at 1.5 Å-1 in Fig. 5. Should we consider the fourth radial shell (with a peak at 8.6 Å in Fig. 4b), we get peaks in at 0.91 Å-1 (for =1) and 1.64 Å-1 (for =2). But without a knowledge of the intensity of these peaks, it is not clear whether the peaks would coalesce into a single peak at 1.5 Å-1 or not. The approximate positions of the maxima and minima of obtained from using Eq. (10) for the first four radial peaks are listed in Table 2.
| Si–Si () | O–O () | ||||||
| 3.14 Å | 5.1 Å | 7.7 Å | 2.65 Å | 5.2 Å | 7.2 Å | ||
| 1 | 2.5 | \cellcolorPeach 1.54 | 1.02 | \cellcolorYellowGreen 2.96 | \cellcolorPeach 1.51 | 1.1 | |
| 2 | 4.5 | \cellcolorYellowGreen 2.77 | 1.83 | 5.33 | \cellcolorYellowGreen 2.72 | 1.96 | |
| 3 | 6.5 | 4.0 | \cellcolorYellowGreen 2.65 | 7.7 | 3.93 | \cellcolorYellowGreen 2.83 | |
The discrepancy observed above concerning the position of the estimated FSDP in cannot be satisfactorily explained using the qualitative argument [based on Eq. (10)] presented so far in this section. At this point, it suffices to mention that the anomaly can be resolved by noting that the peak at 1.23 Å-1 originating from the third shell interferes constructively with those at 1.84 Å-1 from the second shell and at 1.64 Å-1 from the fourth shell (see Table 2) to produce the FSDP at 1.5 Å-1. In the next two sections, we address this issue by numerical and semi-analytical calculations, and examine the observed behavior of with reference to neutron-weighted atomic pair correlations arising from individual radial shells of the partial PCFs of a-SiO2.
| Si – O () | |||||||||
|---|---|---|---|---|---|---|---|---|---|
| 1.65 Å | 4.27 Å | 6.4 Å | 8.6 Å | 1.65 Å | 4.27 Å | 6.4 Å | 8.6 Å | ||
| (maxima) | (minima) | ||||||||
| 1 | 4.76 | \cellcolorPeach 1.84 | \cellcolorPeach 1.23 | 0.91 | \cellcolorYellowGreen 2.86 | 1.1 | 0.74 | 0.54 | |
| 2 | 8.57 | 3.31 | 2.21 | \cellcolorPeach 1.64 | 6.66 | \cellcolorYellowGreen 2.58 | 1.72 | 1.28 | |
| 3 | 12.37 | 4.78 | 3.19 | 2.37 | 10.47 | 4 | \cellcolorYellowGreen 2.7 | 2 | |
| 4 | 16.18 | 6.25 | 4.17 | 3.1 | 14.28 | 5.52 | 3.68 | \cellcolorYellowGreen 2.74 | |
III.4 Relation between radial correlations, the FSDP and principal peak
In the preceding section, we have seen that the position of the FSDP and the principal peak can be obtained – except for the FSDP in – from a heuristic argument based on the qualitative behavior of the integral in Eq. (8) and the position of the radial peaks in . The argument tacitly assumed that the function can be locally replaced by a sufficiently narrow pair-distribution function or a function at the maximum of each radial shell in the zeroth-order approximation. This consideration leads to a reasonable estimate of the position of the maxima/minima in the corresponding partial structure factor, but not the intensity of the peaks/dips. We now examine the accuracy of the position of maxima/minima obtained earlier by numerical calculations and study the radial contribution originating from the individual shells of .
To obtain the shell-by-shell contribution from the real-space PCFs, it is convenient to write
| (11) | |||||
Here, the Greek index indicates the shell number and the pair of lengths gives the radial range of the -th shell for the -th partial PCF, . The set is so chosen that it spans the entire radial range of the corresponding PCF from 0 to . Table 3 lists the pair of values () for the -th shell of . We now use these values of to calculate the radial contribution of the partial PCFs to the intensity of the corresponding from individual radial shells. Our discussion is mostly confined to Si–O and O–O pair correlations as these two pairs have been found to play a key role in forming the FSDP and the principal peak (cf. Fig. 5). This is followed by a brief mention of Si–Si correlations, which provide small corrections to the intensity of the FSDP/principal peak of the full .
| PCF | Shell number | |||||||
|---|---|---|---|---|---|---|---|---|
| = 1 | = 2 | = 3 | = 4 | |||||
| Si–Si | (0, 3.8) | (3.8, 6.2) | (6.2, 8.1) | (8.1, 10.7) | ||||
| Si–O | (0, 2.4) | (2.4, 4.6) | (4.6, 7.4) | (7.4, 10.7) | ||||
| O–O | (0, 3.3) | (3.3, 5.7) | (5.7, 8.3) | (8.3, 10.7) | ||||
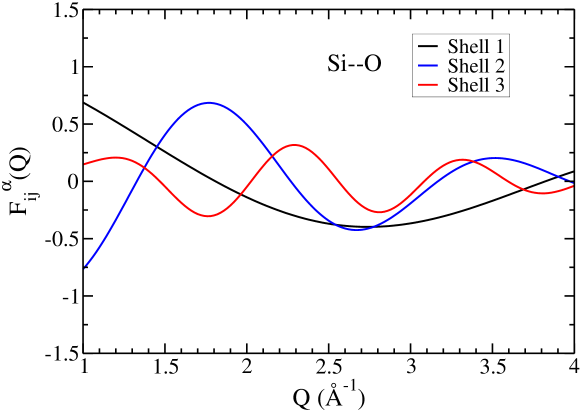
Figure 6 shows the partial structure factor obtained by numerically integrating Eq. (11) for the first three individual shells (for =1 to 3) using the values listed in Table 3. The results show that shell 2 produces maxima at 1.8 and 3.52 Å-1, and shell 3 produces maxima at 1.2, 2.3, and 3.32 Å-1. These values are quite close to the estimated values of the maxima listed in Table 2 from the respective shells. Similarly, the minima from shell 2 and 3 in Fig. 6 correspond to 2.68 Å-1, and 1.76, 2.8 and 3.8 Å-1, respectively. Once again, these values are close to the estimated values of 2.58 Å-1, and 1.72, 2.7 and 3.68 Å-1, respectively, as listed in Table 2. By contrast, the contribution from shell 1 provides a monotonic decrease of the intensity with an increasing value of near the FSDP. The first shell does not produce any maximum in the region between 1 to 4 Å-1 but a minimum at 2.74 Å-1, which is estimated to be 2.86 Å-1 in Table 2. The latter is very close to the exact numerical value of 2.74 Å-1, when one takes into account the perturbative correction of about 0.128 Å-1 for this peak [55].
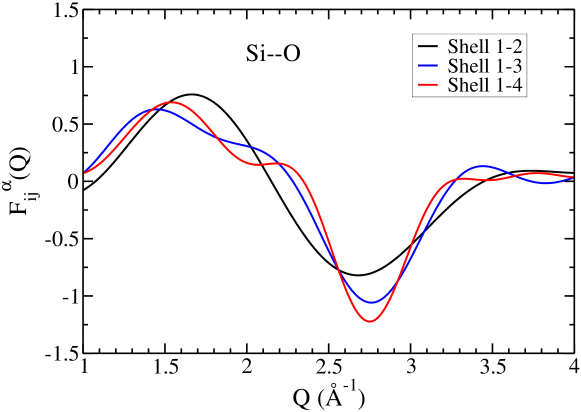
The observations above suggest that the approximate positions of the maxima (peaks) and minima (dips) in Fig. 6 can be obtained quite accurately from the heuristic argument presented in Sec. IIIC using Eq. (10). These maxima and minima collectively lead to the formation of the FSDP and the principal minimum in . The net effect of the contributions from different radial shells to the FSDP and the principal minimum is shown in Fig. 7, where obtained from the first two, first three and first four radial shells are presented. The buildup of the FSDP near 1.5 Å-1 is evident from the plots. The resultant obtained from all radial shells up to 10.7 Å evolves to produce the FSDP near 1.5 Å-1 and a minimum near 2.8 Å-1. As stated earlier, there is no principal peak or maximum in in Fig. 7 but a minimum near 2.8 Å-1. This minimum contributes negatively to form the principal peak in total along with the positive contributions from and near 2.8 Å-1.
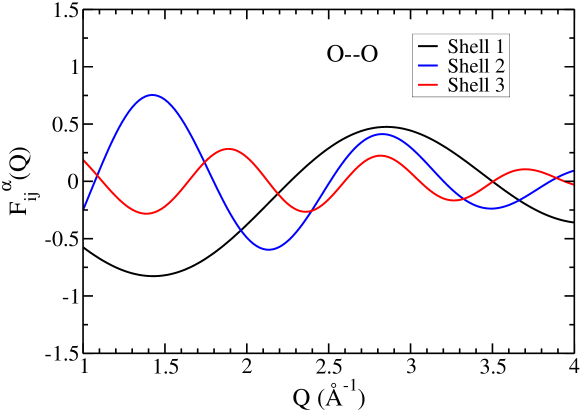
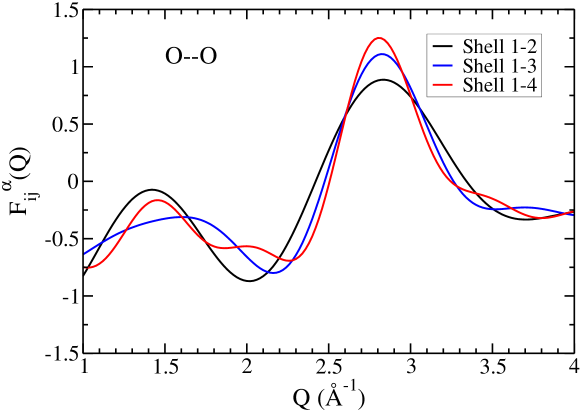
A similar analysis of O–O correlations reveals that the approximate locations of the FSDP and the principal peak in are correctly obtained in Sec. IIIC. Figure 8 presents the contribution from the first three individual radial shells of . The results show the presence of two maxima at 1.42 and 2.82 Å-1 originating from the second shell. The corresponding estimated values of the maxima are found to be 1.51 and 2.72 Å-1, respectively. Likewise, the first shell and the third shell each produces a peak at 2.86 and 2.82 Å-1, respectively, which are very close to the estimated values of 2.96 and 2.83 Å-1 listed in Table 1. The overall effect of the contribution from distant radial shells can be seen in Fig. 9, where the intensities obtained from the first two, first three and first four radial shells of O–O pair correlations are presented. It is apparent from Fig. 9 that the first two shells can produce the intensity and shape of the FSDP and the principal peak [in ] almost correctly in the vicinity of 1.5 and 2.8 Å-1, respectively. The contributions from the third and fourth shells then refine the shape of the intensity curve and add small corrections to the intensity and position of the FSDP and the principal peak.
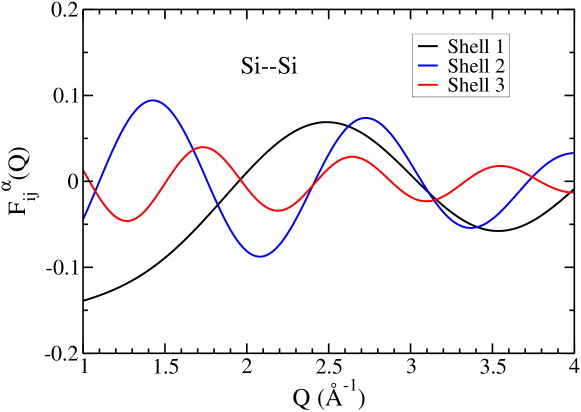
Similar observations can be made for as well. The results for this case are plotted in Figs. 10–11. An inspection of the plots in Fig. 10 suggests that, although the individual contributions from the first three shells of are not negligible in magnitude, the resultant contribution is quite small near the FSDP. This is evident from Fig. 11, where is found to be considerably smaller (by a factor of about 10) than its Si–O and O–O counterparts in the vicinity of the FSDP. The neutron-weighted Si–Si correlations thus provide only a small correction to the resultant position and the intensity of the FSDP in a-SiO2. This statement also applies to the principal peak to a lesser extent, where the peak height near 2.7 Å-1 (in Fig. 11) can be seen to increase by a small amount as the radial correlations from the third and fourth shells are taken into account.
We conclude this section by making the following remarks. Firstly, the FSDP in is primarily determined by neutron-weighted atomic correlations originating from the first two radial shells of involving a length scale of about 6 Å. The information from the third and fourth shells then adds perturbative corrections to the intensity and shape of the FSDP. By contrast, the principal peak in involves contributions from the first three shells with atomic correlations extending up to 9 Å. The inclusion of radial information from the fourth shell makes a small correction to the height/intensity of the principal peak. Secondly, the Si–O correlations from all the four shells (extending up to 10 Å) contribute to the intensity of the FSDP in . With the exception of the first shell, each of the remaining three shells produces a peak in the scattering region of 1.2–1.85 Å-1. These peaks combine with the minima from the second, third, and fourth (not shown in Fig. 6) shells to form the FSDP near 1.5 Å-1. The involvement of the first shell is to provide a background correction to the FSDP. Thirdly, the principal minimum in in the vicinity of 2.8 Å-1 largely depends on the radial correlations from the first three shells, which are supplemented by a small correction from the fourth shell. This minimum effectively cancels out the scattering intensity that originates from the neutron-weighted O–O pair correlations. The Si–Si correlations then provide a small but crucial contribution (of about 2 part in 10) in the vicinity of the resultant principal peak at 2.8 Å-1, but its contribution toward the intensity of the FSDP is practically negligible (cf. Figs. 5 and 11).
III.5 Intensity of the FSDP and the principal peak: A Gaussian approximation
Having numerically verified the approximate positions of the FSDP and the principal peak, and noting the importance of contributions from different partial components of the structure factor to the FSDP, we now obtain an analytical expression for the intensity of that arises from a given shell. Earlier, in Sec. IIIC, we have shown that the approximate position of the peaks in , originating from a given radial shell, can be obtained by placing a sufficiently narrow distribution or a function at the center of the radial shell. However, the calculation of the intensity of the FSDP (or any diffraction peaks in general) requires a more sophisticated approach. To this end, the -function approximation can be significantly improved by replacing the function with a more realistic distribution, which can be represented by a linear combination of suitable radial basis functions. Assuming that the individual radial shells of are Gaussian representable [56], one can approximate the intensity due to the -th shell from Eq. (11) as
| (12) | |||||
where , the symbol indicates that the integration is to be carried out from to , and can be expressed as a linear combination of Gaussian functions
In general, the radial distribution of atoms in the first shell of , which is not symmetric [51], can be well approximated by using a few Gaussian functions but the distant shells require several Gaussian functions in order to produce the distribution accurately within the region of and with correct boundary conditions. An analytical expression for can be obtained by evaluating the integrals in Eq. (12). The first integral is of the type
| (13) |
which cannot be evaluated analytically in a closed form without the use of error functions. However, it is possible to choose a suitable set of narrow Gaussian functions, , which are characterized by large , such that the functions decay to zero sufficiently fast before they reach the boundary points and . This can be achieved by ensuring that all satisfy the condition [57]
| (14) |
Under this condition, it is possible to obtain an analytical expression for in Eq. (13). The calculation of is presented in the Appendix. The second integral , involving , can be analytically calculated. The two integrals can be written as
| (15) |
and
| (16) |
An analytical expression for is thus obtained by substituting the results from Eqs. (15) and (16) to Eq. (12) for the -th radial shell that ranges from to . The Gaussian parameters , where satisfies the condition in Eq. (14), for a given can be obtained by fitting the functions with the corresponding . It may be noted that the Gaussian representation of distant radial shells beyond the first shell is highly nontrivial due to the presence of sharp cutoffs of with finite values at and . The existence of finite values of at the boundaries require that the Gaussian coefficients – especially those associated with the Gaussians functions centered near the boundary – must be sufficiently large for Eq. (15) to be valid. In this study, we have employed a constrained Monte Carlo approach to obtain the desired values of that simultaneously reproduce within the radial region of interest and satisfy the inequality in Eq. (14) for all .
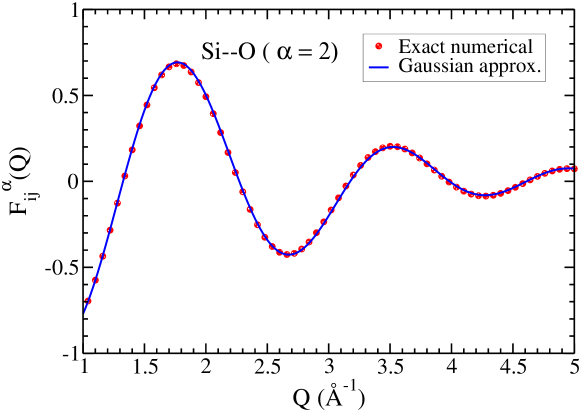
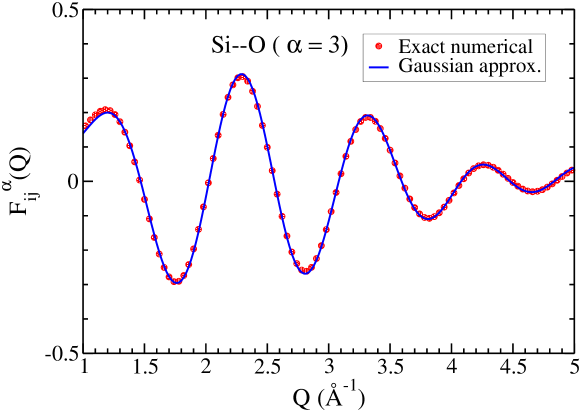
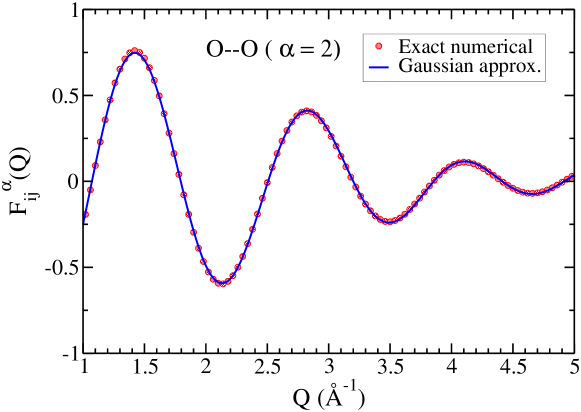
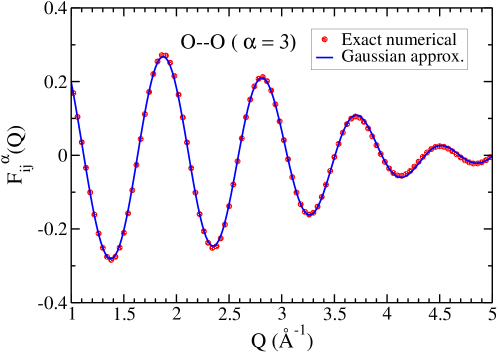
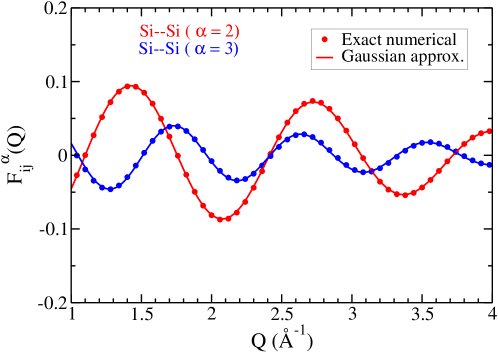
The efficacy of the Gaussian approximation can be examined by comparing the results obtained from Eq. (12) with those from direct numerical calculations using the radial range of the shells given in Table 3. Figures 12 and 13 show the results for for and 3, respectively. It is evident from the figures that the Gaussian approximation can accurately reproduce the exact numerical results. The contributions to the FSDP and the principal peak are correctly obtained from Eq. (12) for the second and third shells. Likewise, the results for the Gaussian approximation of in Figs. 14 and 15, for and 3, respectively, closely match with those from direct numerical calculations. A similar observation applies to Fig. 16, where the intensity plots of for are presented. The diffraction intensity obtained from Eq. (12) using the Gaussian approximation of the (partial) pair-correlation functions and the positions of the FSDP and the principal peak estimated from Eq. (10) provide a complete picture of the origin and structure of the FSDP and the principal peak in terms of the real-space two-body distributions of silicon and oxygen atoms in the radial shells of a-SiO2.
IV Conclusions
In this paper, we have studied the origin and structure of the FSDP in a-SiO2 with particular emphasis on the role of chemical and radial ordering between Si–Si, Si–O and O-O pairs. The study leads to the following observations.
An examination of the partial structure factors of a-SiO2 shows that neutron-weighted Si–O and O–O pair correlations on the length scale of 5-8 Å contribute mostly to the formation of the FSDP, whereas Si–Si correlations (from the third and fourth shells) provide only small corrections to the peak position and the intensity in the vicinity of the peak. The latter is consistent with the relatively weak neutron-weighted Si–Si pair correlations, which are found to be approximately ten times smaller than the corresponding values of Si–O and O–O correlations in the respective PCFs.
An approximate relationship between the position of the FSDP (in the partial structure factors) and the radial peak positions (in the corresponding partial PCFs) is obtained from the saddle-point approximation of the structure-factor integral involving . The results from this approximation are verified using numerical and semi-analytical calculations. A natural corollary of the results is that the FSDP is found to be sensitive to the pair correlations arising from a few specific radial shells. In particular, the first two shells of O–O pairs, extending as far as 6 Å, and the first three shells of Si–O pairs, with atomic correlations of up to 7 Å, are observed to play a significant role in forming the position and the intensity of the FSDP in a-SiO2. By contrast, the shape of the intensity curve near the FSDP is perturbatively modified by radial correlations originating from the remaining shells of Si–O and O–O pairs. These results are consistent with those obtained from using the continuous wavelet transform [24] of the PCFs showing that Si–O–Si–O (i.e, the second shell of Si–O pairs) and O–Si–O–Si–O (i.e., the second shell of O–O pairs) correlations contribute significantly in the formation of the FSDP in a-SiO2. Likewise, the principal peak is found to depend mostly on the contribution from the Si–O and O–O pairs, and a small contribution from Si–Si pairs. The positive contribution from the O–O pairs and the negative contribution from the Si–O pairs near the principal peak competes with each other and largely cancels out. The final position and intensity of the principal peak is thus determined by the resultant contribution of Si–O and O–O pairs, and a small but nontrivial contribution of Si–Si pairs.
The study yields an accurate semi-analytical expression for the diffraction intensity of a binary glass originating from a given radial shell of the partial PCFs using a Gaussian approximation of the latter. The validity of the approximation is confirmed by directly comparing the results with those from exact numerical calculations. The approximation is independent of the nature of amorphous solids and it can be applied to both elemental and multi-component systems. The expression is found to be particularly useful for a complete characterization of the contributions emanating from each radial shell (of the PCFs) to the FSDP, and to obtain quantitative values of relevant radial length scales that form the basis of medium-range ordering in a-SiO2. The results can be readily generalized and employed to other network glasses.
*
Appendix A Approximation of
In this section, we obtain an approximate analytical expression for the integral above when the function is Gaussian representable and it satisfies a certain condition. Expressing as a linear combination of Gaussian functions, the integral can be written as
| (17) |
where the coefficients parameterize the Gaussian basis sets. Substituting and expanding , one obtains
where
| (18) |
The upper and lower limits of the integrals in (18) are given by and , respectively. In general, the integrals in Eq. (18) cannot be expressed in a closed form without using error functions. However, if the value of can be chosen in such a way that , where , then the function inside the integrals decays sufficiently rapidly within the interval and the upper and lower limits of the integrals can be replaced by + and -, respectively. Under this condition, the odd integrals vanish and one is left with
| (19) | |||||
Equation 19 involves two standard integrals, which are given by
and
Collecting all the results, the original integral can be approximated as
| (20) |
Writing , the condition of validity of the result in Eq. (20) can be stated as for all , , and . The validity of this expression has been verified by numerical experiments.
References
- Wright et al. [1991] A. C. Wright, R. A. Hulme, D. I. Grimley, R. N. Sinclair, S. W. Martin, D. L. Price, and F. L. Galeener, The structure of some simple amorphous network solids revisited, Journal of Non-Crystalline Solids 129, 213 (1991).
- Wright [1994] A. C. Wright, Neutron scattering from vitreous silica. v. the structure of vitreous silica: What have we learned from 60 years of diffraction studies?, Journal of Non-Crystalline Solids 179, 84 (1994), Proceedings of the First PAC RIM Meeting on Glass and Optical Materials.
- Elliott [1991a] S. R. Elliott, Medium range structural order in covalent amorphous solids, Nature 354, 445 (1991a).
- Salmon [2007] P. S. Salmon, The structure of tetrahedral network glass forming systems at intermediate and extended length scales, Journal of Physics: Condensed Matter 19, 455208 (2007).
- Zang and Kob [2020] Z. Zang and W. Kob, Revealing the three-dimensional structure of liquids using four-point correlation functions, PNAS 117, 14032 (2020).
- Zhou et al. [2021] Q. Zhou, Y. Shi, B. Deng, T. Du, L. Guo, M. M. Smedskjaer, and M. Bauchy, Revealing the medium-range structure of glassy silica using force-enhanced atomic refinement, Journal of Non-Crystalline Solids 573, 121138 (2021).
- Shi and Tanaka [2019] R. Shi and H. Tanaka, Distinct signature of local tetrahedral ordering in the scattering function of covalent liquids and glasses, Science Advances 5, eaav3194 (2019).
- Uhlherr and Elliott [1995] A. Uhlherr and S. R. Elliott, Generation of the first sharp diffraction peak by extended-range ordering of atoms and voids in amorphous silicon, Philos. Mag. B 71, 611 (1995).
- Dahal et al. [2021] D. Dahal, H. Warren, and P. Biswas, On the origin and structure of the first sharp diffraction peak of amorphous silicon, physica status solidi (b) 258, 2000447 (2021).
- Inamura et al. [2004] Y. Inamura, Y. Katayama, W. Utsumi, and K.-i. Funakoshi, Transformations in the intermediate-range structure of SiO2 glass under high pressure and temperature, Phys. Rev. Lett. 93, 015501 (2004).
- Susman et al. [1991a] S. Susman, K. J. Volin, D. G. Montague, and D. L. Price, Temperature dependence of the first sharp diffraction peak in vitreous silica, Phys. Rev. B 43, 11076 (1991a).
- Susman et al. [1991b] S. Susman, K. J. Volin, D. L. Price, M. Grimsditch, J. P. Rino, R. K. Kalia, P. Vashishta, G. Gwanmesia, Y. Wang, and R. C. Liebermann, Intermediate-range order in permanently densified vitreous SiO2: A neutron-diffraction and molecular-dynamics study, Phys. Rev. B 43, 1194 (1991b).
- Fischer-Colbrie et al. [1988] A. Fischer-Colbrie, A. Bienenstock, P. H. Fuoss, and M. A. Marcus, Structure and bonding in photodiffused amorphous Ag-GeSe2 thin films, Phys. Rev. B 38, 12388 (1988).
- Mei et al. [2008] Q. Mei, C. J. Benmore, S. Sen, R. Sharma, and J. L. Yarger, Intermediate range order in vitreous silica from a partial structure factor analysis, Phys. Rev. B 78, 144204 (2008).
- Crupi et al. [2015] C. Crupi, G. Carini, M. González, and G. D’Angelo, Origin of the first sharp diffraction peak in glasses, Phys. Rev. B 92, 134206 (2015).
- Zanatta et al. [2014] M. Zanatta, G. Baldi, R. S. Brusa, W. Egger, A. Fontana, E. Gilioli, S. Mariazzi, G. Monaco, L. Ravelli, and F. Sacchetti, Structural evolution and medium range order in permanently densified vitreous SiO2, Phys. Rev. Lett. 112, 045501 (2014).
- Tanaka [1998] K. Tanaka, Medium-range structure in chalcogenide glasses, Japanese Journal of Applied Physics 37, 1747 (1998).
- Shi et al. [2019] Y. Shi, J. Neuefeind, D. Ma, K. Page, L. A. Lamberson, N. J. Smith, A. Tandia, and A. P. Song, Ring size distribution in silicate glasses revealed by neutron scattering first sharp diffraction peak analysis, Journal of Non-Crystalline Solids 516, 71 (2019).
- Salmon et al. [2023] P. S. Salmon, A. Zeidler, M. Shiga, Y. Onodera, and S. Kohara, Ring compaction as a mechanism of densification in amorphous silica, Phys. Rev. B 107, 144203 (2023).
- Vashishta et al. [1990] P. Vashishta, R. K. Kalia, J. P. Rino, and I. Ebbsjö, Interaction potential for SiO2: A molecular-dynamics study of structural correlations, Phys. Rev. B 41, 12197 (1990).
- Elliott [1992] S. R. Elliott, The origin of the first sharp diffraction peak in the structure factor of covalent glasses and liquids, J. Phys.: Condens. Matter 4, 7661 (1992).
- Elliott [1991b] S. R. Elliott, Origin of the first sharp diffraction peak in the structure factor of covalent glasses, Phys. Rev. Lett. 67, 711 (1991b).
- Sarnthein et al. [1995] J. Sarnthein, A. Pasquarello, and R. Car, Structural and electronic properties of liquid and amorphous SiO2: An ab initio molecular dynamics study, Phys. Rev. Lett. 74, 4682 (1995).
- Uchino et al. [2005] T. Uchino, J. D. Harrop, S. N. Taraskin, and S. R. Elliott, Real and reciprocal space structural correlations contributing to the first sharp diffraction peak in silica glass, Phys. Rev. B 71, 014202 (2005).
- Kobayashi et al. [2023] K. Kobayashi, M. Okumura, H. Nakamura, M. Itakura, M. Machida, S. Urata, and K. Suzuya, Machine learning molecular dynamics reveals the structural origin of the first sharp diffraction peak in high-density silica glasses, Scientific Reports 13, 18721 (2023).
- Tan and Arndt [1999] C. Tan and J. Arndt, X-ray diffraction of densified silica glass, Journal of Non-Crystalline Solids 249, 47 (1999).
- Gaskell and Wallis [1996] P. H. Gaskell and D. J. Wallis, Medium-range order in silica, the canonical network glass, Phys. Rev. Lett. 76, 66 (1996).
- Price et al. [1989] D. L. Price, S. C. Moss, R. Reijers, M. L. Saboungi, and S. Susman, Intermediate-range order in glasses and liquids, Journal of Physics: Condensed Matter 1, 1005 (1989).
- Massobrio and Pasquarello [2001] C. Massobrio and A. Pasquarello, Origin of the first sharp diffraction peak in the structure factor of disordered network-forming systems: Layers or voids?, J. Chem. Phys. 114, 7976 (2001).
- Bhatia and Thornton [1970] A. B. Bhatia and D. E. Thornton, Structural aspects of the electrical resistivity of binary alloys, Phys. Rev. B 2, 3004 (1970).
- Blétry [1990] J. Blétry, Sphere and distance models for binary disordered systems, Philosophical Magazine B 62, 469 (1990).
- Elliott [1995] S. R. Elliott, Second sharp diffraction peak in the structure factor of binary covalent network glasses, Phys. Rev. B 51, 8599 (1995).
- McGreevy [2001] R. L. McGreevy, Reverse Monte Carlo modelling, J. Phys.: Condens. Matter 13, R877 (2001).
- Pandey et al. [2015] A. Pandey, P. Biswas, and D. A. Drabold, Force-enhanced atomic refinement: Structural modeling with interatomic forces in a reverse Monte Carlo approach applied to amorphous Si and SiO2, Phys. Rev. B 92, 155205 (2015).
- Marx and Hutter [2009] D. Marx and J. Hutter, Ab Initio Molecular Dynamics: Basic Theory and Advanced Methods (Cambridge University Press, Cambridge, UK, 2009).
- Drabold et al. [1990] D. A. Drabold, P. A. Fedders, O. F. Sankey, and J. D. Dow, Molecular-dynamics simulations of amorphous Si, Phys. Rev. B 42, 5135 (1990).
- Tafen and Drabold [2003] D. N. Tafen and D. A. Drabold, Realistic models of binary glasses from models of tetrahedral amorphous semiconductors, Phys. Rev. B 68, 165208 (2003).
- Mazurin et al. [1983] O. V. Mazurin, M. V. Streltsina, and T. P. Shvaiko-Shvaikovskaya, Handbook of Glass Data Part A: Silica Glass and Binary Silicate Glasses; (Elsevier, Amsterdam, 1983).
- Limbu et al. [2020] D. K. Limbu, S. R. Elliott, R. Atta-Fynn, and P. Biswas, Disorder by design: A data-driven approach to amorphous semiconductors without total-energy functionals, Sci. Rep. 10, 7742 (2020).
- Biswas et al. [2004] P. Biswas, R. Atta-Fynn, and D. A. Drabold, Reverse Monte Carlo modeling of amorphous silicon, Phys. Rev. B 69, 195207 (2004).
- Keen and McGreevy [1990] D. A. Keen and R. L. McGreevy, Structural modelling of glasses using reverse Monte Carlo simulation, Nature 344, 423 (1990).
- Opletal et al. [2013] G. Opletal, T. C. Petersen, I. K. Snook, and S. P. Russo, HRMC_2.0: Hybrid Reverse Monte Carlo method with silicon, carbon and germanium potentials, Comp. Phys. Comm. 184, 1946 (2013).
- Soler et al. [2002] J. M. Soler, E. Artacho, J. D. Gale, A. Garciá, J. Junquera, P. Ordejón, and D. Sánchez-Portal, The siesta method for ab initio order- n materials simulation, J. Phys. Condens. Matter 14, 2745 (2002).
- Troullier and Martins [1991] N. Troullier and J. L. Martins, Efficient pseudopotentials for plane-wave calculations, Phys. Rev. B 43, 1993 (1991).
- Perdew et al. [1996] J. P. Perdew, K. Burke, and M. Ernzerhof, Generalized gradient approximation made simple, Phys. Rev. Lett. 77, 3865 (1996).
- Elliott [1990] S. R. Elliott, Physics of Amorphous Materials, 2nd ed. (Longman, London, 1990).
- Cusack [1987] N. E. Cusack, The Physics of Structurally Disordered Matter (Adam Hilger/IOP Publishing Ltd., Bristol, UK, 1987).
- Bacon [1975] G. E. Bacon, Neutron Diffraction (Clarendon Press., Oxford, 1975).
- Faber and Ziman [1965] T. E. Faber and J. M. Ziman, A theory of the electrical properties of liquid metals, The Philosophical Magazine 11, 153 (1965).
- [50] The use of periodic boundary conditions and finite-size models of linear dimension leads to a lower cutoff value of . For Å-1, can be written as a polynomial in , where the coefficients of the polynomial are given by the power moments of . These moments are sensitive to numerical noise in at large distances, causing artifacts to appear in near .
- Johnson et al. [1983] P. A. Johnson, A. C. Wright, and R. N. Sinclair, Neutron scattering from vitreous silica ii. twin-axis diffraction experiments, Journal of Non-Crystalline Solids 58, 109 (1983).
- Erhard et al. [2022] L. C. Erhard, J. Rohrer, K. Albe, and V. L. Deringer, A machine-learned interatomic potential for silica and its relation to empirical models, npj Computational Materials 8, 90 (2022).
- Mozzi and Warren [1969] R. L. Mozzi and B. E. Warren, The structure of vitreous silica, Journal of Applied Crystallography 2, 164 (1969).
- [54] Assuming is Gaussian representable, the peak positions in and are separated by , where and are the Gaussian peak and width of the -th radial shell of , respectively. Thus, the approximation holds for , which is always satisfied by a well-defined radial shell. The presence of linear and quadratic shifts of in and , respectively, slightly modify this estimate.
- [55] The maximal value of the perturbative correction is obtained for = 1 and = 1.65 Å in Eq. (9). This gives a value of 0.077 Å-1 for a maximum and 0.128 Å-1 for a minimum. For distant radial peaks and 1, the correction can be ignored.
- Dahal et al. [2022] D. Dahal, S. R. Elliott, and P. Biswas, Extended-range order in tetrahedral amorphous semiconductors: The case of amorphous silicon, Phys. Rev. B 105, 115203 (2022).
- [57] Noting that a Gaussian function decays to almost zero at a distance of from the center, a sharper upper bound for (=) can be stated as .