The long-term and disparate impact of job loss on individual mobility behaviour
Abstract
In today’s interconnected world of widespread mobility, ubiquitous social interaction, and rapid information dissemination, the demand for individuals to swiftly adapt their behaviors has increased dramatically. Timely decision-making faces new challenges due to the necessity of using finely temporal-resolved anonymised individual data to keep up with fast-paced behavioural changes. To tackle this issue, we propose a general framework that leverages privacy-enhanced GPS data from mobile devices alongside census information to infer the employment status of individuals over time. By analysing the mobility patterns of employed and unemployed individuals, we unveil significant differences in behaviours between the two groups, showing a contraction in visited locations and a general decline in the exploratory behaviour of unemployed individuals. Remarkably, these differences intensify over time since job loss, particularly affecting individuals from more vulnerable demographic groups. These findings highlight the importance of early monitoring of unemployed individuals who may face enduring levels of distress. Overall, our findings shed light on the dynamics of employment-related behaviour, emphasizing the importance of implementing timely interventions to support the unemployed and vulnerable populations.
keywords:
Human mobility, Unemployment, GPS data, Geospatial intelligenceIntroduction
Economic and human behavioural statistics are crucial for effective decision-making. Large-scale population surveys have been invaluable in observing economic shocks and their implications. For example, unemployment data serve as a vital indicator of an economy’s health and performance [1]: when workers become unemployed, it affects their well-being and that of their families, it diminishes their purchasing power, and impacts the overall economy. However, the conventional method of relying on surveys to monitor unemployment rates at the national level faces significant challenges, especially in developing countries [2, 3]. Even in developed nations, the reliability of traditional unemployment surveys is threatened as participation rates continue to decline, introducing a concerning element of inaccuracy into the analytical process [4, 5].
Amidst these challenges, a transformative shift has emerged through the utilization of large-scale behavioural data collected from technologies like mobile phones, GPS trackers, social media platforms, and credit cards. This shift not only addresses the limitations of conventional survey methods but also unlocks new opportunities for gaining quantitative insights into social and behavioural sciences. These datasets offer unprecedented breadth and depth to the field and have been instrumental in advancing research in human mobility [6, 7, 8, 9], financial well-being and purchase behaviour [10, 11, 12, 13, 14, 15], segregation and economic inequalities [16, 17, 18, 19, 20], crime [21, 22, 23] and public health [24, 25, 26, 27, 23].
Extracting individual-level characteristics from mobile phone GPS data represents a promising solution for gaining quantitative insights into fine-grained population-level dynamics. On one hand, passively and privacy-enhanced collected data from mobile phones’ GPS provides a fine-grained picture of an individual’s mobility behaviour, making it possible to perform quantitative analysis over time. On the other hand, population-wide surveys can be used to augment GPS trajectories, enabling group-specific analyses in an aggregate and privacy-preserving fashion.
Recent studies have leveraged home and work location detection algorithms, inferred from GPS mobility trajectories [28, 29], to link census data to individual information [20, 30, 31]. However, integrating data from conventional data collection methods (e.g., population surveys) with data gathered from individual devices remains an open challenge, the nature of which varies depending on the types of information being integrated.
In the field of employment and labour market research, most of the recent studies taking advantage of new data sources have explored innovative approaches to enhance economic indicators estimates through unemployment rate estimates and unemployment status prediction [32, 33, 34]. Few of them focused on understanding the behaviour specificities of unemployed individuals and in particular on behavioural changes following job loss [35, 36, 37].
In this context, the contribution of our work is twofold. Firstly, we introduce a real-time methodology for inferring unemployment status based on individual GPS trajectories. Secondly, we provide evidence of significant changes in mobility behaviour following a job loss, particularly affecting vulnerable groups already at an increased risk of segregation [19].
We leverage a dataset of privacy-enhanced longitudinal GPS mobility traces of nearly 1 million anonymous opted-in individuals from January 3, 2020, to September 1, 2020, across several US states. In order to preserve privacy, the data provider obfuscates devices’ home locations to the Census Block Group level and removes visits to sensitive points of interest from the dataset. The states are selected based on their diverse workforce composition profiles, enabling us to estimate unemployment at scale and analyze multiple facets of individuals’ mobility behaviour following job loss. To ensure the representativeness of the GPS data and address potential sample biases [20], we employ a reweighting technique. This process generates a resampled cohort that reflects the demographic characteristics and the employed workforce across industrial sectors in all the states under study.
In this paper, we describe and demonstrate the robustness and generalizability of our developed framework for detecting and tracking unemployment. We then evaluate the methodology within the context of the COVID-19 pandemic, also discussing its versatility for more general systemic shocks. Our analysis explores the repercussions of job loss, offering a comprehensive and multidimensional perspective of individuals’ mobility behaviour. This includes measuring their characteristic geographical displacement, their time allocation, and their set of visited locations. We additionally present a time-independent analysis of employed/unemployed behavioural patterns, extending the scope of our investigation to reveal correlations between the duration of unemployment and the growing disparity between the mobility behaviour of employed and unemployed individuals. Finally, we show how demographic factors such as sex, age, income, race, and education level exacerbate the impact of unemployment on individual mobility behavior.
Our findings not only reveal a significant impact of the pandemic on individual mobility but also unveil reduced mobility levels among unemployed individuals, with a growing disparity between the employed and unemployed groups over time. Despite a partial recovery in mobility following the easing of COVID-19 restrictions, our results indicate a sustained contraction of individual-level mobility patterns following job loss, with a noticeable decline in mobility indicators over time, emphasizing the enduring impact of prolonged unemployment. These findings are even more concerning when considering the impact of job loss for specific demographic groups. Vulnerable groups based on sex, income and ethnicity show the lowest levels of exploration capability and diversity.
Overall, our results provide evidence for the long-term effects of unemployment on individuals’ daily lives. Job loss, as a major event in an individual’s life, not only perpetrates but also exacerbates existing socio-demographic disparities in mobility behaviours. While prior literature on human mobility has identified universal characteristics in mobility patterns [38, 39, 40, 41], our findings highlight that individual life-course events, such as job loss, can affect these regularities at the individual level. Such events have the potential to influence people’s habits, as well as their social and psychological well-being.
Results
Using a large and longitudinal dataset of privacy-enhanced GPS location data collected across seven US states from January to September 2020, we analyze behavioural changes in human mobility after a job loss. We first introduce and evaluate a simple and generalizable algorithm to infer individuals’ employment status that combines standard individual GPS trajectory processing techniques [31] with fine-grained demographic survey data [42]. Leveraging this methodology, we then conduct an extensive analysis of the repercussions of job loss on individual mobility behaviour and delve into the effects of prolonged unemployment periods. Furthermore, we investigate how unemployment disproportionately affects individual mobility patterns based on demographic factors such as sex, age, income, ethnicity, and education level.
Inferring individual employment status
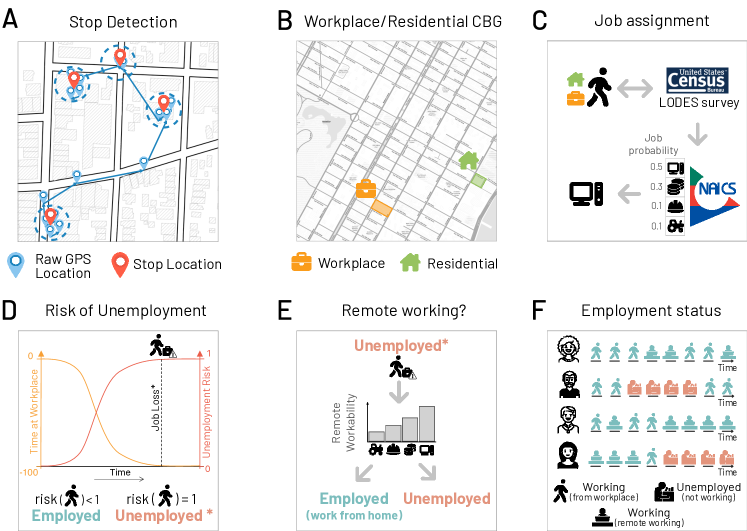
To determine an individual’s employment status, we have devised a procedure that integrates both location and survey data (see Fig. 1). For each individual, we first identify stop locations, defined as sequences of GPS coordinates within a 65-meter radius where a user stayed for a minimum of 5 minutes (Fig. 1A). Then, after detecting the individual’s residential and workplace locations (Fig. 1B), we enrich these locations with survey information provided by the Longitudinal Employer-Household Dynamics (LEHD) Origin-Destination Employment Statistics (LODES) [43]. This dataset provides statistics about the US workforce divided by industrial sectors classified with the North American Industry Classification System (NAICS) [44] and provides data about how many individuals are employed in a specific NAICS sector, based on their census block groups (CBGs) [45] of residence and workplace. We refer to the Methods section for further details.
For those individuals with a detected work location, we label them as employed during the period in which their workplace location is identified. Each of these individuals is further assigned in probability a job, more specifically, a NAICS sector based on available survey data looking at their residential and workplace CBGs (Fig. 1C).
As a following step, individuals are labelled as “at risk of unemployment” based on the reduction in visits to the workplace: if individuals never visit their workplace location, they are considered as potential candidates for unemployment (Fig. 1D). The determination of employment status is sampled taking into account both the risk status and the NAICS-specific likelihood of working from home at any given time.
To account for whether an individual is working from home, we leverage information on the “teleworkability” of jobs, as presented in the study of Dingel and Neiman [46]. For each industrial sector, the data provides the percentage of work that can be performed remotely (Fig. 1E). Based on the individual’s job sector (NAICS), population-wide change in the time spent at work, and the weight of each individual in contributing to that change, we infer the unemployment status over time, thus determining whether the individual is working from home or is unemployed (see Methods section).
Cohort selection and algorithm evaluation
The privacy-enhanced location data provided by Cuebiq, a location intelligence company, intentionally excludes direct information regarding users’ employment to safeguard their privacy. The absence of direct job-related information presents challenges in establishing a ground truth for individuals’ employment status. As a result, we assess the accuracy of our methodology at an aggregate level by leveraging aggregated monthly statistics of Unemployment Insurance claims [47]. Unemployment Insurance programs offer benefits to eligible workers facing unemployment. Additionally, we incorporate state-level employment information obtained from the Bureau of Labor Statistics (BLS) through the Quarterly Census of Employment and Wages (QCEW) program (refer to the SI S1 for additional details on the data).
All our analyses are conducted on a cohort of mobile phone users, where we reweight individuals to construct a sample that accurately mirrors both (i) population-wide representativeness, based on census block group (CBG) population data, and (ii) representativeness of the employed workforce population in each state across various industrial NAICS sectors, drawing from state-level employment statistics (BLS statistics). This post-stratification procedure is crucial for addressing potential biases within the location data and ensuring the data’s representativeness [20, 30]. It enables us to compare employment status with Unemployment Insurance claims and subsequently examine mobility patterns at a population-wide scale. Further details on the post-stratification technique can be found in SI S2A.
Our study focuses on seven US states: New York, Wyoming, Indiana, Idaho, Washington, North Dakota, and New Mexico. These states have been selected to further ensure the representation of different workforce compositions in terms of population distribution across primary, secondary and tertiary economic sectors, spanning diverse US geographical regions (see SI S2B for further details).
To assess the reliability of our proposed job detection methodology, we calculate the Pearson correlation coefficient between the monthly count of individuals detected as unemployed (reweighted to match the employed population) and the monthly count of Unemployment Insurance claims for each NAICS sector. Our analysis reports an average coefficient of 0.8 for the seven states under study, indicating that our algorithm can reliably estimate unemployment at an aggregated level (see SI S4 for more details on the algorithm evaluation).
Behavioural disparities between employed and unemployed individuals
The availability of individual employment status data over time provides a unique opportunity to gain insights into the impact of job loss on human mobility. The wealth of information at our disposal allows us to characterize and quantify changes in behaviour by comparing the daily mobility of individuals identified as employed or unemployed, offering a better understanding of shifts in mobility patterns following a job loss. In this study, we address two key questions: (i) What was the impact of the pandemic on individuals who experienced a job loss? and more broadly, (ii) what are the effects of job loss on an individual’s mobility behaviour, and what happens when individuals face a prolonged period of unemployment?
To address these questions and ensure a fair comparison between a population of employed individuals and a population of unemployed individuals, we exclude all stop locations associated with an individual’s workplace from our analysis. Therefore, our analysis focuses on extra-work individuals’ mobility patterns, with a specific focus on those individuals who had been employed (even briefly) between January 3rd, 2020, and March 7th, 2020, namely before the WHO declaration of the COVID-19 pandemic (March 11th, 2020).
Considering systemic external factors in our analysis and given the significant stress placed on the labour market by the pandemic, we have the ideal conditions to study the consequences and gain a comprehensive understanding of the effects of job loss on human behaviour.
The disproportionate impact of the pandemic on unemployed individuals’ mobility
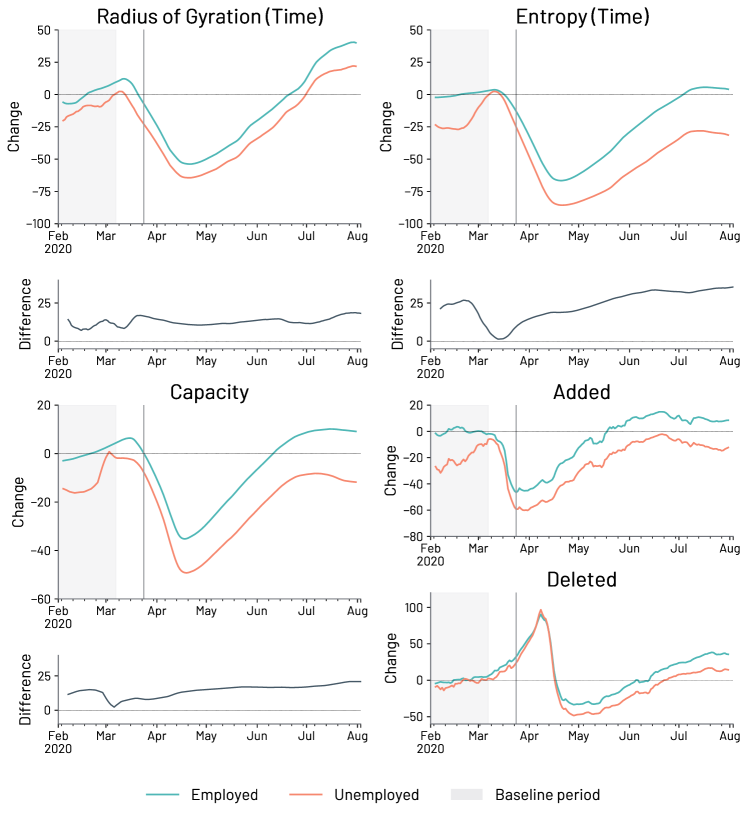
To provide a comprehensive analysis of changes in mobility, we measure within-individual variations by comparing activities to a baseline period preceding the pandemic (February 1st, 2020 - March 7th, 2020). Our focus revolves around three key well-known mobility metrics: (1) the radius of gyration () [6], which measures the characteristic geographical displacement of individuals; (2) the time allocation entropy () [48], which measures the distribution of time allocation in each visited location; and (3) the users’ locations’ capacity, denoted as , which captures the number of a user’s familiar locations, alongside the number of locations added () to, and deleted () from the set of familiar locations within a specific time interval [39] (find the formal definition of the mobility metrics in the “Methods” section). Collectively, these measures offer a multidimensional perspective on both the characteristic displacement and the complexity of individuals’ exploratory behaviour.
In Fig. 2, we present the results over time for each of these metrics and the relative difference over time between the group of employed and unemployed individuals. All the mobility metrics are computed for a window of 28 days with a 1-day shift. Note that, as previously explained, our analysis focuses on individuals who were employed, even briefly, before the pandemic. Therefore, the curves representing the mobility indicators for unemployed individuals in the baseline period (grey-shaded area) are not informative due to the low number of unemployed individuals during that period. The results shown in Fig. 2 reveal a substantial impact of the pandemic on individual mobility patterns, particularly among unemployed individuals. Notably, the group of unemployed individuals exhibits lower overall activity levels across all the mobility metrics under study. Moreover, we observe that as the pandemic progresses, the mobility gaps between the employed and unemployed groups widen. While the reduction in mobility for the unemployed is limited when examining the individuals’ characteristic displacement measured by the radius of gyration, with employed individuals reaching a low point of and unemployed individuals reaching a low point of , the same is not true when looking at regularity and exploration patterns. The drop in activity is particularly pronounced for unemployed individuals when examining the time allocation entropy, with low points of and for employed and unemployed individuals respectively, and capacity, with low points of and for employed and unemployed individuals respectively.
From this analysis, it becomes evident that the routinary and exploratory behaviours of unemployed individuals, as measured by the time allocation entropy and by the capacity (together with its location turnover of added and deleted locations), were more affected than those of employed individuals. Moreover, over time, there is an evident increasing trend in the difference between the behaviours of the two groups. The difference between the two groups at the end of the period under study is for the radius of gyration, for the time allocation entropy and for the capacity. Interestingly, following the gradual reduction of COVID-19 restrictions, there appears to be a clear (partial) recovery for all the different facets of mobility behaviour we analyzed.
Prolonged unemployment and the deterioration of mobility behaviour
In the previous section, we provided insights into the collective mobility dynamics of employed and unemployed individuals, uncovering a disproportionate mobility response during the pandemic period between the two groups. To extend the validity of our findings beyond the pandemic conditions and ensure their generalizability to other possible systemic shocks, we further investigate into the growing divergence over time between the mobility behaviours of employed and unemployed individuals. Through the following analysis, we aim to understand the effects of job loss on individual-level mobility behaviour, assessing whether a prolonged period of unemployment leaves a lasting impact.
Hence, we present a robust and general framework for detecting and tracking unemployment potentially adaptable to different systemic shocks. In particular, we propose a time-independent analysis of employed/unemployed behavioural patterns which tries to understand whether the duration of unemployment contributes to the growing disparity between the two groups’ mobility behaviour.
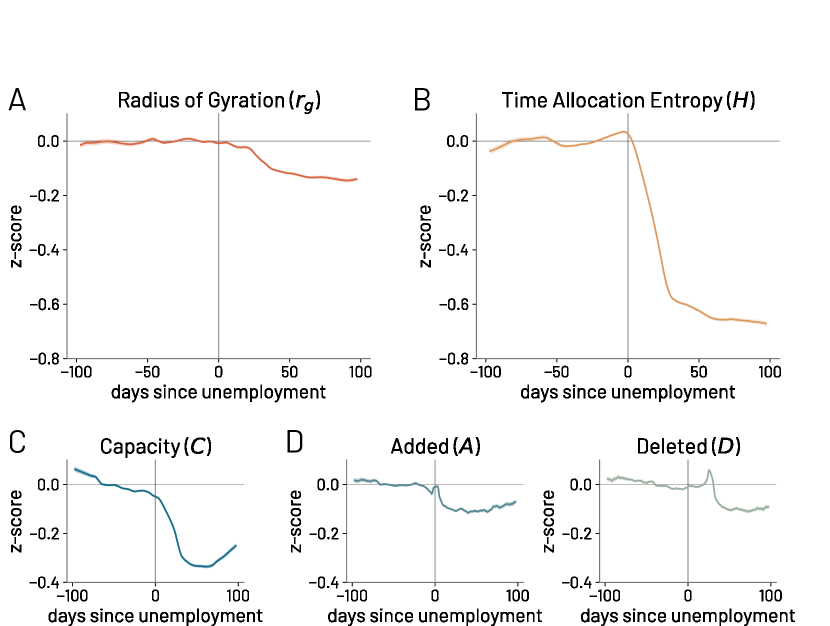
Due to the period during which the data was collected, we first need to consider the non-negligible impact of Non-Pharmaceutical Interventions, and more in general of the pandemic, on the general population mobility during 2020. To mitigate the effect of the COVID-19 pandemic on the results, we standardize each individual’s mobility indicator by calculating the z-score using the average and standard deviation of the employed group’s indicators on a specific day . Then, to better understand the effects of a job loss on an individual, we align the mobility indicators of all individuals by shifting time so that represents the time when an individual lost their job. This approach enables consistent comparisons of individuals’ mobility behaviour at different times with respect to the date at which they lost their jobs.
As illustrated in Fig. 3, both the radius of gyration (at a smaller level) and time allocation entropy (at a larger level) were affected and gradually decreased over time, reaching almost and standard deviations, respectively, compared to when individuals were employed. Although the radius of gyration seemed to be less affected, the relative time allocation entropy of individuals who lost their jobs decreased sharply and constantly the longer they were unemployed. This large reduction in time allocation entropy may be related to the tendency of unemployed individuals to spend a significant fraction of time at home [36, 49].
A similar dynamic is observed in the capacity of individuals, which displays a sharp decrease of more than standard deviations, followed by a slow recovery after approximately 60 days. The added locations () to the set of familiar places exhibited similar behaviour as the capacity, with a noticeable decrease after an individual loses their job. On the other hand, the deletion of familiar locations () increases abruptly when individuals lose their jobs, followed by a sharp decrease. Both the added and deleted locations then remain significantly low, indicating an overall lower turnover in the set of an individual’s familiar locations. Despite a modest recovery after approximately two months, the results highlight the clear and persistent impact of unemployment on limiting individuals’ abilities to explore new opportunities in physical space. The drop in capacity () together with the decrease in the number of added () and deleted () locations highlight a reduced location turnover and a sustained contraction into the individuals’ set of familiar locations. For an individual, this scenario may indicate a potential decrease in exposure to opportunities and an increased risk of isolation after experiencing a job loss.
Socio-demographic factors in job loss behavioural changes
To get a better understanding of the implications of prolonged unemployment, we evaluate and quantify socio-demographic differences in mobility patterns among individuals enduring a prolonged period of unemployment. Leveraging socio-demographic information from the Longitudinal Employer-Household Dynamics (LODES) dataset [43], including Sex, Age, Income, Race, and Education, we analyze demographic differences in mobility behaviours.
Building on the results presented in Fig. 3, we disaggregate the mobility behaviour of unemployed individuals () based on the individual’s socio-demographic group (see SI S5 for more details), revealing significant disparities in the mobility behaviour of unemployed individuals when compared with the mobility behaviour of employed individuals (see SI Tab. S3).
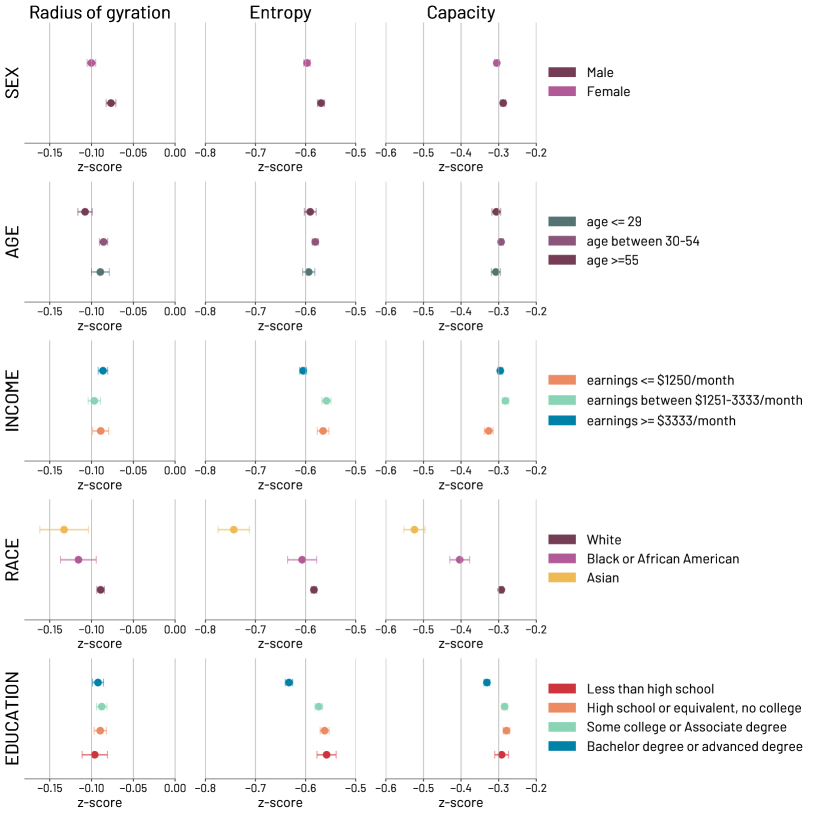
In Fig. 4, we compare each mobility indicator of individuals who fall in a particular socio-demographic category against the population of employed individuals. The results show significant differences between male and female individuals across all three mobility indicators, namely radius of gyration (), time allocation entropy (), and capacity (). Unemployed women generally exhibit lower values of mobility exploration (, and ) and diversity ( and ). Regarding individuals’Age, differences in mobility behaviour are relatively smaller, with older individuals () showing a more pronounced reduction in their characteristic geographical displacement () compared to other groups. Income disparities reveal smaller differences in the radius of gyration (), whereas richer individuals () exhibit lower values in their time allocation entropy (). Capacity (), in contrast, is lower for those individuals reporting lower income values (). In terms of Race, Asians display lower values in all three mobility metrics, followed by Black or African American individuals and then White individuals. Specific ethnic groups (e.g., American Indian or Alaska Native, Native Hawaiian or Other Pacific Islander and Two or More Race Groups) have been excluded from the analysis due to small sample sizes. Educational levels show fewer differences in mobility behaviour between groups, with no significant differences in radius of gyration (). Lower values of time allocation entropy () and capacity () are observed in individuals with Bachelor degree or advanced degrees.
We test the significance of the differences between demographic groups using Welch’s t-test [50] (see SI Tab. S4), considering the behavioural information from days after job-loss up to days (to remove the initial transitioning phase).
To validate our understanding of job loss as an important life-course event that can shape individual mobility patterns, we conducted a comparative analysis between unemployed individuals and their employed counterparts from the same socio-demographic group. This comparison demonstrates that the reduced mobility behaviour occurring after a job loss is consistently present, although with different intensity, in all the studied population strata (see SI Tab. S5 for the statistics).
Taken together, these results substantiate the interpretation of socio-demographic characteristics as a factor to be taken into account when aiming to mitigate the effects of unemployment on individuals in mobility patterns. The differences observed in mobility indicators after a job loss are attributable to both the transition to joblessness and the inherent mobility tendencies within socio-demographic groups [51, 52, 53, 54].
Discussion
The availability of massive digital traces collected through mobile phones has become an important proxy for studying individual behaviour at population scales. The size and granularity of these datasets have revealed crucial insights into the regularities of human mobility and have exposed universal properties of human mobility patterns [48, 55, 56, 41, 39, 9, 40]. Interestingly, within the numerous mobility models for human mobility, the notion of “opportunities” consistently emerges as a key driver of individual movement patterns [57, 58, 6, 55, 56, 8, 59]. This notion suggests that individuals navigate physical space in pursuit of various kinds of opportunities spanning social, educational, and economic domains.
In this perspective, understanding whether individuals transitioning to a state of unemployment can still access and benefit from the opportunities that their social and physical environments offer is of great social importance [60, 61, 62].
To proxy social exposure and access to opportunities, we leverage an individual-level longitudinal dataset of fine-grained mobility behaviour alongside secondary demographic data [46, 47, 45, 44]. We employ reweighting and rescaling techniques to address potential sample biases in the GPS data and to mitigate the effects of COVID-19 restrictions on mobility behaviour analysis.
The empirical evidence we present highlights that individuals facing unemployment significantly decrease their mobility, suggesting a reduction in their ability to explore and exploit available opportunities. This effect worsens over time, leading to a differentiation of the population into employed and unemployed subgroups with persistent behavioural differences. In particular, the impact of job loss manifests differently across various socio-demographic groups, highlighting how some of these already vulnerable communities may be disproportionately affected [52, 53, 51, 62, 54].
In this context, our work underscores the significant influence of personal circumstances or life events, such as job loss, on established patterns of human mobility. These life-course events can drive individuals to transition through different states of human mobility regularities, adding a layer of complexity to the notion that mobility patterns can depend on the structure of the surrounding physical space [37, 63, 9] and the demographic attributes of individuals [41, 37, 9].
Furthermore, for an individual, the reduction in exploration patterns is not only a reflection of the immediate impact of job loss but potentially also signals a broader issue, leading to a decreased exposure to opportunities and an increased risk of social isolation after experiencing job loss [64, 65, 66, 31], reinforcing negative effects on an individual’s well-being [67, 68, 69, 70].
Importantly, the progressive reduction in individual mobility and the associated decline in social participation [64, 65, 66, 31], could also undermine the potential effectiveness of intervention programs targeting the early stages of unemployment. By leveraging real-time data, our approach can facilitate targeted efforts during these initial phases, enabling more effective mitigation of the enduring and group-specific impacts of job loss [62, 61].
Methods
Stop locations
The GPS location data was provided by Cuebiq, a location intelligence company that provided through their Cuebiq Data for Good COVID-19 Collaborative program, a dataset of privacy-enhanced GPS locations from users who opted-in to share the data anonymously for research purposes through a CCPA (California Consumer Privacy Act) compliant framework (see SI S1 for more details). To further preserve privacy, the data provider obfuscates users’ precise home and work locations by transforming them to the centroid of the corresponding Census Block Group. We analyze a dataset that spans a period of 9 months, from January 2020 to September 2020 for seven US states including New York, Wyoming, Indiana, Idaho, Washington, North Dakota, and New Mexico.
We filter out all users with less than one month of data before declaring a national emergency (March 13, 2020) and less than four months after it. We also require users to have 5 hours per day covered by at least one GPS location. The resulting dataset includes more than 1 million anonymous, opted-in individuals. For all users, we extract their stop events with an algorithm based on Hariharan and Toyama [71]. We define a stop event as a temporal sequence of GPS coordinates in a radius meters where a user stayed for at least minutes. For each user, we then define their stop locations as the stop events that can be considered as part of the same place using the DBSCAN algorithm [72]. With DBSCAN, we group points within a distance of meters to form a cluster with at least stop event. For a more detailed explanation of the GPS data processing please refer to Lucchini et al. [31].
Residential and Workplace detection
We determined the most likely residential and workplace areas for each user by calculating these areas multiple times over a moving rolling window of 28 days. We then aggregate for each day , for each user , and stop , the amount of time spent in a window distinguishing between:
-
1.
Residential time: The amount of time between 8 pm and 4 am spent by the user at stop . Unlike previous studies such as TimeGeo [28], we did not assume the entire weekend as residential time since the US Bureau of Labor Statistics recently estimated that around 34% of employed people work in the weekend [42].
-
2.
Workplace time: On weekdays, the amount of time between 9 am and 5 pm spent by the user at stop . We chose these working hours because they represent the most common working time in the US [73]. Additionally, we assumed that a potential workplace stay should last at least 30 minutes and occur five times a week. These assumptions were similar to those made in previous studies [28].
We detect for each user their residential location as the stop location with the largest Residential time during the period that goes from January 3rd to March 7th (before the pandemic). To detect changes in the workplace location for a particular user , we label a stop as workplace location if this stop is not a residential location (to avoid tracking people already working from home) and it has the largest Workplace time in the observed 28 days window. To protect users’ privacy, the residential and workplace locations were blurred and associated with the corresponding Census Block Groups.
Job assignment
The location data does not have direct information about the users’ jobs. To the extracted residential and workplace locations, we associate a Geographic Identifier (GEOID), which is a numeric code that uniquely identifies an administrative geographic area in the US Census data. To be able to assign a job to each user, we match the residential and workplace GEOIDs to the GEOIDs of the Longitudinal Employer-Household Dynamics Origin-Destination Employment Statistics (LODES) datasets [43]. Given the residential/workplace locations, these datasets provide statistics about the number of jobs in each sector as defined by the North American Industry Classification System (NAICS) [44].
The information of the LODES datasets is organized into i) Residence Area Characteristics (RAC); ii) Workplace Area Characteristics (WAC); iii) Origin-Destination (OD). RAC and WAC datasets provide job statistics according to the residential and workplace census block groups respectively. The OD dataset provides job statistics considering both residential and workplace census blocks (for further details on the LODES datasets refer to SI S1). From these three datasets, we then compute the probabilities of working in a particular NAICS sector by normalizing the number of jobs in each NAICS sector by the total number of jobs.
Finally, for each individual and the combination of their residential and workplace GEOIDs, we assign an industrial sector in probability. The probability of working in a specific sector, , is computed for each user with a home location and a work location, as the joint probability of independently working in that specific sector, given that resides in and works in (their home and work locations respectively):
where is the residential GEOID and is the workplace GEOID as provided in the LODES data.
Bootstrapping is applied for a more robust NAICS assignment to individuals. Specifically, for each individual, we sample times from the corresponding NAICS probability distribution and retain all the sampled NAICS as independent realisations of a GEOID-representative population.
Employment status inference
To infer the employment status of a bootstrapped user, we leverage information on the reduction in i) workplace visits and ii) time spent at work.
Who is at risk of unemployment?
We define an individual to be at risk of losing their job if they never visited their work location. Since we are interested in studying the impact of job loss at the individual level, we restrict our analysis to individuals who were employed before the pandemic declaration. Using the pre-pandemic period as a baseline period makes it possible to investigate the shock induced by the pandemic on the job market. Specifically, we retain only users who have been working at least 5 days during the baseline period (), namely the period before the pandemic (January 3rd - March 7th, 2020). We then compute the reduction of workplace visits and identify as “at risk” those who at a specific time window didn’t visit their workplace. To identify the population at risk of unemployment over time, we used a time window of days with a daily shift. Thus, at each time , we define an individual to be at risk of unemployment, , if they didn’t visit their work location in the entire time window:
with representing the number of visits a user made to their work location within the time window .
Who is working remotely?
Under the assumption that individuals at risk of unemployment () could be working remotely, we assign to each individual the likelihood of working remotely based both on their personal and other workers’ (in the same NAICS) working behaviour changes. Individual working behaviour change is measured in terms of the reduction in the time spent at work with respect to the baseline period:
Here is the time the user spent at the workplace in the time window , and is the median of the time spent at work (within windows of the same size as ) during the baseline period (January 3rd - March 7th, 2020).
By additionally adjusting for how much the entire sector is working remotely during a specific window compared the estimated maximum amount of time that can be worked remotely [46], we can write the probability of being unemployed as:
where represents the weighted fraction of remaining work time that could be performed remotely by those individuals who stopped visiting their work location, and represent the fraction of work that could be performed remotely adjusted by potential changes in remote working behaviour among those individuals who didn’t interrupt visiting their workplace (for additional details see SI S3A).
Intuitively, by estimating at the sector level the reduction in the time spent at work by users who are still visiting their work location (), we measure how much “remote work” is already performed by individuals who are still visiting their workplace. The remaining part of the remote-workable time (if any), , is used to uniformly distribute the probability of being unemployed among individuals who stopped visiting their workplace (for further details see SI S3A).
Mobility metrics
To track the changes in mobility of employed and unemployed individuals, we measure within-individual variations by comparing mobility behaviours to a baseline period preceding the pandemic (February 1st, 2020 - March 7th, 2020). The mobility metrics we used in our analysis offer a comprehensive picture of mobility behaviour including individuals’ characteristic displacement and the complexity of individuals’ exploratory behaviour. To track the changes over time, we computed these metrics over a moving window of 28 days with a 1-day shift.
Time Allocation Entropy
We introduce the time allocation entropy, which measures the distribution of time allocation in each visited location by an individual, as a measure of exploratory behaviour: Here, is the total number of unique visited locations of an individual , and is the total time individual spends in location (weighted by time spent).
Radius of gyration
To measure the characteristic geographical displacement of individuals, we use the well-known radius of gyration [6, 7] defined as: , where is the total time spent by a particular individual to all their visited locations; is the time spent to location ; is the set of stop locations within a time window; is a two-dimensional vector representing the location’s GPS position recorded as latitude and longitude; and is the centre of mass of the trajectories, defined as .
Capacity
We capture and track the number of an individual’s familiar locations following the definition of Alessandretti et al. [39]. For each individual, we compute the location capacity in each time window, normalized by the mean capacity of all users during the baseline period before the pandemic (January 3rd - March 7th, 2020).
Together with the capacity , we also computed the number of locations added to () and deleted from () the set of familiar locations within a specific time interval and the previous time interval [39].
References
- [1] U.S. Bureau of Labor Statistics. How the Government Measures Unemployment. https://www.bls.gov/cps/cps_htgm.htm (2023).
- [2] Office, I. L. World employment and social outlook: Trends 2015 (International Labour Organization Geneva, 2015).
- [3] Dewan, S., Ernst, E. & Achkar Hilal, S. World employment and social outlook: trends 2022 (2022).
- [4] Krueger, A. B., Mas, A. & Niu, X. The evolution of rotation group bias: Will the real unemployment rate please stand up? \JournalTitleReview of Economics and Statistics 99, 258–264 (2017).
- [5] Office for National Statistics (ONS). Labour Force Survey performance and quality monitoring report: April to June 2023. https://www.ons.gov.uk/employmentandlabourmarket/peopleinwork/employmentandemployeetypes/methodologies/labourforcesurveyperformanceandqualitymonitoringreport (2023).
- [6] Gonzalez, M. C., Hidalgo, C. A. & Barabasi, A.-L. Understanding individual human mobility patterns. \JournalTitlenature 453, 779–782 (2008).
- [7] Pappalardo, L. et al. Returners and explorers dichotomy in human mobility. \JournalTitleNature communications 6, 8166 (2015).
- [8] Lucchini, L., Tonelli, S. & Lepri, B. Following the footsteps of giants: modeling the mobility of historically notable individuals using wikipedia. \JournalTitleEPJ Data Science 8, 36 (2019).
- [9] Alessandretti, L., Aslak, U. & Lehmann, S. The scales of human mobility. \JournalTitleNature 587, 402–407 (2020).
- [10] Singh, V. K., Bozkaya, B. & Pentland, A. Money walks: implicit mobility behavior and financial well-being. \JournalTitlePloS one 10, e0136628 (2015).
- [11] Tovanich, N. et al. Inferring psychological traits from spending categories and dynamic consumption patterns. \JournalTitleEPJ Data Science 10, 24 (2021).
- [12] Dong, X. et al. Social bridges in urban purchase behavior. \JournalTitleACM Transactions on Intelligent Systems and Technology (TIST) 9, 1–29 (2017).
- [13] Matz, S. C., Gladstone, J. J. & Stillwell, D. Money buys happiness when spending fits our personality. \JournalTitlePsychological science 27, 715–725 (2016).
- [14] Lucchini, L. et al. From reddit to wall street: The role of committed minorities in financial collective action. \JournalTitleRoyal Society Open Science 9, 211488 (2022).
- [15] Sobolevsky, S. et al. Cities through the prism of people’s spending behavior. \JournalTitlePloS one 11, e0146291 (2016).
- [16] Wang, Q., Phillips, N. E., Small, M. L. & Sampson, R. J. Urban mobility and neighborhood isolation in america’s 50 largest cities. \JournalTitleProceedings of the National Academy of Sciences 115, 7735–7740 (2018).
- [17] Chetty, R. et al. Social capital i: measurement and associations with economic mobility. \JournalTitleNature 608, 108–121 (2022).
- [18] Chetty, R. et al. Social capital ii: determinants of economic connectedness. \JournalTitleNature 608, 122–134 (2022).
- [19] Moro, E., Calacci, D., Dong, X. & Pentland, A. Mobility patterns are associated with experienced income segregation in large us cities. \JournalTitleNature communications 12, 4633 (2021).
- [20] Yabe, T., Bueno, B. G. B., Dong, X., Pentland, A. & Moro, E. Behavioral changes during the covid-19 pandemic decreased income diversity of urban encounters. \JournalTitleNature Communications 14, 2310 (2023).
- [21] Wang, H., Kifer, D., Graif, C. & Li, Z. Crime rate inference with big data. In Proceedings of the 22nd ACM SIGKDD international conference on knowledge discovery and data mining, 635–644 (2016).
- [22] Song, G. et al. Crime feeds on legal activities: Daily mobility flows help to explain thieves’ target location choices. \JournalTitleJournal of Quantitative Criminology 35, 831–854 (2019).
- [23] Luca, M., Campedelli, G. M., Centellegher, S., Tizzoni, M. & Lepri, B. Crime, inequality and public health: A survey of emerging trends in urban data science. \JournalTitleFrontiers in Big Data 6, 50 (2023).
- [24] Wesolowski, A. et al. Quantifying the impact of human mobility on malaria. \JournalTitleScience 338, 267–270 (2012).
- [25] Oliver, N. et al. Mobile phone data for informing public health actions across the covid-19 pandemic life cycle. \JournalTitleScience advances 6, eabc0764 (2020).
- [26] Kraemer, M. U. et al. The effect of human mobility and control measures on the covid-19 epidemic in china. \JournalTitleScience 368, 493–497 (2020).
- [27] Aleta, A. et al. Modelling the impact of testing, contact tracing and household quarantine on second waves of covid-19. \JournalTitleNature Human Behaviour 4, 964–971 (2020).
- [28] Jiang, S. et al. The timegeo modeling framework for urban mobility without travel surveys. \JournalTitleProceedings of the National Academy of Sciences 113, E5370–E5378 (2016).
- [29] Pappalardo, L., Ferres, L., Sacasa, M., Cattuto, C. & Bravo, L. Evaluation of home detection algorithms on mobile phone data using individual-level ground truth. \JournalTitleEPJ data science 10, 29 (2021).
- [30] Lucchini, L. et al. Socioeconomic disparities in mobility behavior during the covid-19 pandemic in developing countries. \JournalTitlearXiv preprint arXiv:2305.06888 (2023).
- [31] Lucchini, L. et al. Living in a pandemic: changes in mobility routines, social activity and adherence to covid-19 protective measures. \JournalTitleScientific reports 11, 24452 (2021).
- [32] Xu, W., Li, Z., Cheng, C. & Zheng, T. Data mining for unemployment rate prediction using search engine query data. \JournalTitleService Oriented Computing and Applications 7, 33–42 (2013).
- [33] Moriwaki, D. Nowcasting unemployment rates with smartphone gps data. In Multiple-Aspect Analysis of Semantic Trajectories: First International Workshop, MASTER 2019, Held in Conjunction with ECML-PKDD 2019, Würzburg, Germany, September 16, 2019, Proceedings 1, 21–33 (Springer, 2020).
- [34] Sundsøy, P. et al. Estimating individual employment status using mobile phone network data. \JournalTitlearXiv preprint arXiv:1612.03870 (2016).
- [35] Toole, J. L. et al. Tracking employment shocks using mobile phone data. \JournalTitleJournal of The Royal Society Interface 12, 20150185 (2015).
- [36] Almaatouq, A., Prieto-Castrillo, F. & Pentland, A. Mobile communication signatures of unemployment. In Social Informatics: 8th International Conference, SocInfo 2016, Bellevue, WA, USA, November 11-14, 2016, Proceedings, Part I 8, 407–418 (Springer, 2016).
- [37] Barbosa, H. et al. Uncovering the socioeconomic facets of human mobility. \JournalTitleScientific reports 11, 8616 (2021).
- [38] Noulas, A., Scellato, S., Lambiotte, R., Pontil, M. & Mascolo, C. A tale of many cities: universal patterns in human urban mobility. \JournalTitlePloS one 7, e37027 (2012).
- [39] Alessandretti, L., Sapiezynski, P., Sekara, V., Lehmann, S. & Baronchelli, A. Evidence for a conserved quantity in human mobility. \JournalTitleNature human behaviour 2, 485–491 (2018).
- [40] Schläpfer, M. et al. The universal visitation law of human mobility. \JournalTitleNature 593, 522–527 (2021).
- [41] Barbosa, H. et al. Human mobility: Models and applications. \JournalTitlePhysics Reports 734, 1–74 (2018).
- [42] Bureau of Labor Statistics, American Time Use Survey. Percent of population who worked on weekdays and weekend days. https://www.bls.gov/tus/charts/chart11.pdf (2015).
- [43] US Census Bureau, C. f. E. S. Data - longitudinal employer-household dynamics. Accessed on 2024-02-02.
- [44] North american industry classification system (naics) u.s. census bureau. Accessed on 2024-02-02.
- [45] Bureau, U. C. Glossary. Accessed on 2024-02-02.
- [46] Dingel, J. I. & Neiman, B. How many jobs can be done at home? \JournalTitleJournal of Public Economics 189, 104235 (2020).
- [47] Monthly program and financial data, employment & training administration (eta) - u.s. department of labor. Accessed on 2024-01-31.
- [48] Song, C., Qu, Z., Blumm, N. & Barabási, A.-L. Limits of predictability in human mobility. \JournalTitleScience 327, 1018–1021 (2010).
- [49] Llorente, A., Garcia-Herranz, M., Cebrian, M. & Moro, E. Social media fingerprints of unemployment. \JournalTitlePloS one 10, e0128692 (2015).
- [50] Welch, B. L. The generalization of ‘student’s’problem when several different population varlances are involved. \JournalTitleBiometrika 34, 28–35 (1947).
- [51] Lenormand, M. et al. Influence of sociodemographic characteristics on human mobility. \JournalTitleScientific reports 5, 10075 (2015).
- [52] Gauvin, L. et al. Gender gaps in urban mobility. \JournalTitleHumanities and Social Sciences Communications 7, 1–13 (2020).
- [53] Gauvin, L. et al. Socio-economic determinants of mobility responses during the first wave of covid-19 in italy: from provinces to neighbourhoods. \JournalTitleJournal of The Royal Society Interface 18, 20210092 (2021).
- [54] Deng, H. et al. High-resolution human mobility data reveal race and wealth disparities in disaster evacuation patterns. \JournalTitleHumanities and Social Sciences Communications 8, 1–8 (2021).
- [55] Song, C., Koren, T., Wang, P. & Barabási, A.-L. Modelling the scaling properties of human mobility. \JournalTitleNature physics 6, 818–823 (2010).
- [56] Simini, F., González, M. C., Maritan, A. & Barabási, A.-L. A universal model for mobility and migration patterns. \JournalTitleNature 484, 96–100 (2012).
- [57] Stouffer, S. A. Intervening opportunities: A theory relating mobility and distance. \JournalTitleAmerican Sociological Review 5, 845–867 (1940).
- [58] Erlander, S. & Stewart, N. F. The gravity model in transportation analysis: theory and extensions, vol. 3 (Vsp, 1990).
- [59] Pappalardo, L., Rinzivillo, S. & Simini, F. Human mobility modelling: exploration and preferential return meet the gravity model. \JournalTitleProcedia Computer Science 83, 934–939 (2016).
- [60] Paul, K. I., Hassel, A. & Moser, K. Individual consequences of job loss and unemployment. \JournalTitleOxford handbook of job loss and job search 57–85 (2018).
- [61] Brand, J. E. The far-reaching impact of job loss and unemployment. \JournalTitleAnnual review of sociology 41, 359–375 (2015).
- [62] Wanberg, C. R. The individual experience of unemployment. \JournalTitleAnnual review of psychology 63, 369–396 (2012).
- [63] Thiemann, C., Theis, F., Grady, D., Brune, R. & Brockmann, D. The structure of borders in a small world. \JournalTitlePloS one 5, e15422 (2010).
- [64] Dieckhoff, M. & Gash, V. Unemployed and alone? unemployment and social participation in europe. \JournalTitleInternational Journal of Sociology and Social Policy 35, 67–90 (2015).
- [65] Pohlan, L. Unemployment and social exclusion. \JournalTitleJournal of Economic Behavior & Organization 164, 273–299 (2019).
- [66] Toole, J. L., Herrera-Yaqüe, C., Schneider, C. M. & González, M. C. Coupling human mobility and social ties. \JournalTitleJournal of The Royal Society Interface 12, 20141128 (2015).
- [67] McKee-Ryan, F., Song, Z., Wanberg, C. R. & Kinicki, A. J. Psychological and physical well-being during unemployment: a meta-analytic study. \JournalTitleJournal of applied psychology 90, 53 (2005).
- [68] Warr, P. Work, unemployment, and mental health. (Oxford University Press, 1987).
- [69] Warr, P., Jackson, P. & Banks, M. Unemployment and mental health: Some british studies. \JournalTitleJournal of social issues 44, 47–68 (1988).
- [70] Feather, N. T. The psychological impact of unemployment (Springer Science & Business Media, 2012).
- [71] Hariharan, R. & Toyama, K. Project lachesis: Parsing and modeling location histories. In Egenhofer, M. J., Freksa, C. & Miller, H. J. (eds.) Geographic Information Science, 106–124, DOI: {10.1007/978-3-540-30231-5_8} (Springer Berlin Heidelberg, Berlin, Heidelberg, 2004).
- [72] Ester, M., Kriegel, H.-P., Sander, J., Xu, X. et al. A density-based algorithm for discovering clusters in large spatial databases with noise. In kdd, vol. 96, 34, 226–231 (1996).
- [73] Wikipedia. Business hours - wikipedia. Version access: 2023-12-24.
Acknowledgements
The authors would like to thank Cuebiq that kindly provided us with the mobility dataset for this research through their Data for Good program. L.L. thanks G.K. for the insightful discussions and his support during the entire project development. L.L. has been supported by the ERC project “IMMUNE” (Grant agreement ID: 101003183). L.L. acknowledges the support from the “Fondazione Romeo ed Enrica Invernizzi” for the research activities of the ’Covid Crisis Lab’ at Bocconi University. S.C. and B.L. have been supported by the PNRR ICSC National Research Centre for High Performance Computing, Big Data and Quantum Computing (CN00000013), under the NRRP MUR program funded by the NextGenerationEU.
Author contributions statement
L.L., S.C., M.D.N. conceived the original idea and planned the experiments. S.C., L.L. and M.D.N. pre-processed the mobility data. S.C., L.L. and M.T. carried out the experiments and made the Figures. L.L., S.C. and M.D.N. contributed to the interpretation of the results. L.L. and S.C. wrote the manuscript. S.C., M.D.N., M.T., B.L., and L.L. provided critical feedback, helped shape the manuscript and substantively revised it.