Suppression of shear ionic motions in bismuth
by coupling with large-amplitude internal displacement
Abstract
Bismuth, with its rhombohedral crystalline structure and two Raman active phonon modes corresponding to the internal displacement () and shear () ionic motions, offers an ideal target for the investigation of the phonon-phonon and electron-phonon couplings under photoexcitation. We perform transient reflectivity measurements of bismuth single crystal at 11 K over wide range of absorbed laser fluence up to mJ/cm2, at which a sign of an irreversible surface damage is observed. At the minimum fluence examined (0.1 mJ/cm2) the coherent and oscillations are a cosine and a sine functions of time, as are consistent with their generations in the displacive and impulsive limits, respectively. With increasing fluence the initial phases of the both modes deviate from their low-fluence values, indicating a finite time required for the transition from the ground-state potential energy surface (PES) to the excited-state one. Surprisingly, the amplitude increases with increasing fluence up to 3 mJ/cm2 and then turns to an apparent decrease, in contrast to the monotonic increase of the amplitude up to 6 mJ/cm2. The contrasted behaviors can be understood by considering a two-dimensional PES, where the strongly driven oscillation leads to a temporal fluctuation of the PES along the coordinate and thereby to a loss in the oscillation coherence at high fluences.
pacs:
78.47.J-, 63.20.kd, 81.05.BxI Introduction
Bismuth (Bi) is recently attracting renewed attention because of its surface accommodating topological insulating electronic states. As for the bulk Bi electronic states, it is established that Bi is a semimetal with its Fermi surface consisting of three electron pockets at the points of the Brillouin zone and one hole pocket at the point [1], though their topological classification is still under debate [2, 3, 4, 5, 6]. The crystalline structure of Bi crystal is rhombohedral with symmetry, as illustrated in Fig. 1(a), with the internal displacement in the trigonal () axis and the trigonal shear angle in the ground state [3, 7, 8]. This structure would be transformed to simple cubic by slightly varying the internal displacement to and the shear angle to [9, 1]. Theoretical simulations predicted that by tweaking and/or the electronic band structure of Bi could undergo phase transitions from a semimetal to a semiconductor (either direct or indirect) or to a metal [1, 3, 7, 8]. Correspondingly, a pressure-induced semimetal-semiconductor phase transition of Bi was reported experimentally [10, 11].
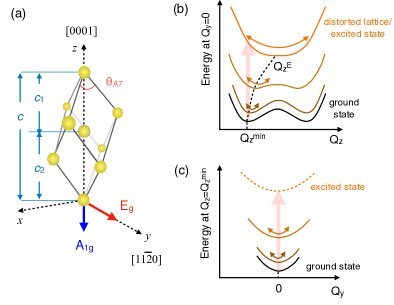
The rhombohedral Bi crystal features two Raman-active modes of - and -symmetries, as shown in Fig. 1(a), which are associated with the variations in the internal displacement and in the shear angle , respectively. Theoretical simulations predicted that introduction of photocarriers [12, 13] transforms the potential energy surface (PES) along the coordinate from a double well into a flattened single well, as schematically illustrated in Fig. 1(b). The susceptibility of the PES to the electronic distribution near the Fermi level leads to a significant enhancement of coherent phonons via displacive excitation of coherent phonons (DECP) mechanism [14, 15] and has thereby made the mode a model target for optical studies on ultrafast electron-phonon coupling dynamics [16, 14, 17, 18, 19, 20, 21, 22, 23, 24, 25, 26, 27, 28, 29]. In the DECP generation mechanism photoexcitation induces a sudden shift of the equilibrium coordinate from to and gives a driving force that is dependent on the excited carrier density [15]. The equation of motion can be written as:
| (1) |
The driving force can be approximated by a Heaviside step-function of time if the carriers are created sufficiently fast and live sufficiently long (displacive limit). In this case the coherent ionic displacement can be described by a shifted damped harmonic function:
| (2) |
with the amplitude defined by the equilibrium shift: . The DECP enhancement of the mode of Bi was experimentally confirmed by means of time-resolved x ray diffraction (trXRD) [30, 31, 32, 33, 34, 35]. One of the interests of recent ultrafast spectroscopic experiments on Bi lies on the optical control of its structural and electronic phases. A single-shot transient reflectivity (TR) study [36] observed the disappearance of the coherent phonon signal at absorbed fluence of mJ/cm2 (excitation of 2% of valence electrons) for a 275-nm thick film and attribute it to the theoretically predicted transition to a high-symmetry phase with a single-well PES. The threshold fluence for the phase transition was found to depend on the film thickness, suggesting that the phase transition competes with the electronic transport in the depth direction on a picosecond time scale.
The -symmetry mode of Bi has been much less explored by pump-probe experiments, despite of the theoretical predictions that the ionic displacement can induce the semiconductor-semimetal phase transitions [1, 3, 7]. This is primarily because of its much smaller amplitude compared to the mode [37, 33], as a result of the insusceptibility of equilibrium position along the coordinate to photoexcitation, as schematically illustrated in Fig. 1(c). Indeed, the anisotropic optical polarization-dependence at a low excitation density confirmed the generation of the phonon to be dominated by impulsive stimulated Raman scattering (ISRS) mechanism [19]. The equation of motion for the ISRS can be given by [38, 39]:
| (3) |
with and denoting the electric field of the pump pulse and the Raman tensor. With a sufficiently short light field and a short-lived intermediate state, the driving force can be approximated by a -function of time (impulsive limit), and the ionic displacement can be expressed by:
| (4) |
A density functional theory (DFT) study [13] predicted a strong coupling between the and modes under intense photoexcitation and the emergence of the combination modes at their sum and difference frequencies as a consequence.
In the present study we experimentally investigate the behavior of the displacement in Bi under intense photoexcitation. TR measurements on bulk single crystal Bi are performed at 11 K in the anisotropic detection configuration to monitor the -symmetry phonons, whereas the standard TR measurements are also carried out to monitor the phonons and the electronic response for comparison. We find that the amplitudes of the two phonon modes exhibit strikingly contrasted fluence-dependences; the amplitude reaches a maximum at a considerably lower fluence than the and then turn to an apparent decrease. The initial phases of the two coherent phonons are found to deviate from their low-fluence values with increasing fluence. These results demonstrate the ultrafast dynamics of the phonons intertwined strongly with the phonons and the photocarriers.
II Experimental
The sample studied is a 1-mm thick bulk single crystal Bi with a (0001)-oriented polished surface in hexagonal notation (or (111) in cubic), which was purchased from MaTeck and is used without further treatment. The crystal is mounted in a closed-cycle cryostat with its [110] axis in vertical direction and is kept at 11 K to avoid laser-induced thermal melting of Bi, whose melting point is 271∘C.

Single-color pump-and-probe reflectivity measurements are performed on the Bi crystal with an output of a regenerative amplifier with 120 fs duration, 810 nm wavelength, and 100 kHz repetition rate as the light source. A -mm plano-convex lens focuses the linearly polarized pump and probe beams to the 80 and 40 m spots on the sample with incident angles of and from the surface normal, respectively. Pump beam is modulated with an optical chopper for lock-in detection. We employ two detection schemes to investigate the optical phonons with different symmetries. In the standard TR measurements, the pump-induced change in reflectivity is measured by detecting the probe light before and after reflection at the sample surface with a pair of matched photodetectors. In this configuration the TR signals can be contributed by coherent ionic displacements , photoexcited carrier density , electronic temperature and lattice temperature :
| (5) |
with denoting the phonon modes. In the anisotropic detection scheme we measure by detecting the horizontal () and vertical () polarization components of the probe light with a pair of matched photodiode detectors. This scheme reduces the contribution in the first term of Eq. (II), as well as the last three terms, and thereby enables us to detect the much smaller phonon response efficiently. In both detections configurations, the signal from the detector pair is amplified with a current pre-amplifier and a lock-in amplifier. Time delay between the pump and probe pulses is scanned step by step with a translational stage (slow scan).
III Results
III.1 Coherent Phonon
We first measure anisotropic component of the TR signals to examine the pump fluence-dependence of the phonons. Figure 2(a) shows the anisotropic TR signals for selected absorbed fluences , with and being the incident pump fluence and the reflectivity of Bi for the 800-nm light. The pump polarization is set to be parallel to the [110] crystalline axis to maximize the phonon contribution [19], and the probe is polarized at to it for the anisotropic detection. At the minimum fluence of mJ/cm2 the TR signal shows a negative spike at followed by a periodic modulation predominantly due to the phonon at 2 THz. Fast Fourier transform (FFT) spectrum in Fig. 2(b) shows a small peak at 3 THz due to the imperfect optical polarization in addition to the intense peak. As the fluence is increased, the peak is broadened and redshifted, in agreement with the prior TR study [37]. Meanwhile the peak grows and eventually becomes as distinct as the peak, whereas a smaller peak, possibly a difference-combination mode between the and [19, 37], emerges at 1 THz. Above mJ/cm2 the oscillation in the anisotropic TR signals is overwhelmed by the much larger oscillation and large noise so that the oscillation can no longer resolved.
The oscillatory component of the anisotropic TR signals can be reasonably fitted to the sum of two damped harmonic functions:
| (6) |
where the subscripts and denote the and modes. For simplicity the frequencies are assumed to be linearly chirped:
| (7) |
Figure 2 (c)-(g) summarizes the phonon parameters obtained by the fitting as a function of pump fluence. We find the amplitude increases linearly with increasing fluence up to mJ/cm2 and then turns to an obvious decrease [Fig. 2(c)]. The decrease in the amplitude appears to contradict the simple expectation from the ISRS model, in which the driving force is expected to be proportional to the pump field squared, or to the pump fluence. We will examine the origin of this peculiar fluence-dependence further in the following subsections.
The dephasing rate of the mode increases from 0.077 to 0.8 ps-1, whereas the initial frequency redshifts from 2.1 to 1.8 THz [Fig. 2(d,e)], with increasing fluence from 0.13 to 3.9 mJ/cm2. The initial phase [Fig. 2(g)] is close to zero at the minimum fluence, indicating that the oscillation is nearly a sine function of time, as expected for coherent phonons excited via ISRS in the impulsive limit [Eq. (4)]. Interestingly, the initial phase deviates from zero upon increasing fluence and approaches a value , i.e., between sine and cosine function of time. This indicates that the temporal duration of the driving force can no longer be approximated with a -function at high fluences. We can roughly estimate the duration to be fs. This time scale is much faster than those for the electron-hole recombination or the cooling via the electron-phonon scattering, but it is close to that for the thermalization via the electron-electron scattering [32, 40, 41, 42, 43].
III.2 Electronic and Thermal Responses
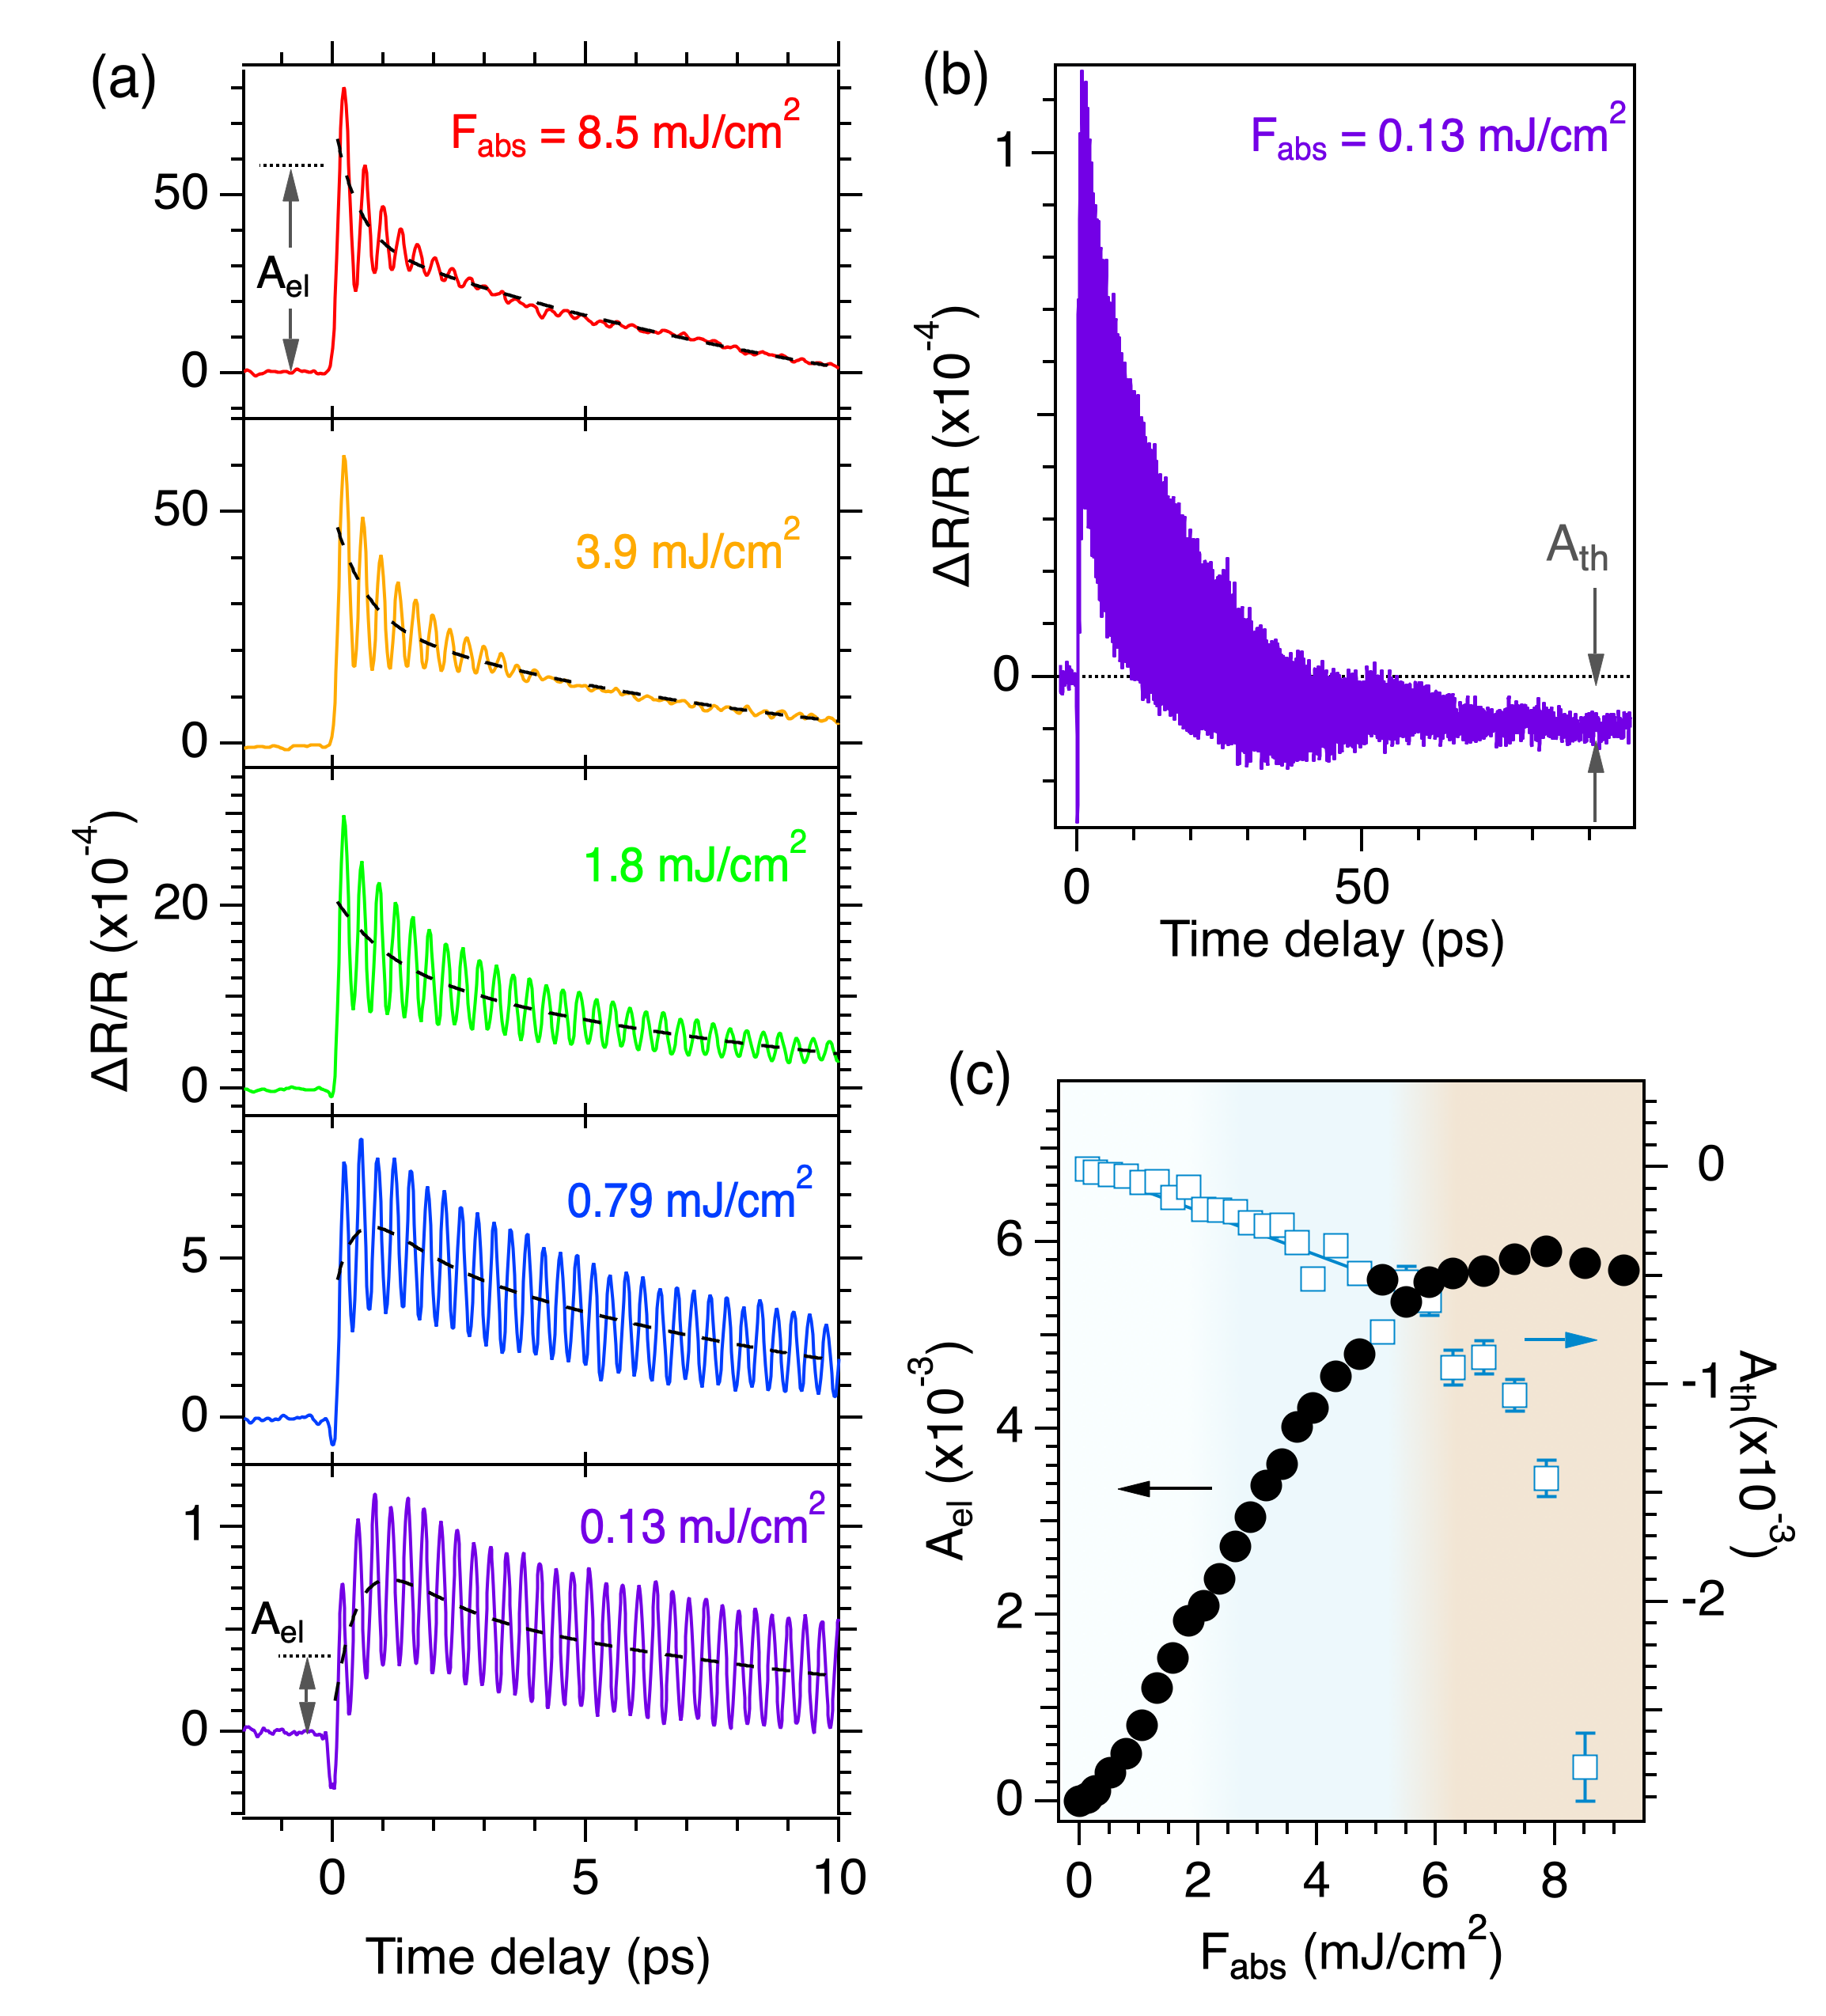
To investigate the mechanism behind the peculiar fluence-dependence of the phonon amplitude [Fig. 2(c)] we next measure the standard TR signals, whose results are shown in Fig. 3(a) for selected fluences. The TR signals consist of the non-oscillatory component due to the incoherent electronic and lattice responses and the oscillatory component due to the coherent phonons. The former can be fitted to a multi-exponential function on top of a baseline:
| (8) |
whose results are indicated with broken curves in Fig. 3(a). At the lowest fluence examined ( mJ/cm2) the non-oscillatory component rises on 1 ps time scale due to intervalley electron-phonon scattering [42, 44, 45]. With increasing fluence the initial rise of the TR signals at becomes more abrupt in time and prominent in the height, suggesting that the intraband electron-electron scattering becomes a dominant decay channel of photoexcited carriers. Since the non-oscillatory signal on sub-picosecond time scale is mainly contributed by the second and third terms of Eq. (II), we can utilize the height of the non-oscillatory component after the initial rise (e.g. at ps) as a semi-quantitatively measure for the initially photoexcited carrier density . We find ps) to grow, first super-linearly () up to mJ/cm2 and then linearly, until it reaches a saturation at mJ/cm2, as plotted with filled symbols in Fig. 3(c). Further increase in the fluence to mJ/cm2 leads to an emergence of large noise in the TR signal during the time delay scan, which is indicative of laser-induced damage of the Bi surface.
Comparison between the fluence-dependence of the amplitude [Fig. 2(c)] and that of the photoexcited carrier density [filled symbols in Fig. 3(c)] reveals a striking difference. The amplitude turns to decrease at a fluence ( mJ/cm2) where the photocarrier density is still growing linearly. The contrast implies that the decrease in the amplitude cannot be attributed to the decrease in the photoexcited carrier density.
At long ( ps) time delays we can roughly estimate the rise in the lattice temperature from the asymptotic value , which is plotted as a function of fluence with open symbols in Fig. 3(c). By adopting the temperature-dependence of the reflectivity in Ref. 46, K-1, the temperature rise at long time delays can be estimated to be and 35 K for the lowest and highest fluence examined, respectively.
III.3 Coherent Phonon
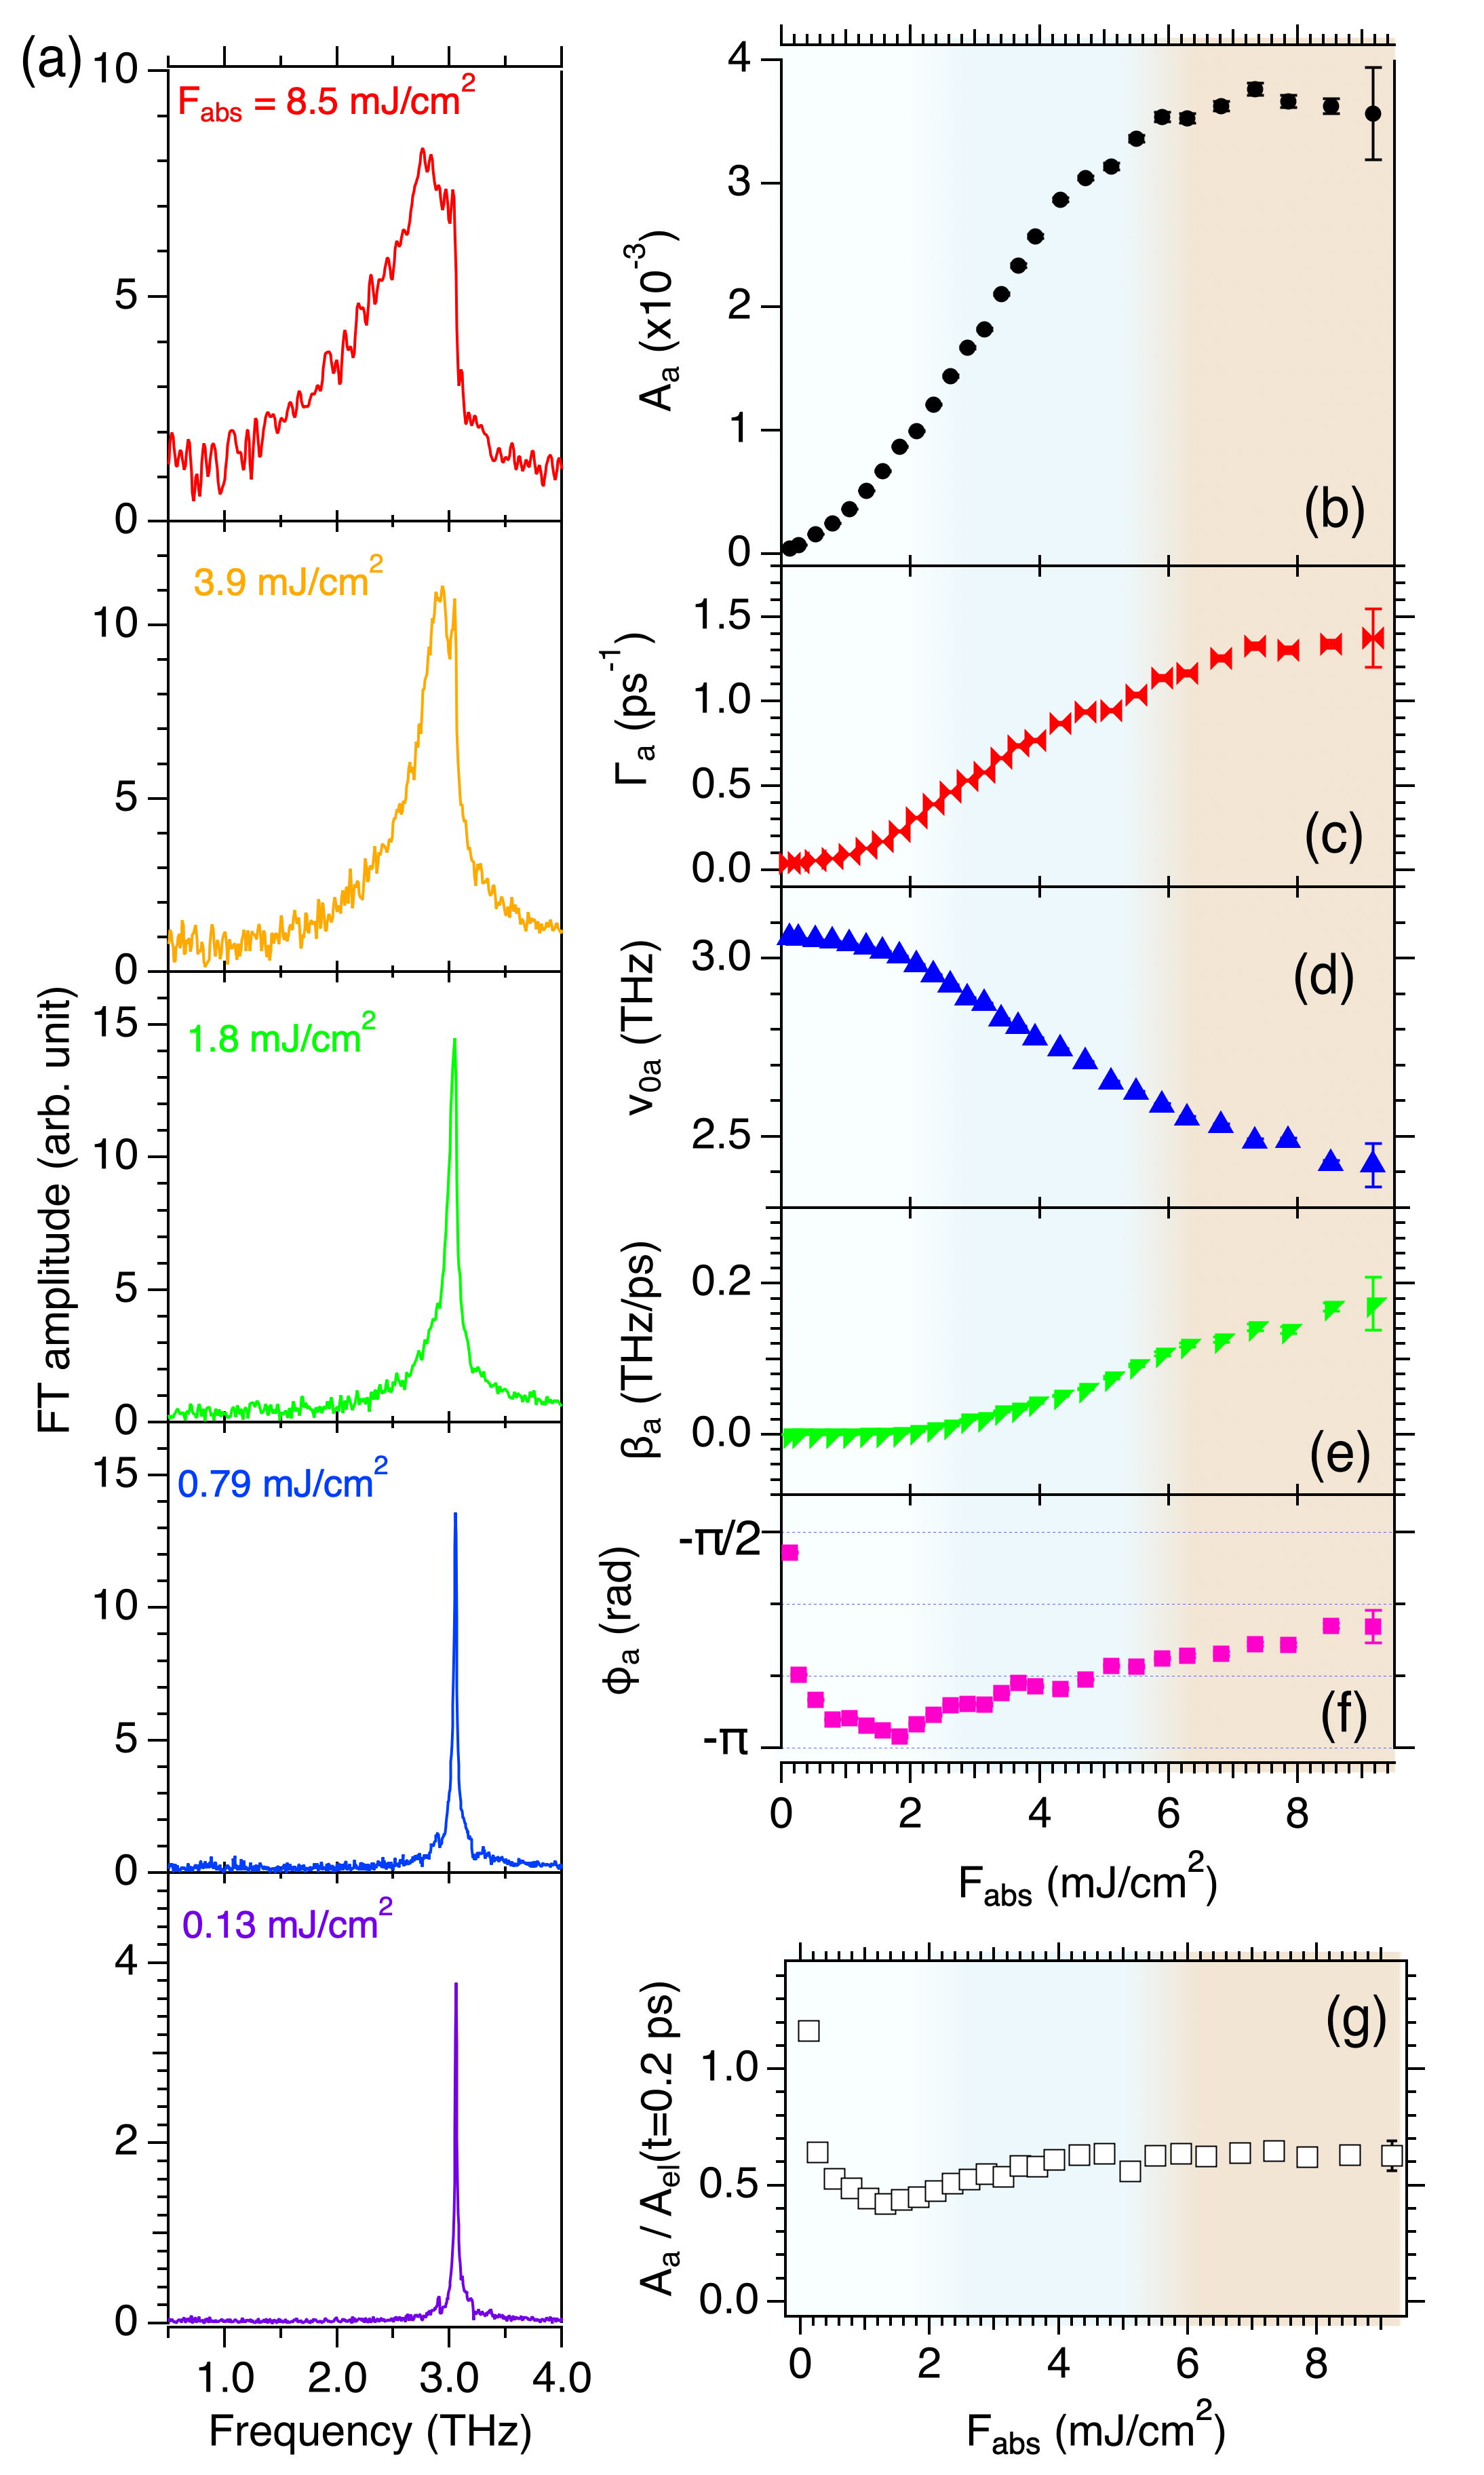
We also extract the phonon response by subtracting the non-oscillatory component (broken curves) from the TR signals in Fig. 3(a). We note that the pump and probe light polarizations are set to be 45∘ and 0∘ to the [110] axis to minimize the contribution to the TR signal [19]. As a result the oscillatory part is dominated by the peak at 3 THz, as demonstrated by the FFT spectra in Fig. 4(a). With increasing fluence the peak is redshifted and broadened asymmetrically, as reported previously [17, 47, 37].
The oscillatory TR signals can be fitted reasonably, though not perfectly, to the second term of Eq. (III.1). The obtained phonon parameters are plotted as a function of pump fluence in Fig. 4(b)-(f). The amplitude first increases linearly in the low fluence regime ( mJ/cm2), then super-linearly () in the intermediate fluence regime ( mJ/cm2), and finally reaches a saturation in the high fluence regime ( mJ/cm2), in quantitative agreement with the prior report [48]. The behavior is also in rough agreement with that of photoexcited carrier density [filled symbols in Fig. 3(c)], demonstrating that the amplitude is approximately proportional to the carrier density over all fluence range examined. In other words, the decrease in the amplitude for mJ/cm2 [Fig. 2(c)] is characteristic to the mode alone and not because the crystalline lattice approaches the high-symmetry phase and therefore becomes unstable, for example.
The initial phase is close to at the minimum fluence of mJ/cm2, as expected for coherent phonons excited in the displacive limit (Eq. (2)). With increasing fluence the initial phase first approaches quickly to and then gradually toward , however. The behavior of the initial phase is parallel to that of the mode [Fig. 2(g)]; the time scale of the transition is estimated to be fs at maximum, which is close to what we have estimated for the mode. We can therefore conclude that the transition from the ground-state PES to the excited state one can be regarded to be instantaneous at the lowest pump fluence but is taking longer time up to fs with increasing fluence.
The longer transition time can also explain the slightly different fluence-dependences of the phonon and the electronic responses. The ratio of to 0.2 ps), plotted in Fig. 4(g), is close to unity at the minimum fluence examined, indicating almost perfect conversion of the sudden equilibrium shift (from to in Fig. 1(b)) to the coherent phonon via the DECP mechanism. With increasing fluence, the ratio abruptly decrease to and stays around the value, suggesting less efficient conversion due to the slightly longer time required for the equilibrium shift, though it is still fast enough to induce the coherent phonons.
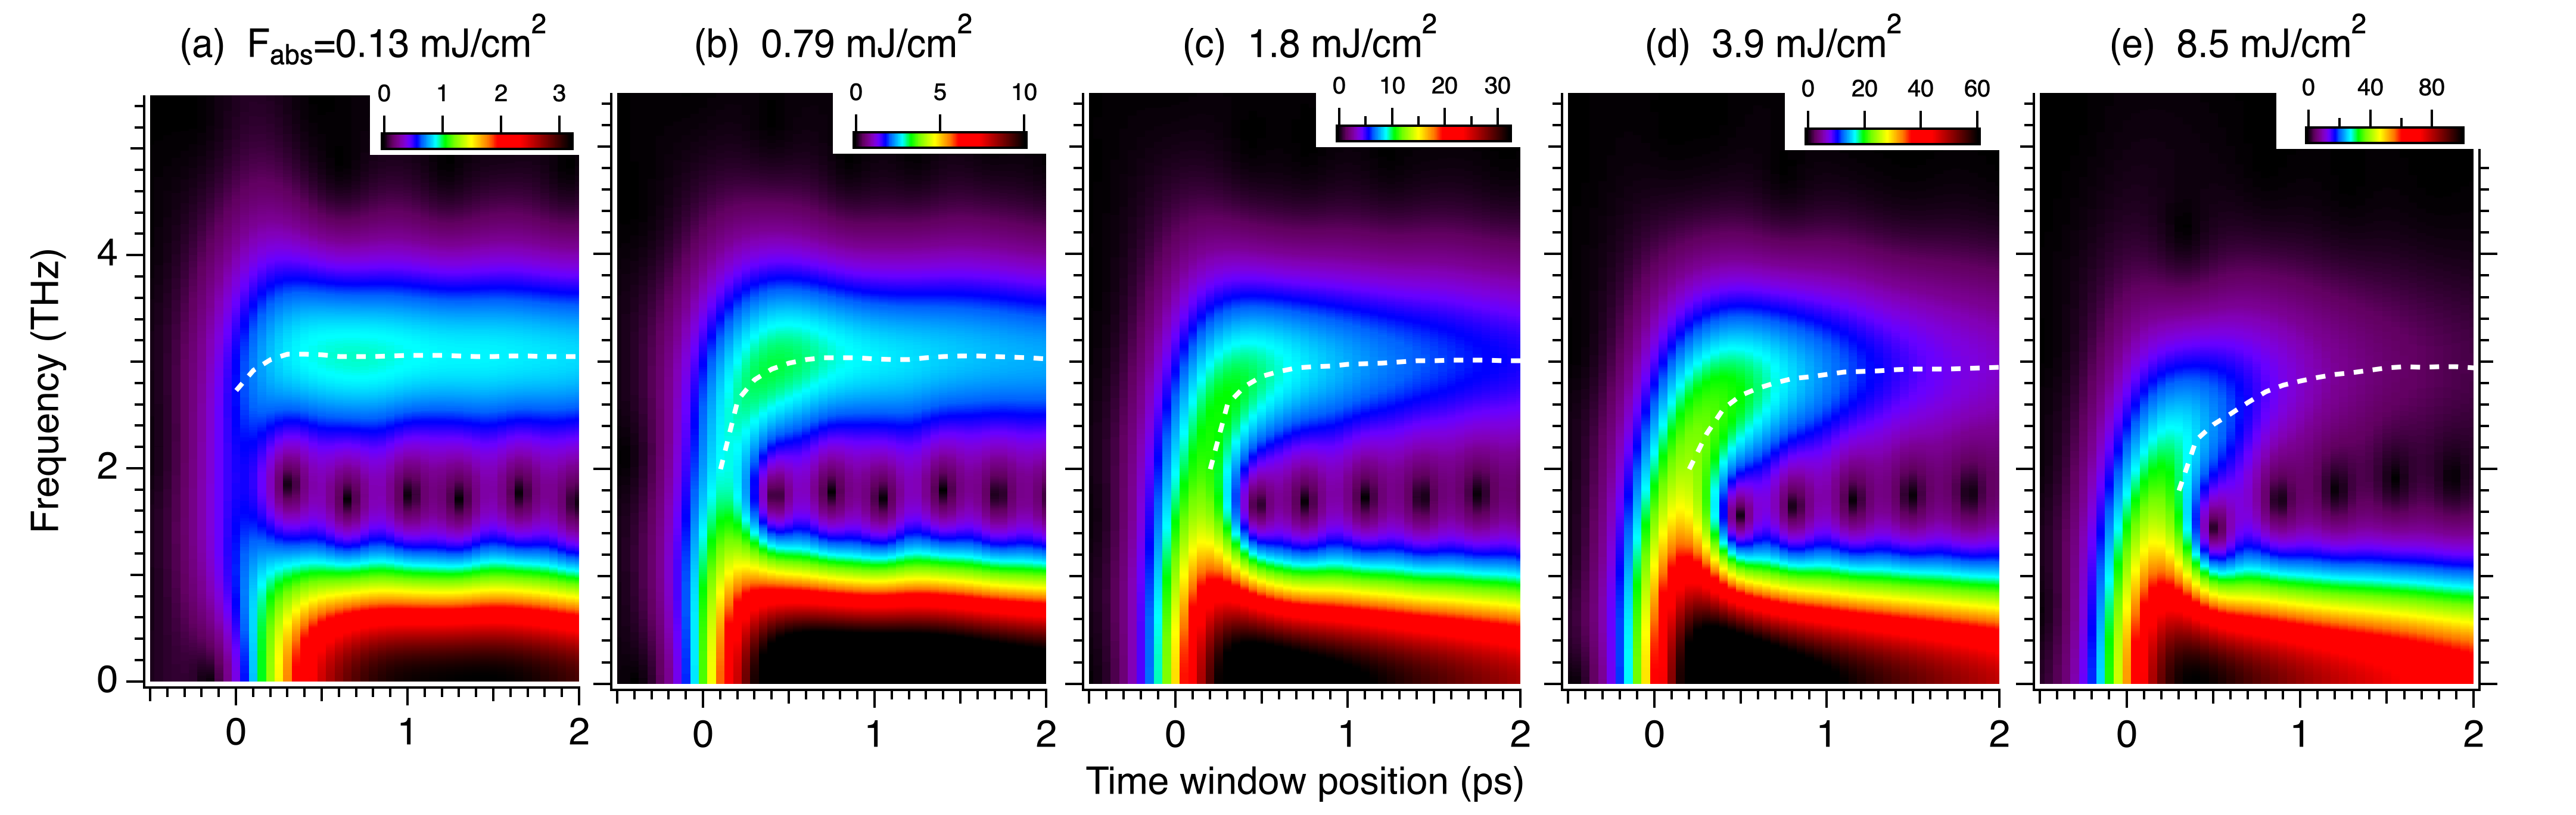
The timescale of the PES transition can be visualized by performing time-windowed Fourier transform on the TR signals [Fig. 3(a)], whose results are summarized as false-color plots in Fig. 5. At the lowest fluence [Fig. 5(a)] both the phononic response at 3 THz and the electronic response at THz emerge within the half width of the time window used in the analysis (0.33 ps). The phononic and the electronic responses are well separated from each other, except for a weak narrow overlap centered at THz at early time delays ( ps). With increasing fluence the overlap between the two components grows stronger, and the transient blueshift in the frequency within the first picosecond becomes more distinct. At the highest fluence [Fig. 5(e)] it takes as long as 1 ps for the frequency to reach the asymptotic value, which is comparable to the dephasing time of the phonon at this fluence.
From the time-windowed FT analyses [Fig. 5] we can conclude that the characteristic time for the transition from the ground-state to the excited-state PES depends on the pump fluence. Though there have been no theoretical knowledge for the transition dynamics for the phonon of Bi, a recent time-dependent DFT simulations [49] predicted a fluence-dependent transition time for the phonon of tellurium elemental crystal, whose generation is also dominated by the DECP mechanism. By analogy, we can interpret our observations in the present study as follows. At a low fluence and a small ionic displacement, where the excited-state PES can be approximated to be parabolic, the shift to the new equilibrium occurs well within a single oscillation cycle (100 fs). The phase shifts observed as a function of fluence [Figs. 2(g) and 4(f)] suggest that this initial equilibrium shift takes slightly longer time with increasing fluence. At a high fluence and a large displacement, where the PES is better described by a double well, the initial equilibrium shift also occurs within the first cycle, but is followed by a slower transformation from a double-well to a single-well PES on a picosecond time scale.
IV discussion
We now discuss the origin of the peculiar fluence-dependence of the phonon amplitude [Fig. 2(c)]. The behavior could not be explained by a simple non-resonant or resonant ISRS model, in which the coherent phonon amplitude should be proportional to the pump fluence or to photocarrier density. Based on the theoretical simulations that predicted a strong phonon-phonon coupling [13] we propose that the amplitude is reduced through the coupling with the coherent displacement, which can be excited at an-order-of-magnitude larger amplitude than the mode under intense photoexcitation [33]. We note that even in the anisotropic TR measurements employed in Sect. III.1 coherent phonons are generated at the same amplitude as in the standard TR measurements in Sect. III.3 but are reduced only in the detection process using the former scheme.
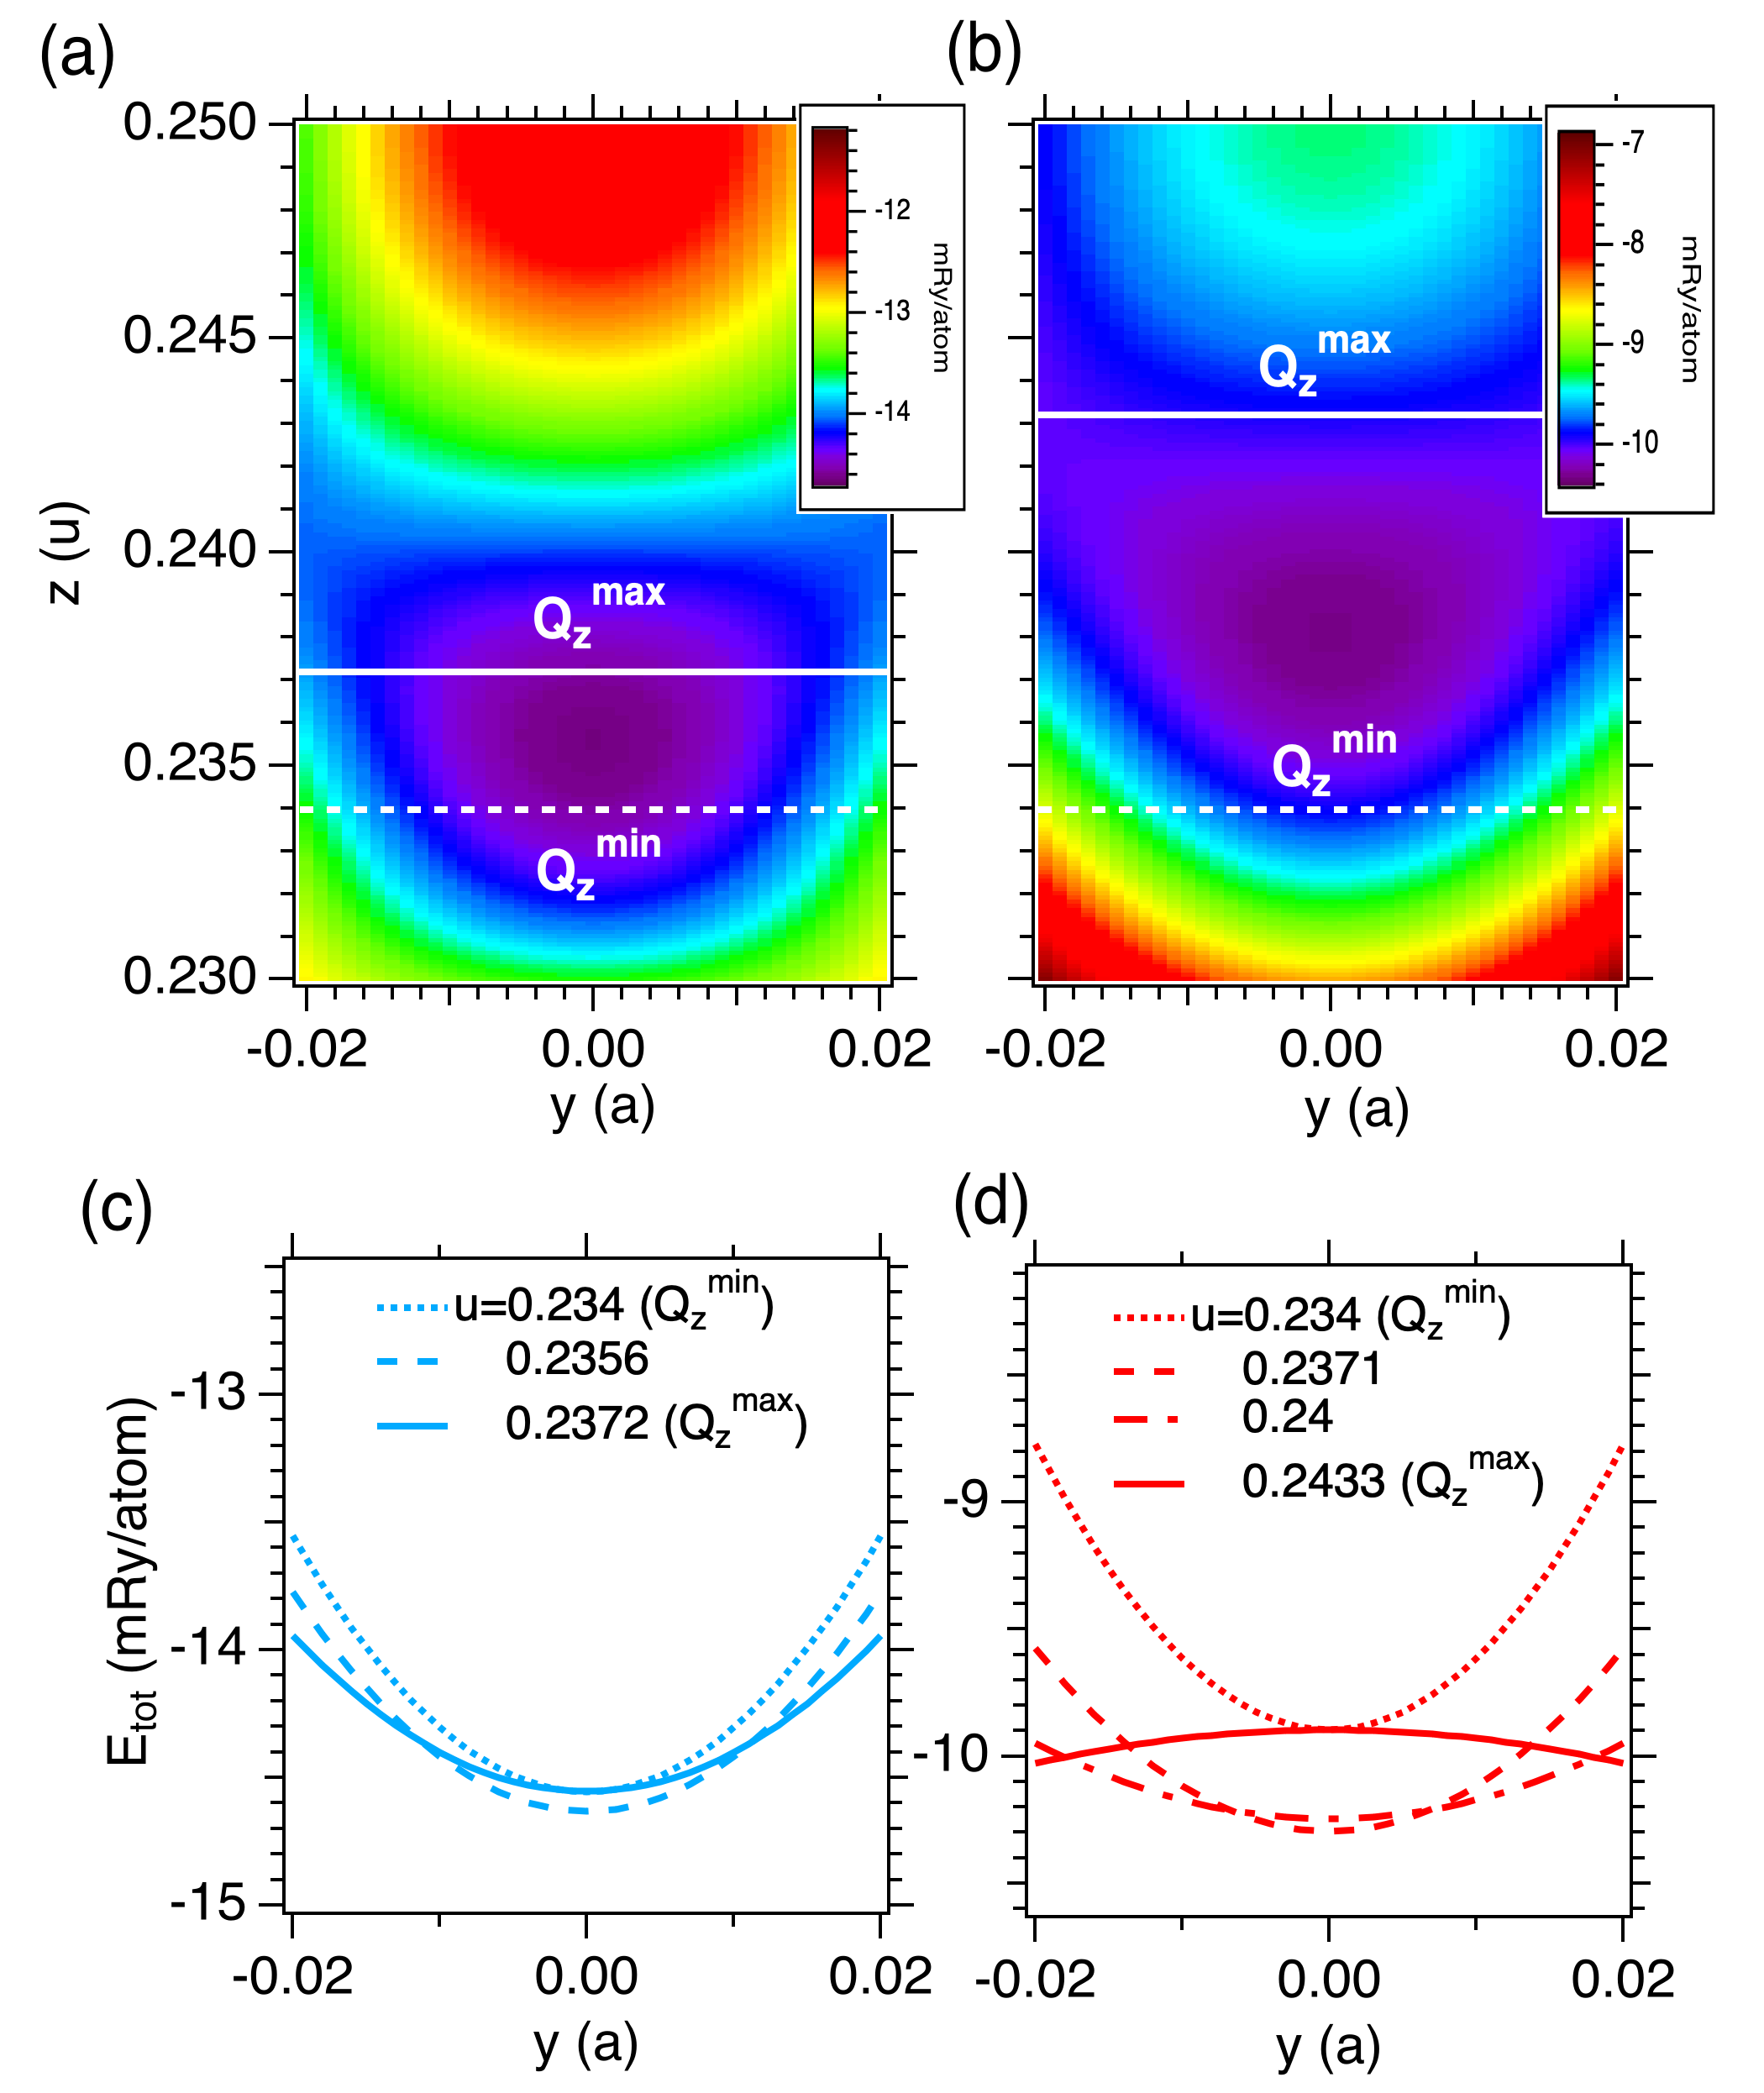
The prior DFT study [13] provided two-dimensional PESs as functions of and coordinates, as reconstructed in Fig. 6(a,b) using parameters listed in the literature, from which we can have a rough overview on how the large-amplitude motion would affect the motion. At a low excitation density [Fig. 6(a)] the PES is similar to that in the ground state, with a double-well shape along the coordinate () and a single parabola along the coordinate (), as also illustrated in Fig. 1(b,c). Even at the low excitation (0.5% of valence electrons), however, the ionic displacement along the coordinate between and introduces a small temporal fluctuation in the PES along the coordinate, as shown in Fig. 6(c). At a higher excitation density [Fig. 6(b)] a larger displacement and a lower barrier in the double-well along the coordinate lead to a drastic fluctuation in the PES along the coordinate, as shown in Fig. 6(d). With 1.42% of valence electrons excited, the PES along the coordinate has a negative curvature when the ion reaches its maximum in the direction. We infer that this situation would lead to a quick loss of the coherence of the displacement within the first cycle of the oscillation, and thereby to the effective suppression of coherent phonons at high fluences as observed in Fig. 2.
Based on the above considerations we categorize the fluence-dependence of the coherent phonons of Bi as follows.
I. Minimum fluence ( mJ/cm2 or of valence electrons). The excited-state PES can be approximated by a single parabola along both the and coordinates, with its equilibrium shifted along the coordinate. The transition to the excited-state PES occurs instantaneously, i.e., fast enough compared to the phonon periods, leading to the generation of coherent and Eg phonons via the DECP mechanism in the displacive limit and via the ISRS mechanism in the impulsive limit, respectively.
II. Low fluence regime ( mJ/cm2 or of valence electrons). The excited-state PES is no longer parabolic along either or coordinate, as manifested by the deviations of the dephasing rates, the frequencies, and the chirps from the values in regime I. Coherent and phonons are excited via the similar mechanisms to those in regime I. Transition to the excited-state PES is no longer instantaneous, however, leading to the deviations of their initial phases as well as to the less efficient conversion of the equilibrium shift to the displacement.
III. Intermediate fluence regime ( mJ/cm2 or of valence electrons). Deviation of the PES along the coordinate from a parabola becomes so significant that a large-amplitude ionic displacement along the coordinate leads to the a temporal fluctuation of the PES along the coordinate and thereby to the suppression of amplitude. Meanwhile the amplitude still keeps increasing with fluence, in accordance with photoexcited carrier density. The transition to the excited-state PES along the coordinate takes even longer time than in regime II and can be described by a fast (100 fs) equilibrium shift followed by the slower (1 ps) deformation of the PES.
IV. High fluence regime ( mJ/cm2 or of valence electrons). Photoexcited carrier density and the amplitude reach saturations, while the oscillation could no longer be resolved clearly. The lattice system approaches photo-induced instability.
In contrast to the earlier single-shot TR study [36] that reported the phase transition to a high-symmetry phase at mJ/cm2 at 80 K, in the present study we never observed complete disappearance of the phonon in the TR signals until the surface damage occurred at mJ/cm2 at 11 K. The discrepancy suggests a possibility of the high-symmetry phase being metastable and existing only for a fraction of a second, before the lattice proceeds to an irreversible damage. Whereas the single-shot detection employed in Ref. 36 has sufficient time resolution (in the lab time) to detect such a transient phenomenon, the slow scan scheme employed in the present study does not. The damage threshold in the present study is higher than the phase transition threshold in the literature, possibly due to more efficient cooling of the laser-irradiated volume due to lower temperature and larger sample thickness in the present study.
It would be informative to give a rough estimation of the maximum real-space displacements achieved in the present study. A prior TRXRD study [33] evaluated the displacements in the and axes to be and pm and pm at mJ/cm2, which is within the regime II according to the above classification. By linearly extrapolating these values we would obtain pm at 3 mJ/cm2 and pm at 6 mJ/cm2 as the maximum displacements along the and coordinates. The latter value would correspond to an internal displacement using nm, which is below the theoretically predicted threshold for the semimetal to metal transition, [8]. Similarly, the former ( pm) would modify the hexagonal lattice constant pm by , which would be too small to cause a semimetal to semiconductor transition [3, 7]. These comparisons support that the electronic phase transitions could not be realized by exciting large-amplitude coherent phonons with a single intense laser pulse in the present experimental condition.
V Conclusion
Ultrafast coupling of coherent phonons to the phonons and photoexcited carriers were examined in Bi under intense photoexcitation up to the photo-induced surface damage threshold. The initial phases of the phonon modes indicated that the transition from the ground-state PES to the excited-state is instantaneous only at the minimum pump fluence examined and takes a finite time at higher fluences. With increasing fluence the amplitude reached its maximum at a much lower fluence than the amplitude. The contrasted behaviors were explained in terms of the temporal fluctuation of the PES along the coordinate as the Bi ions oscillate at a much larger amplitude along the coordinate. This coupling is unilateral in the sense that the phonons are coupled much more strongly with the photocarriers and are barely affected by the phonon dynamics. The maximum and phonon amplitudes achieved in the present study are far smaller than the theoretically predicted thresholds for semimetal-to-semiconductor and semimetal-to-metal transitions, demonstrating the difficulty of achieving the electronic transitions by exciting large-amplitude coherent phonons.
References
- Shick et al. [1999] A. B. Shick, J. B. Ketterson, D. L. Novikov, and A. J. Freeman, Electronic structure, phase stability, and semimetal-semiconductor transitions in Bi, Phys. Rev. B 60, 15484 (1999).
- Ohtsubo et al. [2013] Y. Ohtsubo, L. Perfetti, M. O. Goerbig, P. L. Fevre, F. Bertran, and A. Taleb-Ibrahimi, Non-trivial surface-band dispersion on Bi(111), New J. Phys. 15, 033041 (2013).
- Aguilera et al. [2015] I. Aguilera, C. Friedrich, and S. Blügel, Electronic phase transitions of bismuth under strain from relativistic self-consistent GW calculations, Phys. Rev. B 91, 125129 (2015).
- Schindler et al. [2018] F. Schindler, Z. Wang, M. G. Vergniory, A. M. Cook, A. Murani, S. Sengupta, A. Y. Kasumov, R. Deblock, S. Jeon, I. Drozdov, H. Bouchiat, S. Gueron, A. Yazdani, B. A. Bernevig, and T. Neupert, Higher-order topology in bismuth, Nat. Phys. 14, 918 (2018).
- Nayak et al. [2019] A. K. Nayak, J. Reiner, R. Queiroz, H. Fu, C. Shekhar, B. Yan, C. Felser, N. Avraham, and H. Beidenkopf, Resolving the topological classification of bismuth with topological defects, Sci. Adv. 5, eaax6996 (2019).
- Jin et al. [2020] K.-H. Jin, H. W. Yeom, and F. Liu, Doping-induced topological phase transition in Bi: The role of quantum electronic stress, Phys. Rev. B 101, 035111 (2020).
- Wu et al. [2018] C. Y. Wu, J. C. Han, L. Sun, H. R. Gong, and C. P. Liang, Effects of trigonal deformation on electronic structure and thermoelectric properties of bismuth, J. Phys., Condens. Matter. 30, 285504 (2018).
- Wu et al. [2019] C. Y. Wu, L. Sun, H. R. Gong, and S. F. Zhou, Influence of internal displacement on band structure, phase transition, and thermoelectric properties of bismuth, J. Mater. Sci. 54, 6347 (2019).
- Zouhar and Sob [2016] M. Zouhar and M. Sob, Ab initio study of deformed As, Sb, and Bi with an application to thin films, Phys. Rev. B 94, 184110 (2016).
- Armitage et al. [2010] N. P. Armitage, R. Tediosi, F. Lévy, E. Giannini, L. Forro, and D. van der Marel, Infrared conductivity of elemental bismuth under pressure: Evidence for an avoided lifshitz-type semimetal-semiconductor transition, Phys. Rev. Lett. 104, 237401 (2010).
- Brown et al. [2015] P. Brown, K. Semeniuk, A. Vasiljkovic, and F. M. Grosche, Pressure-induced semimetal-to-semiconductor transition in bismuth, Physics Procedia 75, 29 (2015).
- Murray et al. [2005] E. Murray, D. Fritz, J. Wahlstrand, S. Fahy, and D. Reis, Effect of lattice anharmonicity on high-amplitude phonon dynamics in photoexcited bismuth, Phys. Rev. B 72, 060301(R) (2005).
- Zijlstra et al. [2006] E. S. Zijlstra, L. L. Tatarinova, and M. E. Garcia, Laser-induced phonon-phonon interactions in bismuth, Phys. Rev. B 74, 220301 (2006).
- Cheng et al. [1991] T. Cheng, J. Vidal, H. Zeiger, G. Dresselhaus, M. Dresselhaus, and E. Ippen, Mechanism for dislpacive excitation of coherent phonons in Sb, Bi, Te and Ti2O3, Appl. Phys. Lett. 59, 1923 (1991).
- Zeiger et al. [1992] H. Zeiger, J. Vidal, T. Cheng, E. Ippen, G. Dresselhaus, and M. Dresselhaus, Theory for displacive excitation of coherent phonons, Phys. Rev. B 45, 768 (1992).
- Cheng et al. [1990] T. Cheng, S. Brorson, A. Kazeroonian, J. Moodera, G. Dresselhaus, M. Dresselhaus, and E. Ippen, Impulsive excitation of coherent phonons observed in reflection in bismuth and antimony, Appl. Phys. Lett. 57, 1004 (1990).
- Hase et al. [2002] M. Hase, M. Kitajima, S. Nakashima, and K. Mizoguchi, Dynamics of coherent anharmonic phonons in bismuth using high density photoexcitation, Phys. Rev. Lett. 88, 067401 (2002).
- [18] O. Misochko, M. Hase, K. Ishioka, and M. Kitajima, Observation of an amplitude collapse and revival of chirped coherent phonons in bismuth, Phys. Rev. Lett. 92, 197401.
- Ishioka et al. [2006] K. Ishioka, M. Kitajima, and O. Misochko, Temperature dependence of coherent A1g and phonons of bismuth, J. Appl. Phys. 100, 093501 (2006).
- Boschetto et al. [2008] D. Boschetto, E. G. Gamaly, A. V. Rode, B. Luther-Davies, D. Glijer, T. Garl, O. Albert, A. Rousse, and J. Etchepare, Small atomic displacements recorded in bismuth by the optical reflectivity of femtosecond laser-pulse excitations, Phys. Rev. Lett. 100, 027404 (2008).
- Katsuki et al. [2013] H. Katsuki, J. C. Delagnes, K. Hosaka, K. Ishioka, H. Chiba, E. S. Zijlstra, M. E. Garcia, H. Takahashi, K. Watanabe, M. Kitajima, Y. Matsumoto, K. G. Nakamura, and K. Ohmori, All-optical control and visualization of ultrafast two-dimensional atomic motions in a single crystal of bismuth, Nat Commun 4, 2801 (2013).
- Sheu et al. [2013] Y. M. Sheu, Y. J. Chien, C. Uher, S. Fahy, and D. A. Reis, Free-carrier relaxation and lattice heating in photoexcited bismuth, Phys. Rev. B 87, 075429 (2013).
- Misochko et al. [2014] O. V. Misochko, M. V. Lebedev, and E. V. Lebedeva, Inhomogeneity as a source of collapse and revival for large-amplitude chirped coherent phonons in bismuth, Phys. Rev. B 90, 014301 (2014).
- Cheng et al. [2017] Y.-H. Cheng, F. Y. Gao, S. W. Teitelbaum, and K. A. Nelson, Coherent control of optical phonons in bismuth, Phys. Rev. B 96, 134302 (2017).
- Geneaux et al. [2021] R. Geneaux, I. Timrov, C. J. Kaplan, A. D. Ross, P. M. Kraus, and S. R. Leone, Coherent energy exchange between carriers and phonons in peierls-distorted bismuth unveiled by broadband xuv pulses, Phys. Rev. Res. 3, 033210 (2021).
- Thiemann et al. [2022] F. Thiemann, G. Sciaini, A. Kassen, U. Hagemann, F. M. zu Heringdorf, and M. Horn-von Hoegen, Ultrafast transport-mediated homogenization of photoexcited electrons governs the softening of the phonon in bismuth, Phys. Rev. B 106, 014315 (2022).
- Papalazarou et al. [2012] E. Papalazarou, J. Faure, J. Mauchain, M. Marsi, A. Taleb-Ibrahimi, I. Reshetnyak, A. van Roekeghem, I. Timrov, N. Vast, B. Arnaud, and L. Perfetti, Coherent phonon coupling to individual bloch states in photoexcited bismuth, Phys. Rev. Lett. 108, 256808 (2012).
- Leuenberger et al. [2013] D. Leuenberger, H. Yanagisawa, S. Roth, J. H. Dil, J. W. Wells, P. Hofmann, J. Osterwalder, and M. Hengsberger, Excitation of Coherent Phonons in the One-Dimensional Bi(114) Surface, Phys. Rev. Lett. 110, 136806 (2013).
- Perfetti et al. [2015] L. Perfetti, J. Faure, E. Papalazarou, J. Mauchain, M. Marsi, M. O. Goerbig, A. Taleb-Ibrahimi, and Y. Ohtsubo, New asperts of electronic excitations at the bismuth surface: Topology, thermalization and coupling to coherent phonons, J. Electron Spectroscopy and Related Phenomena 201, 60 (2015).
- Sokolowski-Tinten et al. [2003] K. Sokolowski-Tinten, C. Blome, J. Blums, A. Cavalleri, C. Dietrich, A. Tarasevitch, I. Uschmann, E. Förster, M. Kammler, M. Horn-von Hoegen, and D. von der Linde, Femtosecond x-ray measurement of coherent lattice vibrations near the lindemann stability limit, Nature 422, 287 (2003).
- Fritz et al. [2007] D. M. Fritz, D. A. Reis, B. Adams, R. A. Akre, J. Arthur, C. Blome, P. H. Bucksbaum, A. L. Cavalieri, S. Engemann, S. Fahy, R. W. Falcone, P. H. Fuoss, K. J. Gaffney, M. J. George, J. Hajdu, M. P. Hertlein, P. B. Hillyard, M. Horn-von Hoegen, M. Kammler, J. Kaspar, R. Kienberger, P. Krejcik, S. H. Lee, A. M. Lindenberg, B. McFarland, D. Meyer, T. Montagne, E. D. Murray, A. J. Nelson, M. Nicoul, R. Pahl, J. Rudati, H. Schlarb, D. P. Siddons, K. Sokolowski-Tinten, T. Tschentscher, D. von der Linde, and J. B. Hastings, Ultrafast bond softening in bismuth: Mapping a solid’s interatomic potential with x-rays, Science 315, 633 (2007).
- Johnson et al. [2008] S. L. Johnson, P. Beaud, C. J. Milne, F. S. Krasniqi, E. S. Zijlstra, M. E. Garcia, M. Kaiser, D. Grolimund, R. Abela, and G. Ingold, Nanoscale depth-resolved coherent femtosecond motion in laser-excited bismuth, Phys. Rev. Lett. 100, 155501 (2008).
- Johnson et al. [2013] S. L. Johnson, P. Beaud, E. Mohr-Vorobeva, A. Caviezel, G. Ingold, and C. J. Milne, Direct observation of non-fully-symmetric coherent optical phonons by femtosecond x-ray diffraction, Phys. Rev. B 87, 054301 (2013).
- Teitelbaum et al. [2021] S. W. Teitelbaum, T. C. Henighan, H. Liu, M. P. Jiang, D. Zhu, M. Chollet, T. Sato, E. D. Murray, S. Fahy, S. O’Mahony, T. P. Bailey, C. Uher, M. Trigo, and D. A. Reis, Measurements of nonequilibrium interatomic forces using time-domain x-ray scattering, Phys. Rev. B 103, L180101 (2021).
- Kubota et al. [2023] Y. Kubota, Y. Tanaka, T. Togashi, T. Ebisu, K. Tamasaku, H. Osawa, T. Wada, O. Sugino, I. Matsuda, and M. Yabashi, Suppression of atomic displacive excitation in photo-induced phonon mode of bismuth unveiled by low-temperature time-resolved x-ray diffraction, Appl. Phys. Lett. 122, 092201 (2023).
- Teitelbaum et al. [2018] S. W. Teitelbaum, T. Shin, J. W. Wolfson, Y.-H. Cheng, I. J. Porter, M. Kandyla, and K. A. Nelson, Real-time observation of a coherent lattice transformation into a high-symmetry phase, Phys. Rev. X 8, 031081 (2018).
- Misochko et al. [2007] O. Misochko, K. Ishioka, M. Hase, and M. Kitajima, Fano interference for large-amplitude coherent phonons in bismuth, J. Phys.: Condens. Matter 19, 156227 (2007).
- Dhar et al. [1994] L. Dhar, J. Rogers, and K. Nelson, Time-resolved vibrational spectroscopy in the impulsive limit, Chem. Rev. 94, 157 (1994).
- Först and Dekorsy [2007] M. Först and T. Dekorsy, Coherent phonons in bulk and low-dimensional semiconductors, Coherent Vibrational Dynamics, Practical Spectroscopy, 130 (2007).
- Sciaini et al. [2009] G. Sciaini, M. Harb, S. G. Kruglik, T. Payer, C. T. Hebeisen, F.-J. M. z. Heringdorf, M. Yamaguchi, M. H.-v. Hoegen, R. Ernstorfer, and R. J. D. Miller, Electronic acceleration of atomic motions and disordering in bismuth, Nature 458, 56 (2009).
- Giret et al. [2011] Y. Giret, A. Gellé, and B. Arnaud, Entropy driven atomic motion in laser-excited bismuth, Phys. Rev. Lett. 106, 155503 (2011).
- Timrov et al. [2012] I. Timrov, T. Kampfrath, J. Faure, N. Vast, C. R. Ast, C. Frischkorn, M. Wolf, P. Gava, and L. Perfetti, Thermalization of photoexcited carriers in bismuth investigated by time-resolved terahertz spectroscopy and ab initio calculations, Phys. Rev. B 85, 155139 (2012).
- Faure et al. [2013] J. Faure, J. Mauchain, E. Papalazarou, M. Marsi, D. Boschetto, I. Timrov, N. Vast, Y. Ohtsubo, B. Arnaud, and L. Perfetti, Direct observation of electron thermalization and electron-phonon coupling in photoexcited bismuth, Phys. Rev. B 88, 075120 (2013).
- Melnikov et al. [2013] A. A. Melnikov, O. V. Misochko, and S. V. Chekalin, Ultrafast electronic dynamics in laser-excited crystalline bismuth, J. Appl. Phys. 114, 033502 (2013).
- Bronner and Tegeder [2014] C. Bronner and P. Tegeder, Relaxation dynamics of photoexcited charge carriers at the Bi(111) surface, Phys. Rev. B 89, 115105 (2014).
- Wu and Xu [2007] A. Q. Wu and X. Xu, Coupling of ultrafast laser energy to coherent phonons in bismuth, Appl. Phys. Lett. 90, 251111 (2007).
- Misochko et al. [2006] O. Misochko, K. Ishioka, M. Hase, and M. Kitajima, Fully symmetric and doubly degenerate coherent phonons in semimetals at low temperature and high excitation: similarities and differences, J. Phys.: Condens. Matter 18, 10571 (2006).
- Misochko and Lebedev [2009] O. V. Misochko and M. V. Lebedev, Investigation of the dependence of the coherent dynamics of a bismuth lattice on the crystal excitation level, J. Exp. Theor. Phys. 109, 805 (2009).
- Ning et al. [2022] H. L. Ning, O. Mehio, C. Lian, X. W. Li, E. Zoghlin, P. S. Zhou, B. Y. Cheng, S. D. Wilson, B. M. Wong, and D. V. Hsieh, Light-induced Weyl semiconductor-to-metal transition mediated by Peierls instability, Phys. Rev. B 106, 205118 (2022).