Benchmarking Distributed Coordination Systems: A Survey and Analysis
Abstract.
Coordination services and protocols are critical components of distributed systems and are essential for providing consistency, fault tolerance, and scalability. However, due to lack of a standard benchmarking tool for distributed coordination services, coordination service developers/researchers either use a NoSQL standard benchmark and omit evaluating consistency, distribution, and fault-tolerance; or create their own ad-hoc microbenchmarks and skip comparability with other services. In this paper, we analyze and compare known and widely used distributed coordination services, their evaluations, and the tools used to benchmark those systems. We identify important requirements of distributed coordination service benchmarking like the metrics and parameters that need to be evaluated and their evaluation setups and tools.
1. Introduction
Cloud and web-based big-data applications such as search engines, social networks, video streaming platforms, file sharing tools, and the Internet of Things (IoT) are implemented as distributed systems, where a collection of nodes cooperate to achieve a common task for increased performance, availability, and scalability purposes. Developing, debugging, and evaluating such distributed systems have been a challenging task due to the coordination needed between the participating nodes of such systems.
Distributed coordination is required for a variety of purposes, including synchronization, locking, group membership, ownership, and reaching consensus. For the last three or four decades, the distributed systems community has been developing protocols and services to achieve robust and scalable coordination in distributed applications. As one of the earliest efforts in this area, Paxos (Lamport, 1998) protocol was introduced by Lamport. The basic Paxos protocol gave rise to many variations and follow-up work, such as Disk Paxos (Gafni and Lamport, 2003), Cheap Paxos (Lamport and Massa, 2004), Fast Paxos (Lamport, 2006), Generalized Paxos (Lamport, 2005), and Raft (Ongaro and Ousterhout, 2014). To decrease the latency in Paxos communication and scale it to wide-area settings, many extensions were proposed, such as Mencius (Mao et al., 2008), Flexible Paxos (FPaxos) (Howard et al., 2016), Egalitarian Paxos (E-Paxos) (Moraru I, 2013), WPaxos (Ailijiang et al., 2017), and SwiftPaxos (Ryabinin et al., 2024).
The difficulties in dealing with low-level Paxos and its variants in application development led to systems like ZooKeeper (Hunt et al., 2010), Chubby (M., 2006), Tango (Balakrishnan et al., 2013), and WanKeeper (Ailijiang et al., 2017) which abstracted away distributed coordination and provided frequently used coordination primitives as a service to the application developers. Many distributed applications and especially high-demand distributed data stores such as Google’s Spanner (Corbett et al., 2013), Yahoo!’s PNUTS (Cooper et al., 2008), Apache’s Mesos (Hindman et al., 2011) and Kafka (Kreps et al., 2011), and Twitter’s Manhattan (Twitter, 2014) were built on top of such coordination services, each requiring different levels of synchronization, consistency, and availability guarantees.
Whether it is the development of a distributed coordination protocol or service or development of an application employing these protocols/services, one of the significant challenges the developers face is the lack of standard benchmarking tools which could provide a comprehensive evaluation of the coordination framework: in terms of its performance, availability, scalability, and consistency guarantees. As of now, most developers use ad-hoc limited microbenchmarks to evaluate only a fraction of the functionality and use customized metrics and techniques. This results in a lack of comparability between coordination mechanisms and may lead to unfair claims of advantages over the competition.
In this paper, we study, analyze, and compare how different coordination systems are evaluated. More specifically, we try o answer the following questions: What are the different evaluation metrics and parameters used by popular consensus algorithms, coordination services, and distributed applications? What are the major challenges and general requirements for achieving end-to-end benchmarking in distributed coordination systems? What functionality do the existing benchmarking systems provide, and where do they fell short in meeting the evaluation requirements of the distributed coordination systems?
The rest of this paper is organized as follows: Section 2 provides an evaluation of the current benchmarking practices for distributed coordination; Section 3 discusses the general requirements of a comprehensive benchmarking suite for distributed coordination systems; Section 4 presents the capabilities of existing benchmarking/testing frameworks in this area; Section 5 discusses the related work, and Section 6 concludes the paper.
2. Evaluation of Current Practices
We have analyzed the existing distributed coordination systems under three main categories: (i) consensus algorithms; (ii) coordination services; and (iii) distributed applications.
(i) Consensus Algorithms. These are the low-level consensus algorithms and protocols designed to provide the necessary primitives for distributed coordination. Most of the systems in this category are variations of the original Paxos protocol, with improvements either on performance, availability, or scalability. The systems we have studied under this category include Mencius (Mao et al., 2008), FPaxos (Howard et al., 2016), Multi-Paxos (Chandra et al., 2007), Hybrid-Paxos (Dobre et al., 2010), Egalitarian Paxos (E-Paxos) (Moraru I, 2013), Paxos (Peluso et al., 2016), Bizur (Hoch et al., 2017), ZAB (Junqueira et al., 2011), WPaxos (Ailijiang et al., 2017), and SwiftPaxos (Ryabinin et al., 2024).
(ii) Coordination Services. These are high-level services that form a level of abstraction to hide the difficulties in dealing with low-level consensus algorithms and provide the frequently used coordination primitives as a service to the application developers. The systems studied under this category include ZooKeeper (Hunt et al., 2010), Tango (Balakrishnan et al., 2013), Calvin (Thomson et al., 2012), WanKeeper (Ailijiang et al., 2017), and ZooNet (Lev-Ari et al., 2016).
(iii) Distributed Applications. The final category consists of distributed applications that are built on top of such consensus algorithms or coordination services, each requiring different levels of synchronization, consistency, and availability guarantees. The systems we have studied under this category are: Spanner (Corbett et al., 2013), DistributedLog (Guo et al., 2017), PNUTS (Cooper et al., 2008), COPS (Lloyd et al., 2011), and Cockroach DB (coc, 2018).
2.1. Topologies and Experimental Setups Used in Evaluations
In the evaluation of distributed coordination systems, different experimental setups and topologies are used. We group these topologies under six main categories: (i) flat topology; (ii) star topology; (iii) multi-star topology; (iv) hierarchical topology; (v) grid topology; and (vi) central-log topology. To categorize the experimental setups in these topologies, the implementation and design principles of the studied systems have been analyzed. The way to create quorums and the way to process requests are considered as the two main factors. Figure 1 illustrates these topologies.
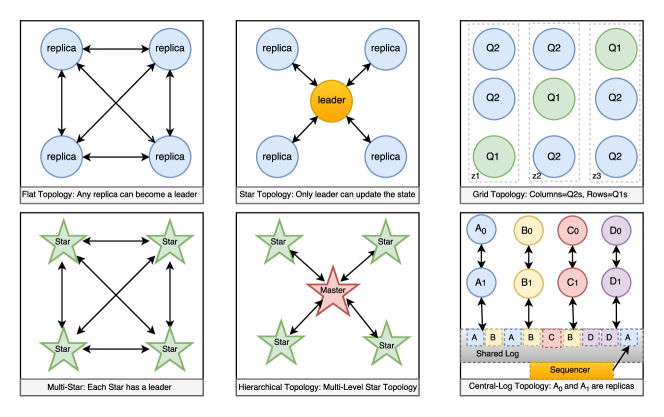
Flat topology is used in multi-leader or leaderless systems which allow concurrent updates like Mencius and E-Paxos. Although their way to assign a replica to be the leader of a request is different, the topology represents the architecture of both systems. Similarly, the star topology is used in single leader protocols whether the system relies on strong leadership like ZooKeeper or changes the leader based on the outstanding requests at replicas as in Hybrid-Paxos. Multi-Star topology is used in systems that have multiple quorums, each in a star topology, while leaders of every quorum communicate with each other and form a flat topology together (no hierarchy). Systems with partitioned data and access locality may use Multi-Star topology for better read performance or improved fault tolerance as in ZooNet and Paxos. Systems with dynamic quorums according to their data partition and replication requirements as in Spanner may also use this topology. Hierarchical topology can be defined as a multi-star topology with a hierarchy between the leaders. It is used in WanKeeper mainly to control the distribution of ownership of data objects in wide-area networks, as the master is the only replica to change the ownership. FPaxos uses grid topology and grid quorum to improve the performance in a cluster, while WPaxos benefits from the same to decrease the wide-area networking (WAN) communication overhead for the write operations. Central-log topology is used by systems like Tango and Calvin which keep the execution order of transactions in a durable, consistent and fault-tolerant shared log.
| System | \Longunderstack# of | ||||||
| \Longunderstack# of | Regions | ||||||
| \Longunderstack# of | |||||||
| Topology | Testbed | Benchmark | |||||
| Algorithms | Mencius (Mao et al., 2008) | 3,5,7 | 3,5,7 | 3,5,7 | Flat | DETER | Microbenchmark |
| FPaxos (Howard et al., 2016) | 1 | 5,8 | — | Grid | Custom | Microbenchmark | |
| Multi-Paxos (Chandra et al., 2007) | 1 | 5 | 1,4,10,20 | Star | Custom | Microbenchmark | |
| Hybrid Paxos (Dobre et al., 2010) | 5,7,11,21 | 5,7,11,21 | 10,20,100,1000 | Star | Emulab | Microbenchmark | |
| E-Paxos (Moraru I, 2013) | 1,3,5 | 3,5 | 50 | Flat | EC2 | Microbenchmark | |
| Paxos (Peluso et al., 2016) | 1 | 5,11,49 | 64/server | Multi-Star | EC2 | Microbenchmark | |
| Bizur (Hoch et al., 2017) | 1 | 3 | 1 | Flat | Custom | Microbenchmark | |
| ZAB (Junqueira et al., 2011) | 1 | 3-13 | — | Star | Custom | Microbenchmark | |
| WPaxos (Ailijiang et al., 2017) | 5 | 15 | 5 | Grid | EC2 | Microbenchmark | |
| SwiftPaxos (Ryabinin et al., 2024) | 13 | 5 | 1000,5000 | Star | EC2 | YCSB (Cooper et al., 2010) | |
| \Longunderstack Services | ZooKeeper (Hunt et al., 2010) | 1 | 3-13 | 250 | Star | Custom | Microbenchmark |
| Tango (Balakrishnan et al., 2013) | 1 | 18 | 18 | Central-Log | Custom | YCSB (Cooper et al., 2010) | |
| Calvin (Thomson et al., 2012) | 1 | 4,8,0-100 | — | Central-Log | EC2 | TPC-C (TPC, 1992) | |
| WanKeeper (Ailijiang et al., 2017) | 3 | 3 | 1,2 | Hierarchical | EC2 | YCSB (Cooper et al., 2010) | |
| ZooNet (Lev-Ari et al., 2016) | 2 | 8 | 60 | Multi-Star | Google C.E. | Microbenchmark | |
| Applications | Spanner (Corbett et al., 2013) | 1 | 1,3,5 | 100 | Multi-Star | Custom | Microbenchmark |
| DistibutedLog (Guo et al., 2017) | 2 | 20 | — | Star | Custom | Microbenchmark | |
| PNUTS (Cooper et al., 2008) | 3 | 3 | 300 | Multi-Star | Custom | Microbenchmark | |
| COPS (Lloyd et al., 2011) | 1 | 2,4,8,16,32 | 2,1024/server | Multi-Star | VICCI | Microbenchmark | |
| CockroachDB (coc, 2018) | 1 | 3,30 | — | Flat | Custom | \LongunderstackTPC-C (TPC, 1992) | |
| Jepsen (Kingsbury, 2024) |
In Table 2.1, the experimental setups of the studied systems are given. The number of regions field shows the level of geo-distribution. If systems are deployed in real-world computing environments such as public clouds (as in ZooNet and WanKeeper) or geographically distributed private networks (as in PNUTS), and the round trip time(RTT) between distributed replicas is greater than 20ms, it is included as a region. Similarly, for evaluations in controlled environments, if RTT between modeled regions is greater than 20ms as in Mencius and Hybrid-Paxos, it is also accepted as a separate region. However, if all the servers are located in the same placement group (as in Paxos) or clusters in close proximity (as in Spanner and Calvin), it is considered a single region deployment even if the system design parameters support wide-area network deployments. The number of servers field represents the level of replication. The source of produced workload is defined as the client and the total number of workload sources is given as the number of clients. Systems applied different ways of creating client tasks. The general approach is to utilize a separate machine to create the required workload. For single cluster evaluations using a separate machine, one or multiple threads used as clients as in Bizur and Multi-Paxos respectively. In WAN deployments, clients are distributed to the regions uniformly as in Mencius, E-Paxos, and WPaxos. On the other hand, ZAB, FPaxos, and DistibutedLog do not implement external clients. Similarly, Paxos use separate threads on the replica servers to generate the workload. ZooKeeper(35 servers for 250 clients) and ZooNet(2 servers for 60 clients) combine these approaches and use separate machines with multiple client threads. We provide testbed information to clarify whether the evaluations were simulated under a controlled environment like Emulab (Joglekar et al., 2002) and DETER (Benzel et al., 2007) or performed on real computing environments like Amazon EC2 (EC2, 2024) and Google Compute Engines (GCE, 2024). This information is important to understand the involvement of external factors in evaluations such as variance in routing overhead as it is fully deterministic in controlled environments while you have limited control in real computing environments. Custom testbeds can be considered in between as they are closer to controlled environments for single-region deployments and closer to cloud computing environments for geo-distributed deployments. Under the benchmark field, if a standard benchmark is not used for the evaluations, it is listed as ”Microbenchmark”. Different implementations in evaluations of these custom microbenchmarks are given under the related metrics. Table 2.1 lists all of the used experimental setups in the evaluations of studied systems together although some of them change their experimental setup for different metrics. For instance, Mencius uses 3 servers in 3 regions for performance evaluations, however, it uses 3,5,7 servers in 3,5,7 regions for the scalability benchmarks. Similarly, Calvin studies conflicting commands performance with 4 and 8 replicas while using 100 replicas to conduct scalability experiments. If the different experimental setups of the same system are important, they are explained in detail in the sections of related metrics. For any of the fields in the table, if the details are not given explicitly in the related published materials, they are marked as ”Not Specified” in the table.
2.2. Metrics
The majority of the protocols and systems we have studied are evaluated for several different metrics. These metrics are intended to describe various aspects of system behavior under the workload, such as performance, scalability, availability, and consistency. Despite the lack of unity in the benchmarking of the systems, many authors have chosen to use the same metrics for their evaluations. In the rest of this section, we will describe the benchmarking metrics used in the literature and how these metrics allow engineers to evaluate their systems. Table 2.2 summarizes our findings.
| System | Performance | Scalability | Availability | Consistency | ||||
| Throughput | Latency | Server | Client | Failure | Partition | |||
| Algorithms | Mencius (Mao et al., 2008) | ✓ | ✓ | ✓ | ✓ | ✓ | ||
| FPaxos (Howard et al., 2016) | ✓ | ✓ | ||||||
| Multi-Paxos (Chandra et al., 2007) | ✓ | ✓ | ✓ | |||||
| Hybrid Paxos (Dobre et al., 2010) | ✓ | ✓ | ✓ | ✓ | ||||
| E-Paxos (Moraru I, 2013) | ✓ | ✓ | ✓ | ✓ | ✓ | |||
| Paxos (Peluso et al., 2016) | ✓ | ✓ | ✓ | |||||
| Bizur (Hoch et al., 2017) | ✓ | ✓ | ✓ | ✓ | ||||
| ZAB (Junqueira et al., 2011) | ✓ | ✓ | ✓ | |||||
| WPaxos (Ailijiang et al., 2017) | ✓ | ✓ | ✓ | ✓ | ||||
| SwiftPaxos (Ryabinin et al., 2024) | ✓ | ✓ | ✓ | |||||
| \Longunderstack Services | ZooKeeper (Hunt et al., 2010) | ✓ | ✓ | ✓ | ✓ | ✓ | ||
| Tango (Balakrishnan et al., 2013) | ✓ | ✓ | ✓ | ✓ | ||||
| Calvin (Thomson et al., 2012) | ✓ | ✓ | ||||||
| WanKeeper (Ailijiang et al., 2017) | ✓ | ✓ | ✓ | |||||
| ZooNet (Lev-Ari et al., 2016) | ✓ | ✓ | ✓ | ✓ | ||||
| Applications | Spanner (Corbett et al., 2013) | ✓ | ✓ | ✓ | ✓ | ✓ | ✓ | |
| DistributedLog (Guo et al., 2017) | ✓ | ✓ | ✓ | ✓ | ||||
| PNUTS (Cooper et al., 2008) | ✓ | ✓ | ||||||
| COPS (Lloyd et al., 2011) | ✓ | ✓ | ✓ | ✓ | ||||
| CockroachDB (coc, 2018) | ✓ | ✓ | ✓ | ✓ | ||||
a. Performance
Performance evaluation is the most common type of system benchmarking. Studying the performance typically involves pushing some significant workload through the system and measuring the latency and the throughput the system was able to sustain.
| System | \LongunderstackWrite | |||||
| \LongunderstackData | Ratio % | |||||
| Access | ||||||
| \LongunderstackAccess | ||||||
| \Longunderstack# of | ||||||
| \LongunderstackSize of | ||||||
| Objects | ||||||
| Algorithms | Mencius (Mao et al., 2008) | 50 | 100 | NS | 16,128,1024 | 6B,4KB |
| FPaxos (Howard et al., 2016) | NS | ✗ | ✗ | NS | 64B | |
| Multi-Paxos (Chandra et al., 2007) | 100 | 100 | 100 | NS | 5B,8KB, 32KB | |
| Hybrid Paxos (Dobre et al., 2010) | 100 | 100 | ✗ | 1 | NS | |
| E-Paxos (Moraru I, 2013) | 100 | 100 | NS | NS | 16B,1KB | |
| Paxos (Peluso et al., 2016) | NS | 2-100 | 0,100 | 1,100,1000 | 16B | |
| Bizur (Hoch et al., 2017) | 100 | NS | ✗ | 1- | 50B | |
| ZAB (Junqueira et al., 2011) | NS | 100 | ✗ | NS | 1KB | |
| WPaxos (Ailijiang et al., 2017) | 100 | NS | 70, 90 | 1000 | NS | |
| SwiftPaxos (Ryabinin et al., 2024) | 0,5,20 | 0-100 | ✗ | 1KB-8KB | ||
| \Longunderstack Services | ZooKeeper (Hunt et al., 2010) | 0-100 | 100 | ✗ | NS | 1KB |
| Tango (Balakrishnan et al., 2013) | \Longunderstack0,10,50 | |||||
| 90,100 | 100 | 0-100 | 10-10M | 4KB | ||
| Calvin (Thomson et al., 2012) | NS | NS | 90 | NS | NS | |
| WanKeeper (Ailijiang et al., 2017) | 0-100 | 0-100 | 0,100 | NS | NS | |
| ZooNet (Lev-Ari et al., 2016) | \Longunderstack75,50,10,1,0 | NS | NS | NS | 1KB | |
| Applications | Spanner (Corbett et al., 2013) | 0,100 | NS | NS | NS | 4KB |
| DistibutedLog (Guo et al., 2017) | NS | 100 | NS | NS | 1KB | |
| PNUTS (Cooper et al., 2008) | 10,0-50 | NS | 80 | NS | NS | |
| COPS (Lloyd et al., 2011) | 50,25 | 100 | 0-100 | , 512/client | 1B | |
| CockroachDB (coc, 2018) | NS | 100 | 90 | 1000, 10000 | NS |
Throughput measures how many requests or commands a system can process in a unit of time. Higher throughput capabilities allow the system to process more requests and larger amounts of data. To measure the maximum throughput, systems are saturated with an increasing workload until they either reach the server’s CPU or network capacity.
Latency is a measure of request execution time. It is often measured over a significant number of requests, allowing to calculate average, median and various percentile’s for the metric. Low latency is desirable for systems since it means that a system spends little processing power or I/O capacity to handle a request. Latency for a given system is often correlated with throughput, as low request latency allows us to push more requests through the system in a unit time.
Latency distribution across the requests is also very important. For instance, the average latency measurement can give some sense of the performance, however, it does not describe the full picture that includes all requests served by the system. It may be the case that an average or median latency is low while some significant portion of requests performs poorly. The majority of the systems give the results only for average, median or aggregated latency, without providing any information about the tail latency. This makes it more difficult to understand how a system works in performance corner cases. To this matter, providing the distribution of the cumulative latencies as in WPaxos or giving median or average and high percentile latency together as in E-Paxos, Bizur, and WPaxos yields to a more comprehensive understanding of the system’s performance.
Systems follow different approaches for evaluating the performance. Although the majority of the systems evaluate the throughput and latency together, some systems such as Calvin, ZooNet and Multi-Paxos measure only the throughput, and systems such as ZooKeeper and Spanner evaluate the throughput and latency separately. Evaluating the latency and the throughput together is important to understand the overall performance of the system since while the throughput mainly related to the processing capacity of the system, latency is more affected by I/O operations (Friedman and Hadad, 2006).
The performance of any distributed coordination system highly depends on the workload characteristics such as read/write ratio, data access overlap, access locality, the number of data objects (size of data pool) and the size of data objects. In table 2.2, we list how the systems tuned their workloads for these parameters.
Read/Write Ratio
Read/Write Ratio is a fundamental parameter to show the performance of the system under different use case scenarios. Since many systems handle write and read requests differently and the percentage of write and read requests is application-specific, it plays a crucial role to show the applicability of the systems for various purposes. For instance, systems designed to be used for different aspects of distributed coordination like ZooKeeper or WanKeeper show the performance evaluation continuously while varying the write ratio from 0 to 100%. Similarly, Spanner measures the read and write performance separately since read requests can be handled by replicas but writes need to be done by the leader. Besides being handled by the leader, writes require replication which increases commit latency. To measure the true performance of replication, Multi-Paxos also uses 100% write operations. Due to the differences in processing read requests between systems used for comparison in the evaluations, Bizur uses only write operations. E-Paxos and Hybrid Paxos also use 100% writes since they focus on handling conflicting commands, and read requests do not produce conflicts.
Data Access Overlap
Data access overlap may have a major impact on the throughput and latency in multi-leader systems and protocols. It can be defined as the percentage of the key space shared by all clients. In this matter, it is 100% data access overlap if the entire key space is shared and all clients are allowed to access to any keys and it is 0% data access overlap if the key space is partitioned for each client and clients are accessing only the keys in their partition. For single leader algorithms providing strong consistency like Multi-Paxos, ZAB, Chubby and ZooKeeper varying data access overlap has no impact on the overall performance since all write requests are treated in the same way. Data access overlap, on the other hand, is an important factor for the performance of multi-leader algorithms/systems which allow concurrent update operations. Receiving different execution orders at different replicas is considered as a command conflict. A command conflict is usually resolved by serializing the requests from different clients to have the same execution order or by checking the dependency between the requests to make sure the order of execution does not lead to different final states of the system. Mencius and E-Paxos can be considered under this category and they evaluate their system under the worst condition with 100% data access overlap. Hybrid-Paxos is also considered to be evaluated with 100% data access overlap since all clients are updating the same data object (one bank account). For these systems, data access overlap can also result in command collisions, described in 2.2, which occurs when multiple servers update the same data object concurrently. Systems that use ownership to control the access on data objects are also affected by conflict ratio due to ownership migration or remote requests. Systems using static ownership, like ZooNet, forward all requests to the remote server which is possibly located in a geographically far region, and they are affected by network delays for the requests of a not-owned data object. The use of buckets in Bizur is of a similar nature. Systems with dynamic ownership are either affected by exhibiting longer latency for remote requests or performing costly ownership migration as in Paxos, WPaxos, WanKeeper, and PNUTS.
Command Collision Ratio
Command collision occurs in multi-leader systems when more than one leader is trying to perform an operation on the same data object at the same time. For example, Mencius implements simple replicated register service and evaluates the effect of command collision by changing the number of registers available for the clients.The lower number of registers leads to a greater collision rate. Similarly, Hybrid Paxos and E-Paxos evaluate the collisions by changing the rate of commands updating the same key. Hybrid Paxos measures the latency by changing the withdraw operation ratio from 0 to 100%. 100% represents the case of a 100% command collision rate. E-Paxos evaluates command collision for 0 and 2% as likely cases and 25 and 100% as extreme cases.
Access Locality
Access locality is defined as the likelihood of clients accessing a specific part of the key space. If there is a 70% access locality, it represents the case that 70% of the requests are related to the same part of the key space, possibly the same region, and the other 30% of the requests are related to the rest of the key space. Access locality is more of a matter of the distribution of client requests rather than sharing of the key space among clients which is defined as data access overlap. Clients may have different access localities while preserving 100% data access overlap as in the above example. This parameter has a big impact on performance in systems that use object ownership to parallelize request execution.
Access locality may not necessarily correspond to geographical partitioning of data, and in more general terms it can be seen as the probability of accessing some preferred subset of keys, as illustrated in Paxos. WPaxos and COPS adjust the access locality by distributing the data objects uniformly in data groups and changing the rate of client access for the data groups. While COPS changes the access locality for each client from 100% to 0%, WPaxos evaluates the access locality for 70% and 90%. Paxos measures the performance for the worst and best conditions as 0% and 100% access locality. ZooNet and PNUTS distribute the ownership of the data objects to adjust the level of local execution so their access locality rates correspond to the rate of local execution. Similarly, Calvin partitions its data to multiple datacenters and multiple machines in the same datacenter. Calvin’s evaluations exhibit a 90% access locality since it accesses the data objects stored at the same machine for 90% of the cases. PNUTS also examines the effect of non-uniform access on data objects by using ziphian distribution with varying ziph factor which results in different access locality rates.
Number of Data Objects
The number of data objects is usually used to tune command conflicts and command collisions. The higher number of data objects usually results in fewer conflicts and fewer collisions. Only Mencius, WPaxos, Bizur, COPS and Paxos specify the number of data objects which could be used for adjusting the ratio of conflicting and possibly colliding commands.
Size of Objects
The size of objects, as another parameter of performance evaluation, is usually used as a factor of saturation type. To make the servers CPU bound, the size is kept as small as possible and for network bounded workloads, system evaluation may use larger objects. It is also related to the data models and the expected use of the systems. ZooKeeper, Tango, Spanner, and ZooNet use 1KB or 4 KB of data objects as it is more suitable to their data model. Mencius and Multi-Paxos evaluate the effect of the data object size to evaluate the system for both CPU and network bound cases.
b. Scalability
The ability of any system to perform well in a wide range of workload parameters and configurations is essential. The scalability measured by the system is of two distinct types: workload scalability and system scalability. Both types are often evaluated by measuring the changes in performance as some parameters are controlled. The parameters important for scalability evaluation are often those that describe the experimental testbed and can be seen in Table 2.1.
Workload scalability is often evaluated by fixing the deployment size and topology while increasing the amount of work the system needs to perform and measuring the performance at each workload intensity. Systems normally control the throughput as a measure of workload intensity. At low-intensity workloads, systems normally show stable performance that does not degrade drastically with small increases in the number of requests. However, as the number of requests sent to the system increases, it eventually reaches a saturation point where even a small increase in the number of requests results in drastic degradation in latency and system’s ability to process higher throughput. Systems using small data objects usually reach the saturation point due to the CPU limitations, and systems using larger file sizes more affected on network boundaries.
System scalability is often measured by keeping workload parameters constant and changing the size of deployment by either changing the number of servers/replicas or by changing the number of regions for wide area network systems. System scalability is important for large data-driven systems that must scale the processing and storage capacity well.
Number of Clients
To evaluate workload scalability, a certain amount of workload should be created until systems reach their saturation point. The amount of workload can easily be adjusted by either changing the number of clients or the number of requests per each client. Hybrid-Paxos, E-Paxos, Tango, and PNUTS increase the number of concurrent clients with a certain amount of workload produced by each client for the workload scalability evaluations. Paxos also increases the number of clients but it is more related to produce a new workload for the newly added server. Thus, it is not considered directly related to workload scalability evaluation. In some cases, clients may be throttled down, and changing the degree of throttling can also be used to control the workload intensity. WPaxos uses this strategy to arrange the workload intensity.
Number of Servers/Replicas
Depending on the underlying algorithms, systems differ in how they scale with the increasing number of servers/replicas. Paxos derivations generally provide low performance for a higher number of replicas. Some systems, such as ZooKeeper, however, can provide increased read throughput as the number of replicas grow since ZooKeeper does not put a single leader in a read path and allows reading directly from replicas. Increasing the number of servers/replicas does not always increase the aggregated throughput linearly due to the communication and replication overheads for most of the systems. To evaluate system scalability as the number of servers/replicas increases, evaluations often resort to CPU-bound workloads, as was done by Paxos, ZooKeeper, Tango, Calvin, Spanner, and E-Paxos. The differences in the system architecture and the underlying algorithms are also reflected in the methodologies for the system scalability experiments. Paxos used 100% access locality to eliminate the overhead due to ownership migration and tested for up to 49 servers while ZooKeeper uses up to 13 replicas for varying write ratio from 0-100%. On the other hand, Tango evaluates for up to 100 servers since its scalability heavily relies on the underlying shared log, CORFU (Balakrishnan et al., 2012).
Number of Regions
The number of regions of the deployment is a crucial factor for the wide area network systems due to the high network communication overhead. As mentioned in 2.1, in this survey only the real wide-area network environments or testbeds with compatible network latencies are considered separate regions. Although they are deployed over wide area networks, systems with a fixed size of deployments like WPaxos, WanKeeper, and ZooNet are not included for scalability evaluations for the number of regions due to the lack of sole measurements for the different number of regions. Among all the systems studied, only E-Paxos and Mencius purely analyze the system scalability for the number of regions. Mencius uses the fixed network latency by changing its regular topology from flat to star and having a central node to coordinate all network communications while E-Paxos uses EC2 placement groups for the deployment with varying network latencies.
Most systems studying the scalability concentrate on workload scalability or horizontal system scalability, however, there are some exceptions. For instance, Paxos also studies vertical scalability of the system by varying the CPU performance at the nodes. Similarly, PNUTS evaluates the effects of disk space on the average latency.
Some systems evaluate scalability differently due to architectural variations. For instance, DistributedLog focused on scalability with respect to the number of streams being processed, since a stream is a basic unit of sharding in the system. However, because each physical node can only handle a limited amount of streams, scaling the workload to include more streams ultimately causes the underlying scheduling system to span additional worker nodes to handle the streams. DistributedLog evaluation addresses this by performing workload scalability benchmarks concerning a single proxy to study the scalability limitations of a single node while doing system scalability on a cluster that can span additional workers.
c. Consistency
Evaluating the consistency properties of a protocol or an algorithm is no trivial task. Part of the reason is understanding the consistency itself since many different consistency models exist. The ambiguity of consistency definitions also makes it difficult to compare the consistency guarantees provided by various systems without careful examination of the algorithms and protocols. For instance, many different systems claim strong consistency for their protocols, however, the actual guarantees provided may differ drastically, based on the transaction modes, assumptions about command ordering (total order, partial total order, etc), and assumptions about the client interaction with the system.
Although benchmarking serializability or linearizability is not simple, testing for these guarantees is relatively feasible. Bizur and Multi-Paxos perform such tests to detect any inconsistencies in their strictly serialized write operations. Bizur uses Serialla, a testing tool for strict serializability in Elastifile file system (Ela, 2024), which produces concurrent updates while checking the responses at all replicas. It detects the requests causing inconsistent execution order at any replica and provides the descriptive log of operations. Similarly, Multi-Paxos uses runtime checking for any inconsistencies at any replica by periodically sending checksum requests to all replicas. Replicas calculate the checksum value of their fault-tolerant log and compare that with the master’s value. Jepsen (Kingsbury, 2024) carries a test on ZooKeeper to confirm the linearizability variant maintained under network partition and leader failure by partitioning the site which has the leader and another replica and keep sending the write requests during partition. Then it recovers the region and checks the logs at each replica.
In our survey, we found very few protocols and systems benchmark for consistency. However, some systems evaluate their consistency in terms of data staleness at different nodes or geographical regions. Such staleness-based evaluations aim to show that clients cannot read stale, or old, values of data, no matter which node is being used for reading the data. In this manner, ZooNet measures the performance degradation while disabling stale reads by synchronizing read requests first with the owner of the requested data object to make sure it serves the most up to date data.
d. Availability
| System | \Longunderstack# of Servers | \Longunderstack# of Failures | \LongunderstackFailed Node(s) | ||
| \Longunderstack# of | Type | ||||
| Regions | |||||
| Alg. | Mencius (Mao et al., 2008) | 3 | 1 | Leader-Replica | 3 |
| E-Paxos (Moraru I, 2013) | 3 | 1 | Leader-Replica | 1 | |
| Bizur (Hoch et al., 2017) | 3 | 1 | Leader | 1 | |
| WPaxos (Ailijiang et al., 2017) | 15 | 1 | Leader & Follower | 5 | |
| C.S. | ZooKeeper (Hunt et al., 2010) | 5 | 1-2 | Leader & Follower | 1 |
| App. | Spanner (Corbett et al., 2013) | 25 | 5 | Leader & Follower | 5 |
Availability evaluation usually involves benchmarking system’s ability to continue the operation in the presence of faults. The availability is often measured in terms of throughput degradation caused by the failure. Many kinds of failures are possible within the system or protocol, but the researchers in the distributed coordination community tend to concentrate on a crash-fault model of operation and most often evaluate for node crashes.
Some other failure types, such as network partition around the node, may be indistinguishable from crashes for many protocols. Partitions, however, may cause different behavior than crashes in a few cases. For instance, a ZooKeeper (Hunt et al., 2010) follower partitioned from the rest of the cluster can serve stale reads to the clients for some time, thus it will contribute to the throughput measurement.
The ability to tolerate failures and remain available is one of the properties of consensus algorithms and coordination systems or applications built on top of such algorithms. The number of failures a system can mask often depends on the cluster size, and larger clusters typically mask more failures. In Table 4, we summarize the vital parameters used by the systems when benchmarking for availability and fault-tolerance.
Most systems we have reviewed assumed no concurrent failures, however, ZooKeeper evaluation performed a benchmark with two follower nodes failing at roughly the same time. The cluster size used for that evaluation of ZooKeeper allowed a maximum of two failures at the same time.
Spanner availability evaluation is different from the rest of the systems and protocols. Spanner uses Paxos-groups as a unit of data-sharding and replication. In the availability evaluation, they created 1250 Paxos-groups on 25 nodes in 5 regions with each Paxos-group taking a single machine from each region. Then an entire region has been crashed, however, since Paxos protocol can mask up to 2 failures in the cluster of 5 nodes, all groups were able to continue operation. As a result, this benchmark is similar to evaluation of availability on a single Paxos cluster of 5 nodes by crashing a node.
On the other hand, Hybrid Paxos and Tango approach availability evaluation differently and evaluate the effect of increased availability with respect to performance. Hybrid Paxos increases the number of replicas under the same load and measures the average latency to see the impact of having more replication in the system. Similarly, Tango uses a primary-backup scenario for the same view of the Tango object and serves all read requests from the backup replica and all writes from the primary replica and measures the throughput.
3. Benchmarking Requirements for Distributed Coordination Systems
Out of many reviewed coordination systems, protocols, and applications requiring distributed synchronization, only a handful(Balakrishnan et al., 2013; Thomson et al., 2012; Ailijiang et al., 2017) use a standard benchmarking suite or tool for evaluation. However, most of the works share a great deal of commonality in terms of what aspects of the system’s behavior they evaluate. Performance evaluation is by far the most common type of benchmarking performed, while many of the authors also show fault tolerance or availability of their systems by measuring performance degradation caused by failures.
The abundance of evaluations measuring the same aspects of systems behavior and lack of a common or prevalent benchmarking suite suggests that existing benchmarking tools are either deficient to cover some aspects of evaluated metrics or they are not universally adaptable. Identifying and addressing the requirements for a complete evaluation of distributed coordination systems will allow us to customize existing tools accordingly or to create a new benchmarking suite that can be used by a wide range of applications exposing similar interfaces to the user. In the remainder of this section, we are discussing benchmarking challenges and the general requirements of a benchmarking suite for distributed coordination systems.
3.1. Benchmarking Suite Flexibility and Sophistication
Many systems may resort to doing their evaluation with own custom benchmarking tools in order to showcase their strong points in some particular workloads. This means that most systems require a high level of tenability from the benchmarking suite they are using. Consequently, if no popular suites can be adjusted to generate desired workloads, authors are forced to either modify the tools or make their own.
A flexible benchmark should be highly customizable throughout the range of parameters, but it also needs to allow for benchmarking various metrics of system’s behavior. As such, a benchmarking suite for coordination systems needs to be able to evaluate all facets of the the system’s behavior: performance, scalability, availability, and consistency. Some of these metrics are related, for instance, the benchmarking suite can evaluate the system’s scalability through measuring performance at a different system or workload scales. Some other metrics are orthogonal to each other, as is the case with performance and consistency.
Performance Benchmark. For general performance measures, the benchmarking suite must provide the ability to manipulate various workload parameters: read-to-write ratio, size of the data pool, size of an individual object, data access overlap, access locality, and per-node workload distribution.
Read-to-write ratio is a fundamental property of workloads for coordination systems and applications relying on distributed synchronization. The amount of read and write operations a system is performing can vary greatly depending on the application. Many workloads are read-oriented, however, some tasks, such as logging, perform more updates.
Size of data pool, and size of individual object control the overall size of the workload. Large object size can drastically reduce latency and throughput of the systems, however, some systems optimize for larger objects while others work best with smaller data items. In addition, the size of the data pool is also used for generating variations for the percentage of conflicting commands along with the data access overlap ratio.
Data access overlap is important in the context of coordination services and coordinated applications. This parameter controls the likelihood of the same object accessed by two or more different clients and hence it affects the command conflict ratio. In case of no overlap in data access, clients will never access objects belonging to other clients, while in a 100% overlap, all clients are equally likely to access any data. This measure is especially important for multi-leader coordination systems or applications which allow concurrent writes, where conflicting commands require a special resolution and longer time to complete. This is also closely related to consistency models for those systems since for systems providing synchronous reads, all dependant requests need to be serialized. This is even more challenging for WAN deployments and has a significant impact on the latency evaluation.
Access locality determines the distribution of the access patterns of clients. It is an important parameter especially for systems using ownership mechanisms to satisfy their consistency guarantees. It has a significant effect on their performances as it either requires command forwarding in static ownership case or ownership migration in systems using dynamic ownership.
Per-node workload distribution parameter allows controlling how much workload each system node receives. Controlling these distributions can allow the benchmark to create high-stress and low-stress regions in the system. It also provides the ability to evaluate the load balancing capabilities of the system. Additionally, controlling which nodes process what commands is essential for enforcing the conflict rate.
Scalability Benchmark. In addition to workload parameters, the scalability benchmarking suite needs to have the ability to tune the amount of work it pushes through the system under test. This is often achieved by increasing the number of concurrent clients interacting with the systems and/or increasing per-client command throughput. The size of the cluster, or the number of servers, and the geo-distribution level are not the parameters of the benchmarking tool. However, the benchmarking tool should provide the information about throughput/latency per node as well as the cumulative throughput/mean latency which enables comparing results from multiple runs of the benchmark with different configurations of the overall system architecture.
Availability Benchmark. Availability measurements require simulating system failures while measuring the performance of the systems during the failures. Even though many types of failures are possible, all of the studied systems that did availability evaluation resorted to a crash-failure scenario. The ideal benchmarking suite needs to provide the ability to evaluate the system’s behavior not only under crash-failures, but under other types of malfunctions, such as network partitions, clock drifts, memory corruption, and unreliable links. For many of these failures, the benchmark needs to control the number of simultaneous failures.
Consistency Benchmark. Consistency evaluations differs from the prior three benchmarks greatly. Most importantly, consistency is not evaluated through performance observations. Existing attempts at consistency evaluations often focus on studying data-staleness. Staleness describes the amount of outdated data that can be read by the client. This is often good enough to show the eventual consistency guarantees of the system, but not nearly enough to test for all spectrum of possible consistency guarantees. This is especially important in the realm of consensus algorithms and coordination systems and applications using these algorithms since such systems aim to provide stronger levels of consistency than the eventual. In this matter, a consistency benchmark is required to evaluate the consistency guarantees provided by the system for different levels of linearizability and serializability under various combinations of client request ratios of read and write operations.
3.2. Benchmarking Suite for WAN Systems
Many of today’s distributed applications are deployed on scales that span multiple datacenters across the country, region or even globe. Such a scale introduces many challenges that have not been seen in a single-datacenter applications. Large distances between components of the system drastically increase communication delay and thus systems’ latency. Cross-datacenter bandwidth may also be limited, driving performance degradation further.
Many WAN systems (Ailijiang et al., 2017; Moraru I, 2013; Ailijiang et al., 2017) also see the performance and scalability artifacts from the geographical placement of data centers. On a global scale, it is no longer possible to assume roughly uniform latencies between nodes located in different datacenters. Physical distances start to dictate the speed of communication between the regions, thus in a WAN system, the communication latency between regions can easily differ by the order of magnitude. These disproportion delays introduce penalties for some regions while giving benefits to others. In this matter, the distribution of the clients becomes also required since distributed clients may cause a variance in latency measurements. For instance, systems allowing their clients to communicate any replica at any region would differ in latency from the systems limiting client communication to local replicas.
These WAN challenges allow systems engineers to optimize for a wider range of workload parameters, such as data-locality and access-locality. Data-locality controls the initial data distribution in the global, WAN system. Similarly, access-locality is a measure of access patterns to the data objects shared and possibly replicated globally.
A successful benchmarking suite must be able to generate workloads with these parameters in mind for WAN-systems.
3.3. Benchmarking Suite Scalability
The scale of modern systems is rather large. The protocols and simple coordination systems built on top of these protocols can easily span into tens of nodes, while the applications scale even further. The large scale of the application means that they can handle a lot of traffic, thus requiring a benchmarking tool to be able to scale with the system and put out an adequate workload.
Benchmark that does not scale will not be able to saturate larger systems, and will not provide a complete picture on that system’s performance and scalability. Sure, it will show the behavior of the system at some under-saturated point, but such a benchmark will hardly be any use for comparison between systems if it is severely under-scaled.
A typical way to scale a benchmark is to make it run multiple clients interacting with the system. However, often the benchmarking tools are limited to spanning the clients as separate threads (Cooper et al., 2010). Generating a workload out of a single machine may not always be enough to saturate large systems running in a cluster of many nodes. We believe that a benchmarking tool for distributed coordination systems and applications needs to be distributed as well to scale well with the system under test.
Scaling a benchmarking tool to multiple machines is also essential for proper WAN benchmarking. Since a suitable benchmark needs to control such parameters as the locality of the data and the locality of access, WAN systems must have at least one benchmarking node to be present in each region. However, making the benchmarking tools distributed over multiple nodes is not without challenges. For instance, the benchmarking nodes require some degree of synchronization to facilitate such tasks as starting and stopping the workloads, agreeing on the workload distributions across benchmarking nodes and aggregating the results.
3.4. Benchmarking Suite Ease of Adoption
The ease of use and adaptability of a benchmark is a big contributing factor to many systems deciding not to adopt any of the standard benchmarks for their evaluations. Straightforward integration for various systems developed with different programming languages and frameworks is critical for any benchmarking suite. It is also vital that the benchmarking suite should operate as a black box and should not require users to learn about the internals of the benchmarking suite. Similarly, the benchmarking suite should be configured for operating independently regardless of the evaluated system details such as programming languages used for the development. This is also an important factor for a fair comparison of the evaluated systems.
4. Existing Benchmarks and Their Deficiencies
In this section, we survey several popular benchmarking/testing frameworks, with the metrics each of them covers and the parameters they provide. Table 5 summarizes the standard benchmarking tools used in the studied systems and some other state of the art benchmarks which could be utilized for distributed coordination systems evaluation. As shown in the table, none of the standard benchmarks is able to accommodate all aspects of distributed coordination. This explains why engineers tend to create their ad-hoc benchmarks as can be seen in table 2.1. Another approach could be combining these standard benchmarks to be able to cover all aspects such as using YCSB for performance and Jepsen for availability and consistency evaluations. However, YCSB comes short for distributed environments and does not support some important parameters for the evaluations such as data access overlap and access locality. Similarly, Jepsen does not provide black box benchmarking and requires expertise in Jepsen tools. We will analyze some of the state of the art benchmarking tools in detail under the main evaluation category of them.
| Tools | Performance | Scalability | Availability | Consistency | |||
| Throughput | Latency | Node Failure | Network Partition | Staleness | Linearizability | ||
| YCSB(Cooper et al., 2010) | ✓ | ✓ | Single Client | ||||
| YCSB+T(Dey et al., 2014) | ✓ | ✓ | Single Client | ||||
| YCSB++(Patil et al., 2011) | ✓ | ✓ | Distributed | ✓ | |||
| BG(Barahmand and Ghandeharizadeh, 2013) | ✓ | ✓ | ✓ | ||||
| UPB(Fior et al., 2013) | ✓ | ✓ | Distributed | ✓ | |||
| Chaos Monkey(Netflix, 2024) | ✓ | ||||||
| HiBench(Huang et al., 2010) | ✓ | ✓ | ✓ | ||||
| BigDataBench(Wang et al., 2014) | ✓ | ✓ | ✓ | ||||
| Jepsen(Kingsbury, 2024) | Single Client | ✓ | ✓ | ✓ | ✓ | ||
| BenchFoundry(Bermbach et al., 2017) | ✓ | ✓ | ✓(Distributed) | ✓ | |||
| Tools | # of Objects | Size of Objects | Read/Write Ratio | Data Access Overlap | Access Locality | # of Clients |
| YCSB(Cooper et al., 2010) | ✓ | ✓ | ✓ | Single Process | ||
| YCSB+T(Dey et al., 2014) | ✓ | ✓ | ✓ | Single Process | ||
| YCSB++(Patil et al., 2011) | ✓ | ✓ | ✓ | Distributed | ||
| BG(Barahmand and Ghandeharizadeh, 2013) | ✓ | ✓ | ✓ | ✓ | Distributed | |
| UPB(Fior et al., 2013) | ✓ | ✓ | ✓ | Single Process | ||
| Jepsen(Kingsbury, 2024) | ✓ | ✓ | Single Process | |||
| BenchFoundry(Bermbach et al., 2017) | ✓ | ✓ | ✓ | ✓ | Distributed |
4.1. Performance
Evaluating performance is the most supported aspect of benchmarking distributed coordination systems as can be seen in Table 5. Performance evaluations are prone to be sensitive to workload characteristics. In order to observe the true performance of a distributed coordination, benchmarking tools allow configurations of the parameters listed in table 6.
YCSB (Cooper et al., 2010) has become a standard benchmarking tool for the evaluation of NoSQL frameworks since published in 2010. The main reason for its popularity is generality and extendability. YCSB is a general-purpose benchmarking tool and can be used for all NoSQL database systems. It is easy to be extended to any additional database by implementing a simple CRUD (create, read, update and delete) plus scan interface against the datastore under benchmarking. Although the YCSB workload does not model real applications, its generated synthetic workload is highly tunable in 5 dimensions: the number of clients, operation ratio, request distribution, key space, and throttled throughput. Despite the fact that it enables the distribution of the requests over key space to some level, it does not provide the requirements for evaluating access locality since it supports only single client implementation. In addition, although the workload model that supports uniform, ziphian, latest, and multinominal distributions, it comes short for precise adjustments for data access patterns and it requires customization to set up with certain probabilities. Likewise, YCSB ignores creating conflicting commands. These parameters limit even the performance evaluations since systems have different consistency models and they have a significant impact on latency. For instance, a coordination system using a data ownership mechanism may need access migration for some data objects. It is simply not provided by any single client benchmarking solution. YCSB only measures the performance metric in our category. In particular, it measures the latency of each operation and overall throughput. Another limitation YCSB has is a lack of scalability for the WAN setting since YCSB only generates workload from one process. Our experience from benchmarking a geo-distributed system makes us realize that YCSB does not span over multiple datacenters and cannot generate workloads with some locality characteristics.
YCSB+T (Dey et al., 2014) is an extension work of YCSB that adds the new tier of transactional operations and validation. In order to generate a meaningful workload, YCSB+T defines the Closed Economy Workload which simulates bank account transactions with a fixed total amount. It supports transactional reads, scan, update, delete, and readModifyWrite operations as readModifyWrite operation includes reading 2 data objects and updating both. The validation phase of the benchmark tries to detect anomaly by comparing the total account balance before and after transactions. Given the database state, this validation cannot detect any dirty reads or lost updates that do not change the sum of all account balances. As a follow-up work, it mimics the workload features of YCSB and it suffers from similar limitations. It is not well suited for WAN deployments and evaluating WAN systems as it does not support the distribution of the clients and hence producing conflicting commands and managing access locality.
Similarly, YCSB++ (Patil et al., 2011) extends YCSB to support running with multiple clients which can run on different machines. To manage synchronization and group membership of clients, it uses ZooKeeper as the coordination service and the notification mechanism. It occupies HBase (HBa, 2024) and Accumulo (Acc, 2024) as its table stores and to provide more realistic evaluations on table stores, it enables some other features of table stores such as table pre-splitting for fast ingest, server-side filtering, and bulk loading of the data. As another aspect of table stores, it enables evaluating the effect of applying access control on performance by using pre-configured ACL lists to map credentials and operations for any schema. By using a monitoring tool, Otus (Ren et al., 2011), performance metrics of table stores and YCSB++ clients are collected in a central repository for fine-grained analysis. However, YCSB++ is tailored for table stores and more suited for evaluating big data applications. Moreover, the synchronization of the clients relies on the ZooKeeper service which performs poorly on the WAN scale. Although it supports the distribution of the clients, the distribution of the workload does not provide the ability to adjust data access overlap or access locality parameters.
BG (Barahmand and Ghandeharizadeh, 2013) is another benchmark that mainly focuses on performance under a specific real-world application workload. It models the workloads of social networking applications that have read operations like listing all friends or reading top posts for a user and write operations such as accepting friendship invitations. BG summarizes the performance evaluation in terms of Social Action Rating based on the customizable service level agreement(SLA). SLA is defined by 4 parameters, namely the percentage of requests to observe less than pre-specified response time, the response time, unpredictable data amount, and the unpredictable time limit for any data object. This simply models the measurements for latency and staleness. BG workload originally creates overlapping data access patterns since clients may request conflicting actions such as one client requests acceptance of friendship invitations and other client requests the reject for the same invitation. However, BG uses a locking mechanism to avoid these conflicting commands. Similarly, although the clients can be distributed in BG, it only uses this for scalability measures and does not accommodate the need for access locality parameter.
BenchFoundry (Bermbach et al., 2017) adopts a different approach to create workloads. Instead of providing predefined workloads, it allows creating the desired sequence of operations. In this way, it could be possible to generate custom workloads for the parameters listed in Table 6. However, it uses master-slave architecture before running the benchmarking clients which determines the order of the execution of the requests listed in each trace file. If we assume the jitter in clock synchronization is minimized, this would eliminate the conflicting commands even if clients can be configured to share the same key space.
4.2. Availability
UPB (Under Pressure Benchmark) (Fior et al., 2013) is the benchmark for measuring and quantifying the availability of distributed database systems. UPB uses distributed YCSB workloads and a more complex evaluation scenario with different load sizes, replication factors, and the number of failed nodes. The goal of UPB is to measure the performance impact on the system before, during, and after node failures. UPB leverages the YCSB workload generator for its availability evaluation, therefore inherits all its limitations too. That being said, UPB can be a guidance for any benchmarking suit on how to quantify and compare availability.
Chaos Monkey (Netflix, 2024) is a tool that randomly terminates virtual machine instances and containers that run inside of a cloud. Such random node termination could potentially reveal any problem in distributed systems thus ensures that engineers implement their services to be resilient to instance failures. Chaos Monkey is a good example that follows chaos engineering for fault injection in any benchmarking suit. Chaos Monkey lets the user define their own outage checker for availability checking, instead of giving any performance or other evaluation as plugins.
4.3. Consistency
The benchmarking frameworks that try to evaluate consistency, like YCSB++ (Patil et al., 2011), can usually measure only the read operation staleness in a weakly consistent system. YCSB++ coordinates multiple distributed clients using ZooKeeper and measures time-based staleness. The write operation is published to ZooKeeper right after it is completed. Then any subscribing client can get the written value and repeat read operations until it reads a new value. The time difference between the first and last read is the approximated lower bound of staleness. One benefit of such a method is the ability of online measuring of consistency, and the longer the benchmark runs, the better the chance to minimize the coordination noise. Similarly, BG measures the unpredictable data amount as it constraints the synchronization of the data with an unpredictable time amount in the service level agreement. To measure this, BG logs each read and write requests with unique ids then it compares their values based on the timestamp of the operation. This approach brings the accuracy for the time synchronization in the distributed setting of benchmarking clients. BenchFoundry follows a similar approach by logging all fine-grained results to evaluate staleness. On the other hand, it relies on the clock synchronization of the clients which is challenging in distributed settings. Out of listed benchmarking tools in table 2.2, only Jepsen provides testing for consistency models in terms of linearizability and serializability. However, it does not provide a black box benchmarking interface and it requires customizing workload characteristics depending on the consistency models. It simply enables the user to customize the workload to check whether the proposed consistency guarantees are preserved.
5. Related Work
Distributed systems have been maintaining their importance for the last 4 decades due to the increase in the need for scalable and reliable distributed applications while preserving high performance. To analyze distributed systems comprehensively and compare them in terms of features and services, various surveys and evaluations published in the past. Surveys on cloud providers, data warehouses, distributed file systems, or metadata services can be counted among them.
Cloud providers are analyzed and evaluated in terms of elasticity (Turner et al., 2013), computing power (Mohammadi and Bazhirov, 2017), and cost to performance efficiency (Gillam et al., 2013) in previous efforts. Widely used distributed services are also analyzed in many works such as a survey on stream processing (Shukla and Simmhan, 2016) or performance and dependability evaluation of MapReduce systems (Sangroya et al., 2016). Similarly, different aspects of distributed systems are studied in several surveys like reliability analysis on distributed systems (Ahmed and Wu, 2013) and load balancing characteristics of known systems (Jiang, 2016).
As a big part of distributed systems, data-warehouses and file systems are studied as well for many specifications. Evaluation of distributed data-warehouses for the cost-effectiveness of different hardware configurations (Berral et al., 2015) and query performance of distinct design choices(Darmont et al., 2017) are among the known efforts in these works. Distributed file systems are examined in many past works for general concepts (Levy and Silberschatz, 1990; Hac, 1985) or specific applications such as distributed access control (Miltchev et al., 2008). Due to the differences in optimization and design techniques and the complex interactions between the file systems and other system components like the kernel or operating system, benchmarking distributed file systems is not trivial. To identify the important metrics for the evaluation of distributed file systems, researches also studied benchmarking file systems (Traeger et al., 2008; Tarasov et al., 2011).
Analysis of distributed coordination services in terms of general characteristics and importance of coordination (Ossowski and Menezes, 2006) and the comparison of existing algorithms (Lamport, 2001) are among the published works. However, as of our knowledge, there is no published work for benchmarking distributed coordination systems. As mentioned in the Introduction, due to the lack of standard benchmarking tools for distributed coordination services, developers widely use their ad-hoc benchmarks which are prone to unfair comparisons or limited results for the evaluation of the systems. This survey is unique in identifying the metrics and parameters for the evaluation of distributed coordination systems, discussing how each system uses these metrics and parameters for their evaluation, pinpointing the deficiencies of well-known benchmarking suites in evaluating distributed computing systems, and finally discussing the features of an ideal distributed coordination benchmark.
6. Conclusion
Increasing demand in web-based big-data applications brought out the need for efficient use of distributed systems, which highly depend on the adequate implementation of distributed coordination. Distributed systems community have developed different protocols, coordination services, and distributed applications built on top of these services to satisfy this rapid growth in big data applications. However, due to the lack of a standard benchmarking tool, developers generally opt to use ad-hoc evaluation mechanisms and microbenchmarks. Hence, the evaluation of these systems has been very limited, resulting in inadequate and misleading measurements and an unfair comparison of the competing systems. In this paper, we have analyzed and compared well-known and widely used distributed coordination services, their evaluation mechanisms, and the tools used to benchmark those systems. We have identified the essential requirements of distributed coordination service benchmarking, such as the metrics and parameters for the evaluation of the performance, scalability, availability, and consistency of these systems
Despite the commonalities in tuning parameters like read/write ratio, data access overlap, or size of data objects for performance measurements, access locality and number of data objects are not extensively evaluated by most of the systems. These two parameters, on the other hand, may have a significant impact on the system performance for systems that allow concurrent writes since they are the main factors of producing conflicting or colliding commands. Similarly, they are critical for managing ownership of data objects for systems using ownership mechanisms to resolve conflicts. While most of the systems are evaluated with a single value of read/write ratio and size of data objects, tuning these parameters for different values is essential to understand the system performance extensively for different type of workloads since depending on the type of applications using these services, the percentage of update operations or the size of data objects may change dramatically. Likewise, data access overlap is evaluated only for systems sharing the entire data space, but it is also a system-specific parameter that needs to be analyzed for different scenarios.
References
- Lamport (1998) L. Lamport, The part-time parliament, ACM Transactions on Computer Systems TOCS (1998) Volume 16 Issue 2.
- Gafni and Lamport (2003) E. Gafni, L. Lamport, Disk paxos, Distributed Computing 16 16/1 (2003) 1–20.
- Lamport and Massa (2004) L. Lamport, M. Massa, Cheap paxos, in: International Conference on Dependable Systems and Networks, 2004, IEEE, pp. 307–314.
- Lamport (2006) L. Lamport, Fast paxos, Distributed Computing 19 (2006) 79–103.
- Lamport (2005) L. Lamport, Generalized Consensus and Paxos, Technical Report, 2005.
- Ongaro and Ousterhout (2014) D. Ongaro, J. Ousterhout, In search of an understandable consensus algorithm, USENIX ATC’14 Proceedings of the 2014 USENIX conference on USENIX Annual Technical Conference (2014) 305–320.
- Mao et al. (2008) Y. Mao, F. Junqueira, K. Marzullo, Mencius: building efficient replicated state machines for wans, OSDI’08 Proceedings of the 8th USENIX conference on Operating systems design and implementation (2008) 369–384.
- Howard et al. (2016) H. Howard, D. Malkhi, A. Spiegelman, Flexible paxos: Quorum intersection revisited, CoRR abs/1608.06696 (2016).
- Moraru I (2013) K. M. Moraru I, Andersen D, There is more consensus in egalitarian parliaments, SOSP ’13 Proceedings of the Twenty-Fourth ACM Symposium on Operating Systems Principles (2013) 358–372.
- Ailijiang et al. (2017) A. Ailijiang, A. Charapko, M. Demirbas, T. Kosar, Multileader WAN paxos: Ruling the archipelago with fast consensus, CoRR abs/1703.08905 (2017).
- Ryabinin et al. (2024) F. Ryabinin, A. Gotsman, P. Sutra, Swiftpaxos: Fast geo-replicated state machines, in: 21st USENIX Symposium on Networked Systems Design and Implementation (NSDI’24).
- Hunt et al. (2010) P. Hunt, M. Konar, F. Junqueira, B. Reed, Zookeeper: Wait-free coordination for internet-scale systems, USENIXATC’10 Proceedings of the 2010 USENIX conference on USENIX annual technical conference (2010) 11–11.
- M. (2006) B. M., The chubby lock service for loosely-coupled distributed systems, OSDI ’06 Proceedings of the 7th symposium on Operating systems design and implementation (2006) 335–350.
- Balakrishnan et al. (2013) M. Balakrishnan, D. Malkhi, T. Wobber, M. Wu, V. Prabhakaran, M. Wei, J. D. Davis, S. Rao, T. Zou, A. Zuck, Tango: Distributed data structures over a shared log, in: Proceedings of the Twenty-Fourth ACM Symposium on Operating Systems Principles, SOSP ’13, ACM, New York, NY, USA, 2013, pp. 325–340.
- Ailijiang et al. (2017) A. Ailijiang, A. Charapko, M. Demirbas, B. O. Turkkan, T. Kosar, Efficient distributed coordination at wan-scale, in: 37th IEEE International Conference on Distributed Computing Systems, ICDCS 2017, Atlanta, GA, USA, June 5-8, 2017, pp. 1575–1585.
- Corbett et al. (2013) J. C. Corbett, J. Dean, M. Epstein, A. Fikes, C. Frost, J. J. Furman, S. Ghemawat, A. Gubarev, C. Heiser, P. Hochschild, W. Hsieh, S. Kanthak, E. Kogan, H. Li, A. Lloyd, S. Melnik, D. Mwaura, D. Nagle, S. Quinlan, R. Rao, L. Rolig, Y. Saito, M. Szymaniak, C. Taylor, R. Wang, D. Woodford, Spanner: Google’s globally distributed database, ACM Trans. Comput. Syst. 31 (2013) 8:1–8:22.
- Cooper et al. (2008) B. F. Cooper, R. Ramakrishnan, U. Srivastava, A. Silberstein, P. Bohannon, H.-A. Jacobsen, N. Puz, D. Weaver, R. Yerneni, Pnuts: Yahoo!’s hosted data serving platform, Proc. VLDB Endow. 1 (2008) 1277–1288.
- Hindman et al. (2011) B. Hindman, A. Konwinski, M. Zaharia, A. Ghodsi, A. D. Joseph, R. Katz, S. Shenker, I. Stoica, Mesos: A platform for fine-grained resource sharing in the data center, in: Proceedings of the 8th USENIX Conference on Networked Systems Design and Implementation, NSDI’11, USENIX Association, Berkeley, CA, USA, 2011, pp. 295–308.
- Kreps et al. (2011) J. Kreps, N. Narkhede, J. Rao, et al., Kafka: A distributed messaging system for log processing, in: Proceedings of the NetDB, volume 11, Athens, Greece, pp. 1–7.
- Twitter (2014) E. Twitter, Manhattan, our real-time, multi-tenant distributed database for twitter scale, https://blog.twitter.com/engineering/en_us/a/2014/manhattan-our-real-time-multi-tenant-distributed-database-for-twitter-scale.html, 2014.
- Chandra et al. (2007) T. Chandra, R. Griesemer, J. Redstone, Paxos made live: an engineering perspective, PODC ’07 Proceedings of the twenty-sixth annual ACM symposium on Principles of distributed computing (2007) 398–407.
- Dobre et al. (2010) D. Dobre, M. Majuntke, M. Serafini, N. Suri, Hp: Hybrid paxos for wans, EDCC ’10 Proceedings of the 2010 European Dependable Computing Conference (2010) 117–126.
- Peluso et al. (2016) S. Peluso, A. Turcu, R. Palmieri, Making fast consensus generally faster, Dependable Systems and Networks (DSN), 2016 46th Annual IEEE/IFIP International Conference on (2016).
- Hoch et al. (2017) E. N. Hoch, Y. Ben-Yehuda, N. Lewis, A. Vigder, Bizur: A key-value consensus algorithm for scalable file-systems, CoRR abs/1702.04242 (2017).
- Junqueira et al. (2011) F. Junqueira, B. Reed, M. Serafini, Zab: High-performance broadcast for primary-backup systems, DSN ’11 Proceedings of the 2011 IEEE/IFIP 41st International Conference on Dependable Systems and Networks (2011) 245–256.
- Thomson et al. (2012) A. Thomson, T. Diamond, S.-C. Weng, K. Ren, P. Shao, D. J. Abadi, Calvin: Fast distributed transactions for partitioned database systems, in: Proceedings of the 2012 ACM SIGMOD International Conference on Management of Data, SIGMOD ’12, ACM, New York, NY, USA, 2012, pp. 1–12.
- Lev-Ari et al. (2016) K. Lev-Ari, E. Bortnikov, I. Keidar, A. Shraer, Modular composition of coordination services, in: 2016 USENIX Annual Technical Conference (USENIX ATC 16), USENIX Association, Denver, CO, 2016, pp. 251–264.
- Guo et al. (2017) S. Guo, R. Dhamankar, L. Stewart, Distributedlog: A high performance replicated log service, in: 2017 IEEE 33rd International Conference on Data Engineering (ICDE), pp. 1183–1194.
- Lloyd et al. (2011) W. Lloyd, M. J. Freedman, M. Kaminsky, D. G. Andersen, Don’t settle for eventual: Scalable causal consistency for wide-area storage with cops, in: Proceedings of the Twenty-Third ACM Symposium on Operating Systems Principles, SOSP ’11, ACM, New York, NY, USA, 2011, pp. 401–416.
- coc (2018) Cockroachdb is 10x more scalable than amazon aurora for oltp workloads, 2018.
- Cooper et al. (2010) B. F. Cooper, A. Silberstein, E. Tam, R. Ramakrishnan, R. Sears, Benchmarking cloud serving systems with ycsb, in: Proceedings of the 1st ACM Symposium on Cloud Computing, SoCC ’10, ACM, New York, NY, USA, 2010, pp. 143–154.
- TPC (1992) Tpc-c: an on-line transaction processing benchmark, http://www.tpc.org/tpcc/, 1992.
- Kingsbury (2024) K. Kingsbury, Jepsen tests, https://jepsen.io/, 2024.
- Joglekar et al. (2002) A. Joglekar, C. Barb, M. Hibler, M. Newbold, S. Guruprasad, R. Ricci, L. Stoller, J. Lepreau, B. White, An integrated experimental environment for distributed systems and networks, ACM SIGOPS Operating Systems Review - OSDI ’02: Proceedings of the 5th symposium on Operating systems design and implementation (2002) 255–270.
- Benzel et al. (2007) T. Benzel, R. Braden, D. Kim, Design, deployment, and use of the deter testbed, Proceedings of the DETER Community Workshop on Cyber-Security and Test (2007).
- EC2 (2024) Amazon elastic compute cloud, https://aws.amazon.com/ec2/, 2024.
- GCE (2024) Google compute engine: Scalable, high-performance virtual machines, https://cloud.google.com/compute/, 2024.
- Friedman and Hadad (2006) R. Friedman, E. Hadad, Distributed wisdom: analyzing distributed-system performance - latency vs. throughput, IEEE Distributed Systems Online 7 (2006).
- Balakrishnan et al. (2012) M. Balakrishnan, D. Malkhi, V. Prabhakaran, T. Wobber, M. Wei, J. D. Davis, Corfu: A shared log design for flash clusters, in: Proceedings of the 9th USENIX Conference on Networked Systems Design and Implementation, NSDI’12, USENIX Association, Berkeley, CA, USA, 2012, pp. 1–1.
- Ela (2024) Elastifile file system, https://www.elastifile.com/, 2024.
- Dey et al. (2014) A. Dey, A. Fekete, R. Nambiar, U. Röhm, Ycsb+t: Benchmarking web-scale transactional databases, in: 2014 IEEE 30th International Conference on Data Engineering Workshops, pp. 223–230.
- Patil et al. (2011) S. Patil, M. Polte, K. Ren, W. Tantisiriroj, L. Xiao, J. López, G. Gibson, A. Fuchs, B. Rinaldi, Ycsb++: Benchmarking and performance debugging advanced features in scalable table stores, in: Proceedings of the 2Nd ACM Symposium on Cloud Computing, SOCC ’11, ACM, New York, NY, USA, 2011, pp. 9:1–9:14.
- Barahmand and Ghandeharizadeh (2013) S. Barahmand, S. Ghandeharizadeh, Bg: A benchmark to evaluate interactive social networking actions., in: CIDR.
- Fior et al. (2013) A. G. Fior, J. A. Meira, E. C. de Almeida, R. G. Coelho, M. D. Del Fabro, Y. Le Traon, Under pressure benchmark for ddbms availability, Journal of Information and Data Management 4 (2013) 266.
- Netflix (2024) Netflix, Chaos monkey, https://github.com/Netflix/chaosmonkey, 2024.
- Huang et al. (2010) S. Huang, J. Huang, J. Dai, T. Xie, B. Huang, The hibench benchmark suite: Characterization of the mapreduce-based data analysis, in: Data Engineering Workshops (ICDEW), 2010 IEEE 26th International Conference on, IEEE, pp. 41–51.
- Wang et al. (2014) L. Wang, J. Zhan, C. Luo, Y. Zhu, Q. Yang, Y. He, W. Gao, Z. Jia, Y. Shi, S. Zhang, C. Zheng, G. Lu, K. Zhan, X. Li, B. Qiu, Bigdatabench: A big data benchmark suite from internet services, in: 2014 IEEE 20th International Symposium on High Performance Computer Architecture (HPCA), pp. 488–499.
- Bermbach et al. (2017) D. Bermbach, J. Kuhlenkamp, A. Dey, A. Ramachandran, A. Fekete, S. Tai, Benchfoundry: A benchmarking framework for cloud storage services, pp. 314–330.
- HBa (2024) Apache hbase, http://hbase.apache.org/, 2024.
- Acc (2024) Apache accumulo, https://accumulo.apache.org/, 2024.
- Ren et al. (2011) K. Ren, J. López, G. Gibson, Otus: Resource attribution in data-intensive clusters (2011).
- Turner et al. (2013) A. Turner, A. Fox, J. Payne, H. S. Kim, C-mart: Benchmarking the cloud, IEEE Transactions on Parallel and Distributed Systems 24 (2013) 1256–1266.
- Mohammadi and Bazhirov (2017) M. Mohammadi, T. Bazhirov, Comparative benchmarking of cloud computing vendors with high performance linpack, CoRR abs/1702.02968 (2017).
- Gillam et al. (2013) L. Gillam, B. Li, J. O’Loughlin, A. P. S. Tomar, Fair benchmarking for cloud computing systems, Journal of Cloud Computing: Advances, Systems and Applications 2 (2013) 6.
- Shukla and Simmhan (2016) A. Shukla, Y. Simmhan, Benchmarking distributed stream processing platforms for iot applications, CoRR abs/1606.07621 (2016).
- Sangroya et al. (2016) A. Sangroya, S. Bouchenak, D. Serrano, Experience with benchmarking dependability and performance of mapreduce systems, Performance Evaluation 101 (2016) 1 – 19.
- Ahmed and Wu (2013) W. Ahmed, Y. W. Wu, A survey on reliability in distributed systems, Journal of Computer and System Sciences 79 (2013) 1243 – 1255.
- Jiang (2016) Y. Jiang, A survey of task allocation and load balancing in distributed systems, IEEE Transactions on Parallel and Distributed Systems 27 (2016) 585–599.
- Berral et al. (2015) J. L. Berral, N. Poggi, D. Carrera, A. Call, R. Reinauer, D. Green, ALOJA: A framework for benchmarking and predictive analytics in big data deployments, CoRR abs/1511.02037 (2015).
- Darmont et al. (2017) J. Darmont, F. Bentayeb, O. Boussaïd, Benchmarking data warehouses, CoRR abs/1701.00399 (2017).
- Levy and Silberschatz (1990) E. Levy, A. Silberschatz, Distributed file systems: Concepts and examples, ACM Comput. Surv. 22 (1990) 321–374.
- Hac (1985) A. Hac, Distributed file systems - a survey, SIGOPS Oper. Syst. Rev. 19 (1985) 15–18.
- Miltchev et al. (2008) S. Miltchev, J. M. Smith, V. Prevelakis, A. Keromytis, S. Ioannidis, Decentralized access control in distributed file systems, ACM Comput. Surv. 40 (2008) 10:1–10:30.
- Traeger et al. (2008) A. Traeger, E. Zadok, N. Joukov, C. P. Wright, A nine year study of file system and storage benchmarking, Trans. Storage 4 (2008) 5:1–5:56.
- Tarasov et al. (2011) V. Tarasov, S. Bhanage, E. Zadok, M. Seltzer, Benchmarking file system benchmarking: It *is* rocket science, in: 13th Workshop on Hot Topics in Operating Systems, HotOS XIII, Napa, California, USA, May 9-11, 2011.
- Ossowski and Menezes (2006) S. Ossowski, R. Menezes, On coordination and its significance to distributed and multi-agent systems, Concurrency and Computation: Practice and Experience 18 (2006) 359–370.
- Lamport (2001) L. Lamport, Paxos made simple (2001) 51–58.