Expansion and Spectral Softening of the Dust Scattering Rings of GRB 221009A
Abstract
Expanding X-ray halo or rings appear when short pulses of X-ray radiation from a background source are scattered by clouds of dust in the Milky Way. We study the X-ray rings of the brightest gamma-ray burst (GRB) 221009A, detected by the Swift X-Ray Telescope. The rings center on the GRB position and their angular radii increase with time. We identify five major expanding rings, and our modeling of their expansion history suggests that they are scattered off, respectively, from five dusty clouds at distances of 0.4-13 kpc from the observer. Given an assumed prompt X-ray fluence of this GRB, the fluxes of those rings suggest that these clouds have dust grain column densities of . More interestingly, our time-dependent spectral analysis of these rings show that they all experience spectral softening, i.e., getting softer as they expand, with spectral indices ranging from 2.2 to 5, consistent with what the dust scattering model predicts.
1 Introduction
X-rays from bright point sources are affected by the scattering of interstellar dust particles as they are directed towards the observer, and the small-angle scattering of X-rays by dust grains can form detectable X-ray ‘halos’ around distant X-ray sources. Rolf (1983) first confirmed the presence of a faint X-ray halo around the bright X-ray source GX339-4 by analysing the Einstein Observatory data. Mauche & Gorenstein (1986) used the Einstein to observe six such ‘halo’ sources, and they found that the intensities of the halos are strongly correlated with the extinction of visible light or the distance of the X-ray photons through the Galaxy’s dust layer. Predehl et al. (2000) used the variability time delay between the halo and the source (Trümper & Schönfelder, 1973) to measure the distance of Cygnus X-3 to be 9 kpc. This measurement was consistent with previous results. Smith et al. (2002) analyzed the halo of X-ray binary GX 13+1 observed by Chandraand determined the light-of-sight position, size distribution and density of the scattering dust grains.
Gamma-ray bursts (GRBs) (Klebesadel et al., 1973) are the most violent explosions other than the Big Bang. They are sudden and random, increase in ray radiation from cosmological distances. GRBs produce high X-ray fluxes for short periods of time, usually s. The duration of a GRB in the gamma-ray band is generally characterized by , which is defined as the duration between of the cumulative flux as a percentage of the total ray flux. Kouveliotou et al. (1993) shows that GRBs can be classified into long GRBs ( 2 s) and short GRBs ( 2 s) based on their duration. Short GRBs are thought to be mergers of binary neutron star systems, whereas long GRBs are produced by collapse of massive stars (Zhang et al., 2009).
The transient nature of the burst, combined with the high initial X-ray flux, means that the dust-scattered X-rays may be visible with relatively high surface brightness. Dust scattering rings have so far only been observed around five GRBs: 031203, 050713A, 050724, 061019, 070129 and 160623A (Vaughan et al., 2004; Tiengo & Mereghetti, 2006; Vaughan et al., 2006; Vianello et al., 2007; Pintore et al., 2017). The study of dust scattering rings helps to derive the distance, composition and grain size distribution of the dusty cloud.
On October 9th, 2022 at 13:16:59.988 UTC, the Fermi Gamma-ray Burst Monitor (GBM) was triggered by a very bright GRB. It was also detected by the Fermi Large Area Telescope (LAT) (Veres et al., 2022; Bissaldi et al., 2022), Swift (Lipunov et al., 2022), HXMT-Insight (Tan et al., 2022), HEBS (GECAME-C) (Liu et al., 2022) and LHAASO reported gamma-ray detections of up to 18 TeV (Huang et al., 2022). GRB 221009A is the brightest GRB in history, whose prompt emission lasted for approximately 327 s (Lesage et al., 2022). This source is located at RA = 288∘.262, Dec = 19∘.8028 (Lipunov et al., 2022), close to the Galactic Plane ( = 4∘.32 and = 52∘.96). The afterglow was observed by the X-shooter on ESO’s Very Large Telescope UT3 and a redshift of = 0.151 was determined (Lesage et al., 2022), corresponding to a distance of 749.3 Mpc. The close proximity and the huge energy output make this burst an extraordinary event.
In this paper, we study the X-ray halo around GRB 221009A observed by Swift/XRT on six observations shortly after the burst. After we started the work, several other works have appeared. Vasilopoulos et al. (2023) analysed XRT data from the days following the Swift detection of GRB 221009A and found a total of 16 rings due to scattering from dust clouds at distances of 3.4 14.7 kpc from Earth. Williams et al. (2023) uesed Swift/XRT data to find a series of dust clouds that ranged from 0.2 kpc to over 10 kpc from the observer. Negro et al. (2023) used IXPE data to estimate the mean distances of the inner and outer rings as 14.41 and 3.75 kpc, respectively, from the temporal evolution of the two dust scattering rings. Tiengo et al. (2023) used XMM-Newton data to find 20 dust scattering rings around the GRB 221009A produced by dust between 0.3 kpc and 18.6 kpc.
Although the different teams have analyzed the dust scattering rings from the same source, the numbers of dust scattering rings obtained are different, as well as the distances of the dust clouds from the observer. In view of these, our goal is to determine the location and the grain column densities of the dust clouds by studying the temporal evolution of the dust scattering rings. More importantly, the dust scattering model predicts a strong spectral softening in the ring flux (Shao & Dai, 2007; Shen et al., 2009), so we will further investigate this spectral feature for GRB 221009A.
The paper is structured as follows. We describe the observed data and the image extraction, in Section 2. We analyze the dust scattering rings and model their expansion in Section 3. The rings’ spectral analysis and the modeling of the softening feature are presented in Section 4. Then, we estimate the dust column densities from the ring fluxes in Section 5. Finally, we summarize the result and conclude in Section 6.
2 X-RAY IMAGE EXTRACTION
The Swift Burst Alert Telescope (BAT) was triggered by GRB 221009A on October 9th, 2022 at 14:10:17 UTC (Dichiara et al., 2022). The Swift X-ray telescope (XRT) observations of the GRB 221009A filed started on 14:13:30 UTC, about 3 minutes after the BAT trigger. Actually, the burst triggerd Fermi and HXMT-insight even earlier, at 13:16:59 UTC and 13:17:00 UTC (Lesage et al., 2022; Tan et al., 2022), respectively.
The data used in this paper come from the X-ray telescope (XRT) of the Neil Gehrels Swift satellite (Burrows & Swift XRT Team, 2004). Working in the photon energy range of 0.3 10.0 keV, XRT has two data modes: windowed-timing (WT) mode and photon-counting (PC) mode. The WT mode allows imaging in only one spatial dimension, whereas the PC mode produces two-dimensional images (Hill et al., 2004). We focused primarily on the PC data, download from the Swift Science Data Centre111https://www.swift.ac.uk/user_objects/. We analysed 0.3-10 keV images centred on the GRB 221009A location using the XIMAGE222https://heasarc.gsfc.nasa.gov/docs/software/lheasoft software package. During the processing of the XRT data, we use the xrtpipeline333https://swift.gsfc.nasa.gov/analysis/xrt_swguide_v1_2.pdf tool to generate the 2-level event files for calibration and cleaning. First we extract the total image using the XSELECT444https://heasarc.gsfc.nasa.gov/docs/software/lheasoft/ftools/xselect/xselect.html tool, then, we use the annulus in the Ds9555https://ds9.si.edu/doc/user/gui/index.html tool to extract the rings. Finally we extract the corresponding energy spectrum by XSELECT. The spectral data was binned using the tool GRPPHA666https://heasarc.gsfc.nasa.gov/docs/software/lheasoft to have a sufficient number of counts in each bin. We used the XSPEC777https://heasarc.gsfc.nasa.gov/xanadu/xspec/manual/manual.html tool for the X-ray spectra fitting.
We use six XRT observations performed between MJD 59862.34–59866.03 with OBS-ID numbers 01126853004, 01126853005, 01126853006, 01126853008, 01126853009 and 01126853011, respectively. We adopt the Insight-HXMT trigger time as the burst onset time, i.e., T0= 13:17:00 UTC on 2022 October 9. The start times of the six observations are T0 + 67693 s, 105647 s, 111954 s, 215928 s, 300355 s and 386300 s, respectively.
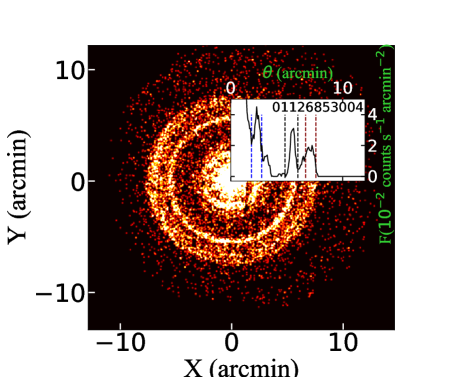
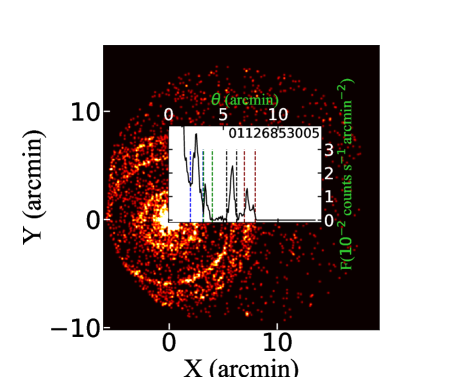
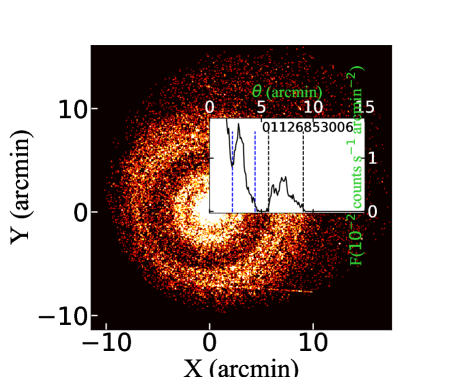
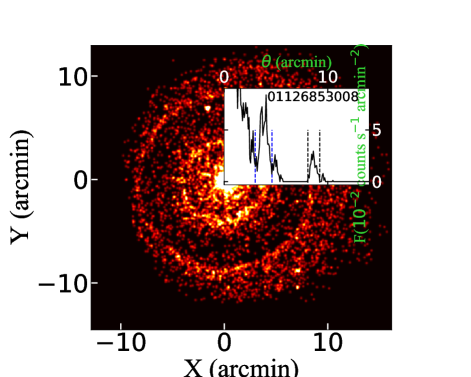
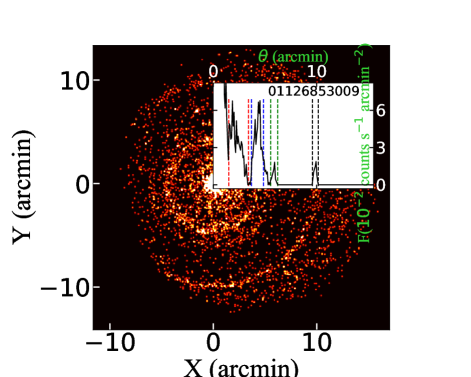
We extracted images of these six observations and they are shown in Figure 1. All the images show multiple rings and the surface brightness of each ring is not the same. The presence of multiple rings are due to the fact that photons with the same arrival time but with different scattering angles propagate in different paths. We can see that there are at least two rings per observation. To help identify different rings, we plot the radial profile of the X-ray surface brightness of each image in the insets of Figure 1. This is obtained by summing the counts in each of a series of continuously distributed concentric annuli (with equal binsize of 1 arcsec) centered on the GRB location.
Except for the central bright peak which represents the on-going GRB X-ray afterglow, each peak in a single inset of Figure 1 corresponds to a dust-scattering ring in the image, caused by an individual dust cloud on the line of sight. In total we get nineteen rings from these six observations, each observation having 2-4 rings.
3 RING EXPANSION AND MODELING
The dust scattering echoes contain a wealth of information about the Galactic dust distribution along the line of sight of GRB 221009A, providing a unique opportunity to measure distances to those dust clouds. The geometry of X-ray scattering by a single dust cloud is shown in Figure 2. We consider the source at a distance from the earth, whose X-ray photons can be scattered at a small angle by the dust layer at a distance , and the scattered photons will be observed with a time delay .
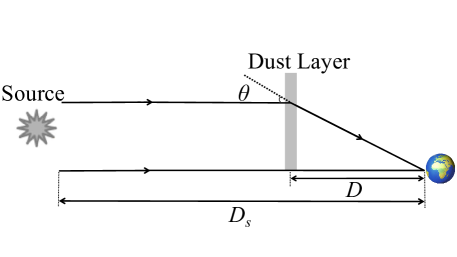
The distance to the scattering dust can be inferred from the radial expansion of the ring as its size increases with time. For a ring detected at a delay time , the scattering angle (also the ring angular size) is given by (Tiengo & Mereghetti, 2006)
| (1) |
where is the distance between the dust and the observer, c is the speed of light, and is the arrival time of the photon at zero scattering angle, and also the arrival time of the GRB prompt emission. Photons scattered by the same dust layer but arriving later will constitute a larger ring. Thus, the observer sees an expanding ring.
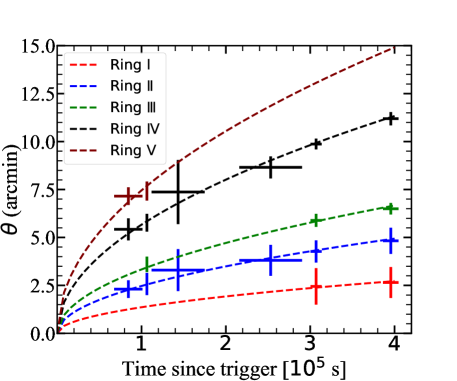
We plot the angular radii of the rings identified in Section 2, vesus the observing times, in Figure 3. They are then fitted with Equation (1) (dashed lines), which describes the radial expansion of the ring with time. The data and the fit in Figure 3 show that five expanding rings can be identified, each being indicated by the same color and corresponding to one dust cloud. The best-fit model in Figure 3 give the distances of the five dust clouds to be 0.42 0.03 kpc, 0.72 0.02 kpc, 2.1 0.07 kpc, 3.8 0.1 kpc and 12.4 0.6 kpc, respectively.
4 SPECTRAL EVOLUTION AND MODELING
The spectral information of the ring flux may carry the characteristics of the dust scattering process. We extracted the PC-mode spectrum of each ring using an annulus that encompasses the ring, and extracted the darker signals in the region outside it as the background spectrum. We substract the background spectrum from the spectrum of interest to reduce the interference of noise. Then we fit it with an absorbed power-law model where is the photon index; the other two parameters are a normalisation parameter and an equivalent Glactic hydrogen column density . The fitting was done using Xspec version 12.12.1 (Arnaud, 1996) utilizing the absorption model TBABS (Wilms et al., 2000).
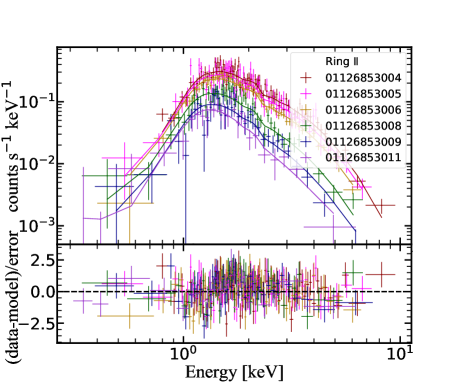
As an example, we show the spectral fit results for the expanding ring II in Figure 4. It shows that as time increases, the spectral peak gradually moves to lower energies, indicating a gradual softening of the spectrum. The spectral fit results for all expanding rings show a range of the spectral index, of = 2.25, with a gradual softening, i.e., an ever increasing , for each expanding ring. Here the spectral index is defined as and . The best fit absorbing H-column density is = 1.7 1022 cm-2. The evolution of the spectral index over time is shown in Figure 5 (as crosses). Each same color in Figure 5 corresponds to the same expanding ring in Figure 3.
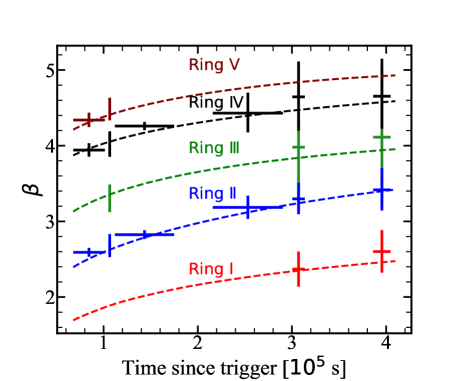
This spectral softening is consistent with the predictions of the dust scattering model of Shao & Dai (2007) and Shen et al. (2009). Below, we briefly review this model. We assume that the grains in the dust cloud (here simplified to a dust layer as shown in Figure 2) have a power-law size distribution within a size range (), i.e., the column density cm of the grains whose sizes are in the interval is given as (Mathis et al., 1977; Mauche & Gorenstein, 1986; Draine, 2003)
| (2) |
where is the column density per unit size interval at 0.1 m, and is the distribution index.
For a photon of energy (or wavelength ) to be scattered at small angles by a dust grain of size , the differential cross section of the scattering cm2 strd in the Rayleigh-Gans approximation is (Overbeck, 1965; Alcock & Hatchett, 1978; Mauche & Gorenstein, 1986) 888Note that in Eq.(8) of Shao & Dai (2007) a factor of is missing.
| (3) |
where is the total scattering cross section. In the angular-dependence part on the right hand side of Eq. (4), is the first-order spherical Bessel function, and
| (4) |
is the scaled scattering angle.
Consider that a GRB source, during its prompt emission phase, shines on the dust screen an X-ray energy per unit area erg cm of
| (5) |
within the photon energy interval , where erg cm-2 keV is the photon fluence per unit photon energy interval. Since the GRB prompt phase lasts very briefly ( 10 s) compared with the dust echo, it can be considered as being instantaneous.
Consider an annulus of on the dust layer that was shown in Figure 2. The solid angle opened by the annulus with respect to the observer is . The radiation energy per unit surface area on the annulus that is scattered toward the observer within a unit solid angle erg cm-2 strd would be
| (6) |
All the scattered photons from this annulus will arrive at the observer within the time interval , and . Then the flux erg s-1 cm received at the observer from the annulus is
| (7) | ||||
where is the differential optical depth of the dust layer for scattering.
Terefore, at time , the detector received a scattered specific flux erg cm-2 s-1 keV from the dust grains in the size range at the photon energy ,
| (8) | ||||
where and the nominal optical depth (dimensionless) of the dust layer is
| (9) |
Thus, the flux received by an X-ray detector within an energy range () at time is
| (10) |
It is easy to show that the angular term increases as from to and then drops rapidly as for (Hayakawa, 1970). Therefore, at a given photon energy , the echo ring flux first evolves as a plateau with time (), then decays as . The transition time would be given by
| (11) |
which corresponds to a characteristic scattering angle , or
| (12) |
The photon energy dependences of and suggest that the decay of the ring flux starts much earlier at higher photon energy than at lower energies. Thus the overall echo emission must experience strong spectral softening.
To compare with the spectral fit result from the data, we compute a model-predicted two-point spectral index as
| (13) |
where FE(t) is calculated by Eq. (8), and the dust cloud distance takes the values obtained from the ring expansion modeling (Section 3).
The GRB prompt X-ray fluence S(E) is needed as well to calculate FE(t), which we obtain as follows. We first fit the Band function (Band et al., 1993) to the prompt Fermi/GBM -ray spectral data999https://heasarc.gsfc.nasa.gov/FTP/fermi/data/gbm/ (Lesage et al., 2023). The best-fit parameters are listed in Table 1. Due to the superior fitting results of the detector n6 data, we choose to adopt its best-fit parameter values: the lower-energy photon index , the high-energy photon index , Epeak = 120 keV and the normalization . Then we extrapolate the fitted Band function to the X-ray band, and get and . Note that in a different approach, Tiengo et al. (2023) assumed different dust compositions and grain size distribution models to fit the spectrum of the ring, and reconstructed GRB 221009A’s prompt X-ray spectrum. They obtained in the 0.55 keV range.
| Detector | C | |||
|---|---|---|---|---|
| n3 | -0.85 | -2.2 | 100 | 328/117 |
| n4 | -1.38 | -1.51 | 56 | 298/115 |
| n6 | -1.48 | -1.68 | 120 | 293/115 |
| n7 | -1.53 | -1.79 | 98 | 328/115 |
| n8 | -1.38 | -1.69 | 113 | 491/117 |
We fit the observed spectral index evolution of each ring shown in Figure 5 with Eq. (13). In this way we also determine the size of the dust grains ( and ) as well as the exponent q. The best-fit parameters are shown in Table 2. The calculated spectral indices for each ring are plotted as the dashed lines in Figure 5, which well reproduce the observed spectral evolution. Altogether, this consistency suggests that the spectral softening is a robust feature from the X-ray dust scattering model.
5 RING FLUX EVOLUTION AND DUST COLUMN DENSITY
| Ring | ||||||
|---|---|---|---|---|---|---|
| I | 0.015 | 0.55 | 3.8 | 0.9 | 0.7 | |
| II | 0.015 | 0.65 | 3.7 | 1.1 | 0.7 | |
| III | 0.015 | 0.75 | 3.0 | 0.7 | 0.5 | |
| IV | 0.015 | 0.60 | 4.0 | 4 | 4.0 | |
| V | 0.015 | 0.55 | 3.6 | 2.1 | 1.1 |
-
a
Distance from the dust cloud to Earth. b The column density per unit size interval at m of the cloud. c The column density of all grains for the cloud.
Note that Eqs. (8-10) not only predict the decline of the ring flux, and but also contain the information about the dust column density of the cloud (included in ). Here we compare them with the data and infer the column density. We fitted the observed spectrum using a simple power-law function to obtain the flux [] of each ring, plotted as crosses in Figure 6.
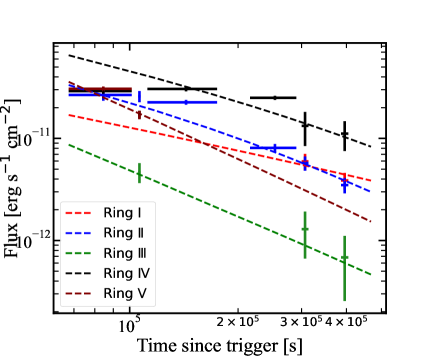
The model-predicted flux evolution of the expanding ring was computed using Eq. (10), with = 0.3 keV and = 10 keV, and using the best-fit parameter values of , and obtained in Section 4 and listed in Table 2; S(E) takes the value at 0.3-10 keV extropolated from the Band function fitting (Section 4). It is shown as the dashed lines in Figure 6.
Our analysis leads to an estimate of N0.1μm in the range of cmm-1. The column density of dust particles of all sizes in the dust cloud is estimated by integrating Eq. (2) over (), which gives . The best-fitting parameters are provided in Table 2. Note that Mauche & Gorenstein (1986) and Holland et al. (2010) estimated and 1012 cm-2, respectively, using the scattering optical depth. Taking a typical size of cloud , the number density of grains in the dust cloud is estimated to be .
6 conclusions
In this study, we performed a comprehensive analysis of the X-ray dust scattering rings associated with GRB 2210019A, the most luminous GRB ever recorded. Typically, the scattered radiation from a bright X-ray point source manifests as an X-ray halo. In the particular case of variable X-ray sources that exhibit short bursts, along with non-uniform distribution of dust along the line of sight that concentrates within discrete dust clouds, multiple X-ray rings can be observed.
Using publicly available data from the Swift/XRT, we conducted an analysis of six observations of GRB 221009A. The XRT images unveiled the presence of multiple dust halos, from which we identified nineteen dust scattering rings via radial profiles of flux. By employing a simple yet well-established theoretical framework for the scattering of X-ray photons by dust clouds along the line of sight, we identified five expanding rings and successfully modeled their expansion. Our findings indicate that these scattering rings originate from dust clouds situated at distances of 0.42 0.03 kpc, 0.72 0.02 kpc, 2.1 0.07 kpc, 3.8 0.1 kpc and 12 0.6 kpc from the observer.
Our analysis also revealed a significant spectral softening of the ring emission as the rings expand in size, which we accurately reproduce via the existing theoretical framework for the dust scattering of the prompt X-ray emission. This feature can be attributed to the fact that the hard X-ray photons undergo smaller scattering angles and arrive earlier, while the softer photons experience larger scattering angles and arrive later (Shao & Dai, 2007; Shao et al., 2008; Shen et al., 2009; Zhao & Shao, 2014).
We identified a total of 19 rings, similar in number to those identified by Vasilopoulos et al. (2023), Williams et al. (2023), Negro et al. (2023) and Tiengo et al. (2023). Among these, we find five expanding rings, which is consistent with the number reported by Vasilopoulos et al. (2023). It is worth noting that we also observed ring , which they did not provide, possibly because our analysis was conducted after a longer outburst compared to theirs. Additionally, we specifically focus on the energy range of 0.3-10 keV, while they adopt an energy range of 1 keV. The distances of the dust clouds that we inferred are similar to theirs.
Furthermore, our analysis primarily focuses on the spectral softening of rings and the dust column density, aspects that are not extensively discussed in those studies. More observations of dust scattering rings may hold the potential to study in detail the dust distribution and composition within our galaxy.
We thank Long Ji and Bin-Bin Zhang for their helpful discussion during the early stage of this work. This work is supported by National Natural Science Foundation of China (grants 12261141691 and 12073091).
References
- Alcock & Hatchett (1978) Alcock, C., & Hatchett, S. 1978, ApJ, 222, 456, doi: 10.1086/156159
- Arnaud (1996) Arnaud, K. A. 1996, in Astronomical Society of the Pacific Conference Series, Vol. 101, Astronomical Data Analysis Software and Systems V, ed. G. H. Jacoby & J. Barnes, 17
- Band et al. (1993) Band, D., Matteson, J., Ford, L., et al. 1993, ApJ, 413, 281, doi: 10.1086/172995
- Bissaldi et al. (2022) Bissaldi, E., Omodei, N., Kerr, M., & Fermi-LAT Team. 2022, GRB Coordinates Network, 32637, 1
- Burrows & Swift XRT Team (2004) Burrows, D. N., & Swift XRT Team. 2004, in AAS/High Energy Astrophysics Division, Vol. 8, AAS/High Energy Astrophysics Division #8, 16.03
- Dichiara et al. (2022) Dichiara, S., Gropp, J. D., Kennea, J. A., et al. 2022, GRB Coordinates Network, 32632, 1
- Draine (2003) Draine, B. T. 2003, ApJ, 598, 1026, doi: 10.1086/379123
- Hayakawa (1970) Hayakawa, S. 1970, Progress of Theoretical Physics, 43, 1224, doi: 10.1143/PTP.43.1224
- Hill et al. (2004) Hill, J. E., Burrows, D. N., Nousek, J. A., et al. 2004, in Society of Photo-Optical Instrumentation Engineers (SPIE) Conference Series, Vol. 5165, X-Ray and Gamma-Ray Instrumentation for Astronomy XIII, ed. K. A. Flanagan & O. H. W. Siegmund, 217–231, doi: 10.1117/12.505728
- Holland et al. (2010) Holland, S. T., Sbarufatti, B., Shen, R., et al. 2010, ApJ, 717, 223, doi: 10.1088/0004-637X/717/1/223
- Huang et al. (2022) Huang, Y., Hu, S., Chen, S., et al. 2022, GRB Coordinates Network, 32677, 1
- Klebesadel et al. (1973) Klebesadel, R. W., Strong, I. B., & Olson, R. A. 1973, ApJ, 182, L85, doi: 10.1086/181225
- Kouveliotou et al. (1993) Kouveliotou, C., Meegan, C. A., Fishman, G. J., et al. 1993, ApJ, 413, L101, doi: 10.1086/186969
- Lesage et al. (2022) Lesage, S., Veres, P., Roberts, O. J., et al. 2022, GRB Coordinates Network, 32642, 1
- Lesage et al. (2023) Lesage, S., Veres, P., Briggs, M. S., et al. 2023, ApJ, 952, L42, doi: 10.3847/2041-8213/ace5b4
- Lipunov et al. (2022) Lipunov, V., Kornilov, V., Gorbovskoy, E., et al. 2022, GRB Coordinates Network, 32634, 1
- Liu et al. (2022) Liu, J. C., Zhang, Y. Q., Xiong, S. L., et al. 2022, GRB Coordinates Network, 32751, 1
- Mathis et al. (1977) Mathis, J. S., Rumpl, W., & Nordsieck, K. H. 1977, ApJ, 217, 425, doi: 10.1086/155591
- Mauche & Gorenstein (1986) Mauche, C. W., & Gorenstein, P. 1986, ApJ, 302, 371, doi: 10.1086/163996
- Negro et al. (2023) Negro, M., Di Lalla, N., Omodei, N., et al. 2023, ApJ, 946, L21, doi: 10.3847/2041-8213/acba17
- Overbeck (1965) Overbeck, J. W. 1965, ApJ, 141, 864, doi: 10.1086/148180
- Pintore et al. (2017) Pintore, F., Tiengo, A., Mereghetti, S., et al. 2017, MNRAS, 472, 1465, doi: 10.1093/mnras/stx2062
- Predehl et al. (2000) Predehl, P., Burwitz, V., Paerels, F., & Trümper, J. 2000, A&A, 357, L25
- Rolf (1983) Rolf, D. P. 1983, Nature, 302, 46, doi: 10.1038/302046a0
- Shao & Dai (2007) Shao, L., & Dai, Z. G. 2007, ApJ, 660, 1319, doi: 10.1086/513139
- Shao et al. (2008) Shao, L., Dai, Z. G., & Mirabal, N. 2008, ApJ, 675, 507, doi: 10.1086/527047
- Shen et al. (2009) Shen, R. F., Willingale, R., Kumar, P., O’Brien, P. T., & Evans, P. A. 2009, MNRAS, 393, 598, doi: 10.1111/j.1365-2966.2008.14223.x
- Smith et al. (2002) Smith, R. K., Edgar, R. J., & Shafer, R. A. 2002, ApJ, 581, 562, doi: 10.1086/344151
- Tan et al. (2022) Tan, W. J., Li, C. K., Ge, M. Y., et al. 2022, The Astronomer’s Telegram, 15660, 1
- Tiengo & Mereghetti (2006) Tiengo, A., & Mereghetti, S. 2006, A&A, 449, 203, doi: 10.1051/0004-6361:20054162
- Tiengo et al. (2023) Tiengo, A., Pintore, F., Vaia, B., et al. 2023, ApJ, 946, L30, doi: 10.3847/2041-8213/acc1dc
- Trümper & Schönfelder (1973) Trümper, J., & Schönfelder, V. 1973, A&A, 25, 445
- Vasilopoulos et al. (2023) Vasilopoulos, G., Karavola, D., Stathopoulos, S. I., & Petropoulou, M. 2023, MNRAS, 521, 1590, doi: 10.1093/mnras/stad375
- Vaughan et al. (2004) Vaughan, S., Willingale, R., O’Brien, P. T., et al. 2004, ApJ, 603, L5, doi: 10.1086/382785
- Vaughan et al. (2006) Vaughan, S., Willingale, R., Romano, P., et al. 2006, ApJ, 639, 323, doi: 10.1086/499353
- Veres et al. (2022) Veres, P., Burns, E., Bissaldi, E., et al. 2022, GRB Coordinates Network, 32636, 1
- Vianello et al. (2007) Vianello, G., Tiengo, A., & Mereghetti, S. 2007, A&A, 473, 423, doi: 10.1051/0004-6361:20077968
- Williams et al. (2023) Williams, M. A., Kennea, J. A., Dichiara, S., et al. 2023, ApJ, 946, L24, doi: 10.3847/2041-8213/acbcd1
- Wilms et al. (2000) Wilms, J., Allen, A., & McCray, R. 2000, ApJ, 542, 914, doi: 10.1086/317016
- Zhang et al. (2009) Zhang, B., Zhang, B.-B., Virgili, F. J., et al. 2009, ApJ, 703, 1696, doi: 10.1088/0004-637X/703/2/1696
- Zhao & Shao (2014) Zhao, Y.-N., & Shao, L. 2014, ApJ, 789, 74, doi: 10.1088/0004-637X/789/1/74