Designing a Data Science simulation
with : A Primer
Abstract
Simulations play a crucial role in the modern scientific process. Yet despite (or due to) their ubiquity, the Data Science community shares neither a comprehensive definition for a “high-quality” study nor a consolidated guide to designing one. Inspired by the Predictability-Computability-Stability (PCS) framework for ‘veridical’ Data Science, we propose six that a Data Science simulation should satisfy. odularity and fficiency support the Computability of a study, encouraging clean and flexible implementation. ealism and tability address the conceptualization of the research problem: How well does a study Predict reality, such that its conclusions generalize to new data/contexts? Finally, ntuitiveness and ransparency encourage good communication and trustworthiness of study design and results. Drawing an analogy between simulation and cooking, we moreover offer (a) a conceptual framework for thinking about the anatomy of a simulation ‘recipe’; (b) a baker’s dozen in guidelines to aid the Data Science practitioner in designing one; and (c) a case study deconstructing a simulation through the lens of our framework to demonstrate its practical utility. By contributing this “PCS primer” for high-quality Data Science simulation, we seek to distill and enrich the best practices of simulation across disciplines into a cohesive recipe for trustworthy, veridical Data Science.
Keywords: simulation design, PCS framework, veridical Data Science, trustworthy AI
1 Introduction: Why simulate in Data Science?
Simulations play a crucial role in modern Data Science research. Sensible designs can facilitate the scientific process by offering a realistic training ground for researchers to (a) sound out hypotheses to identify those worth pursuing; (b) stress-test fledgling theories in contexts where they might fail; and (c) emulate a natural system under specific or rare conditions. Relative to other avenues of scientific exploration (e.g., empirical investigation, inductive reasoning), simulations offer three main advantages: a streamlined simulacrum of reality, unfettered control of experimental conditions, and the ability to explore scenarios that are difficult to observe empirically.
Computing advancements have allowed researchers to interrogate scientific hypotheses faster than we can validate them either logically or empirically. For example, simulations support methodological stress-testing (Suzuki & Nei, 2002; Maas & Hox, 2004; Strasburg & Riesbery, 2010; Chen et al., 2014; Yu & Yao, 2017) and clinical-trial design (Holford et al., 2000, 2010; Bonate, 2000; Girard, 2005; Orloff et al., 2009; Meurer et al., 2012): Rather than relying on inductive or mathematical reasoning alone to identify a method’s limitations, or the most actionable/efficient trial designs, we can simulate various realistic scenarios and observe the results directly. Computational experiments often remain tenable even when an analytical approach is intractable or requires unrealistic assumptions. Moreover, their efficiency – magnified by parallel computing – allows us to develop a nuanced understanding of the study system by exploring many plausible scenarios in reasonable time.
Beyond mere speed, simulation affords precise control over experimental conditions. Suppose we wish to compare the performance of two (or more) analytical techniques (Suzuki & Nei, 2002; Chen et al., 2014; Yu & Yao, 2017; Haller et al., 2019; Kolgatin et al., 2022). Drawing a valid conclusion requires that the performance metrics be comparable between competing methods and that neither method receive an undue advantage. By performing identical tests in identical computing environments, we limit human error and bias. Such control over experimental conditions in silico also allows us to ‘experience’ circumstances that are difficult to observe empirically. This feature benefits the study of models for rare events: genetic mutations, for example, or natural disasters (Hartmann, 2002; El-Gheriani et al., 2017; Webber et al., 2019). Data describing such systems are inherently scant, such that we risk over-fitting if we build models using (one type of) real-world data alone. We can mitigate this risk by augmenting our data with realistically generated synthetic data.
Data scientists across many disciplines try to exploit computation to further scientific progress, to the point that Donoho (2024) credits a rapid acceleration in Data Science to reduced ‘friction’ in sharing data, code, and competitive challenges. But speed is advantageous only when accompanied by careful study design to ensure that conclusions are well founded and trustworthy. Despite (or perhaps due to) the ubiquity of simulation studies in modern research, the Data Science community collectively shares neither agreed criteria for a “high-quality” study nor a consolidated guide to designing one. Instead, neophyte data scientists learn design practices ad hoc by word of mouth or by trial and error. Such scattershot learning is fallible (because novices may not stumble onto the best practices without concerted guidance) and inefficient (because they learn fitfully). We seek to raise the baseline of simulation quality, and facilitate meeting it, by distilling and enriching the best practices of simulation across disciplines into a recipe for trustworthy Data Science.
A review of related research (Section 6) reveals no unified framework for conceptualizing, designing, and appraising simulation studies. The Predictability-Computability-Stability (PCS) framework for veridical (loosely, ‘truthful’) Data Science (Yu & Kumbier, 2020), our parent work, offers the eponymous three pillars of Data Science and encourages strong connections between simulation and reality (conceptualization), but wants tangible guidance for study design. Other groups advocate narrowly for one or two specific quality criteria (appraisal), such as algorithmic accountability/interpretability or computational reproducibility (Rule et al., 2019; Krafczyk et al., 2021). Existing design guidelines vary widely in breadth and scale, even within individual manuscripts. These contributions aggregate to hint at a unifying simulation paradigm but do not articulate it, and none of the closest analogues has won widespread acceptance in the field.
To fill this niche, we offer the following “PCS primer” for high-quality Data Science simulation. We illustrate our design philosophy using analogies to a widely relatable theme: the preparation and consumption of food. The remainder of this manuscript describes the anatomy of a simulation plan, akin to the four components of a recipe (Section 2); proposes six criteria for a high-quality simulation (Section 3); and articulates thirteen guidelines to aid data scientists in designing one (Section 4). Section 5 unites these elements in dissecting a simulation study through the lens of our primer.111See Appendices A (sequel case study) and B (non-methodological study) for additional examples. We conclude by connecting our primer to competing and/or complementary antecedents (Section 6).
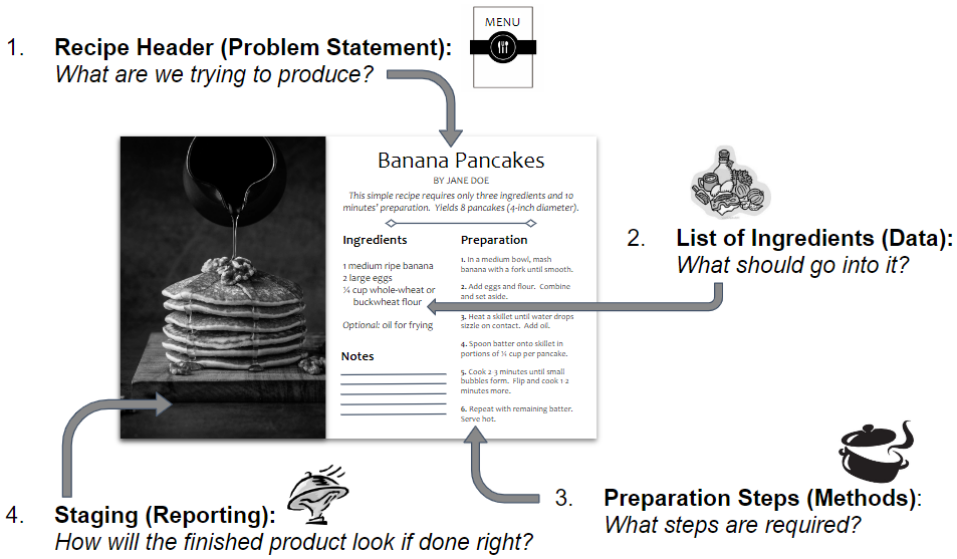
2 Four components of a simulation recipe
A simulation plan comprises four broad components: the problem statement, data, methods, and reporting (Figure 1). For transparency and rigor, all four components should be planned and documented at the project outset; in practice, a study may evolve in response to new information, but such evolution likewise should be recorded. If we document our study successfully, then another data scientist should be able to replicate our work to arrive at analogous results. In these ways, as well as in the parts themselves (to follow), the motivation and anatomy of simulation documentation resemble those of a recipe as found in an idealized cookbook. Just as a detailed recipe ought to capture the full plan for preparing a dish, so should the project documentation comprise the full plan for a simulation study:
-
A.
Recipe Header (Problem Statement): What are we trying to produce?
Our problem statement resembles a recipe header, which gives an overview and description of the dish. It specifies our motivation and trajectory. (Section 4.1) -
B.
List of Ingredients (Data): What should go into it?
Data (and/or data-generating processes) comprise the ingredients of our simulation study. These are the elements on which we act, whose quality and appropriateness for the intended dish influence the caliber of our final product. (Section 4.2) -
C.
Preparation Steps (Methods): What steps are required?
Study methods constitute our preparation techniques for the intended dish. Much as a recipe dictates both equipment and cooking specifications (e.g., techniques, times, temperatures), so does our study methodology encompass models, computational parameters, and evaluation metrics alike. Our choices must suit the ingredients, intended product, and prior knowledge of the (culinary or scientific) field. (Section 4.3) -
D.
Staging (Reporting): How will the finished product look if done right?
Communicating results is analogous to staging a dish. Presentations may comprehend visual, qualitative, and/or quantitative summaries, depending on the audience, but should enhance rather than detract from the experience of consuming our product. Reporting also includes consolidating materials for reproducing the work, akin to a chef annotating a recipe to make it easier or better for next time. (Section 4.4)
Although the purpose and components of our plans are similar between the culinary and statistical sciences, an important distinction persists: In cooking, often we work from a pre-existing recipe. By contrast, the first step in conducting a simulation study often is to write our own recipe. To that end, Section 3 proposes six desiderata (Table 1) to strive for in designing a simulation, and Section 4 offers thirteen guidelines (Table 2) for succeeding.
3 Flavor of a high-quality simulation: Six
The term “simulation study” applies to many and diverse computational experiments, but these endeavors often share common design elements and may be judged by similar quality standards. We move that a study should exhibit the following minimal , detailed in Table 1: odularity, fficiency, ealism, ntuitiveness, ransparency, and tability.
| Merit | Definition | Guidelines |
|---|---|---|
| odular | Written in self-contained and logically partitioned code segments to ease interpretation, auditing, and adaptation to new settings. Modules (e.g., data generation, model fitting) are exchangeable with minimal revision to the analysis pipeline. | i, viii |
| fficient | Streamlined computationally and conceptually. Simulations are scalable, minimizing run-times over sufficient replicates without loss of functionality. Designs are judicious in varying parameters222To afford a comprehensive view of the problem space, without “boiling the ocean.” and accounting for pre-existing work.333Incorporating benchmarks for comparing across studies, without burdensome redundancies. | i, iv, ix |
| ealistic | Faithful to the physical world, as best understood from established theory and real-world data. Simplifications required for study comprehension and tractability nonetheless preserve the relevance of simulation results to reality.444In particular, designs accommodate realistic sources of randomness (e.g., sampling, subject heterogeneity, missing data, measurement error) and other practical limitations inherent to the data/model. | i, iii, iv, vi, x |
| ntuitive | Sensible to the intended audience and, in a general sense, to a reasonably comprehensive readership.555This standard applies to all research products (e.g., simulation architecture, documentation, analysis). Although models seeking to capture real-world complexities might be abstruse, a resourceful layperson can identify the study assumptions, parse its logical flow, and gauge the soundness of its conclusions. | i, ii, v, ix, xi |
| ransparent | Documented thoroughly and candidly. Records provide all information needed to conduct or assess the simulation study, including the rationale for any human judgement calls, study strengths and limitations, and key takeaways. | i, ii, iii, vii, viii, xi, xii, xiii |
| table | Reproducible/replicable666Ideally the data scientist publishes materials to re-execute (reproduce) a study, but at least documents all details pertinent to re-creating (replicating) the work (Barba, 2018; NASEM, 2020). and externally valid. Conclusions are reasonably consistent across executions, random seeds, users, computers, and sensible perturbations to the analysis pipeline (e.g., human decisions in data cleaning). | i, v, vi, vii, x, xii, xiii |
| 2To afford a comprehensive view of the problem space, without “boiling the ocean.” | ||
| 3Incorporating benchmarks for comparing across studies, without burdensome redundancies. | ||
| 4In particular, designs accommodate realistic sources of randomness (e.g., sampling, subject heterogeneity, missing data, measurement error) and other practical limitations inherent to the data/model. | ||
| 5This standard applies to all research products (e.g., simulation architecture, documentation, analysis). | ||
| 6Ideally the data scientist publishes materials to re-execute (reproduce) a study, but at least documents all details pertinent to re-creating (replicating) the work (Barba, 2018; NASEM, 2020). | ||
These resonate strongly with the aforementioned PCS framework (Yu & Kumbier, 2020). Modularity and Efficiency support the Computability of a study, encouraging clean and flexible implementation of simulations designed for tractability and scalability. Realism and Stability encourage faithful translation between real-world research problems and the mathematical constructs employed in silico: How well does a simulation Predict reality, such that its conclusions generalize to new data/contexts? Results that are Stable across perturbations to the data, models, and even human decisions are more likely to coincide with reality. Finally, we encourage Intuitiveness and Transparency (auxiliary to the PCS acronym, but recommended under the “PCS documentation” standard) for clear and trustworthy communication of study designs and results to the research community.
These principles quietly underpin many high-quality simulation studies. Yet even unassailable virtues can be difficult to uphold without tangible guidance for achieving them. We therefore follow with a “baker’s dozen” of specific guidelines (Section 4, summarized in Table 2) for raising the baseline quality of Data Science simulation studies.
4 Guidelines for designing a study with
Thirteen guidelines follow for cooking up a simulation study with . This “baker’s dozen” includes one overarching precept, and three guidelines for each of the four study-recipe components. Each component-specific guideline promotes two foremost, but all six desiderata should inform the entire design process.
-
i.
Plan and document in advance all feasible simulation specifications and contingencies (e.g., architecture, data, mathematical machinery, sources of randomness).
This first precept most nearly summarizes our simulation design philosophy. As any amateur chef knows, the key to quick-and-easy recipe execution is to know the forthcoming procedure and perform as much preparatory work as possible in advance of the cooking itself. We call this process the mise en place (roughly, “putting in position”). It entails reading the recipe thoroughly; assembling the necessary equipment; and priming the ingredients (rinsing, defrosting, chopping, measuring). It means having all elements “cooking-ready” to reduce the number of moving parts and risk of critical mistakes in the final execution. If the procedure includes a tricky step, we might plan a contingency should our first attempt fail. The time we lose in planning and preparing, we recoup from the seamless, less-stressful cooking process. We also reduce the probability of having nothing to eat at the end.
This philosophy extends naturally to the simulation context, in which we anticipate and prepare for all facets of our study. We first plan our study ‘recipe,’ documenting not just the obvious statistical particulars (data-generating processes, models, and evaluation metrics) but also computational specifications (code architecture and libraries, number of replications, random seeds or procedure for choosing them, parallelization strategies, data storage and access, server connectivity, etc.), and ensuring that all are “simulation-ready” prior to implementation. We should moreover try to anticipate hiccups and plan contingencies: For example, if a model fails to converge, do we record a failure or re-fit the model with a different algorithm? By anticipating these particulars, we minimize ad hoc decisions during implementation and, by extension, the risk of bias or error. Such deliberate forethought also helps in designing a study that boasts all of our desired .
| Overall | ||
| i | Plan and document in advance all feasible simulation specifications and contingencies. | |
| Recipe Header (Problem Statement) | ||
| ii | Describe as concretely as possible the research question(s) your study seeks to answer. | ransparent, ntuitive |
| iii | Connect your study to reality, while acknowledging its limitations honestly. | ealistic, ransparent |
| iv | Recognize and accommodate the wider research context for your study (e.g., domain knowledge or body of literature). | fficient, ealistic |
| List of Ingredients (Data) | ||
| v | Test methods in a (data) context as reminiscent as possible of their intended deployment. | ntuitive, table |
| vi | Incorporate real-world data and/or accepted scientific theory in generating synthetic datasets. | ealistic, table |
| vii | Sample data repeatedly under multiple data-generating processes, especially those that illustrate your methods’ shortcomings. | table, ransparent |
| Preparation Steps (Methods) | ||
| viii | Outline intended modeling procedure(s), including computational specifications as well as model forms and parameters. | ransparent, odular |
| ix | Include both commonly used methods and state-of-the-art competitors as comparative baselines. | ntuitive, fficient |
| x | Select multiple performance metrics appropriate to the methods under comparison and their intended deployment. | table, ealistic |
| Staging (Reporting) | ||
| xi | Keep displays – whether visual or textual – as simple, transparent, and digestible as possible for your intended audience. | ntuitive, ransparent |
| xii | Employ a diverse set of statistical summaries and visualizations to offer concrete evidence from multiple perspectives. | table, ransparent |
| xiii | Do not mislead your audience, nor draw conclusions beyond the scope of your study’s evidential support. | ransparent, table |
4.1 Recipe Header (Problem Statement)
A recipe’s header specifies its goal and outlook: respectively, (a) the identity and provenance of the intended dish – for example, “Grandma’s apple pie” – and (b) expected yield and time to completion. These same elements comprise a research problem statement, which describes (a) the study goals, with relevant context or motivating antecedents, and (b) the expected results, otherwise known as research hypotheses. In both settings, these elements drive the project; articulating them is perhaps the most-crucial phase of planning.
-
ii.
Describe as concretely as possible the research question(s) your study seeks to answer. [ransparent, ntuitive]
Both chef and data scientist need a clear vision of their project goals to plan a successful approach. In cooking, the intended dish dictates the choice of recipe and any impromptu decisions the chef makes in its pursuit. Likewise, the problem statement drives a study and governs all decisions in its design and implementation. Obeying guideline (i) helps minimize ad hoc decision-making, but we cannot foresee every contingency, and scientific progress requires a feedback loop between simulation (or theory) and empirical investigation; a research agenda at times must evolve in response to new information. Thus, in either setting, we must define our goals upfront [] in as precise and intelligible a manner as possible [], to ensure that the endeavor stays true to its motive and sensible to its audience.
-
iii.
Connect your study to reality, while acknowledging its limitations honestly. [ealistic, ransparent]
One potential source of satisfaction in cooking and eating a meal stems from the communal knowledge and traditions that went into its creation, which promote a sense of cultural connection. Likewise, an effective simulation gains relevance by connecting to a broader context. Even simulations seeking evidence for a statistical theorem often are inspired by real-world problems or data. Understanding such a study’s motivation and impact requires some appreciation of the underlying domain problem; accordingly, the problem statement should draw connections between the technical project aims and the target of study [].
Often computational experiments must work with simplifications of the complex real-world phenomena they seek to describe, either for tractability or because (by the nature of research) we understand the target system imperfectly. But a study’s conclusions are only as actionable as they are realistic. A study founded on implausible assumptions is at best irrelevant, and at worst, actively dangerous, if it promotes a misleading view of the world. We should therefore assess and articulate upfront any limitations on interpreting our simulation results with respect to the empirical world []. Our resource constraints and imperfect knowledge might preclude solving every limitation, but reporting known imperfections aids our audience in grasping the scope and external validity of our conclusions.
-
iv.
Recognize and accommodate the wider research context for your study (e.g., domain knowledge or body of literature). [fficient, ealistic]
Seldom is there one ‘correct’ way to prepare a dish or approach a research question. Supposing we eliminate the flawed strategies, our choice among viable options often boils down to perspective or context. Moreover, just as multiple dishes comprise a meal, so each simulation study contributes incrementally to communal knowledge: We should design simulation studies with a holistic awareness of the existing literature, ensuring comparability with preceding studies while avoiding cumbersome redundancies [] – akin to a chef designing new courses to complement an existing menu. We require not only a thorough understanding of our own goals, but also of our antecedents: How have our predecessors undertaken similar tasks? How did they succeed or fail, what did we learn from their experiences, and how does our endeavor complement or improve upon its precursors? Of course, maintaining the fidelity of our study to the project goals and to reality is paramount: If obeying precedent would mean using an unsuitable (e.g., unrealistic, unreliable, or otherwise misleading) method, then we should defy convention in the interest of reliable conclusions [].
A simulation study’s problem statement is its foundation, and articulating it is perhaps the most critical phase of planning. We must communicate clearly and candidly the choices we make and our justification, to support reproducibility/replicability and external validity [] and comprehension [] – but especially for transparency []. If we are not comfortable preparing our dish in front of the diner, then we ought not feel comfortable in serving it.
4.2 List of Ingredients (Data)
In cooking, the quality of our ingredients informs the taste and texture of our final dish, with subpar inputs generally affording subpar outputs. Ingredient quality in turn depends on the manner of their growth and harvesting; handling in transit; and freshness upon arrival. This view extends naturally to the raw ingredients of simulation: the data or data-generating processes (DGPs). The caliber of our conclusions depends on the fidelity of our data to the target of study (hence the computing adage, “garbage in, garbage out”). Such fidelity in turn depends on the manner of their selection and collection (growth and harvest); credibility of cleaning and partitioning processes (handling); and relevance to the target system (freshness). We favor organic ingredients – data close to nature – over canned ingredients like the so-called “toy” examples often chosen for ease of simulation.
-
v.
Test methods in a (data) context as reminiscent as possible of their intended deployment. [ntuitive, table]
The data we use to assess or refine a method should resemble the data on which we will deploy it []: Although we can steam either of white or brown rice on a stove-top, the two ingredients require different procedures (ratios of water to rice, cooking times and intensities) to achieve comparable consistencies. Likewise, methods intended for applications with small sample sizes or low signal-to-noise ratios (e.g., in many clinical or genomics contexts) should not be studied solely on data with ample observations and strong signals; methods intended for continuous data might err when applied to count data. Our confidence in a method can be only as strong as our confidence in the relevance of data used to assess it. By extension, if we wish to deploy an existing technique in a new context (as often is the case with statistical tools), we must understand how the new setting defies or admits of our existing knowledge of the technique []. A method might accommodate multiple contexts or types of data, but its appropriateness should be considered before being used “off label.” And if we hope the method will apply in many settings, then our study should encompass many types of data to demonstrate this capability.
-
vi.
Incorporate real-world data and/or accepted scientific theory in generating synthetic datasets. [ealistic, table]
Refining a technique requires repetition and practice. In cooking, we might hone our skills by practicing on simple or subpar ingredients, reserving our best specimens for preparing a dish in earnest. Still, our practice ingredients must be prime enough that our perfected technique works in actuality. In Data Science, we can think of real-world data as our “best specimens” and of synthetic data as our practice ingredients. We assess models using synthetic data with a known ‘truth’ baked in for the methods to discern; we then deploy our preferred model(s) on real-world data. Our confidence in the realism [] and generalizability [] of a model requires that our synthetic data “resemble” real-world data.777Canned ingredients offer convenience and reliability, and toy examples are not without virtue. The conventional repertoire of “canned” DGPs (e.g., Gaussian data with independent errors) offers a benchmark for comparing across studies and thus for assessing the relative performance of methods. But for external validity, we recommend supplementing conventional DGPs with ‘natural’ DGPs that emulate reality. We therefore recommend heightening their resemblance by incorporating real-world data into the generation of simulated datasets and using predictability checks (per the PCS framework) to assess the quality of simulated features. For example, we might generate synthetic phenotypes (e.g., disease incidence) using linear combinations of empirical gene-expression features, injected with a reasonable magnitude of random error. We incorporate real-world complexities (gene correlation structure) that might affect model performance – approaching our practice ingredients to the real ones – to prevent unforeseen complications or misleading results when deploying the method in earnest. Incorporating such complexities through sampling allows us to learn from the data structure without quantifying it.
-
vii.
Sample data repeatedly (using distinct random seeds) under multiple DGPs, especially those that illustrate your methods’ shortcomings. [table, ransparent]
Different cooking techniques suit different ingredients, and the best dishes arise from knowing the strengths and weaknesses of each pairing. Similarly, gaining a robust understanding of a statistical method requires exploring its performance in a variety of realistic contexts. To that end, DGPs should be varied (e.g., across sample sizes, parameter values, distributions of randomness888Note the governing role of the problem statement: These and other variations may be more or less pertinent to one’s research agenda and their inclusion or omission should be justified upfront.) and should include scenarios that might prove unflattering to the methods under consideration. We also recommend repeating the data-generation process – and indeed, the entire experiment – under various random seeds to mitigate the role of luck and assess the stability of results across reasonable perturbations. This diversification of DGPs not only encourages a well-rounded view of each individual method [], but also allows researchers to compare methods (within and across studies) without fear that the data were cherry-picked to support a particular conclusion.
We recognize some tension between the goal of exploring the problem space adequately and that of creating an efficient study design. We encourage prioritizing DGPs that might clarify a method’s limitations [], such as those that manifest a low signal or violate the model assumptions. Exploring scenarios that might tax or even break a method allows us to recognize and accommodate its restrictions. This knowledge allows us to adapt more readily to minor quirks in our data, loosely akin to a chef’s ability to substitute for an out-of-season ingredient while preserving the integrity of the final dish. And while the individual researcher undoubtedly benefits from a better understanding of a method’s capabilities, our communal knowledge benefits even more from the dissemination of such knowledge, because we lose less time relearning redundant lessons and instead can focus our energies on developing or refining methods to fill the gaps.
In Data Science as in cooking, the quality of our ingredients informs the quality of our results. Choices of DGPs depend on the study goals and audience [], but should efficiently [] (a) incorporate real-world complexities to ensure the relevance of our study to reality [] and (b) explore various scenarios [], especially those challenging to a method [], to ensure a robust understanding of its capabilities []. Only with a thorough understanding of the interplay between techniques and ingredients can we create the finest products.
4.3 Preparation Steps (Methods)
A chef’s training provides a repertoire of cooking techniques for use as needed for a particular dish. Analogously, the data scientist’s metaphorical toolbox contains various methods for use as needed to answer a particular research question. We choose and justify our methods upfront to suit both the intended dish (research question) and ingredients (data).
-
viii.
Outline intended modeling procedure(s), including computational specifications as well as model forms and parameters. [ransparent, odular]
Just as the target dish dictates a chef’s choice of equipment and techniques, so should the problem statement govern a data scientist’s choice of methodology. These details include statistical paraphernalia – model forms and parameters – but also the analytical pipeline as a whole and its implementation: code structure and dependencies; strategies for random-number generation and parallelization; and comparison metrics by simulation replicate (e.g., incidence of declaring success in a simulated trial) and overall (e.g., trial power or Type I error). Such decisions must suit our ingredients and vice versa. Code should be well documented and logically partitioned such that we can add or exchange methods (or DGPs) without revamping the entire pipeline []. Such modular construction allows a study to be adapted (e.g., to new data, or to compare against untried methods), thereby improving its longevity and usefulness to the field.
Planning these particulars upfront minimizes inadvertent biases in our study conclusions and (recalling the mise en place) mitigates chaos in implementation. Planning our method variations in advance also allows us to think about the overall scope of the design, to address the most-crucial considerations while keeping the overall the simulation study manageable. Insofar as we cannot anticipate all study contingencies, we record any post hoc decisions made in the execution phase for transparency and to avoid similar oversights in future [].
-
ix.
Include both commonly used methods and state-of-the-art competitors as comparative baselines. [ntuitive, fficient]
Propagating a new technique means persuading potential users that its benefits justify the time and effort required to adopt it. To that end, simulation studies should include both conventional and cutting-edge techniques as comparative baselines so that readers can interpret the results relative to familiar methods as well as industry standards []. Such intellectual footholds help the audience digest the study, rendering it less alienating and boosting readers’ confidence its quality and fairness. But precedent alone does not justify including a method. No chef would intentionally use a blunt knife if a sharp one were available – and if one method has been shown uniformly worse than another, then comparing against the inferior procedure merely adds unnecessary bulk to both our code and our results table []. We therefore recommend excluding methods known to be flawed,999We can also comprehend the ‘flaw’ of a method not yet implemented, as practitioners tend to gravitate to methods with existing software/repositories. both to avoid the paper-tiger fallacy of comparing against a trivially easy opponent and to save wading through cumbersome tables of results.
-
x.
Select multiple performance metrics appropriate to the methods under comparison and their intended deployment. [table, ealistic]
Evaluating a prepared dish is a holistic process, incorporating simultaneous judgements of texture, taste, and aesthetics. It moreover depends on context, including the dish’s function (appetizer, main course, or dessert) and the setting (fast-food joint or fancy restaurant). Similarly, in Data Science, we recommend evaluating models using multiple metrics (e.g., mean squared error versus mean absolute error) across multiple dimensions (e.g., computational efficiency as well as fit). Diversifying our evaluation metrics affords a multifaceted understanding of a method’s strengths and weaknesses, much as varying our DGPs highlights its suitability to different applications []. As always, our choices should reflect the study goals and the reality of how our methods will be deployed in practice []. For example, we can contrast the prediction accuracy of a linear model and “black-box” predictive algorithm, while comparing the internal structure of the two models is difficult if not impossible. If practitioners care about prediction but not interpretability or model complexity, then our inability to compare models on the latter dimensions is admissible.
A similar logic governs choosing a study’s ‘equipment’ as its ‘ingredients’. We wish to mitigate bias and afford actionable, reliable results [, ]. We favor efficient simulations that minimize bloated code (for ease of preparation) [] and results (for ease of digestion) [] while exploiting reliable antecedents []. The goals delineated in our problem statement inform our choices of models to fit and performance metrics to evaluate, among other simulation specifications, all of which we report upfront in the project documentation [].
4.4 Staging (Reporting)
Staging a dish is the most subjective phase of its preparation, in that different diners (or food critics!) have different aesthetic tastes, and thus may diverge in whether and how they welcome a given culinary presentation. The “best” method of communicating simulation results depends similarly on the background and perspective of the intended audience.
-
xi.
Keep displays – whether visual or textual – as simple, transparent, and digestible as possible for your intended audience. [ntuitive, ransparent]
The staging of a finished entrée should enhance rather than detract from its enjoyment, adding to the dish’s visual appeal without damaging its taste, texture, or ease of consumption. In Data Science, the same credo argues for presenting results in a digestible format, from which readers can draw accurate conclusions comfortably []. Ideally we present results in a manner intelligible to a broad audience, and some principles are suitably ubiquitous: employing italic or bold text sparingly for emphasis and to guide the reader’s eye over tables and figures; choosing reasonable color palettes for visualizations; balancing mathematical notation against written explanations; and interpreting results candidly and concisely []. However, different readers may consider different presentations to be the pinnacle of “simple, transparent, and digestible” – much as the patron of a family restaurant might prefer a staging more approachable and less artistic than a food critic at an upscale establishment. We should prioritize our target audience deciding, for example, the balance between visual and tabular presentations; how much supplementary information or interpretation to include; and the appropriate level of literary formality.
-
xii.
Employ a diverse set of statistical summaries and visualizations to offer concrete evidence from multiple perspectives. [table, ransparent]
An epicure experiences an entrée using multiple senses (sight, smell, taste, possibly touch). Engaging with the subtleties of a complex simulation study requires a similar versatility of approach. Likely no single table or figure captures all pertinent information elegantly, especially if we have explored a variety of DGPs, methods, and performance metrics as per the preceding guidelines. A method’s character (good, bad, or mixed) may become clear only across multiple vantage points suited to different modes of communication. And as just discussed, different audience members may learn best from different presentations of results. Thus, providing multiple perspectives affords the most-robust understanding to the most-comprehensive audience, while also preventing the cherry-picking of results that flatter any one particular method []. We recommend providing a judicious handful of summaries and graphics: varied enough to appeal to a broad audience and to provide a nuanced picture of the study results [], but few enough to avoid inundating readers.
-
xiii.
Do not mislead your audience, nor draw conclusions beyond the scope of your study’s evidential support. [ransparent, table]
Just as peers in a culinary school might compare and critique one another’s dishes, so do data scientists learn from one another’s work – the mishaps as well as the successes. To that end, we should represent each method’s capabilities fully and accurately, not excepting the scenarios under which it falls short, in the interest of both intellectual honesty and community growth []. Figures should adopt reasonable and appropriate axis scales and include error bars when possible; written summaries should report results frankly, without hyperbole or dissembling. Authors’ discussions should rate their confidence in and external validity of conclusions based on such factors as the perturbations explored, number of replicates executed, and stability of results across variations or random seeds []. Overstating or skewing one’s results undermines readers’ confidence in the work, suggesting that the responsible parties either did not perform a sufficiently rigorous study or else distorted the outcome intentionally – and without the audience’s confidence, one’s legacy (whether in the statistical or the culinary sciences) must be destined for the rubbish bin.
We offer fairly broad recommendations for staging the results of a simulation study because such decisions depend on the nature of the investigation and of the target audience. Regardless of the chosen format(s), we encourage clarity [] and transparency [] in communication, so that reliable and actionable new knowledge [] reaches the widest possible audience in a format easily digested and disseminated.
4.5 Coda: Tasting as we go (execution and iteration)
Herein we argue for thorough planning prior to implementation. Nonetheless, we recognize that executing a high-quality simulation study, like preparing a superlative entrée, requires learning from experience. A study with fully predictable results is superfluous. We therefore acknowledge an implied sequel to planning the simulation recipe, in which the data scientist (a) executes the study and (b) responds to its results, perhaps by refining the original recipe or designing further experiments. Because the nature of a study’s evolution depends on its context and history, herein we do not dwell on these stages except to note that the of a high-quality simulation should guide study revision as well as design. Moreover, its evolution should align with the original problem statement (like tweaking a recipe to improve the dish) rather than shifting the target to accommodate the study’s shortcomings. Most importantly, the study record should justify any ad hoc decisions, for both reproducibility and context in interpreting the results.
5 A page from our cookbook: Case Study
Having introduced our PCS primer, we now consolidate and illustrate these ideas by dissecting an existing methodological simulation study.101010Appendix B presents an analogous autopsy of a non-methodological, Social Science simulation study. Basu et al. (2018) introduced the iterative random forest (iRF) algorithm for discovering epistatic interactions driving gene expression in high-dimensional, labelled omics data. Development relied extensively on simulations to distinguish settings in which the method performed well or poorly, and to compare against other methods. Algorithm performance included computational efficiency as well as the validity of higher-order interactions discovered from both synthetic and real-world (ChIP-seq) data. The authors planned the study upfront (per guideline i), from goals and scope to consequent choices of data (generation), methods, and research products.
Recipe Components
-
A.
Recipe Header (Problem Statement): What are we trying to produce?
Basu et al. (2018) sought to evaluate iRF in settings representative of its intended omics applications (guideline ii), comparing against existing methods in terms of computational efficiency and capacity to detect interactions. The authors describe the general problem of interaction discovery and its empirical relevance to understanding enhancer activity or alternative splicing from ChIP-seq data; they acknowledge that validating computational ‘discoveries’ is difficult due to a dearth of physical evidence of higher-order interactions (guideline iii). The paper describes existing methods and compares the performance of iRF against two of these (guideline iv). -
B.
List of Ingredients (Data): What should go into it?
The iRF simulation study employed feature matrices built from either real-world ChIP-seq data or synthetic data designed to emulate genome dynamics (guideline vi). Responses were derived from these feature matrices using Boolean functions applied to thresholded levels of individual features, an approach later dubbed the Local Spiky Sparse (LSS) model and employed in a sequel study (Behr et al. 2022, Appendix A). This functional form reflects two key properties of interactions regulating genomic activity. First, thresholding dynamics – wherein cells behave differently when inputs exceed specific levels – are thought to be responsible for producing differentiated cellular contexts required for development and function (Wolpert, 1969). Second, collections of regulatory elements are known to interact in biological complexes and/or through cooperative or competitive binding (as reviewed in Spitz & Furlong 2012). The Boolean rules used in the iRF study succinctly unite these thresholding dynamics over combinatorial sets of input features. Simulations on ChIP-seq data resemble the intended usage of iRF for biological discovery (guideline v). For synthetic datasets, the authors generated these feature matrices with various properties (e.g., feature correlation, number of features, mixture distributions across features) to assess their effects on method performance (guideline vii). -
C.
Preparation Steps (Methods): What steps are required?
The primary method under consideration for this project was, of course, iRF itself. This method builds on both random forests and random intersection trees; it employs the conventional tuning parameters for those two methods, as well as a parameter for the number of iterations, , for the iterative random forest. Simulations compared iRF against the conventional random forest and state-of-the-art alternative Rulefit 3 (guideline ix). The full iRF algorithm, antecedents, competitors, and implementation are described in Basu et al. (2018) (guideline viii). Algorithm performance was evaluated in terms of computational efficiency and across three perspectives on interaction discovery: ranking quality, true positive rate, and false positive rate (guideline x). -
D.
Staging (Reporting): How will the finished product look if done right?
The authors reported the results of their iRF study using a combination of narrative text; flow-charts describing the algorithmic procedure; line graphs of precision-recall curves under different numbers of iterations, ; scatterplots of ‘stability’ (quality) scores generated by iRF for discovered interactions; and surface plots and heat plots of coincident biomarker expression (guideline xii). For each simulation, they provide a consistent set of summary figures to support comparisons across data settings (guideline xi). For reproducibility and transparency, the authors provided all datasets in the paper’s Supporting Information and published all code, documentation, and data publicly on the research-sharing service, Zenodo (guideline xiii).
and Shortfalls
-
•
odular: The authors of the iRF study composed their response models from simple Boolean (AND, OR, XOR) rules that could be applied to any data matrix, thereby allowing the same model to operate on both simulated and real-world datasets. They further wrote the modeling code flexibly to accommodate different strengths of feature interaction, types of response, and choices of response threshold. Thus, they were able to recycle the code architecture to evaluate their methods under these various data settings. The response models did not allow for facile composition of individual AND, OR, and XOR rules into more-complex modeling rules, but the authors implemented this extension in a follow-up paper (Kumbier et al., 2023).
-
•
fficient: The authors considered a range of data settings to emulate real-world complications, including correlated features, variables outnumbering observations, low signal-to-noise ratios, and observation-dependent noise. The final study comprised one simulation examining each of these complications (a divide-and-conquer format) for clarity and computational efficiency. The efficiency of iRF itself was limited by its reliance on the R package randomForest, but the authors later updated iRF to work with an optimized random forest algorithm available from the package ranger.
-
•
ealistic: The authors developed iRF to discover biomolecular interactions in omics data. To understand the performance of iRF in this setting, they (a) generated response values from Boolean-type rules intended to reflect biological stereo-specificity; (b) evaluated the performance of iRF using real-world ChIP-seq data; and (c) evaluated iRF under a range of common data complications (see previous bullet).
-
•
ntuitive: For clarity of scope, the authors adopted a divide-and-conquer format comprising several simulations, each devoted to a specific data context. In choosing parameters, they sought to evaluate a wide enough range of settings to afford a robust view of method performance while keeping results concise for clear interpretation. The authors considered three performance metrics to quantify different facets of “successful interaction recovery”: recovery (i.e., recall) rate; false-positive rate; and area under the ROC curve, with recovered interactions ranked by stability score. Although tastes might vary, the authors deliberately chose to present a holistic picture of performance rather than trying to define a singular performance metric.
-
•
ransparent: The authors published all simulation code and data on the research-sharing service, Zenodo. They documented the code thoroughly to aid future users in understanding its purpose and operations. They did not provide the simulations as integrated/dynamic documents (in Jupyter or R markdown), but described the study procedure in the publication and provided the code separately.
-
•
table: To support future users of iRF, the authors provide an implementation of the algorithm as an R package, iRF. They employed this implementation under a wide range of response models, parameters, and feature matrices to evaluate the stability of iRF performance across many settings. For reproducibility, they set and recorded random seeds for consistent random-number generation, and performed the simulations on multiple operating systems to ensure stability across computing platforms.
6 Simulation culture: Connections to the literature
Various researchers have advised the Data Science community on aspects of good simulation practice, but as simulation remains a relatively young avenue for scientific progress, their influence and endurance remains necessarily unproven. We now connect our PCS primer to various antecedents, partitioning our discussion (with admittedly fuzzy borders) across contributions to study conceptualization, design, and appraisal. (More in Appendix C.)
Conceptualization
Our PCS primer takes its name from the Predictability-Computability-Stability (PCS) framework for veridical Data Science (Yu, 2013; Yu & Kumbier, 2020). The PCS framework straddles the divide between study conceptualization and appraisal, as the authors recommend grounding statistical analyses with connections to the eponymous three pillars of Data Science. Predictability invokes prediction as a model “reality check,” and falls under our pursuit of Realism in translating between empirical research question and computational construct. Both views of Stability embed not only statistical variation, but also reasonable variation in human judgements, to promote a standard of reproducibility/replicability and external validity as in the empirical sciences. And our Modularity and Efficiency support the Computability of a simulation, which comprehends such concerns as data collection and storage, access and cleaning; and the design of algorithms that are tractable, efficient, and scalable. Auxiliary to the PCS acronym, its authors recommend a high standard of “PCS documentation”; we elevate this fourth, critical dimension to a more-equal footing through our principles of Intuitiveness and Transparency, which encourage clear and honest communication of a study and its results. Our PCS primer moreover offers a conceptual scaffold and tangible guidelines to aid Data Science practitioners in designing simulations.
Donoho (2024) argues that Data Science has accelerated rapidly with communal sharing of data, code, and competitive challenges; these prongs of “frictionless reproducibility” (FR1-3) support fast, grounded research proliferation. Donoho’s narrative, while not limited to simulation, intertwines with our PCS-inspired MERITS. FR1-3 support research Computability and, broadly, Stability in communal knowledge. Shared data (FR1) underlie Realistic simulations, while Realistic synthetic data serve as benchmarks in competitive challenges (FR3) (Carvalho et al., 2019; Dorie et al., 2019). Researchers can more easily adapt shared code (FR2) that is Modular and Efficient. And for FR1-3 to truly reduce friction in advancing human knowledge, all three must possess Intuitive, Transparent documentation for utility and user confidence. Overall, research products embodying the MERITS of good Data Science form more-reliable foundations for future work via FR1-3.
In a similar vein, Morris et al. (2019) recognized the poor reporting of published simulations and argued for better communication of study design and execution. They suggest the mnemonic ADEMP (aims, DGPs, estimands, methods, and performance measures) to help practitioners articulate their designs; Boulesteix et al. (2020) revised ADEMP to replace ‘estimands’ by ‘number of repetitions.’ Our PCS primer presents these considerations in a more-narrative format via three of our four simulation “recipe” components, with associated design guidelines: the problem statement (aims); data (and DGPs); and methods (including estimands, performance measures, and computational specifications). We further recognize explicitly in our fourth component the importance of proper reporting.
Design
The Systems Engineering and Computer Science Program (PESC) developed 20 guidelines for reporting simulations in software engineering, which we can interpret retroactively as design considerations (Nicolau de Franca & Travassos, 2013). They, too, recommend documenting the domain problem, background knowledge and study context, and research goals (problem statement guidelines); truth scenarios (data); modelling details, validation efforts, and computational parameters (methods); and main findings and limitations (reporting).
A U.S. interagency working group sought to improve the credibility of computational modeling in healthcare by establishing ten rules for simulation. These precepts encourage context-appropriate choices, ample documentation, and reproducibility – but do so at varying levels of specificity, from coarse (“evaluate within contex”) to very fine (“use version control”). Although we agree with their rules, we believe that the PCS primer’s steadier level of granularity and recipe-like scaffold will facilitate internalizing and implementing it.
Collin et al. (2022) offer recommendations in personalized medicine that stand out for encompassing the entirety of the Data Science “life cycle”: here, in silico modelling, empirical studies, and clinical practice. In consequence, they offer few precepts for study design per se, but share our emphasis on careful prespecification and thorough documentation, with assumptions and biases recorded explicitly and models validated using empirical data.
Appraisal
Various collections of ‘Ten Simple Rules’ advise on a selection of related topics, including big data (Zook et al., 2017), molecular simulations (Elofsson et al., 2019), behavioral modelling (Wilson & Collins, 2019), open-access science (Rule et al., 2019), and principled simulation (Fogarty et al., 2022). We can view these contributions alternately as design guidelines or quality-criteria checklists. From various perspectives, they promote deliberate, streamlined code design (Modularity and Efficiency); empirical validation of computational models (Realism); clear communication through story-telling (Intuitiveness); ‘auditability’ and acknowledgement of data limitations (Transparency); and reproducibility (Stability).
For readers interested in responsible data use and algorithm accountability, Diakopoulos et al. (2016) offer five desiderata: Responsibility, Explainability, Accuracy, Auditability, and Fairness. These principles govern at a more-abstract level than ours, but the two scales are complementary in that simulations designed with the PCS primer to attain its indirectly (but more tangibly) promote these higher-level ideals. For further reading, we recommend Ashurst et al. (2022) and Smith et al. (2022). For granular discussions of computational reproducibility – of which there are many beyond the scope of our discussion – we suggest Krafczyk et al. (2021) and related works.
7 Concluding remarks
Simulations are ubiquitous in and invaluable to contemporary research in many disciplines, offering an efficient and (potentially) realistic training ground for models in various data contexts. Yet this prevalence has fostered no standard criteria for a “high-quality” study, nor a curated guide to designing one. Absent such guidance, novice data scientists evolve their own practices ad hoc, informed by word of mouth or individual trial and error, both of which processes are inefficient and fallible. Herein we attempt to unite the field and encourage trustworthy, veridical Data Science via our PCS primer for desinging high-quality simulation “recipes.” Our of a strong simulation (Modular, Efficient, Realistic, Intuitive, Transparent, Stable), and guidelines in pursuit of them, seek to formalize lessons learned from community simulation in the natural and computational sciences. We hope that this consolidated presentation of ideas will aid data scientists in teaching and adopting good practices easily and consistently, and mitigate dubious research practices.
To a similar end, we have designed the R package simChef to facilitate implementing and reporting simulation studies with . Unlike existing simulation packages, simChef supports Tidyverse-esque syntax for writing simulations and automatic generation of R Markdown documentation containing simulation results with the code to reproduce them. Over repeated use, our primer would become second nature – much as an experienced chef knows intuitively which flavors complement one another – but good practices proliferate more effectively when adopting them is easier than the alternative. Thus, with simChef, we seek to lower the activation barrier to running and reporting high-quality simulations, allowing researchers to focus on substantive questions with fewer technical distractions. We refer interested readers to the Github repository and manuscript (Duncan et al., 2024+).
We recognize that it may not be possible to satisfy all nuances of these guidelines in every context. But, should the Data Science community choose to embrace our PCS primer, we hope that it will support a higher caliber of data-driven science; help mitigate the so-called reproducibility crisis; and even aid in more-prosaic tasks like preparing our research for publication.
8 Disclosure Statement
The authors report there are no competing interests to declare.
References
- (1)
- Ashurst et al. (2022) Ashurst, C., Barocas, S., Campbell, R. & Raji, I. D. (2022), ‘Disentangling the components of ethical research in machine learning’, ACM FAccT pp. 2057–5068.
- Barba (2018) Barba, L. (2018), ‘Terminologies for reproducible research’, arXiv 1802.03311, 1–18.
- Basu et al. (2018) Basu, S., Kumbier, K., Brown, J. & Yu, B. (2018), ‘Iterative random forests to discover predictive and stable high-order interactions’, PNAS 115(8), 1943–1948.
- Behr et al. (2022) Behr, M., Wang, Y., Li, X. & Yu, B. (2022), ‘Provable boolean interaction recovery from tree ensemble obtained via random forests’, PNAS 119(22), e2118636119.
- Blair et al. (2023) Blair, G., Coppock, A. & Humphreys, M. (2023), Research Design in the Social Sciences: Declaration, Diagnosis, and Redesign, Princeton Univ. Press.
- Bonate (2000) Bonate, P. (2000), ‘Clinical trial simulation in drug devel.’, Pharm. Res. 17(1), 252–256.
- Boulesteix et al. (2020) Boulesteix, A.-L., Groenwold, R., Abrahamowicz, M., Binder, H., Briel, M., Hornung, R., Morris, T., Rahnenführer, J. & Sauerbrei, W. (2020), ‘Introduction to statistical simulations in health research’, BMJ Open 10, e039921.
- Carvalho et al. (2019) Carvalho, C., Feller, A., Murray, J., Woody, S. & Yeager, D. (2019), ‘Assessing treatment effect variation in obs. studies: Results from a data challenge’, Obs. Studies 5(2), 21–35.
- Chen et al. (2014) Chen, W., Shi, J., Qian, L. & Azen, S. (2014), ‘Comparison of robustness to outliers between robust poisson models and log-binomial models when estimating relative risks for common binary outcomes: A simulation study’, BMC Med. Res. Methodol. 14(1), 82.
- Collin et al. (2022) Collin, C., Gebhardt, T., Golebeiwski, M., Karaderi, T., Hillemanns, M., Khan, F., Salehzadeh-Yazdi, A., Kirschner, M., Krobitsch, S., consortium, E.-S. & Kuepfer, L. (2022), ‘Comput. models for clinical applications in personalized medicine – guidelines and recs. for data integration and model validation’, J. Pers. Med. 12(2), 166.
- Diakopoulos et al. (2016) Diakopoulos, N., Freidler, S., Arenas, M., Barocas, S., Hay, M., Howe, B., Jagadish, H., Unsworth, K., Sahuguet, A., Venkatasubramanian, S., Wilson, C., Yu, C. & Zevenbergen, B. (2016), ‘Principles for accountable algorithms and a social impact statement for algorithms’, ACM FAT-ML Dagstuhl Seminar 16291 . https://www.fatml.org/resources/principles-for-accountable-algorithms.
- Donoho (2024) Donoho, D. (2024), ‘Data science at the singularity’, HDSR 6(1).
- Dorie et al. (2019) Dorie, V., Hill, J., Shalit, U., Scott, M. & Cervone, D. (2019), ‘Automated vs. diy methods for causal infer.: Lessons learned from a data anal. competition’, Stat. Sci. 34(1), 43–68.
- Duncan et al. (2024+) Duncan, J. P., Tang, T., Elliott, C. F., Boileau, P. & Yu, B. (2024+), ‘simchef: High-quality data science simulations in r’, JOSS (under submission) .
- El-Gheriani et al. (2017) El-Gheriani, M., Khan, F. & Zuo, M. (2017), ‘Rare event analysis considering data and model uncertainty’, ASCE-ASME J. Risk Uncertain. Eng. Syst. B 3(2), 021008.
- Elofsson et al. (2019) Elofsson, A., Hess, B., Lindahl, E., Onufreiv, A., van der Spoel, D. & Wallqvist, A. (2019), ‘Ten simple rules on how to create open access and reproducible molecular simulations of biological systems’, PLoS Comput. Biol. 15(1), e1006649.
- Fogarty et al. (2022) Fogarty, L., Ammar, M., Holding, T., Powell, A. & Kandler, A. (2022), ‘Ten simple rules for principled simulation modelling’, PLoS Comput. Biol. 18(3), e1009917.
- Gass (2012) Gass, S. (2012), ‘Documenting a computer-based model’, Interfaces 14(3), 84–93.
- Gimpel & Schuknecht (2003) Gimpel, J. G. & Schuknecht, J. E. (2003), ‘Political participation and the accessibility of the ballot box’, Political Geography 22(5), 471–88.
- Girard (2005) Girard, P. (2005), ‘Clinical trial simulation: A tool for understanding study failures and preventing them’, BCPT 96(1), 228–234.
- Grimm et al. (2006) Grimm, V., Berger, U., Bastiansen, F., Eliassen, S., Ginot, V., Giske, J., Goss-Custard, J., Grand, T., Heinz, S., Huse, G., Huth, A., Jepsen, J., Jørgensen, C., Mooij, W., Müller, B., Pe’er, G., Piou, C., Railsback, S., Robbins, A., Robbins, M., Rossmanith, E., Rüger, N., Strand, E., Souissi, S., Stillman, R., Vabø, R., Visser, U. & DeAngelis, D. (2006), ‘A standard protocol for describing individual-based and agent-based models’, Ecol. Model. 198(1-2), 115–126.
- Grimm et al. (2010) Grimm, V., Berger, U., DeAngelis, D., Polhill, J., Giske, J. & Railsback, S. (2010), ‘The odd protocol: A review and first update’, Ecol. Model. 221(23), 2760–2768.
- Haller et al. (2019) Haller, B., Ulm, K. & Hapfelmeier, A. (2019), ‘A simulation study comparing different statistical approaches for the identification of predictive biomarkers’, Comput. Math. Methods Med. 2019(1), 1–19.
- Hartmann (2002) Hartmann, A. (2002), ‘Sampling rare events: Statistics of local sequence alignments’, Phys. Rev. E 65(5), 056102.
- Haspel & Knotts (2005) Haspel, M. & Knotts, H. G. (2005), ‘Location, location, location: Precinct placement and the costs of voting’, J. Politics 67(2), 560–73.
- Holford et al. (2000) Holford, N., Kimko, H., Monteleone, J. & Peck, C. (2000), ‘Simulation of clinical trials’, Annu. Rev. Pharmacol. Toxicol. 40(1), 209–234.
- Holford et al. (2010) Holford, N., Ma, S. & Ploeger, B. (2010), ‘Clinical trial simulation: A review’, CPT 88(2), 166–182.
- Husereau et al. (2013) Husereau, D., Drummond, M., Petrou, S., Carswell, C., Moher, D., Greenberg, D., Augustovski, F., Briggs, A., Mauskopf, J. & Loder, E. (2013), ‘Consolidated health economic evaluation reporting standards’, BMJ 346.
- Kendall et al. (2017) Kendall, G., Bai, R., Błazewicz, J., De Causmaecker, P., Gendreau, M., John, R., Li, J., McCollum, B., Pesch, E., Qu, R., Sabar, N., Vanden Berghe, G. & Yee, A. (2017), ‘Good laboratory practice for optimization research’, JORS 67(4), 676–689.
- Kolgatin et al. (2022) Kolgatin, O., Kolgatina, L. & Ponomareva, N. (2022), ‘Computational modelling of stochastic processes for learning research’, Educ. Dim. 58(1), 2377–2378.
- Krafczyk et al. (2021) Krafczyk, M., Shi, A., Bhaskar, A., Marinov, D. & Stodden, V. (2021), ‘Learning from reproducing computational results: Introducing three principles and the Reproduction package’, Philos. Trans. R. Soc. A 379(1), 20200069.
- Kuhn & Wickham (2023) Kuhn, M. & Wickham, H. (2023), recipes: Preprocessing and Feature Engineering Steps for Modeling. https://github.com/tidymodels/recipes, https://recipes.tidymodels.org/.
- Kumbier et al. (2023) Kumbier, K., Basu, S., Frise, E., Celniker, S., Brown, J. & Yu, B. (2023), ‘Signed iterative random forests to identify enhancer-associated transcription factor binding’, arXiv 1810.07287, 1–22.
- Maas & Hox (2004) Maas, C. & Hox, J. (2004), ‘Robustness issues in multilevel regression analysis’, Stat. Neerl. 58(2), 127–137.
- Meurer et al. (2012) Meurer, W., Lewis, R. & Berry, D. (2012), ‘Adaptive clinical trials: A partial remedy for the therapeutic misconception?’, JAMA 307(22), 2377–2378.
- Monks et al. (2019) Monks, T., Currie, C. S., Onggo, B., Robinson, S., Kunc, M. & Taylor, S. (2019), ‘Strengthening the reporting of empirical simulation studies: Introducing the stress guidelines’, J. Simul. 13(1), 55–67.
- Morris et al. (2019) Morris, T., White, I. & Crowther, M. (2019), ‘Using simulation studies to evaluate statistical methods’, Stat. in Med. 38(1), 2074–2102.
- NASEM (2020) NASEM (2020), ‘Reproducibility and replicability in science: Report highlights’, HDSR 2(4), 1–18. https://hdsr.mitpress.mit.edu/pub/nas-report-highlights.
- Nicolau de Franca & Travassos (2013) Nicolau de Franca, B. & Travassos, G. (2013), ‘Reporting guidelines for simulation-based studies in software engineering’, Technical report ES746(13). https://www.cos.ufrj.br/uploadfile/1368206472.pdf.
- Norgeot et al. (2020) Norgeot, B., Quer, G., Beaulieu-Jones, B., Torkamani, A., Dias, R., Gianfrancesco, M., Arnaout, R., Kohane, I., Saria, S., Topol, E., Obermeyer, Z., Yu, B. & Butte, A. (2020), ‘Minimum information about clinical artificial intelligence modeling: The mi-claim checklist’, Nat. Med. 26(1), 1320–1324.
- Orloff et al. (2009) Orloff, J., Douglas, F., Pinheiro, J., Levinson, S., Branson, M., Chaturvedi, P., Ette, E., Gallo, P., Hirsch, G., Mehta, C., Patel, N., Sabir, S., Springs, S., Stanski, D., Evers, M., Fleming, E., Singh, N., Tramontin, T. & Golub, H. (2009), ‘The future of drug development: Advancing clinical trial design’, Nat. Rev. Drug Discov. 8(1), 949–957.
- Press et al. (2007) Press, W., Teukolsky, S., Vetterling, W. & Flannery, B. (2007), Numerical Recipes: The Art of Scientific Computing, 3 edn, Cambridge University Press.
- Rahmandad & Sterman (2012) Rahmandad, H. & Sterman, J. (2012), ‘Reporting guidelines for simulation-based research in social sciences’, Syst. Dyn. Rev. 28(4), 396–411.
- Rule et al. (2019) Rule, A., Birmingham, A., Zuniga, C., Altintas, I., Huang, S.-C., Knight, R., Moshiri, N., Nguyen, M., Rosenthal, S., Pérex, F. & Rose, P. (2019), ‘Ten simple rules for writing and sharing comput. analyses in jupyter notebooks’, PLoS Comput. Biol. 15(7), e1007007.
- Smith et al. (2022) Smith, J., Amershi, S., Barocas, S., Wallach, H. & Vaughan, J. (2022), ‘Real ml: Recognizing, exploring, and articulating limitations of m.l. research’, ACM FAccT pp. 587–597.
- Spitz & Furlong (2012) Spitz, F. & Furlong, E. E. (2012), ‘Transcription factors: from enhancer binding to developmental control’, Nature reviews genetics 13(9), 613–626.
- Strasburg & Riesbery (2010) Strasburg, J. & Riesbery, L. (2010), ‘How robust are “isolation with migration” analyses to violations of the im model? a simulation study’, MBE 27(2), 297–310.
- Suzuki & Nei (2002) Suzuki, Y. & Nei, M. (2002), ‘Simulation study of the reliability and robustness of the statistical methods for detecting positive selection at single amino acid sites’, MBE 19(11), 1865–1869.
- Voss (2024) Voss, D. S. (2024), ‘The double irony of kentucky election reform’. Kentucky Lantern, https://rb.gy/0iyvon [Accessed: 2024-03-06].
- Voss et al. (2020) Voss, D. S., Elliott, C. F. & Shepard, S. T. (2020), Curtailing election-day voting opportunities: Post-litigation version of expert-witness report for nemes v. bensinger (2020), Technical report, DoubleDenny Consulting.
- Waltemath et al. (2011) Waltemath, D., Adams, R., Beard, D., Bergmann, F., Bhalla, U., Britten, R., Chelliah, V., Cooling, M., Cooper, J., Crampin, E., Garny, A., Hoops, S., Hucka, M., Hunter, P., Klipp, E., Laibe, C., Miller, A., Moraru, I., Nickerson, D., Nielsen, P., Nikolski, M., Sahle, S., Sauro, H., Schmidt, H., Snoep, J., Tolle, D., Wolkenhauer, O. & Le Novére, N. (2011), ‘Minimum information about a simulation experiment (miase)’, PLoS Comput. Biol. 7(4), e1001122.
- Webber et al. (2019) Webber, R., Plotkin, D., O’Neill, M., Abbot, D. & Weare, J. (2019), ‘Practical rare event sampling for extreme mesoscale weather’, Chaos 053109(29), 1–17.
- Wilson & Collins (2019) Wilson, R. & Collins, A. (2019), ‘Ten simple rules for computational modeling of behavioral data’, eLife 8, e49547.
- Wolpert (1969) Wolpert, L. (1969), ‘Positional information and the spatial pattern of cellular differentiation’, Journal of theoretical biology 25(1), 1–47.
- Yu (2013) Yu, B. (2013), ‘Stability’, Bernoulli 19(4), 1484–1500.
- Yu & Kumbier (2020) Yu, B. & Kumbier, K. (2020), ‘Veridical data science’, PNAS 117(8), 3920–3929.
- Yu & Yao (2017) Yu, C. & Yao, Q. (2017), ‘Robust linear regression: A review and comparison’, Commun. Stat. – Simul. 46(8), 6261–6282.
- Zook et al. (2017) Zook, M., Barocas, S., Boyd, D., Crawford, K., Keller, E., Dangadharan, S., Goodman, A., Hollander, R., Koenig, B., Metcalf, J., Narayanan, A., Nelson, A. & Pasquale, F. (2017), ‘Ten simple rules for responsible big data research’, PLoS Comput. Biol. 13(3), e1005399.
Appendix A Appendix: LSSFind (theory-driven case study)
Behr et al. (2022) sought to extend and validate the iRF project (Section 5) by proving that an “iRF-like” method discovers ‘true’ feature interactions. The authors used a local spiky sparse (LSS) model to simulate interaction terms and tried to recover them using a simplified version of iRF, dubbed LSSFind. The paper describes a largely theoretical evaluation of tree-based interaction discovery; herein we consider only the complementary simulation study. The authors generated various datasets, including several that violated their modeling assumptions, to verify and stress-test their conclusions. Because they worked primarily with a simplified algorithm, the authors also included a direct comparison of the simplified (LSSFind) and full (iRF) methods. As per our primary guideline (i), the authors planned the study largely prior to implementation. However, the auxiliary data-inspired simulations (discussed below) required a few iterations of learning from intermediate results.
Recipe Components
-
A.
Recipe Header (Problem Statement): What are we trying to produce?
Behr et al. (2022) sought to (a) recover from simulation their theoretical conclusions; (b) assess the breakdown of these conclusions under model-assumption violations; and (c) compare the simplified LSSFind algorithm to its full-bodied counterpart, iRF, to ensure that conclusions drawn from the former extend to the latter. To concretize these goals (guideline ii), the authors describe the theoretical results they hoped to recover, modeling assumptions and potential violations, and their strategy for comparing iRF to LSSFind. Because the authors sought to understand the theoretical properties of LSSFind and iRF, their connections to “reality” comprised realistic model assumptions and violations; they acknowledge several limitations of their study, including limited tuning of iRF parameters and omission of datasets with multiple assumptions violated (guideline iii). Theoretical tractability required working with a simplified version of iRF, but as indicated by objective (c), the authors sought to understand the ramifications of this simplification by comparing the test algorithm, LSSFind, against iRF itself as the published state-of-the-art alternative (guideline iv). -
B.
List of Ingredients (Data): What should go into it?
The authors generated data using Monte Carlo sampling from an LSS model; thus, the ingredients for their study comprised the LSS models and parameters. They generated various datasets, including several that violated their modeling assumptions and might have proved inhospitable to the study methods (guideline vii). The authors also generated input features from real-world data,111111ChIP-seq data as employed for the iRF project (Section 5). producing response values that satisfy some (but not all) conditions of the LSS model (guideline vi). These data-inspired simulations ultimately did not see publication due to page restrictions but, for transparency, appear in the project GitHub repository. Because LSSFind acted as a proxy for understanding iRF rather than an algorithm for use by practitioners, the authors considered its performance on real-world data to be of relatively low importance; in this way, LSSFind was indeed deployed in its intended context (guideline v). Nonetheless, our understanding of iRF might have benefited from deeper investigation of either algorithm in the intended setting of real-world omics data. -
C.
Preparation Steps (Methods): What steps are required?
The primary methods here included LSSFind itself and its more-complex analogue, iRF (the state-of-the-art competitor, per guideline ix121212Guideline ix recommends comparing against a selection of methods, but the problem statement takes precedence. The authors choose a single reference method in light of this study’s relatively narrow stated purpose and the general lack of existing comparable methods.). Both methods depended on tuning parameters, such as the number of iterations and number of bootstrap replicates for iRF and the parameters and for LSSFind (see paper for details). The authors implemented LSSFind in Python and used a pre-existing implementation of iRF in the same language. They described their modeling procedures, including computational specifications and parameters, in the full paper (guideline viii). The simulation code, encapsulated in Jupyter notebooks, appears online, but would have benefited from more-thorough documentation. The authors considered two performance metrics suited to both algorithms (guideline x), including one metric to inform the correctness of their theoretical results and another of more-practical relevance to compare the performance of LSSFind against that of iRF. -
D.
Staging (Reporting): How will the finished product look if done right?
Behr et al. (2022) reported their results primarily as textual descriptions. Figures included a graphical illustration of the tree-based algorithm procedure and, in the Supporting Information, bar charts of performance metrics for LSSFind alone or as compared to iRF. These bar charts are straightforward (guideline xi), but less narrative text and more (varied) figures might have aided readers in digesting the (importance of the) theoretical results (guideline xii). For reproducibility, the authors published all simulation code, including the implementation of LSSFind, on GitHub. Although they might have documented their code/repository more completely, all evidence suggests that the authors tried to represent their results and conclusions to their audience in a reasonable and honest manner (guideline xiii).
and Shortfalls
-
•
odular: Each simulation occupies a separate Jupyter notebook. Code shared across simulations, including the implementation of LSSFind, is loaded into each notebook from a joint Python script to limit code redundancies. This implementation could have benefited from a stand-alone package for public dissemination (but note that the project goals were primary theoretical rather than method development).
-
•
fficient: The authors of LSSFind sought to create examples complex enough to inform their theoretical investigation of tree-based interaction recovery while minimizing code complexity and run-times. Notably, the iRF procedure is computationally more efficient, but theoretically less tractable, than LSSFind. The authors tried to improve the efficiency of LSSFind by searching over a restricted subset of candidate interactions, but could have invested more effort in optimizing the algorithm if method development had been a more-central goal of the project.
-
•
ealistic: Due to the theoretical nature of the problem, generating context-appropriate data was unusually straightforward. The authors generated datasets that violated each of their three modelling assumptions, but did not consider violating combinations/subsets of assumptions (a trade-off with computational Efficiency). The authors also performed an analysis using real-world ChIP-seq data to assess the performance of their methods in the intended deployment context.131313These results appear in the GitHub repository but not the journal publication.
-
•
ntuitive: The LSSFind authors designed their simulations to be as straightforward as possible, limiting the number of settings explored to those that would provide evidence to inform their theoretical investigation without overwhelming the audience. This strategy resulted in a more-streamlined, but less extensive, simulation: The authors could have considered more combinations of parameters or model assumptions, at the possible cost of lower intelligibility. The authors could have communicated more clearly the results arising from real-world data, which, in retrospect, even in the online repository were less detailed and clear than we would recommend.
-
•
ransparent: The authors published all simulation code and data publicly on GitHub, including supplemental project materials that ultimately did not fit the page restrictions of the parent journal. However, in retrospect, the authors could have provided more documentation of their code. They also did not publish the study materials for facile public consumption in an R package or Python library, but only as Python scripts and notebooks within the GitHub repository.
-
•
table: The simulations in this project were straightforward by design, and thus the authors encountered relatively few problems with respect to stability across results. That said, they could have demonstrated the stability of results in more detail: for example, in terms of the methods’ tuning parameters (particularly and , for which they performed no stability analysis), or by addressing any effect of Monte Carlo repetitions (40 in this case). These considerations would be crucial to a data scientist using LSSFind in practice. However, because the authors investigated LSSFind primarily as a test-bed for better understanding the more-complicated iRF procedure, and because the investigation was primarily theoretical in nature, they chose to weight the desideratum of Intuitiveness higher than that of Stability.
Appendix B Appendix: Voting-Rights Lawsuit (applied simulation case study)
Kentucky’s U.S. Senate primary election was scheduled for May 2020, just two months after the World Health Organization deemed COVID-19 a “pandemic” and the U.S. government declared a national emergency. To shield elderly poll workers from exposure to the virus, election officials suspended Kentucky’s traditional practice of voting in person at local precinct stations. Instead, Kentucky offered a battery of early and absentee voting options, while reducing in-person Election Day voting to a single, centralized county location.
Litigants argued that the reduction in voting locations would disenfranchise citizens – including Black voters supportive of a candidate seemingly poised to defeat the Democratic Party’s favored nominee (Voss 2024). As part of that litigation, Voss et al. (2020) sought to anticipate the effects of these unprecedented measures on voter turnout. Herein we focus on the authors’ use of simulation to estimate the depressive effect on political participation of relying on county-wide vote centers. We dissect this simulation through the lens of our framework, demonstrating the PCS primer’s utility for a non-methodological, Social Science study. As per guideline (i), the authors designed their simulation upfront, with no major modifications over the course of the study.
Recipe Components
-
A.
Recipe Header (Problem Statement): What are we trying to produce?
The simulation by Voss et al. (2020) sought to anticipate two outcomes: (1) How much would using vote centers suppress political participation? and (2) Would such voter demobilization differ by racial group? (guideline ii). Traditionally, voters live within 1 mile from their voting location, whereas requiring constituents to travel further to reach a county polling station might suppress voter turnout. Existing literature documents that distance from polling stations poses a significant and possibly prohibitive obstacle to many voters, one that Gimpel & Schuknecht (2003) show to differ by type of community (guideline iv). The real-world implications of this effect of travel distance are fairly evident, as policies that erode the franchise for African-American voters could alter election outcomes and violate constitutional law (guideline iii). -
B.
List of Ingredients (Data): What should go into it?
Haspel & Knotts (2005) offer a model for turnout as a function of distance from polling location. Using this model’s estimates, derived from individual-level Atlanta voting data, a simulation can contrast travel distances mandated by use of a centralized polling station against those required under alternative policies, thereby forecasting the effect of reducing polling stations (guideline v). Available data include the locations of all pre-pandemic voting locations, as well as the approximate locations of voting-age citizens (captured using the geographic centroids for their Census block groups, a unit for which the Census Bureau provides racial demographics) (guideline vi). Indirectly, therefore, the pairwise distances between potential polling places and constituent residential locations also are known. Rather than contrast the vote-center approach to one using all historical voting locations – prohibitive, in light of pandemic-era staffing scarcity – a more-realistic alternative would have been to open ten or at least five county voting locations. Still, also calculating pre-pandemic travel distances affords a full estimate of the new policy’s impact (guideline vii). -
C.
Preparation Steps (Methods): What steps are required?
The investigators did not know which precinct stations could have been left open. Not all locations would have supported the large-scale voter traffic incurred by operating fewer stations, and some refused to host the election for fear of the virus. Thus, the simulation entailed randomly selecting precinct locations to open141414The planned, centralized county station plus four or nine additional locations (depending on the policy). and estimating the distribution of resulting distances that voters would have needed to travel under each simulated batch of polling stations (guideline viii). The authors compared the average minimum travel distance across policies, as well as the distributions of distances (guideline x). The resultant effect on voter turnout could be estimated by applying the state-of-the-art Haspel & Knotts (2005) model to those distances (guideline ix). -
D.
Staging (Reporting): How will the finished product look if done right?
Voss et al. (2020) performed independent, identical simulations for seven of Kentucky’s most-populous counties. For each policy and county, the authors provide a consistent set of summaries, including frequency tables for Census block-groups binned by average minimum travel distance, and histograms for the sampling distributions of minimum travel distances (guideline xi). To gauge disparate racial effects, they provided similar displays stratified by demographic group (guideline xii). The authors used the best known model for disenfranchisement as a function of distance, but acknowledge frankly a few potential improvements to their study151515Two extensions prevented by the litigation’s quick deadline were estimating Manhattan rather than Euclidean distances (to emulate driving patterns) and soliciting guidance on viable polling stations. (guideline xiii).
and Shortfalls
-
•
odular: Voss et al. (2020) compartmentalize their code into separate files, one per analysis step: data cleaning and reformatting; simulation; and visualization. The study comprises one simulation per county, with identical procedures. Additional counties could be added with minimal difficulty if analogous data became available.
-
•
fficient: The simulation design is efficient in both its conception and implementation. The code is concise and can be executed to completion in a matter of minutes.
-
•
ealistic: Voss et al. (2020) incorporated real-world data (Census block-group demographics and pre-pandemic precinct stations) and best established theory (model by Haspel & Knotts 2005). They articulate potential areas for improvement, as by incorporating expert knowledge, if such existed, to sample only among stations realistically equipped for the increase in traffic necessitated by consolidating in-person voting to fewer locations. They also propose improvements to simulation realism by measuring distances using the central mass of a block-group rather than its geographic center, and the Manhattan rather than Euclidean distance metric to emulate travel patterns.
-
•
ntuitive: The authors chose a simple simulation design for ease of communication to a lay audience. Presentations (tables and histograms) are similarly straightforward and displayed in close proximity to support comparisons across alternative policies.
-
•
ransparent: The authors describe their study fully and clearly in the published report, with justification of all study design decisions. They prespecified all design elements to avoid biasing results, with no deviations required during implementation.
-
•
table: Voss et al. (2020) set random seeds to support the reproducibility of their results, and executed the study under multiple seeds (results not shown) to mitigate the role of luck in their conclusions. Using multiple simulated replicates allows for a robust characterization of the sampling distributions. However, the best model in use was developed in reference to Atlanta, GA, and thus may not represent Kentucky perfectly; future extensions of the study might include a stability analysis against model mis-specification as well as across the above improvements to study realism.
Appendix C Appendix: Further Reading
For readers designing empirical experiments to accompany simulation studies, we recommend a recent contribution in the Social Sciences (Blair et al. 2023) that, despite tackling a different manner of study design, resonates strongly with our Data Science philosophy. The authors set out two conceptual and two pragmatic components: The former, Models (of how the world might act) and Inquiries (research questions, stated in terms of the models), are key elements of our problem statement; the latter comprise Data strategies (procedures for gathering information about the world) and Answer strategies (similar to our Methods). Their accompanying design principles recommend planning studies deliberately upfront (while being responsive to intermediate results) and minding one’s audience.
Other research groups have leveraged their expertise in specific types/aspects of simulation to develop specialized guidance documents or checklists; for readers with related research agendas, this more-granular form of counsel might complement our primer.
Monks et al. (2019) reviewed, and found lacking, a literature of reporting paradigms that ran the gambit from too broad (MIASE, per Waltemath et al. 2011) or outmoded (GASS, per Gass 2012) to too specific (MMRR, per Rahmandad & Sterman 2012; ODD, per Grimm et al. 2006, 2010; CHEERS, per Husereau et al. 2013) or ill-suited to simulation (GLP4OPT, per Kendall et al. 2017). Their trio of STRESS checklists sought to improve reporting in Operations Research of agent-based, discrete-event, and system-dynamics simulations, respectively. Principles common across the checklists include articulation of study purpose and intended usage (problem statement); rationale and implementation details for both data and methods; and documentation for reproducibility (reporting).
The Minimal Information about CLinical Artificial Intelligence Modelling (MI-CLAIM) checklist, like our primer, draws some inspiration from the PCS framework (Norgeot et al. 2020). It enumerates specific elements of a simulation that the investigator ought to report, spanning five pillars that resemble our simulation “recipe” with an expanded methods component: high-level study design (problem statement); choice or generation of data (data); models, model performance, and model examination (methods); and efforts for reproducibility (reporting). MI-CLAIM is best suited to studies with a clinical bent.
Finally, we acknowledge two computational endeavors that share our analogy if not precisely our ambitions. The R package recipes, under the Tidymodels umbrella, provides tools for preprocessing one’s data prior to fitting a model (Kuhn & Wickham 2023). Here the eponymous recipe refers to a sequence of preprocessing steps (e.g., transforming or binning predictor variables). This package might aid readers seeking to implement our primer with clean and reliable code. Meanwhile, the book series Numerical Recipes treats a range of topics related to algorithms and numerical analysis, describing the fundamentals of the techniques and providing implementations in coding languages that vary by publishing edition (Press et al. 2007). The title connotes a “cookbook” for numerical computation, allowing readers to delve into each algorithm’s ingredients and preparation rather than encountering a mere “menu” of finished products. The authors share some of our guiding philosophy, seeking to promote a deeper understanding of methods and to demonstrate that computational methods can be efficient and intuitive rather than opaque black boxes.