The High-Redshift Gas-Phase Mass-Metallicity Relation in FIRE-2
Abstract
The unprecedented infrared spectroscopic capabilities of JWST have provided high-quality interstellar medium (ISM) metallicity measurements and enabled characterization of the gas-phase mass-metallicity relation (MZR) for galaxies at for the first time. We analyze the gas-phase MZR and its evolution in a high-redshift suite of FIRE-2 cosmological zoom-in simulations at and for stellar masses . These simulations implement a multi-channel stellar feedback model and produce broadly realistic galaxy properties, including when evolved to . The simulations predict very weak redshift evolution of the MZR over the redshift range studied, with the normalization of the MZR increasing by less than dex as redshift decreases from to . The median MZR in the simulations is well-approximated as a constant power-law relation across this redshift range given by . We find good agreement between our best-fit model and recent observations made by JWST at high redshift. The weak evolution of the MZR at contrasts with the evolution at , where increasing normalization of the MZR with decreasing redshift is observed and predicted by most models. The FIRE-2 simulations predict increasing scatter in the gas-phase MZR with decreasing stellar mass, in qualitative agreement with some observations.
1 Introduction
The mass-metallicity relation (MZR) is the observed positive correlation between a galaxy’s stellar mass and its metallicity (Lequeux et al., 1979; Tremonti et al., 2004). There are both stellar and gas-phase versions of the MZR, which relate stellar mass to stellar metallicity and interstellar medium (ISM) metallicity, respectively. Throughout this work we focus on the gas-phase MZR. The MZR and its evolution have been observed extensively across wide ranges of redshift and stellar mass (e.g., Erb et al., 2006; Lee et al., 2006; Zahid et al., 2011, 2012; Henry et al., 2013a, b; Maier et al., 2014; Steidel et al., 2014; Yabe et al., 2014; Sanders et al., 2015; Guo et al., 2016). Zahid et al. (2013) characterized the observed evolution of the MZR from , noting that, for a given stellar mass, metallicity tends to increase as redshift decreases. Previously, relatively small samples of galaxies have been able to confirm the existence of the MZR up to (e.g., Maiolino et al., 2008; Mannucci et al., 2009).
Recently, new observations from the James Webb Space Telescope (JWST) have greatly expanded the physical regimes where the MZR has been probed, both in mass and in cosmic time. Curti et al. (2023a) analyze the gas-phase metallicities of 146 low-stellar-mass (), high-redshift () galaxies observed by JWST. Nakajima et al. (2023) characterize the evolution of the MZR for using metallicity measurements of an additional 135 galaxies identified by JWST in this redshift range. Gas-phase metallicities have been derived for a number of other high-redshift JWST targets via direct methods (e.g., galaxies in JWST Early Release Observations at ; Curti et al., 2023b, GN-z11 at ; Bunker et al., 2023, and 9 sources in the sightline of MACS J1149.5+2223 at ; Morishita et al., 2024). It is imperative that these unprecedented advances in observations of the MZR at high redshift and low stellar mass be met with detailed theoretical predictions in the newly probed regimes.
The MZR and its evolution have been studied at high redshift in a number of different simulation codes, such as IllustrisTNG (Torrey et al., 2019), FirstLight (Langan et al., 2020), SERRA (Pallottini et al., 2022), ASTRAEUS (Ucci et al., 2023), and FLARES (Wilkins et al., 2023). FirstLight, ASTRAEUS, and FLARES predict weak or no evolution in the MZR for . The Feedback in Realistic Environment (FIRE) project222See FIRE project website: http://fire.northwestern.edu. is a set of cosmological zoom-in simulations that resolve the multiphase ISM of galaxies and implement detailed models for star formation and stellar feedback (Hopkins et al., 2014, 2018, 2023). Ma et al. (2016) characterized the MZR in the first generation of FIRE simulations from to . A number of previous works (e.g., Ma et al., 2016; Torrey et al., 2019; Langan et al., 2020) invoke gas fractions to explain the redshift evolution or lack of redshift evolution in the MZR. Recently, Bassini et al. (2024) analyze the evolution of the MZR for in FIREbox (Feldmann et al., 2023), a cosmological volume simulation that uses FIRE-2 physics.
In this work, we present the MZR predicted from a high-redshift suite of FIRE-2 simulations. We measure the MZR at redshifts and we provide fitting formulae describing the redshift evolution of the MZR. We show that our model is in agreement with recent high-redshift observations of the MZR made by JWST. We compare our best-fit MZR with previous simulation-based models across this redshift range. This work analyzes the same suite of FIRE-2 simulations as done in two recent papers by Sun et al. (2023a, b), which focus on bursty star formation and its implications for the high-redshift ultraviolet luminosity function (UVLF) and survey selection effects in the context of JWST. Yang et al. (2023) also analyzed some galaxies from this suite of simulations and showed that metallicities derived from mock observations of emission lines from individual HII regions of FIRE-2 galaxies are in agreement with JWST and ALMA observations.
This paper is organized as follows. In Section 2, we describe the high- suite of FIRE-2 simulations used in this paper and the methods used to analyze the gas-phase MZR. In Section 3, we present the resulting high- MZR in FIRE-2 simulations. We compare our results with new observations made by JWST and with previous theoretical models of the MZR derived from FIRE-1 and other simulations. Finally, in Section 4 we summarize the key conclusions from this work and discuss potential future work on high- metallicity scaling relations.
Throughout this work we adopt a standard flat CDM cosmology with cosmological parameters consistent with Planck Collaboration et al. (2020). We define a galaxy’s gas-phase metallicity to be the mass-weighted mean metallicity of all gas particles within of the galaxy’s center. All functions are base 10, except when written as (natural logarithm).
2 Methods
2.1 Simulations
The simulations analyzed in this paper are cosmological zoom-in simulations from a FIRE-2 high-redshift suite originally presented by Ma et al. (2018a, b, 2019). All simulations in this suite were run using the GIZMO code (Hopkins, 2015). The hydrodynamic equations are solved using GIZMO’s meshless finite-mass (MFM) method. The 34 particular simulations analyzed in this paper are the z5m12a–e, z5m11a–i, z5m10a–f, z5m09a–b, z7m12a–c, z7m11a–c, z9m12a, and z9m11a–e runs. The names of these simulations denote the final redshift that they were run down to (, , or ) and the main halo masses (ranging from ) at these final redshifts. Baryonic (gas and star) particles have initial masses (simulations with more massive host galaxies have more massive baryonic particles). Dark matter particles are more massive by a factor of . Gravitational softenings are adaptive for the gas (with minimum Plummer-equivalent force softening lengths physical pc) and are fixed to physical pc and physical pc for star and dark matter particles, respectively.
A full description of the baryonic physics in FIRE-2 simulations is given by Hopkins et al. (2018), while more details on this specific suite of FIRE-2 simulations are discussed in Ma et al. (2018a, b, 2019). Here, we briefly review the aspects of the simulations most pertinent to our MZR analysis.
FIRE-2 simulations track the abundances of 11 different elements (H, He, C, N, O, Ne, Mg, Si, S, Ca, Fe). Metals are returned via multiple stellar feedback processes, including core collapse and type Ia supernovae as well as winds from O/B and AGB stars. Star particles in the simulations represent stellar populations with a Kroupa IMF (Kroupa, 2001) and with the stellar evolution models from STARBURST99 (Leitherer et al., 1999). These simulations also include sub-grid modelling for turbulent diffusion of metals to allow for chemical exchange between neighboring particles. The implementation and effects of the sub-grid turbulent diffusion model in FIRE simulations are described in Colbrook et al. (2017) and Escala et al. (2018).
2.2 Analysis
We analyze galaxies in each simulation at snapshots from to , with integer redshift increments. In addition to the main, most massive galaxy, each simulation’s zoom-in region captures numerous other, less massive, galaxies. The coordinates of galaxy centers and virial radii are taken from Amiga Halo Finder (AHF) catalogs (Gill et al., 2004; Knollmann & Knebe, 2009). Halos are defined using the redshift-dependent overdensity parameter from Bryan & Norman (1998). The galaxies used in our analysis are filtered based on the following criteria. Galaxies must have a minimum stellar mass within , a non-zero gas mass () within the same radius, and the halo must have a minimum virial mass given by . We exclude satellite galaxies and subhalos from our analysis as their properties can be significantly influenced by their host galaxy. Finally, we filter out any galaxies that are “contaminated” by low-resolution dark matter particles residing within of their center. After applying these cuts, the number of galaxies in our sample at different redshifts ranges from .
| Model | ||||
|---|---|---|---|---|
| Slope and Normalization Evolution (A(z), B(z)) | 0.3717 | 0.2065 | 0.1493 | |
| Normalization Evolution (B(z)) | 0.3683 | 0 | 0.0380 | |
| No Evolution | 0.3702 | 0 | 0 |
This work focuses on the MZR for gas-phase metallicity, which reflects the current chemical composition of a galaxy’s ISM. We leave the analysis of stellar metallicities, which provide information on the integrated chemical enrichment history of galaxies, as a subject for future work. We define a galaxy’s gas-phase metallicity to be the mass-weighted mean metallicity of all gas particles within of the galaxy’s center. We calculate a galaxy’s stellar mass as the total mass of all star particles within of the its center. We choose as the outer boundary for our galaxies rather than the commonly used due to the tendency of high-redshift galaxies to have more expansive stellar populations relative to their virial radii as compared to galaxies at lower redshift. This is consistent with the radial cut used by Sun et al. (2023a, b) in their analysis of the same simulation suite.
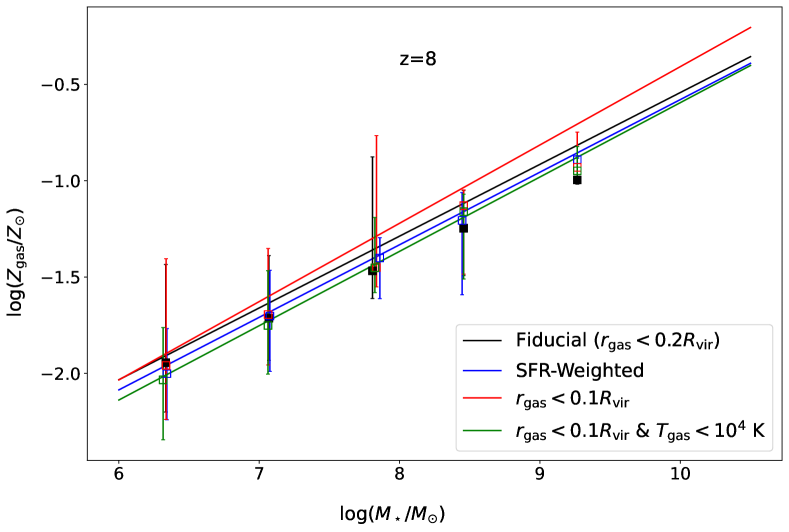
In Appendix C we consider alternative definitions and gas cuts for calculating gas-phase metallicities. This includes weighting by gas particles’ SFR property (rather than by mass) when calculating metallicity, setting the outer boundary of galaxies to be (rather than ), and introducing a temperature cut of K on gas particles used to calculate metallicity. The SFR-weighting scheme has only a minor impact on our calculated MZR and likely introduces a bias by removing galaxies with no star-forming gas from our sample since, according to the fundamental metallicity relation, galaxies with lower star formation rate will tend to have higher metallicities at fixed stellar mass (Ellison et al., 2008; Mannucci et al., 2010; Marszewski et al., in prep.). We also show that our MZR is relatively insensitive to the different radial and temperature cuts applied to gas particles in our analysis.
3 Results
In this section we present the MZR for our analyzed galaxies. Gas-phase metallicities are given in units of , where is the total metal mass fraction and we have adopted the solar metallicity, , from Anders & Grevesse (1989). With this value of , we can convert to units of oxygen abundance (often more relevant for comparing with observations) using the calibration presented in Appendix B of Ma et al. (2016),
| (1) |
This calibration was obtained by fitting metallicity against oxygen abundance in FIRE-1 simulated galaxies and may be subject to systematic uncertainties originating from supernovae rates, metal yields from different enrichment processes, and the fiducial solar metallicity used in FIRE simulations.
3.1 Mass-Metallicity Relation
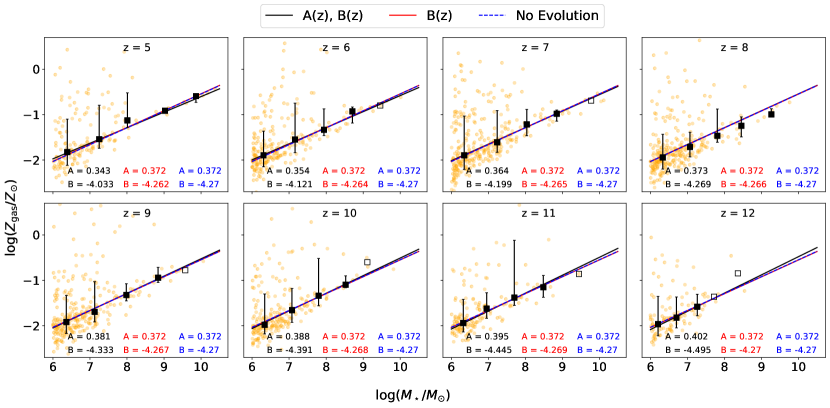
At each redshift analyzed, we separate the data into 5 stellar mass bins of equal width. These stellar mass bins span from the minimum stellar mass of galaxies included in our sample () to the maximum stellar mass of galaxies in our sample at that redshift. We then calculate linear best fit models between the median values of and in different stellar mass bins. For purposes of fitting, the median metallicity value of each stellar mass bin is given equal weight. We provide a fitting formula across our redshift range () by allowing the slope and y-intercept of the linear fit to vary with , using the form:
| (2) |
where
| (3) |
| (4) |
To investigate the importance of the redshift evolution of the slope and normalization of our fits, we also provide fitting formulae where we fix combinations of these parameters across our redshift range. In particular we present one version of the fit where we fix the slope of the MZR by setting and another version of the fit where we fix both the slope and normalization by setting . Our best-fit parameters for all three versions of the fit are given in Table 1. The MZR for each analyzed galaxy along with the medians of each stellar mass bin and the three versions of the best-fit lines are plotted for all analyzed redshifts in Figure 1.
The agreement between our redshift-evolving fits and our fit with no evolution suggests weak redshift evolution of the MZR across our redshift range. Our Slope and Normalization Evolution fit is characterized by a decrease in slope and increase in normalization of the MZR with decreasing redshift. The effects of these changes, however, largely offset one another across our stellar mass range. From the Normalization Evolution version of our fit we find that, when holding the slope constant, the normalization of the MZR changes by only dex over our entire analyzed redshift range (). The evolution found in either of these models is within the level of inherent uncertainty in our data, as evidenced by their agreement with the No Evolution model. We therefore conclude that the MZR in our simulations is characterized by weak to no redshift evolution for .
We also find that the scatter of our relation tends to decrease with increasing stellar mass. For example, our lowest two stellar mass bins, centered below , have scatters between dex, while stellar mass bins centered above typically have scatter less than dex. Therefore, FIRE-2 simulations predict large scatter in the MZR at low stellar mass. We hypothesize that this is, in part, due to galaxies becoming less bursty relative to their stellar mass as their stellar mass increases. This explanation would be consistent with the fundamental metallicity relation (FMR) where the star-formation rate (or gas-fraction) acts as a secondary predictor for metallicity (Ellison et al., 2008; Mannucci et al., 2010). According to the FMR, smaller variance in star-formation rates at a given stellar mass would result in smaller scatter in the metallicities at that stellar mass. The scatter we predict at the low-mass end is much larger than predicted by Bassini et al. (2024) in their analysis of FIREbox simulations at , but it is not inconsistent with that study as the mass range where we predict increased scatter is below the mass limit of their analysis ( M⊙). There is also likely some redshift evolution of the scatter between and . We verified using FIRE-2 zoom-in simulations evolved to that the scatter in the MZR at increases significantly below the lower stellar mass limit used by Bassini et al. (2024) but is in agreement with their results above this limit. We do not find a clear redshift evolution trend of the scatter of the MZR at fixed stellar mass over our redshift range in FIRE-2.
3.2 Comparison with Observations
The advent of JWST has allowed for the measurement of significant samples of ISM metallicities at for the first time. JWST surveys have already made many metallicity measurements available for galaxies at much earlier redshift than previously feasible (e.g., Curti et al., 2023a; Nakajima et al., 2023). Bunker et al. (2023) present a direct based metallicity meaurement of GN-z11, a galaxy at , further demonstrating the observational power of JWST. With additional large samples of metallicity measurements from JWST on the way, it is timely that we verify the results of our simulations against current observations and make predictions for future observations. Here, we compare our best-fit MZR to observations already made available from JWST surveys.
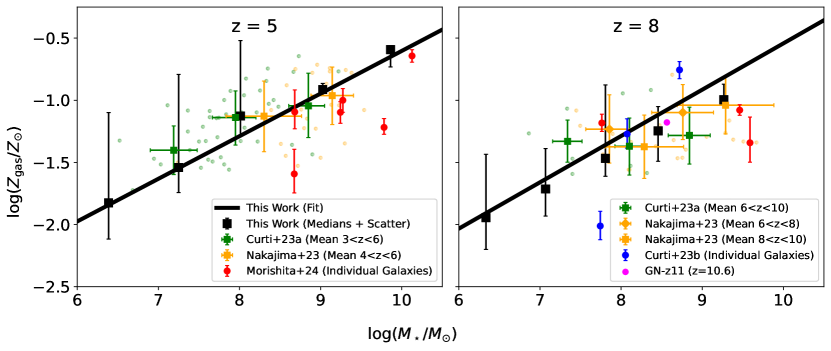
Curti et al. (2023a) and Nakajima et al. (2023) present metallicity measurements made by JWST’s Near Infrared Spectrograph (NIRSpec) Instrument of 146 and 135 galaxies, respectively, primarily using strong line methods. The sample from Nakajima et al. (2023) includes 10 direct, -based measurements. Curti et al. (2023a) include 4 direct, -based measurements, originally presented by either Bunker et al. (2023) or Curti et al. (2023b), which we also compare with individually. Galaxies analyzed in Curti et al. (2023a) have redshifts in the range and stellar masses in the range while galaxies in Nakajima et al. (2023) have redshifts and stellar masses . Each stellar mass-binned mean metallicity from these two works is in reasonably good agreement with our best-fit MZR. However, both works report a smaller slope in the observed MZR ( from Curti et al., 2023a and from Nakajima et al., 2023). Morishita et al. (2024) provide 9 additional gas-phase metallicity measurements of galaxies with redshifts made via the direct method. A comparison between the best-fit model presented in this work and recent high-z JWST observations of the MZR is shown in Figure 2. Additionally, Curti et al. (2023a) report a significant difference in normalization between the high-redshift MZR and the MZR in the local universe. The MZR is found to be offset by an average of dex and dex in the and redshift bins, respectively, as compared to the low-mass extrapolation of the MZR in the local universe presented by Curti et al. (2020). These findings support the notion that the MZR evolves significantly for and evolves weakly or not at all for . Nakajima et al. (2023) do not find significant evidence for evolution of the MZR over the redshift range .
Increasing scatter of the MZR with decreasing stellar mass is found in several observational works at lower redshift (e.g., Zahid et al. 2012 at , Guo et al. 2016 at ), qualitatively matching the trend we find in FIRE-2 at higher redshift. More recently, Li et al. (2023) find an increase in the scatter at the low-mass end of the MZR using a sample of 51 dwarf galaxies observed by JWST at . They quote intrinsic scatters in their MZR of dex and dex for stellar mass bins at and , respectively.
As shown in Figure 2, there are apparent quantitative inconsistencies between the scatter predicted by our model and the scatter observed by Curti et al. (2023a) and Nakajima et al. (2023). At lower stellar masses (), the scatter in the simulations is larger than that of the observations. This could be a result of strong line measurements of metallicity, which constitute the majority of these observational samples, systematically underestimating the scatter in the MZR. Strong line measurements are susceptible to predicting systematically low scatter since they rely on ratios between specific strong emission lines and do not take into account potential scatter in other parameters used to infer metallicities from these ratios. For example, it is possible for two different galaxies to have different metallicities yet have the same lie ratio (e.g, if the ionization state of the gas is different). A particular strong line calibration would then imply a single metallicity. At higher stellar masses (), the scatter is smaller in simulations than in observations. This could be because of the uncertainties present in observational methods that are not present in analysis of simulations.
3.3 Comparison with Other Theoretical Models
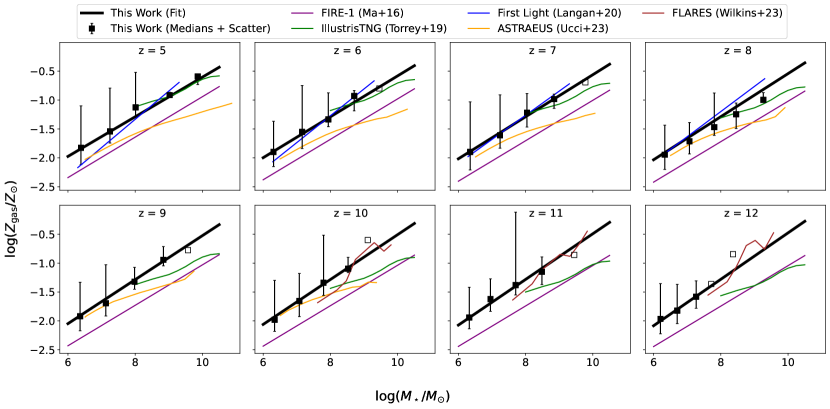
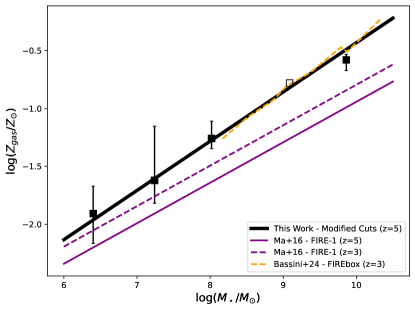
Some other cosmological and seminumerical simulation projects have analyzed the MZR at high redshift. We compare our work on the MZR in high-redshift FIRE-2 simulations to other theory-based work and discuss predictions for future observations. Figure 3 shows comparisons between the best-fit model presented in this work and other theoretical and simulation-based models.
The weak time evolution of the MZR we find at is consistent with previous results from FIRE-1 simulations reported by Ma et al. (2016), who predicted a flattening of the evolution of the MZR at high redshift. However, our best-fit model predicts metallicities approximately – dex higher than their best fit derived from FIRE-1 simulations. Bassini et al. (2024) find significant evolution in the MZR from in the FIREbox simulation, a full cosmological volume simulation that uses the physics of FIRE-2. In particular, the gas-phase metallicity at fixed stellar mass is found to increase with decreasing redshift over the range . Our best-fit MZR at is similar in normalization and slope to the FIREbox results at . We therefore conclude that the evolution of the MZR in FIRE-2 simulations is characterized by metallicity increasing with decreasing redshift for and by little to no evolution for at fixed stellar mass. A more complete comparison between this work and previous work on the MZR in FIRE simulations is provided in Appendix A.
Weak evolution of the MZR past has been found in some other simulation projects as well. Langan et al. (2020) report a slight increase in mean metallicity with increasing redshift in FirstLight simulations from . They do not, however, find this trend to be significant at a level beyond the intrinsic scatter of their data. Similarly, Ucci et al. (2023) characterize the MZR in ASTRAEUS, a seminumerical simulation project, as having effectively no redshift evolution from . The median metallicity of their low-mass galaxies () decreases very slightly ( dex) from to , while metallicities in their high-mass range () remain nearly constant over the redshift range. Wilkins et al. (2023) also find no significant evolution in the MZR for in FLARES. Torrey et al. (2019) report that, for IllustrisTNG simulations from , the normalization of the MZR decreases with increasing redshift while the slope is not a strong function of redshift. The evolution of the normalization in their simulations within their redshift range is given by . This evolution is stronger than the evolution found in FIRE-2 and other simulation projects.
3.4 Interpretation using Analytic Models
Multiple explanations for the weak evolution of the MZR beyond have been put forth. Torrey et al. (2019) find that the evolution of the MZR from to is explained by the evolution of the gas fraction through the gas-regulator model. The regulator model gives an approximate equilibrium metallicity of the form (e.g., Lilly et al., 2013)
| (5) |
where (often assumed to be ) is the metal yield (the mass of metals returned to the ISM per unit mass in formed, long-lived stars), is the metallicity of accreted gas, is the mass loading factor of galactic winds, where is a galaxy’s star formation rate, and is the version of the galactic gas fraction given by . However, Bassini et al. (2024) show that the evolution of the gas fraction does not drive the evolution of the MZR in FIREbox at lower redshifts (). Rather, an evolution in both the mass-loading factor and the metallicities of inflows and outflows at fixed stellar mass drive the decrease of the MZR with increasing redshift up to . In Appendix B we show there is substantial redshift evolution in the median gas fractions of our analyzed galaxies with redshift. This fact combined with the very weak evolution of the MZR over the same redshift range implies that the weak evolution of the high-redshift MZR is likely not explained solely by the evolution of the gas fraction in the gas-regulator model.
Other works have used idealized “closed box” or “leaky box” models to explain the weak evolution of the MZR at high redshift (e.g., Langan et al., 2020; Ma et al., 2016). In the “closed box” model, metallicity is given by
| (6) |
while in the “leaky box” model,
| (7) |
where is the version of the gas fraction given by and is the effective metal yield which is often calibrated to make the “leaky box” model best fit the data. In Appendix B we present median values of across our redshift range in different stellar mass bins. The difference between and quantifies the net impact of inflows and outflows on a galaxy’s metallicity. From this picture it has been argued that the weak evolution of the high-redshift MZR is due to values of that have saturated to unity and/or that evolve weakly at high redshift. Langan et al. (2020) find that a “leaky box” model with is able to explain the weak evolution of the MZR predicted by FirstLight simulations. However, with an effective yield that is an order of magnitude lower than the intrinsic stellar yield (), this model concedes that the impact of inflows and outflows is crucial. Ma et al. (2016) also found that a “closed box” model systematically over-predicts metallicities in FIRE-1 simulations, also due to the large effects of inflows and outflows (i.e. is significantly smaller than ). Thus, weakly evolving gas fractions are at best an incomplete explanation for the weak evolution of the MZR at high redshift. It would be interesting to perform an analysis similar to that done by Bassini et al. (2024) to quantify explicitly the effects of gas fractions, inflow/outflow metallicities, and mass-loading factors on the evolution of the MZR.
4 Discussion and Conclusions
We characterize the high-redshift gas-phase MZR in FIRE-2 simulations. We find that the MZR from in these simulations is an approximately constant power-law relation given by . Weak evolution of the high-redshift MZR has been found in numerous other simulations (e.g., FirstLight (Langan et al., 2020), ASTRAEUS (Ucci et al., 2023), FLARES (Wilkins et al., 2023)), with stronger evolution being found in IllustrisTNG (Torrey et al., 2019). Combining our work with the analysis of the MZR in FIREbox (also run with the FIRE-2 code) from Bassini et al. (2024), we find that the normalization of the MZR in FIRE-2 decreases by dex from and evolves weakly for .
Our best-fit MZR is in good agreement with early measurements of the MZR at made by JWST. In particular, our results are in agreement with the mean stellar mass and redshift binned results from high-redshift surveys presented by Curti et al. (2023a) and Nakajima et al. (2023). These same simulations have also been tested against the JWST UVLF by Sun et al. (2023a, b). These agreements validate FIRE-2 as a useful predictive tool for future observations as JWST continues to expand the probed parameter region of metallicity scaling relations.
We also predict increasing scatter in the gas-phase MZR with decreasing stellar masses. This effect may be attributable to galaxies becoming more bursty as their stellar mass decreases.
Future work will explore the existence of the fundamental metallicity relation (FMR) in FIRE simulations. In addition to stellar mass, the FMR suggests gas mass fraction or star formation rate as secondary predictors for metallicity (Ellison et al., 2008; Mannucci et al., 2010). A comprehensive study on the effects of evolving gas fractions, mass loading factors, and inflow/outflow metallicities on ISM metallicities, similar to the work done by Bassini et al. (2024) at , would be valuable to explain the evolution or lack of evolution in metallicity scaling relations at high redshift. Beyond gas-phase metallicities, which probe the current enrichment conditions of the ISM, future work may also investigate stellar-phase metallicity scaling relations, which provide information on integrated chemical enrichment histories of galaxies. Future analysis of the scaling relations for individual metal species tracked in FIRE simulations will allow us to make predictions for observations of individual chemical abundances made by JWST. Finally, another emerging area of study which our simulations could inform is the measurement of metallicity gradients (radial dependence of metallicity) at high redshift. Metallicity gradients serve as a probe for the larger processes that drive galaxy evolution in the high-redshift regime. These processes include large galactic inflows or merger events that drive bursts of star formation, generating strong feedback capable of flattening metallicity gradients, disrupting galaxy kinematics, and driving outflows. Studying the dispersal of metals from galaxies into the intergalactic medium (IGM) will allow us to draw connections between IGM metallicity and galaxies during the epoch of reionization probed by JWST (Bordoloi et al., 2023).
Acknowledgements
The authors thank Allison Strom and Luigi Bassini for useful discussions. GS was supported by a CIERA Postdoctoral Fellowship. CAFG was supported by NSF through grants AST-2108230, AST-2307327, and CAREER award AST-1652522; by NASA through grants 17-ATP17-0067 and 21-ATP21-0036; by STScI through grants HST-GO-16730.016-A and JWST-AR-03252.001-A; and by CXO through grant TM2-23005X. The Flatiron Institute is supported by the Simons Foundation. RF acknowledges financial support from the Swiss National Science Foundation (grant nos PP00P2-194814 and 200021-188552). The simulations analyzed in this work were run on XSEDE computational resources (allocations TG-AST120025, TG AST130039, TG-AST140023, and TG-AST140064). Analysis was done using the Quest computing cluster at Northwestern University.
References
- Anders & Grevesse (1989) Anders, E., & Grevesse, N. 1989, Geochim. Cosmochim. Acta, 53, 197, doi: 10.1016/0016-7037(89)90286-X
- Bassini et al. (2024) Bassini, L., Feldmann, R., Gensior, J., & Faucher-Giguère, C. A. 2024, MNRAS
- Bordoloi et al. (2023) Bordoloi, R., Simcoe, R. A., Matthee, J., et al. 2023, arXiv e-prints, arXiv:2307.01273, doi: 10.48550/arXiv.2307.01273
- Bryan & Norman (1998) Bryan, G. L., & Norman, M. L. 1998, ApJ, 495, 80, doi: 10.1086/305262
- Bunker et al. (2023) Bunker, A. J., Saxena, A., Cameron, A. J., et al. 2023, arXiv e-prints, arXiv:2302.07256, doi: 10.48550/arXiv.2302.07256
- Colbrook et al. (2017) Colbrook, M. J., Ma, X., Hopkins, P. F., & Squire, J. 2017, MNRAS, 467, 2421, doi: 10.1093/mnras/stx261
- Curti et al. (2020) Curti, M., Mannucci, F., Cresci, G., & Maiolino, R. 2020, MNRAS, 491, 944, doi: 10.1093/mnras/stz2910
- Curti et al. (2023a) Curti, M., Maiolino, R., Carniani, S., et al. 2023a, arXiv e-prints, arXiv:2304.08516, doi: 10.48550/arXiv.2304.08516
- Curti et al. (2023b) Curti, M., D’Eugenio, F., Carniani, S., et al. 2023b, MNRAS, 518, 425, doi: 10.1093/mnras/stac2737
- Ellison et al. (2008) Ellison, S. L., Patton, D. R., Simard, L., & McConnachie, A. W. 2008, ApJ, 672, L107, doi: 10.1086/527296
- Erb et al. (2006) Erb, D. K., Shapley, A. E., Pettini, M., et al. 2006, ApJ, 644, 813, doi: 10.1086/503623
- Escala et al. (2018) Escala, I., Wetzel, A., Kirby, E. N., et al. 2018, MNRAS, 474, 2194, doi: 10.1093/mnras/stx2858
- Feldmann et al. (2023) Feldmann, R., Quataert, E., Faucher-Giguère, C.-A., et al. 2023, MNRAS, 522, 3831, doi: 10.1093/mnras/stad1205
- Gill et al. (2004) Gill, S. P. D., Knebe, A., & Gibson, B. K. 2004, MNRAS, 351, 399, doi: 10.1111/j.1365-2966.2004.07786.x
- Guo et al. (2016) Guo, Y., Koo, D. C., Lu, Y., et al. 2016, ApJ, 822, 103, doi: 10.3847/0004-637X/822/2/103
- Henry et al. (2013a) Henry, A., Martin, C. L., Finlator, K., & Dressler, A. 2013a, ApJ, 769, 148, doi: 10.1088/0004-637X/769/2/148
- Henry et al. (2013b) Henry, A., Scarlata, C., Domínguez, A., et al. 2013b, ApJ, 776, L27, doi: 10.1088/2041-8205/776/2/L27
- Hopkins (2015) Hopkins, P. F. 2015, MNRAS, 450, 53, doi: 10.1093/mnras/stv195
- Hopkins et al. (2014) Hopkins, P. F., Kereš, D., Oñorbe, J., et al. 2014, MNRAS, 445, 581, doi: 10.1093/mnras/stu1738
- Hopkins et al. (2018) Hopkins, P. F., Wetzel, A., Kereš, D., et al. 2018, MNRAS, 480, 800, doi: 10.1093/mnras/sty1690
- Hopkins et al. (2023) Hopkins, P. F., Wetzel, A., Wheeler, C., et al. 2023, MNRAS, 519, 3154, doi: 10.1093/mnras/stac3489
- Knollmann & Knebe (2009) Knollmann, S. R., & Knebe, A. 2009, ApJS, 182, 608, doi: 10.1088/0067-0049/182/2/608
- Kroupa (2001) Kroupa, P. 2001, MNRAS, 322, 231, doi: 10.1046/j.1365-8711.2001.04022.x
- Langan et al. (2020) Langan, I., Ceverino, D., & Finlator, K. 2020, MNRAS, 494, 1988, doi: 10.1093/mnras/staa880
- Lee et al. (2006) Lee, H., Skillman, E. D., Cannon, J. M., et al. 2006, ApJ, 647, 970, doi: 10.1086/505573
- Leitherer et al. (1999) Leitherer, C., Schaerer, D., Goldader, J. D., et al. 1999, ApJS, 123, 3, doi: 10.1086/313233
- Lequeux et al. (1979) Lequeux, J., Peimbert, M., Rayo, J. F., Serrano, A., & Torres-Peimbert, S. 1979, A&A, 80, 155
- Li et al. (2023) Li, M., Cai, Z., Bian, F., et al. 2023, ApJ, 955, L18, doi: 10.3847/2041-8213/acf470
- Lilly et al. (2013) Lilly, S. J., Carollo, C. M., Pipino, A., Renzini, A., & Peng, Y. 2013, ApJ, 772, 119, doi: 10.1088/0004-637X/772/2/119
- Ma et al. (2016) Ma, X., Hopkins, P. F., Faucher-Giguère, C.-A., et al. 2016, MNRAS, 456, 2140, doi: 10.1093/mnras/stv2659
- Ma et al. (2018a) Ma, X., Hopkins, P. F., Boylan-Kolchin, M., et al. 2018a, MNRAS, 477, 219, doi: 10.1093/mnras/sty684
- Ma et al. (2018b) Ma, X., Hopkins, P. F., Garrison-Kimmel, S., et al. 2018b, MNRAS, 478, 1694, doi: 10.1093/mnras/sty1024
- Ma et al. (2019) Ma, X., Hayward, C. C., Casey, C. M., et al. 2019, MNRAS, 487, 1844, doi: 10.1093/mnras/stz1324
- Maier et al. (2014) Maier, C., Lilly, S. J., Ziegler, B. L., et al. 2014, ApJ, 792, 3, doi: 10.1088/0004-637X/792/1/3
- Maiolino et al. (2008) Maiolino, R., Nagao, T., Grazian, A., et al. 2008, in Astronomical Society of the Pacific Conference Series, Vol. 396, Formation and Evolution of Galaxy Disks, ed. J. G. Funes & E. M. Corsini, 409
- Mannucci et al. (2010) Mannucci, F., Cresci, G., Maiolino, R., Marconi, A., & Gnerucci, A. 2010, MNRAS, 408, 2115, doi: 10.1111/j.1365-2966.2010.17291.x
- Mannucci et al. (2009) Mannucci, F., Cresci, G., Maiolino, R., et al. 2009, MNRAS, 398, 1915, doi: 10.1111/j.1365-2966.2009.15185.x
- Marszewski et al. (in prep.) Marszewski, A., Sun, G., & Faucher-Giguère, C.-A. in prep.
- Morishita et al. (2024) Morishita, T., Stiavelli, M., Grillo, C., et al. 2024, arXiv e-prints, arXiv:2402.14084, doi: 10.48550/arXiv.2402.14084
- Nakajima et al. (2023) Nakajima, K., Ouchi, M., Isobe, Y., et al. 2023, arXiv e-prints, arXiv:2301.12825, doi: 10.48550/arXiv.2301.12825
- Pallottini et al. (2022) Pallottini, A., Ferrara, A., Gallerani, S., et al. 2022, MNRAS, 513, 5621, doi: 10.1093/mnras/stac1281
- Planck Collaboration et al. (2020) Planck Collaboration, Aghanim, N., Akrami, Y., et al. 2020, A&A, 641, A6, doi: 10.1051/0004-6361/201833910
- Sanders et al. (2015) Sanders, R. L., Shapley, A. E., Kriek, M., et al. 2015, ApJ, 799, 138, doi: 10.1088/0004-637X/799/2/138
- Steidel et al. (2014) Steidel, C. C., Rudie, G. C., Strom, A. L., et al. 2014, ApJ, 795, 165, doi: 10.1088/0004-637X/795/2/165
- Sun et al. (2023a) Sun, G., Faucher-Giguère, C.-A., Hayward, C. C., & Shen, X. 2023a, arXiv e-prints, arXiv:2305.02713, doi: 10.48550/arXiv.2305.02713
- Sun et al. (2023b) Sun, G., Faucher-Giguère, C.-A., Hayward, C. C., et al. 2023b, arXiv e-prints, arXiv:2307.15305, doi: 10.48550/arXiv.2307.15305
- Torrey et al. (2019) Torrey, P., Vogelsberger, M., Marinacci, F., et al. 2019, MNRAS, 484, 5587, doi: 10.1093/mnras/stz243
- Tremonti et al. (2004) Tremonti, C. A., Heckman, T. M., Kauffmann, G., et al. 2004, ApJ, 613, 898, doi: 10.1086/423264
- Ucci et al. (2023) Ucci, G., Dayal, P., Hutter, A., et al. 2023, MNRAS, 518, 3557, doi: 10.1093/mnras/stac2654
- Wilkins et al. (2023) Wilkins, S. M., Vijayan, A. P., Lovell, C. C., et al. 2023, MNRAS, 519, 3118, doi: 10.1093/mnras/stac3280
- Yabe et al. (2014) Yabe, K., Ohta, K., Iwamuro, F., et al. 2014, MNRAS, 437, 3647, doi: 10.1093/mnras/stt2185
- Yang et al. (2023) Yang, S., Lidz, A., Smith, A., Benson, A., & Li, H. 2023, MNRAS, 525, 5989, doi: 10.1093/mnras/stad2571
- Zahid et al. (2012) Zahid, H. J., Bresolin, F., Kewley, L. J., Coil, A. L., & Davé, R. 2012, ApJ, 750, 120, doi: 10.1088/0004-637X/750/2/120
- Zahid et al. (2013) Zahid, H. J., Geller, M. J., Kewley, L. J., et al. 2013, ApJ, 771, L19, doi: 10.1088/2041-8205/771/2/L19
- Zahid et al. (2011) Zahid, H. J., Kewley, L. J., & Bresolin, F. 2011, ApJ, 730, 137, doi: 10.1088/0004-637X/730/2/137
Appendix A Comparison with Previous FIRE Work
In comparing to previous work on the MZR from FIRE simulations, we find a significant (– dex) offset between the MZR in this work and that from FIRE-1 presented by Ma et al. (2016). To investigate this offset we perform an analysis of the MZR where we match the temperature and radial cuts on the gas particles included in our analysis with those made by Ma et al. (2016). These cuts include all gas with temperature below K within of the galaxy’s center (throughout this paper we have considered all gas within ). The results of this analysis are shown in Figure 4. The change in cuts on the gas does not appreciably change our results and the offset between the FIRE-1 result and this work remains. We elect not to investigate the cause of this offset as FIRE-2 implemented a large number of improvements and changes that could impact the metal enrichment of the ISM as well as the driving of inflows and outflows (see Hopkins et al. 2018).
We additionally compare this work with a recent study of the MZR by Bassini et al. (2024) based on the FIREbox simulation. While we utilize slightly different cuts (they consider all gas within ), we find very close agreement between the MZR at our lowest redshift analyzed () and their highest redshift analyzed (). This agreement suggests the absence of significant evolution in the MZR in FIRE-2 simulations for .
Appendix B Evolving Gas Fractions
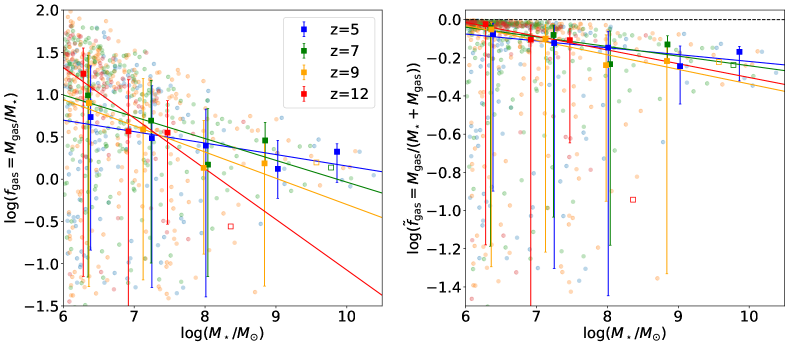
Previous works have used galaxies’ gas fractions to explain the evolution of the MZR using either gas-regulator models or “closed/leaky box” models. In the gas-regulator model we define the gas fraction to be , where and are the total gas mass and stellar mass within of the center of a galaxy, respectively. Previous works have used the redshift evolution of galaxies’ gas fractions to explain the evolution of the MZR for . However, Bassini et al. (2024) show that evolving gas fractions are not responsible for the evolving MZR in this redshift range in the FIREbox simulation. Rather, the redshift dependence on the metallicities of gas inflows and outflows as well as the evolution of the mass loading factor drive the evolution of the MZR at lower redshifts. Other works have cited weak evolution of gas fractions at high redshift as being responsible for weak evolution of the high-redshift () MZR (e.g., Torrey et al., 2019). The left panel of Figure 5 presents stellar mass-binned gas fractions from our simulations that vary substantially with redshift and in a mass-dependent way, indicating that gas fractions alone cannot explain the weakly evolving high-redshift MZR.
In the “closed box” or “leaky box” models, we define a second version of the gas fraction as . The right panel of Figure 5 shows values of in our simulated galaxies. The saturation of to unity and/or its weak evolution at high redshift has been used to explain the weak evolution in the MZR for (e.g., Ma et al., 2016; Langan et al., 2020). However, both of these works find that, in order for their simulation data to be well-fit by a ”leaky box” model, they must use an effective stellar yield () that is much smaller than the intrinsic stellar yield (). The significantly smaller value of implies that there is a large net impact of inflows and outflows on metallicities. Thus, the weak evolution of the MZR at high redshift cannot be attributed to saturated or weakly evolving values of alone and must take into account the larger effects of inflows and outflows.
Appendix C Alternative Calculations of Metallicities
Throughout this work we define a galaxy’s gas-phase metallicity to be the mass-weighted mean metallicity of all gas particles within of the galaxy’s center. Here, we investigate the effects of using alternative cuts on the gas particles included in our analysis. We consider a smaller radial cut on our galaxy (). We also present a version of our analysis with radial and temperature cuts that exactly match those used by Ma et al. (2016) in their analysis of the MZR in FIRE-1 ( and K). Applying either of these cuts does not appear to have a significant effect on our resulting MZR. We ultimately elect to use as our radial cut due to the tendency of high-redshift galaxies to have more spatially extended stellar populations relative to their virial radii as compared to galaxies at lower redshift. We also choose to not include a temperature cut on our gas as this cut would eliminate a significant number of galaxies from our sample.
We also consider weighting gas particles by their star formation rate property rather than by their mass when calculating a galaxy’s metallicity. This SFR-weighting scheme does not have a significant impact on our calculated MZR and likely introduces a bias by removing galaxies with no star-forming gas from our sample. We therefore elect to use mass-weighted metallicities. A comparison between the MZR calculated using our fiducial method and the MZR calculated using the alternative cuts and the SFR-weighting method is shown in Figure 6.