[orcid=0000-0002-9497-3254] \creditConceptualization, Methodology, Software, Formal analysis, Investigation, Writing - Original Draft, Visualization, Data Curation
[orcid=0000-0001-5841-7181] \creditSimulations, Formal analysis, Visualization
[orcid=0000-0002-5578-2551] \creditDesign of MD simulations
[orcid=0000-0002-0835-0086] \creditConceptualization, Investigation, Writing - Review & Editing, Project coordination, Funding acquisition, Resources, Data Curation
[1] \fnmark[1]
1]organization=PULS Group, Institute for Theoretical Physics, FAU Erlangen-Nürnberg, addressline=Cauerstraße 3, postcode=91058, city=Erlangen, country=Germany
2]organization=Group of Computational Life Sciences, Department of Physical Chemistry, Ruđer Bošković Institute, addressline=Bijenička 54, city=Zagreb, postcode=10000, country=Croatia
[1]Ana-Sunčana Smith \fntext[1]Tel: +49 91318570565; Fax: +49 91318520860
Criticality in an imidazolium ionic liquid fully wetting a sapphire support
Abstract
Hypothesis:
Ionic liquids have various applications in catalytic reaction environments. In those systems, their interaction with interfaces is key to their performance as a liquid phase. We hypothesize that the way a monolayer ionic liquid phase interacts with interfaces like a sapphire substrate is significantly dependent on temperature and that critical behavior can be observed in the structural properties of the liquid film.
Methods and simulations:
We perform molecular dynamics simulations of imidazolium-based ionic liquid monolayers deposited on a sapphire substrate at temperatures from to . We develop computational tools to analyze structural properties of molecular arrangement in the monolayer, the structure of the film and the defects spontaneously forming and healing.
Findings:
We observe a clear structural phase transition at around from a solid-like to a liquid-like behavior of a film. Below the critical point an alternating crystalline structure of cations and anions with alignment of periodic vectors with the underlying substrate grid is observed, with frozen defects. Above the critical temperature, the pattern becomes isotropic within the contact layer that displays dynamic defects of a characteristic size. Our results highlight the importance of confinement to the phase behavior of the system.
keywords:
wetting \sepmolecular liquids \sepmonolayer film \sepionic liquids \sepphase transition \sepstructure![[Uncaptioned image]](/html/2403.08449/assets/figures/graphical_abstract/graphical_abstract_monolayer.png)
1 Introduction
Ionic liquids (ILs) are molten salts whose liquid state spans a wide temperature range including room temperature [1]. The charged nature of their ionic molecular constituents makes Coulomb interactions a major influence on their behavior and structure. Their liquid state at room temperature is a consequence of these Coulomb interactions competing with geometrical constraints preventing the formation of a regular and rigid crystal grid due to the sizes of the involved ions. Based on these chemical and structural properties, they have wide applications in various industrial scenarios [2]. In addition to their use as lubricants [3, 4, 5] and in chemical reaction engineering [1, 6, 7, 8], they have also been employed as an electrolyte [9, 10].
For most applications, in addition to the liquid state and the highly polar nature of ILs, the presence of a solid supporting the liquid phase is of vital importance. Specific examples include the surfaces of catalysts involved in chemical reactions such as the supported ionic liquid phase (SILP) [11] or the solid catalyst with ionic liquid layer (SCILL) systems [12]. The importance of the support, whether functional or not, emerges due to the strong interfacial structuring of ILs due to adhesive forces, the intensity of which depends on the nature of the interactions between IL ions and the exposed surface layer. Ultimately, these interactions determine the wetting behavior of the IL [13], the mobility of the ions and the reactants [14], and may affect reaction rates.
On neutral surfaces like fully hydroxylated alumina, IL adsorption is mainly governed by the formation of hydrogen bonds leading to a coupling between the liquid layer structure and the underlying substrate [15, 13]. In films thicker than , this leads to several well defined solvation shells propagating towards the bulk of IL [16, 17, 13, 18, 19, 20]. In thin films, it has been shown that the organization of the film depends on the film thickness, while the structure of the contact layer could be investigated in appreciable detail using a variety of experimental techniques [2, 21, 22, 23, 24].
For example, with regard to the wetting process of gold and platinum surfaces by [C1C1Im][NTf2], characteristic changes in the monolayer structure could be measured depending on the degree of surface saturation [25] as well as depending on the temperature of the system [26, 25]. At low temperatures with an unsaturated surface, the formation of islands of the IL film on the substrate was observed with overall hexagonal and occasionally striped crystalline patterns of anion distribution. Further analysis showed that the crystalline-like phase can also be stabilized in an IL bilayer. However, a precise analysis of the structural phase transition in these monolayer systems was limited by the resolution of the imaging method and the lack of information on the cation distribution. Nonetheless, this ensemble of work pointed out the importance of the thermodynamic conditions and the amount of IL deposited per unit surface area for the emergent patterns.
The issue of the resolution can be resolved and the full understanding of the organization of IL ultra-thin films can be obtained in molecular dynamics (MD) simulations, yet the organization of such ultra-thin films has been studied only sparsely using computational methods [27]. In this publication, we therefore focus on MD simulations and study the effects of temperature and saturation on the organisation of IL monolayers. Our system of choice is [C2Mim][NTf2] deposited on a hydroxylated sapphire crystal, as a paradigmatic example of a setting where full wetting is expected. While focusing on the characterization of the structural properties of the films with a thickness of as little as one molecular layer, we show that the temperature affects the balance between cohesive and adhesive forces acting on the films’ constituents, causing different morphological and periodic behavior never before unraveled at this level of detail.
2 Simulation protocols
The simulations of monolayers were executed in GROMACS 5.1.2 [29]. The IL was built from [C2Mim]+ and [NTf2]- ions for which the force field parameters and charges were taken from previous work [13, 28, 14]. As suggested in these publications, to recover the experimentally validated organization of the sapphire-IL interface, all atomic charges of IL ions had to be scaled by a factor of , while the van der Waals interactions between the IL and the sapphire were calculated using the Lorentz-Berthelot rules. The sapphire was parameterized using the CLAYFF force field [30], fully hydroxylated using previously developed parameters [18] and optimized with GULP [31].
All simulations were performed using periodic boundary conditions with a monoclinic geometry, to respect the symmetry of the crystal. We systematically use a time step of and a cut-off of for the van der Waals and short-range Coulomb interactions, while the Particle Mesh Ewald procedure was employed for the description of the long-range Coulomb interactions. Periodic copies of the slabs of alumina with the IL film were systematically separated by an vacuum slab to eliminate long-range Coulomb forces that could affect the interfaces. The desired temperature was maintained with the Nose-Hoover thermostat.
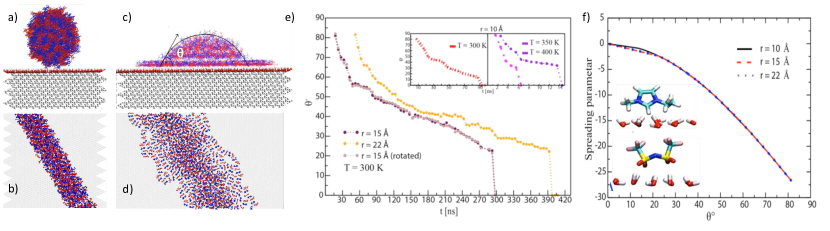
Full monolayers were created in wetting simulations. For those, we start with a box of a fully equilibrated bulk liquid at the desired temperature [13, 28, 14]. From this box, using VMD, we extract nanodroplets that are circular in the plane (, ion pairs), while in the plane the droplet is positioned to follow the crystal axis ( see fig. 1a+b). After putting the droplet in close proximity of the sapphire slab ( in , and directions), the wetting simulation is performed in the NVT ensemble (fig. 1c+d), at temperatures of , , and for a typical duration of . The effect of the cylinder size was tested at , where additional nanodroplets of radius , and were carved and their full spreading was simulated for and respectively. An additional simulation of a nanodroplet of rotated by was performed at to quantify the sensitivity to the initial spreading direction. For all droplet sizes at , the spreading process followed a universal curve of the spreading parameter , defined as
This makes a function of the time dependent, effective droplet contact angle (fig. 1e) as well as the surface tension . The evolution of (fig. 1f), shows the insensitivity of the wetting process to the initial conditions. Once the monolayers were obtained, a run in the NVT ensemble was performed for equilibration. The ensuing production run for the analysis of the monolayer structure was performed for up to .
An alternative procedure was also established to verify that the structure of the monolayers does not depend on the protocol with which they were created, and to investigate systems at temperatures at and below, where spreading is very slow. Specifically, monolayers were created starting from a thick ionic liquid film of pairs of [C2Mim]+ and [NTf2]- ions deposited on a sapphire spanning in directions [14]. The system was constructed from a box of equilibrated IL placed on top of the sapphire, re-equilibrated to the temperature of using semi-isotropic annealing along the axis in NPT[13], followed by an at least NVT run. After the thick film was created at , all but the first molecular layer of the IL film was removed. This resulted in ion pairs on the sapphire surface which was, consequently, extended along the -axis, to obtain an dimension of , and thus, a low level of surface saturation. The monolayer was again equilibrated, and treated as described above.
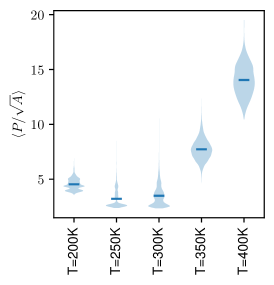
We furthermore calculate the potential of mean force (PMF) that an ion pair in the monolayer experiences. This was achieved by pulling away the center of mass (COM) of an ion pair (or an ion) from a fully equilibrated monolayer in a direction perpendicular to the surface of the monolayer i.e. along the -axis. Sampling is achieved by first performing a pull during which the COM is attached to a virtual particle (spring constant of ) moving at a constant velocity of . From the obtained trajectory, we extract configurations, wherein each successive configuration features the COM separated from the surface by an additional along the axis. At larger distances, configurations are, furthermore, extracted for which the separation between successive COMs is increased to . These configurations are used for umbrella sampling, with a force constant of applied to configurations distant from the surface, whereas a value of was employed for configurations near the surface, in total covering separations of from the positions within the monolayer. Each sampling configuration was propagated for . Data from the first were omitted from the analysis. The weighted histogram analysis method (WHAM) was used to to obtain unbiased PMFs.
3 Interactions of ions with the hydroxylated sapphire surface
We first explore the interactions of the ions with the surface. In agreement with previous work [18, 13], we find that the interaction with the substrate is promoted by hydrogen bonds that are formed between the oxygen of the hydroxyl groups and the hydrogen on the C2 atom of the imidazole ring (see inset of fig. 1e). Meanwhile, the anion, predominantly in its cis-conformation, forms hydrogen bonds with its four oxygens pointing towards the surface.
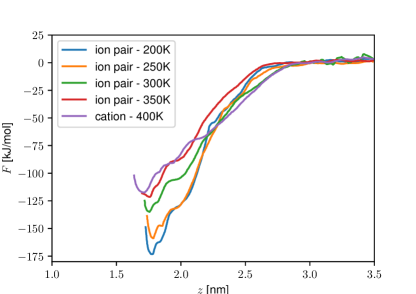
During our calculations of the PMF in the temperature range , we observe that pulling one ion type necessarily results in the extraction of an anion-cation pair, irrespective of the applied force constant or of the pull velocity. This is a consequence of strong cohesive Coulomb forces. Only at , the cation could be pulled without accompanying anion, as shown in the Figure fig. 2. Consequently, for the calculation of the PMF at below , we opted to constrain the COM of an anion pair, whereas at we only constrained the COM of a single cation.
The resulting PMFs show a deep minimum of about at (see fig. 2) that up to still persists at about , as a consequence of the hydrogen bonding, and the cohesion forces with other ions in the film Such strong forces at all temperatures promote the complete wetting of the hydroxylated sapphire interface and the formation of pure monolayers.
4 The effects of temperature on the organization of IL monolayers
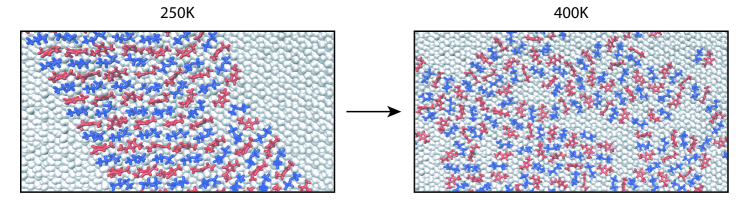
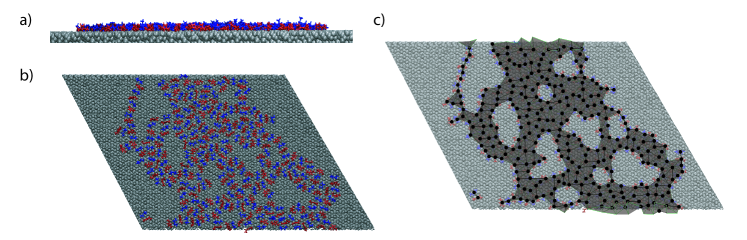
We now consider the spatial distribution of ion pairs in the IL on top of the solid substrate. From visual inspection of the trajectory alone we observe a clear alternating pattern of cations and anions aligned with the axis of symmetry of the sapphire at low temperatures. This is contrasted by an isotropic, but still alternating pattern at higher temperatures (see fig. 3).
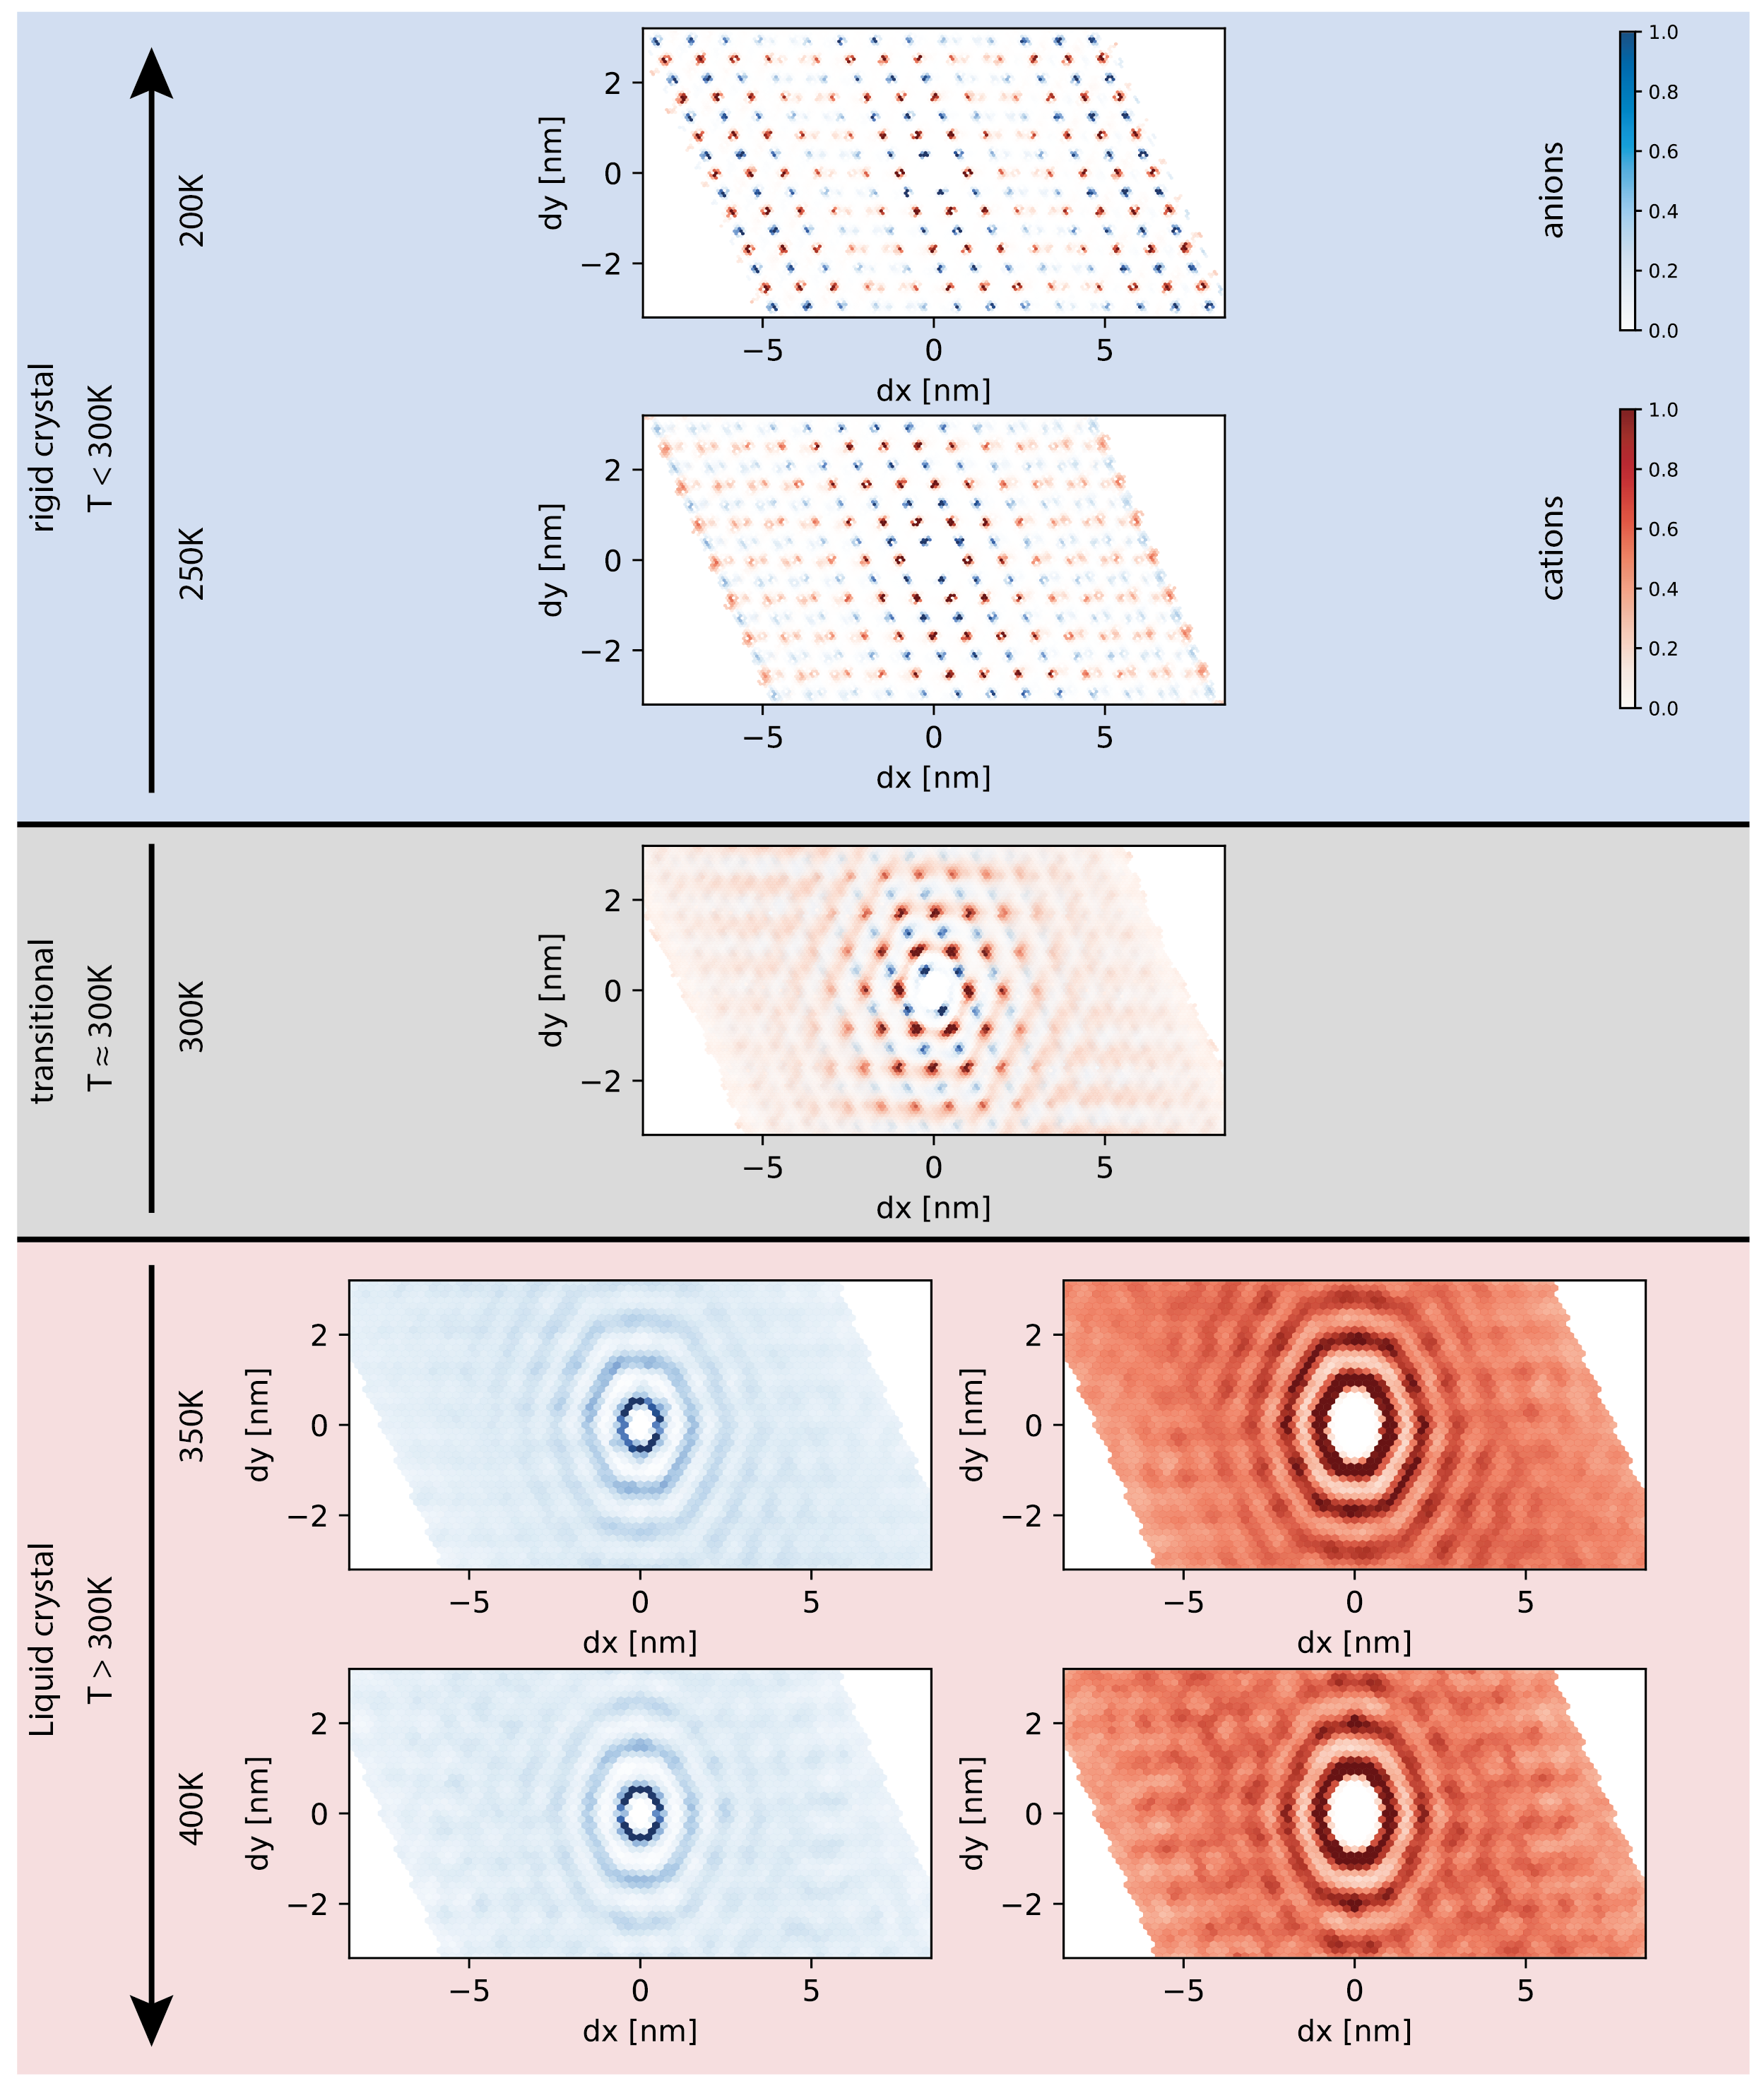
To quantify this heuristic observation, we extract the normalized relative density distribution in the -plane (2Drdf) and compare its appearance at various temperatures (see fig. 4). The 2Drdf is obtained by calculating the spatial distribution of the COM position of all cations or anions relative to an initial cation, averaged over all possible initial cations and all frames in the production run (code available on https://github.com/puls-group/monolayer_analysis and [32]). The distributions are binned by decomposing the positions into coefficients in the basis of the period bounding box of the system within the --plane and restricting these coefficients to the interval . In the next step, the relative positions are binned in squares on a two-dimensional grid with and of side length. Because the monolayer has the appearance of an infinite strip along the axis, we normalize the distribution along the -axis using a rescaling factor of , where denotes the finite width of the film in -direction, which allows us to compare different axes. We furthermore, normalize the distributions to 1 at their maximums to allow for better visibility.
At low temperatures (, top panels in fig. 4), the relative distribution function confirms the observation of alternating cation and anion positioning along the axis, with stripes of like-charged ions along the -axis. The pattern further confirms a strong directionality of the ion distribution with two intercalated distorted hexagonal lattices, one for each ion type.
In contrast to experiments with [C1Mim][NTf2] on Au(111) surfaces [26], where a mismatch of the alignment between the liquid layer and the substrate has been reported, we observe long-range order appearing at temperatures below very clearly aligned with the periodicity vectors of the underlying sapphire surface, due to the distribution of hydroxyl moieties. In this regime, we find correlations spanning our entire IL, with nearly no movement of the ions on the surface. This highlights the importance of strong adhesion forces as a consequence of the formation of hydrogen bonds [18]. The impact of hydrogen bonds on the structure of a monolayer has also recently been reported on a graphite surface, where the hydrogen bond network led to the formation of a checkerboard pattern [33].
At the rigid periodic structure of the IL monolayer appears to mallow and the directional distribution is beginning to be smeared out into a more and more isotropic (i.e., radially symmetric) distribution (see fig. 4). The peaks in the distribution of both cations and anions start to connect, with strong correlations spanning only the 4 to 5 closest neighbors. At this point, the increased thermal excitation is able to overcome the adhesive forces fixing the ions to specific positions on the hydroxylated sapphire surface. This allows them to hop between the surface interaction sites more frequently, while still being adsorbed to the interface.
At temperatures at and above we observe a fully isotropic, i.e., direction-independent distribution of cations and anions around the reference cation (see fig. 4). The in-plane correlation length between ions decreases further at higher temperatures, as is expected. This can be quantified in terms of the number of visible peaks in the radial distributions dropping from 3 or 4 at to between 2 and 3 rings being visible at . Notably, the circular peaks in the distributions of anions and cations respectively as visualized in fig. 4 continue to exhibit alternating patterns between different ion species as a consequence of the Coulomb attraction between different and the repulsion between similar ion species. However, at the imposed density of IL ions, the adhesive forces to the sapphire still dominate, thus preventing the spontaneous formation of bi-layers, previously observed on Au(111) surfaces at only [26].
These insights show that there exists a temperature threshold, below which the structure of the IL monolayer is mostly governed by the adhesive forces between the substrate and the liquid molecules. In contrast, above it the structure is mainly determined by IL-internal Coulomb interactions and overall film-internal cohesive forces. According to our results, this critical threshold for [C2Mim][NTf2] and the hydroxylated sapphire surface with low surface saturation is clearly situated at or around room temperature.
5 Film morphology and defects
We want to further quantify the impact that this structural phase transition has on the topology and morphology of the observed films as well as the defects forming therein, as the melting of the crystaline-like phase takes place. For this purpose, we analyze the precise shape and structure of the liquid layer within each frame. In short, we first build a two-dimensional planar graph of the IL molecules in a periodic geometry, where we connect pairs of molecules that find themselves within a threshold distance using custom-made code provided at https://github.com/puls-group/monolayer_analysis and in the ZENODO Archive [32]. Then, we identify the outside edge of the film and the inner boundaries of defects in the film layer (see fig. 5c for a visualization of a graph representation). We then analyze the properties of the resulting constructed film and its defects, as detailed in the following sections.
5.1 Establishing the analysis procedure
5.1.1 Graph construction from MD data
To construct a graph from a snapshot of an IL film, each center of mass (COM) of a molecule was represented by a vertex and an edge was drawn between two vertices if their distance was below a threshold . During construction, COMs of molecules are added in the order of their appearance in the trajectory file. For each newly added entry, all pre-existing COMs with a distance less than are determined and an attempt to insert a direct connecting edge is made. If that edge crosses an existing edge, the attempt is aborted to keep the graph planar. Once the vertices are all part of the graph, the faces of the graph are detected by following the faces surrounding the edge in a clockwise-oriented fashion. In doing so, inner faces of the film are detected in the correct (clockwise) orientation, whereas outer faces of the graph are found in the opposite (counter-clockwise) orientation or through the necessity of periodic copies of vertices to close their outline.
Based on our analysis of the 2Drfs of the IL molecules at various temperatures (see fig. 4), we chose as the threshold distance for connecting vertices. This captures only the first two layers of the surrounding ions in all systems. The choice of to be further than just the very first alternate charge layer’s distance around a molecule guarantees that even without all connections being drawn, the graph of a film is correctly constructed, including the detection of holes within the film. Furthermore, this procedure allows us to find chains of molecules on the surface and to discern between disconnected droplets of IL which form occasionally at higher temperatures.
5.1.2 Morphological measures
With the graph of the film available, defects and holes within the film can be detected based on the number of vertices on the outline of an inner face. Following visual inspection, if at least vertices are found, the face is considered to be a hole. The area of the film () Is calculated as the sum of the area of all inner faces with less than the threshold of vertices. Similarly, the film perimeter () is calculated based on the sum of the perimeters of all outside faces as well as those of all inner faces satisfying the above hole-detection criterion. Alternatively, an approach with an area-based threshold criterion may also be applicable, yet the current approach is found to be computationally very effective.
We finally calculate the isoperimetric ratio (IPR) of the film as a measure how long the outline of a shape is relative to its area. Lower values indicate a stronger tendency to contract to a circular droplet, whereas higher values indicate lower line tension and a tendency to form fingers and detached droplets. In non-periodic planar geometry, the IPR attains its smallest possible value for a circle, which optimizes the area enclosed by a fixed perimeter length. Polygons with finite vertex counts necessarily have larger values than circles, but polygons with more vertices are generally able to better approximate a circle’s IPR (see fig. 7 for limits of hexagons and pentagons). In periodic structures like our systems, the IPR can have even smaller values than for a circle. On the other end of the spectrum, larger IPR values are indicative of larger holes and more rugged outlines. We therefore calculate the number of holes (i.e. the number of inner faces with at least vertices) in each frame.
To determine the uncertainty of our results, we calculate the mean and the standard deviation of each of these properties (, , ) across all frames within the trajectory. Finally, we also calculate the standard error , where is the number of contributing frames.
5.1.3 Statistical normalization
Due to the different number of ion pairs at lower and higher temperatures, we present normalized statistical data. The statistical data is specifically normalized to a virtual system with ion pairs. For that purpose, we assume that ideally each ion pair should cover approximately the same surface area in each system, leaving us with a scaling factor
for areas. We also use this scaling factor for the number of holes but not for the number of vertices within these holes. For the purpose of lengths like , we use the corresponding scaling factor to harmonize the results.
5.2 Distribution of faces
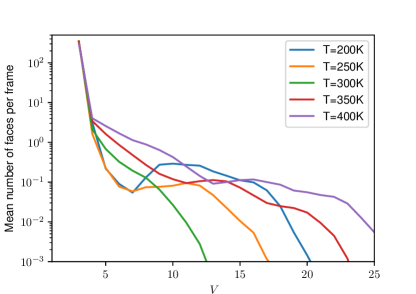
We first calculate the distribution of faces with a particular number of vertices, averaged over all film realizations at the given temperature fig. 6. Faces are considered to be part of the film if they have or less vertices. In agreement with the generally hexagonal structure, faces with 3 vertices are the most likely configuration in all systems. Faces with a larger number of vertices belong to the positions in the film where a defect appears, with the number of vertices being correlated to the size of the defect, seen as a hole in the film.
At low temperatures (, ), the highly ordered phase typically contains defects that are frozen in the film, with very little to no restructuring on the time scales of simulations. As the system is building alternating arrays of ions, that quasi percolate infinitely along the axis, the defects appear when the number of ions is incommensurate with completing a full stripe, and are hence, somewhat a consequence of the very setup. At such a defect can travel to the edge of the otherwise unperturbed monolayer still being tightly coupled to the alumina lattice. As the transition temperature is approached, the film can reduce the line tension, hence narrowing down the distribution of faces in all measures. Above the transition temperature at around , due to the unsaturated nature of the systems, defects dynamically form and reorganize as the line tension is no longer able to sustain in-plane fluctuations of the edge of the film. The consequence is a broadening of the distribution of the number of faces and the appearance of faces with very large number of vertices along with a re-widening of the distribution of the morphological measures of the holes.
This analysis shows that the temperature evolution of these distributions as visualized in fig. 6 clearly represents the change in the phase behavior of the IL from a solid-like crystalline to a fully liquid state.
5.3 Morphology of the defects
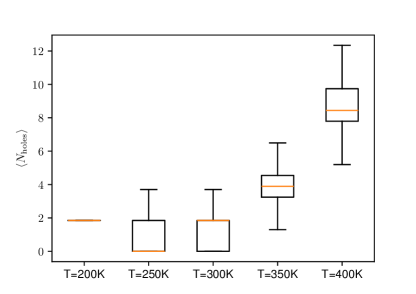
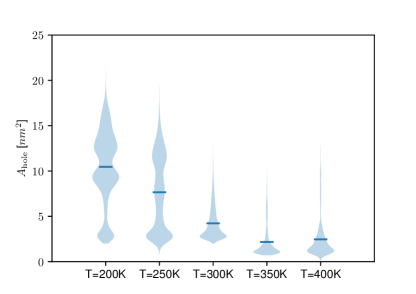
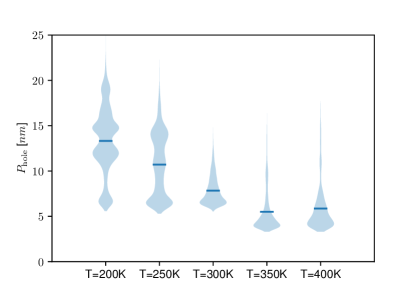
It can be noted that the total number of holes is relatively small compared to the number of faces that are considered to be a part of the IL layer covering the aluminum crystal. Specifically, we observe several hundreds of faces as a part of the monolayer in contrast to only single- or low two-digit average numbers of holes being observed per frame across all temperatures (see fig. 7). The statistics, furthermore, demonstrate that there is a clear trend of the number of holes (or at least larger holes by area) within the film decreasing as the temperature approaches the transition temperature near . To be more precise, at we observe larger holes than at , where we in turn observe more large holes than at . At and above, we see a general trend of the number of holes rising with increasing temperature. Additionally, we also observe a temperature-dependent increase in the maximum of the largest areas and perimeters of holes being observed at these temperatures.
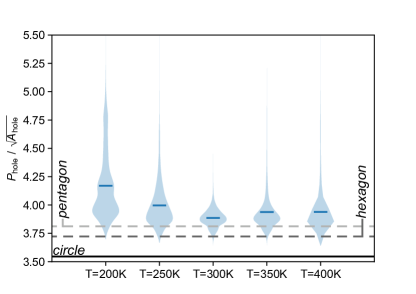
Focusing on the morphology of the holes, we observe a trend of shape optimization towards the critical temperature. Specifically, as illustrated in fig. 7, the distribution of the isoperimetric ratio (IPR) of holes is closest to circular shapes at . Towards higher but much more notably towards lower , holes with more elongated shapes can be observed. At these low temperatures, the shape of the holes is imposed by the tendency of the ions to follow the underlying lattice, and hence more elongated defects are created, which are very slow to relax, due to the low mobility of ions.
The drop in the likelihood of more elongated defects towards higher temperatures up to the critical temperature is a consequence of changes in the line and surface tensions, but also the films’ ability to restructure. As temperatures allow the film to turn more liquid, high ion mobility promotes self-curing of defects, so more elongated defects either contract to a nearly circular shape and/or collapse more frequently. Actually, the results show that above the critical temperature, there is a characteristic size () and shape (IPR) of a defect, with the latter being slightly higher than at due to increased fluctuations. Given link between hole size and uncovered surface area it is likely that the typical size depends on the overall surface coverage.
On the other hand, the characteristic shape, unlike the average number and size of holes, should not be directly tied to the coverage. Its impact should consequently be limited to controlling the theoretically possible maximum and minimum of these distributions. On close inspection, at and at this low degree of surface saturation, we observe the distributions of and shifting towards larger values with temperature, while the number of holes doubles and even quadruples compared to . As a consequence of these larger holes with a longer outline, we see the lower limit of the IPR distribution moving closer towards the theoretical minimum associated with a circle. Higher surface saturation is expected to limit the ability of holes to better approach circular shapes as well as the formation of more elongated shapes at the same. However, thermal fluctuations are always expected to cause the spread of the morphological distributions to rise along with above (fig. 7) as far as the limitations set through surface coverage allow.
5.4 Morphology of the film
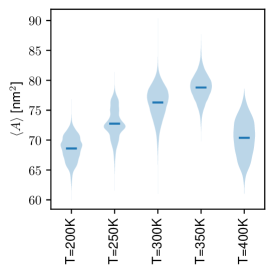
Further analysis can be performed based on the morphology of the overall film. This analysis involves calculating the mean area covered by the monolayer film and determining its mean outline length/circumference as a function of the temperature (see fig. 8a and b). While we generally observe a trend of increased surface area being covered per ion pair at larger temperatures, the relative change is not exceeding .
Only at do we observe a drop in the mean area per ion, which is a consequence of thin strings of ions lining the perimeter of holes forming at that temperature. For such structures, the current graph representation underestimates the covered area. Imposing a minimum thickness upon these strings would likely bring the results for more in line with the general trend in which the ion distance increases as expected, due to thermal fluctuations at higher temperatures.
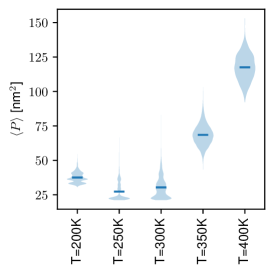
For the circumference of the film, the increase is, however, much more significant. The change is rather small below the critical temperature, indicating that the film is minimizing its perimeter under constraints imposed by the underlying substrate. A deviation from the trend of increasing perimeters with temperature is, therefore, only observed between and , which can be attributed to the slow dynamics at very low temperatures, and the inability of the film to find a fully relaxed configuration on the time scales of the simulations. This then again agrees with the previously mentioned experimental findings where approaching the transition temperature from below is associated with the IL monolayer film minimizing its circumference [25].
As exceeds , the interaction of ions with the sapphire weakens, viscosity decreases, and ions get to explore a significant surface area, hence significantly increasing the entropy. The consequences are the more common formation of transient defects and longer ion strings, strongly increasing the circumference of the film.
Looking at the IPR of the film in fig. 8c, we see that changes in the perimeter dominate changes in the surface area, a finding emphasized by the small size of our systems relative to the macroscopic films. Consequently, trends in IPR of the film as a function of temperature are identical to that of the perimeter. This agrees with our understanding that close to , the film is able to balance the constraints from its coupling to the substrate with thermal excitations. Below , the enthalpy of interaction is much larger than the entropy. Restructuring is so slow that defects practically freeze and an optimal structure on the level of the film may not be fully attained.
At higher , entropy dominates enthalpy, the hole formation is frequent and IPR is increased. It is, however, still notable, that while we observe the formation of thin strings of ions as well as of fingers pointing into the uncovered substrate surface area, detached colonies like the one visible in fig. 5b and c are usually small and, furthermore, rare occurrences. This suggests that even at the larger simulated temperatures, it is still energetically favorable for the film to remain connected. At even larger temperatures, we expect the thermal excitation to also overcome this constraint leading the film to decompose into independent groups of ions. However, such effects could occur at temperature that are beyond those at which the ions themselves become unstable and decompose [35].
6 The effect of confinement on the organization of IL monolayers
An important observation from the previous analysis is that the monolayer remains intact at all temperatures and no spontaneous formation of bilayers or multilayers has been observed. This is notable, as the bi-layer formation is an effect of the competition between the out-of-plane adhesive forces with the substrate and in- and out-of-plane cohesive forces within the ionic liquid. Our results suggest that the strong adhesion forces in our system are able to outweigh the out-of-plane cohesive forces. Furthermore, the in-plane cohesive forces are so strong that up to the highest temperature in our simulations it was impossible to just pull one ion out of the film without dragging a paired ion when calculating the PMF. However, an increase in the saturation of the interface layer has been shown to lead to a change in the observed behavior [25]. Actually, at low temperatures, the experiments observed islands of the IL on the gold surface with the second layer present on top of the wetting layer, forming out-of-plane checkerboard patterns. Furthermore, for a related IL with chloride anions between graphite surfaces, the confinement has been observed to play a major role in structuring [36]. It specifically caused a phase transition from a liquid (isotropic) to a solid (directional) structure upon stronger confinement. One can therefore argue that the stability of our monolayer is a consequence of the surface not being fully covered by the film.
In our systems, we presume the bilayer structures to be metastable, relative to the monolayer. The evidence for this effect can be found in observing the spreading dynamics (fig. 1). At all temperatures, following a quick expansion of the droplet, the precursor monolayer film forms. The spreading is continuous until the droplet is reduced to a bilayer above a part of the monolayer, when we typically observe an arrest in the dynamics. At some point, however, the pure monolayer is formed with a quick disappearance of the bilayer, which can be seen from the abrupt change of slope at low effective spreading angles. This is reminiscent of transitioning from a metastable into a more stable configuration, over a barrier. At low temperatures, crossing over this barrier is very difficult as the mobility of ions after they form hydrogen bonds is very low, and hence the spreading is overall impeded.
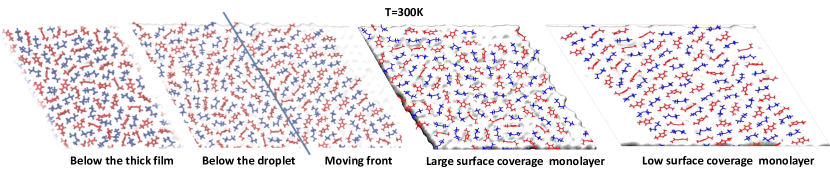
We therefore focus our discussion on the stability of the monolayer close to the critical temperature of , when the bulk IL is clearly in the liquid state. At this point even below the thick film, the contact layer experiences very slow dynamics, but only short range order. The same type of (dis)order is found in the contact layer below the droplet but notably, also when we create the monolayer from a thick film, by removing all ions that are not in contact with the surface. Providing a larger area of the sapphire at this point produces long-range order. Yet under constraint of higher density, the system can either maintain long range order in the contact layer with a bilayer on top, hence gaining out-of plane cohesion energy, or sacrifice the order and stay in the monolayer configuration, which seems to be the case for our substrate-liquid combination. However, fully resolving the energetics of these states may require a more in-depth study.
These results demonstrate the importance of the balance between (i) adhesive forces and the specificity of interaction of the IL with the functional moieties in the support, (ii) the film-internal cohesive forces, causing alternating patterns of anions and cations, and (iii) out-of-plane cohesive forces between the different layers, which weaken the relative impact of the adhesive interactions with the interface, especially when the surface has already been fully covered. We therefore suggest that interface-adjacent behavior relating to adsorption in liquid films and diffusive transport may strongly depend on the overall film thickness. More importantly, this highlights the impact of the level of confinement on the position of the critical point in supported liquid films.
7 Discussion and Conclusions
In our analysis of the structural and morphological properties of monolayer films of [C2Mim][NTF2] on a neutral, hydroxylated alumina substrate, we observe two clear regimes for the behavior of liquid films. The strong coupling between the nearly immobile ions and the underlying crystal structure dominates at low temperature. This results in a very distinct directionality and periodicity of the films’ internal structure, not usually observed in a liquid phase. We attribute this to adhesive forces and an effective confinement of the liquid layer through the formation of hydrogen bonds, similar to those observed in density functional calculations and other simulations. [36, 33] In contrast, at higher temperatures, thermal excitations dominate, and ions start to hop between surface binding sites, while still being adsorbed. This decouples the internal film structure from the structure of the underlying alumina. In this effectively less confined regime, the alternating order of ions of opposing charge is retained, dominating the internal film organization. It is the optimization of cohesive in-plane Coulomb-interactions that dominates the patterning process. Consequently, the directionality imprinted on the monolayer by the substrate is lost.
To quantify the extent of the changes associated with the observed structural phase transition, we analyzed the morphology of the monolayer films and the defects appearing spontaneously therein. Below the critical temperature, the defects are rare, nearly frozen, little fluctuating in size. On-average, however, the lowest probability for observing a hole is at around , as at this temperature, the mobility of ions is just enough to heal an opening in the monolayer. The film is minimizing its circumference and its isoperimetric ratio, which is reflected in the minimum in the isoperimetric ratio of the holes.
Above the critical temperature, the area and perimeter of individual holes remains approximately constant, while there is a clear increase in the frequency of their occurrence. At this point, the IPR of the film increases also due to the formation of chains of ions alternating in type. These strings increase the circumference of the film without significantly contributing to the covered area, and are a consequence of thermally reduced line tension.
Our data show that the precise morphology of the monolayer depends on the degree of saturation of the ionic layer on top of the substrate, in accordance with previous experimental findings [25]. Specifically, as surface coverage increases, the total area of all holes is constrained. This forces defects to attain smaller sizes, making them increasingly indistinguishable from the remainder of the monolayer, at the expense of the enthalpy associated with in-plane Coulomb forces. Our previous analysis of the contact layer of the IL with a sapphire support below a several nanometers thick film showed that the mobility of ions is basically impeded, but the structure is not fully ordered, even at room temperature [14, 28]. We, thus, expect an increase in out-of-plane ion pair interactions competing with surface attraction to cause an even earlier loss of order. The precise threshold temperature is, therefore, expected to shift to lower values due to differences in system geometry, saturation of the interface layer and film thickness. These changes tie back to a loss of confinement, which has previously been linked to structural properties of thin films [36, 33]. However, more quantitative analysis of these effects is warranted. Future work should, therefore, focus on the formation of bi-layers or thin multi-layers to find the relation between transitional behavior in highly confined mono- and low-confinement multi-layer film systems.
8 Acknowledgements
The authors declare no competing financial interest. We thank G. Hantal for a critical proof read of the manuscript. We acknowledge funding by the Deutsche Forschungsgemeinschaft (DFG, German Research Foundation) – Project-ID 416229255 – SFB 1411 Particle Design and Project-ID 431791331 - SFB 1452 Catalysis at Liquid Interfaces (CLINT) for support. The authors gratefully acknowledge the scientific support and HPC resources provided by the Erlangen National High Performance Computing Center (NHR@FAU) of the Friedrich-Alexander-Universität Erlangen-Nürnberg (FAU).
References
- Freemantle [2010] M. Freemantle, An introduction to ionic liquids, Royal Society of chemistry, 2010.
- Lexow et al. [2020] M. Lexow, F. Maier, H.-P. Steinrück, Advances in Physics: X 5 (2020) 1761266.
- Cai et al. [2020] M. Cai, Q. Yu, W. Liu, F. Zhou, Chemical Society Reviews 49 (2020) 7753–7818.
- Somers et al. [2013] A. E. Somers, P. C. Howlett, D. R. MacFarlane, M. Forsyth, Lubricants 1 (2013) 3–21.
- Zhou et al. [2009] F. Zhou, Y. Liang, W. Liu, Chemical Society Reviews 38 (2009) 2590–2599.
- Hao and Zemb [2007] J. Hao, T. Zemb, Current Opinion in Colloid & Interface Science 12 (2007) 129–137.
- Hubbard et al. [2011] C. D. Hubbard, P. Illner, R. van Eldik, Chemical Society Reviews 40 (2011) 272–290.
- Plechkova and Seddon [2008] N. V. Plechkova, K. R. Seddon, Chemical Society Reviews 37 (2008) 123–150.
- Francis et al. [2020] C. F. Francis, I. L. Kyratzis, A. S. Best, Advanced Materials 32 (2020) 1904205.
- Sun et al. [2019] H. Sun, G. Zhu, X. Xu, M. Liao, Y.-Y. Li, M. Angell, M. Gu, Y. Zhu, W. H. Hung, J. Li, et al., Nature communications 10 (2019) 3302.
- Riisager et al. [2006] A. Riisager, R. Fehrmann, M. Haumann, P. Wasserscheid, European Journal of Inorganic Chemistry 2006 (2006) 695–706.
- Misra et al. [2020] A. Misra, C. Zambrzycki, G. Kloker, A. Kotyrba, M. H. Anjass, I. Franco Castillo, S. G. Mitchell, R. Güttel, C. Streb, Angewandte Chemie International Edition 59 (2020) 1601–1605.
- Vučemilović-Alagić et al. [2019] N. Vučemilović-Alagić, R. D. Banhatti, R. Stepić, C. R. Wick, D. Berger, M. U. Gaimann, A. Baer, J. Harting, D. M. Smith, A.-S. Smith, Journal of Colloid and Interface Science 553 (2019) 350–363.
- Höllring et al. [2023] K. Höllring, A. Baer, N. Vučemilović-Alagić, D. M. Smith, A.-S. Smith, Journal of Colloid and Interface Science (2023).
- Segura et al. [2013] J. J. Segura, A. Elbourne, E. J. Wanless, G. G. Warr, K. Voïtchovsky, R. Atkin, Physical Chemistry Chemical Physics 15 (2013) 3320–3328.
- Lhermerout et al. [2018] R. Lhermerout, C. Diederichs, S. Perkin, Lubricants 6 (2018) 9.
- Lee et al. [2017] A. A. Lee, C. S. Perez-Martinez, A. M. Smith, S. Perkin, Physical review letters 119 (2017) 026002.
- Brkljača et al. [2015] Z. Brkljača, M. Klimczak, Z. Milicevic, M. Weisser, N. Taccardi, P. Wasserscheid, D. M. Smith, A. Magerl, A.-S. Smith, The Journal of Physical Chemistry Letters 6 (2015) 549–555.
- Horn et al. [1988] R. Horn, D. Evans, B. Ninham, The Journal of Physical Chemistry 92 (1988) 3531–3537.
- Atkin and Warr [2007] R. Atkin, G. G. Warr, The Journal of Physical Chemistry C 111 (2007) 5162–5168.
- Steinrueck and Wasserscheid [2015] H.-P. Steinrueck, P. Wasserscheid, Catalysis Letters 145 (2015) 380–397.
- Earle et al. [2006] M. J. Earle, J. M. Esperança, M. A. Gilea, J. N. Canongia Lopes, L. P. Rebelo, J. W. Magee, K. R. Seddon, J. A. Widegren, Nature 439 (2006) 831–834.
- Cremer et al. [2008] T. Cremer, M. Killian, J. M. Gottfried, N. Paape, P. Wasserscheid, F. Maier, H.-P. Steinrück, ChemPhysChem 9 (2008) 2185–2190.
- Souda [2008] R. Souda, The Journal of Physical Chemistry B 112 (2008) 15349–15354.
- Meusel et al. [2020a] M. Meusel, M. Lexow, A. Gezmis, A. Bayer, F. Maier, H.-P. Steinrück, Langmuir 36 (2020a) 13670–13681.
- Meusel et al. [2020b] M. Meusel, M. Lexow, A. Gezmis, S. Schötz, M. Wagner, A. Bayer, F. Maier, H.-P. Steinrück, ACS nano 14 (2020b) 9000–9010.
- Maruyama et al. [2018] S. Maruyama, I. B. H. Prastiawan, K. Toyabe, Y. Higuchi, T. Koganezawa, M. Kubo, Y. Matsumoto, ACS nano 12 (2018) 10509–10517.
- Vučemilović-Alagić [2021] N. Vučemilović-Alagić, Computational study of the physical and interfacial properties of Imidazolium-based ionic liquids, Ph.D. thesis, Friedrich-Alexander-Universität Erlangen-Nürnberg (Germany), 2021.
- Van Der Spoel et al. [2005] D. Van Der Spoel, E. Lindahl, B. Hess, G. Groenhof, A. E. Mark, H. J. Berendsen, Journal of Computational Chemistry 26 (2005) 1701–1718.
- Cygan et al. [2004] R. T. Cygan, J.-J. Liang, A. G. Kalinichev, The Journal of Physical Chemistry B 108 (2004) 1255–1266.
- Gale and Rohl [2003] J. D. Gale, A. L. Rohl, Molecular Simulation 29 (2003) 291–341.
- Höllring et al. [2024] K. Höllring, N. Vučemilović-Alagić, D. M. Smith, A.-S. Smith, Analysis of monolayer morphology, structure and topology, 2024. doi:10.5281/zenodo.10707053.
- Zhang et al. [2018] S. Zhang, Y. Lu, C. Peng, H. Liu, D.-e. Jiang, The Journal of Physical Chemistry C 123 (2018) 618–624.
- Höllring et al. [2024] K. Höllring, N. Vučemilović-Alagić, D. M. Smith, A.-S. Smith, Dataset: Criticality in an imidazolium ionic liquid fully wetting a sapphire support, 2024. doi:10.5281/zenodo.10706965.
- Heym et al. [2011] F. Heym, B. J. Etzold, C. Kern, A. Jess, Green chemistry 13 (2011) 1453–1466.
- Sha et al. [2008] M. Sha, G. Wu, H. Fang, G. Zhu, Y. Liu, The Journal of Physical Chemistry C 112 (2008) 18584–18587.