ML short=ML, long=machine learning, \DeclareAcronymID short=ID, long=intrinsic dimension, \DeclareAcronymNID short=NID, long=normalized intrinsic dimensionality, \DeclareAcronymSGD short=SGD, long=stochastic gradient decent, \DeclareAcronymCOD short=COD, long=curse of dimensionality, \bibinputbibliography2 \DTLloaddb[keys=data_set_name,nodes,edges,features,paper_names]data_set_sizes_groupedtables/data_set_sizes_grouped.csv
Reproducibility and Geometric Intrinsic Dimensionality:
An Investigation on Graph
Neural Network Research
Abstract
Difficulties in replication and reproducibility of empirical evidences in
machine learning research have become a prominent topic in recent years.
Ensuring that machine learning research results are sound and reliable
requires reproducibility, which verifies the reliability of research findings
using the same code and data.
This promotes open and accessible research, robust experimental workflows, and
the rapid integration of new findings.
Evaluating the degree to which research publications support these different
aspects of reproducibility is one goal of the present work.
For this we introduce an ontology of reproducibility in machine learning and
apply it to methods for graph neural networks.
Building on these efforts we turn towards another critical challenge in machine
learning, namely the \aclCOD, which poses challenges in
data collection, representation, and analysis, making it harder to find
representative data and impeding the training and inference processes.
Using the closely linked concept of geometric intrinsic dimension we
investigate to which extend the used machine learning models are influenced by
the intrinsic dimension of the data sets they are trained on.
Keywords:
Reproducibility,
Replication,
Curse of Dimensionality,
Intrinsic Dimension
1 Introduction
ML is a rapidly evolving field that has made significant contributions to numerous industries. In view of its considerable impact, it also becomes apparent how difficult it isto replicate and reproduce empirical findings in the field of \acML. Therefore, reproducibility in \acML has become an important topic in its own right in recent years. Reproducibility, defined as the ability of a researcher to duplicate the results of a prior study using the same materials as the original investigator, is critical to ensuring the validity and reliability of research findings. It promotes transparency, allows for verification of results, and fosters confidence in the scientific community. Despite its importance, achieving reproducibility in \acML research is challenging due to several barriers. One of the main difficulties is the implementation of the exact experimental and computational procedures as described in the original work. The resulting layers of complexity become particularly apparent when the used computational frameworks continually update and rise and fall in popularity and levels of maintenance. Another major challenge is the inherent instability of results. This is influenced by a multitude of factors such as the amount of data available, the computational resources at hand, the determination of hyperparameters, and the inherent randomness of the training process. In this context, it is even more difficult to assess the influence of uncontrolled epistemic uncertainties, such as the intrinsic dimensionality. Several guidelines, originating from conferences, workshops, and coding frameworks, provide recommendations and tools that help researchers and authors in this regard (Pineau, 2020; ICLR, 2019; Lightning AI and Contributors, 2022). However, these are often not very detailed or allow limited structural evaluation and comparability of reproducibility. Moreover, as several authors ascertain a lack of standard terminology for reproducibility (within \acML) which hinders the emergence of an unified evaluation framework (Tatman et al., 2018; Bouthillier et al., 2019).
This paper proposes a comprehensive and in-depth framework for the study of reproducibility in the research area of graph neural networks. The challenges associated with a data set, a method and a result are analysed in terms of their significance for computational reproducibility. A multi-stage selection process identified six scientific papers for which we studied and adapted our framework. With their help, we explore and demonstrate the limits and difficulties of reproducibility. This results in a new ontology for scientific reproducibility that generalizes to the realm of machine learning as a whole.
A second major challenge for the reproducibility of high-dimensional \acML results is the occurrence of epistemic uncertainties. This is particularly the case when an attempt is made to transfer a result to new data or use cases. A particular instance of this uncertainty is the umbrella term \aclCOD. This is based on various mathematical observations in high-dimensional spaces that are generally not addressed by \acML studies. A geometric approach towards understanding the \aclCOD was established by V. Pestov. He proved that the concentration of measure phenomenon Milman (1988; 2000) contributes to the overall \aclCOD (Pestov, 1999; 2007b; 2007a; 2010b; 2010a). His approach was adapted towards a practical computable function for estimating the \acID of a geometric data set (Hanika et al., 2022). This result was further improved with regard to its applicability to large data sets (Stubbemann et al., 2023a; b).
With regard to reproducibility, we investigate the influence of the \acID on the \acML training process. In particular, we experiment with \acID-based feature selection, as it provides a straightforward method to manipulate the \acID of a data set. As we hypothesize that training methods are susceptible to \acID-changes in the underlying training data set, we apply different \acML methods to the same manipulated data sets. We thereby study the impact of altering the intrinsic dimension of graph data sets for all six reproduced graph neural network methods.
Although there are studies on these theoretical and practical aspects, the present work aims to bridge the gap between them by focusing on reproducibility and the intrinsic dimension within a geometric understanding. Altogether, our work contributes to improving the quality and reliability of \acML research, ultimately benefiting the broader scientific community and industry applications.
To summarize our contributions:
-
•
We introduce an ontology of reproducibility in Machine Learning (Section 3).
-
•
We consider about 100 publications from the field of graph neural networks and reproduce six of them extensively (Section 4).
-
•
We investigate how the change of the (geometric) intrinsic dimension in data sets effects the performance of the six reproduced methods (Section 5).
2 Related Work
Reproducibility and Replicability
Several publications have investigated the general state (National Academies of Sciences, Engineering and Medicine, 2019) and challenges (Nature Special, 2018) of reproducibility and replicability in science. There are also works that looked more specific into these questions in the field of computer science (Freire et al., 2012) and its sub-field of machine learning (Raff, 2019; Liu et al., 2020a; Chen et al., 2022). In recent years a growing number of conferences include dedicated tracks for reproducibility efforts or specific workshops (Stodden et al., 2013; ICLR, 2019). The knowledge collected there is now available in general reports (Pineau et al., 2021) and straightforward checklists (Pineau, 2020). Related to this more and more journals and publisher provide specific editorial policies (Casadevall & Fang, 2010; Springer Nature, 2020) to help authors in that regard. Efforts for reproducing and replicating past works from broad range of research fields concentrate in some dedicated journals (ReScience C, 2023), in which publications from further back are also of interest.111See the ten years challenge http://rescience.github.io/ten-years/ Beyond the space of academic publication there are of course similar efforts made by the programming community (paperswithcode, 2021; Sinha & Forde, 2020). Specifically machine learning engineering teams and individuals build frameworks (Lightning AI and Contributors, 2022) and templates (ashleve and Contributors, 2022) for streamlining the process of setting up a reproducible machine learning experiment. Recent investigations showed, that the choice of the used machine learning framework and its version (Pham et al., 2020; Shahriari et al., 2022) or commercially available platforms providing related services (Gundersen et al., 2022b) can have a significant impact on the reproducibility properties of the research code. There are, motivated by practical concerns, surveys that investigate directly the availability and operability of research code (Collberg et al., 2015). Few works additionally try to construct a taxonomy of those reproducibility properties (Goodman et al., 2016; Kitzes et al., 2018; Tatman et al., 2018; Bouthillier et al., 2019). The accompanying discussions often emphasize the confusing terminology (Peng, 2011; Plesser, 2018; Gundersen, 2020). The provided taxonomies usually consist of a shallow hierarchy of different levels of reproducibility which are characterized by high-level features of the submissions that have to be assessed. In most cases the process of evaluating is guided by only a few questions. As such they give researchers and reviewers not that much guidance when evaluating the degree of reproducibility. However there are publications that go more into detail when analysing factors and variables that influence reproducibility (Ivie & Thain, 2018; Gundersen et al., 2018; Gundersen & Kjensmo, 2018; Gundersen et al., 2022a). This focus on central aspects of computational reproduciblity can also be found in the present work.
Intrinsic Dimension and Feature Selection
The term \acfID has multiple slightly different meanings in related sub-fields of machine learning. They share the motivating aspect of using the value of the \acID of data as a proxy for gaining evidence on how the data is structured. One prominent usage of the term is for specifying the often approximated dimension of a hypothetical embedded manifold in the data space which describes almost all samples with sufficient accuracy (Hein & Audibert, 2005; Tatti et al., 2006). This notion of \acID can be used to motivate a variety of estimators, for example based on sampling around data point neighborhoods (Kim et al., 2016). Those estimators give rise to different feature selection methods (Traina et al., 2010; Mo & Huang, 2012; Suryakumar et al., 2013; Golay et al., 2016), occasionally based on gradients to learn an embedding with the desired properties (Pope et al., 2021). However these algorithms do not help to decide if and to what extent the data set is affected by the \aclCOD and the related concentration phenomena (François et al., 2007; Houle, 2013).
In contrast, the \aclID for data by Pestov (Pestov, 1999; 2007b; 2010b; 2011) gives an axiomatic approach on quantifying the influence of the \aclCOD directly. It links the latter to the phenomenon of concentration of measure and builds on the axiomatization of the latter by Gromov and Milman (Gromov & Milman, 1983; Milman, 1988; 2000). In this construction it amounts to computing the set of all real-valued 1-Lipschitz functions on a given metric space as potential features. These mathematical works give rise to the intuitive view on the \aclCOD as the phenomenon of features concentrating near their means or medians, so that algorithms are therefore not able no discriminate the data. However this approach by itself was computationally infeasible until the introduction of the \aclID of geometric data sets (Hanika et al., 2022). Here a set of features is defined beforehand. Later publications provided algorithms for computation or approximation of this \acID (Stubbemann et al., 2023a) and its application to feature selection (Stubbemann et al., 2023b), even for large-scale data sets.
Studies Regarding Influence of Data on Model Behavior
Machine learning models are heavily influenced by the quality and nature of the input data they are trained on. This relationship has been extensively studied in various contexts, leading to significant advancements and challenges in the field. A large body of literature is concerned with in influence of simple data augmentation (e.g. cropping, rotating, stretching etc) when keeping a machine learning model fixed (Salamon & Bello, 2016; Perez & Wang, 2017; Tsuchiya et al., 2019; Tian et al., 2020; Laptev et al., 2020). Naturally there are also works studying influence of feature selection methods (Koçak et al., 2019) and projection methods (Wan et al., 2021) in addition to those those referenced in the previous paragraphs.
In the realm of classical machine learning, theoretical studies have been conducted on various models, including decision trees (Syrgkanis & Zampetakis, 2020) and quadratic classifiers (Latorre et al., 2021), that explore the estimation capabilities and the performance within high-dimensional settings. These models often exhibit a dependence on dimension, particularly in the context of high-dimensional regimes where their effectiveness may vary. Similarly, research has been dedicated to understanding the behavior of support vector machines in spaces with low (box-counting) dimension (Hamm & Steinwart, 2020).
In a different vein, influence function studies track the impact of training data on learning algorithms, providing insight into how the model’s predictions on test data are influenced by the training data. This concept has found applications in neural networks, with works shedding light on the backpropagation process and the attribution of training data importance in these complex architectures (Koh & Liang, 2017; Pruthi et al., 2020; Akyürek et al., 2022; Hammoudeh & Lowd, 2022).
Otherwise, there seems to be a lack of research on data manipulation methods that focus on the influence of the concentration of measures phenomenon on model performance.
3 An Ontology of Reproducibility in Machine Learning
The term reproducibility is often used ambiguously and vaguely in the field of machine learning (Peng, 2011; Kitzes et al., 2018; Plesser, 2018). In our work, we apply the “classical” understanding of reproducibility in science. That is, whenever a scientific study is replicated the original experimental results should be archived with a high degree of reliability. Of course, the concept of “replication” implies a series of attributes. These are essentially related to the fact that it is an independent project, which could mean a different set of equipment (hardware or software), a different group of researchers, but could also take into account the time that has elapsed since the original study. As such one can see a particular scientific results lying on a spectrum of reproducibility. To give a more explicit process of contextualizing reproducibility we introduce in the following section an extensive ontology of reproducibility for the realm of machine learning. The necessity for this is based on the fact, that, to the best of our knowledge, such an ontology does not exist yet. The components of this ontology are influenced and inspired by the Chapter Assessing Reproducibility of the online version of the book The Practice of Reproducible Research (Kitzes et al., 2018). Additional ascendancy comes from existing efforts to characterize computational reproducibility (Gundersen et al., 2018; Gundersen & Kjensmo, 2018; Gundersen et al., 2022a). We adapted them with a stronger formalization, giving structure to the proposed questions and adjusted the ontology to better meet the requirements for the subsequent reproducibility study. Other noteworthy influences come from an ontology for semantic terms in machine learning (Publio et al., 2018), a practical taxonomy of machine learning (Tatman et al., 2018) which however has no formalization and very few specific points to check, and the machine learning reproducibility checklist (Pineau, 2020). One commonality between this ontology and the above-mentioned works is the focus on reproducibility of an individual research project. We consider only the setting where one computational result is presented as evidence for one scientific result for simplicity.
3.1 Overview
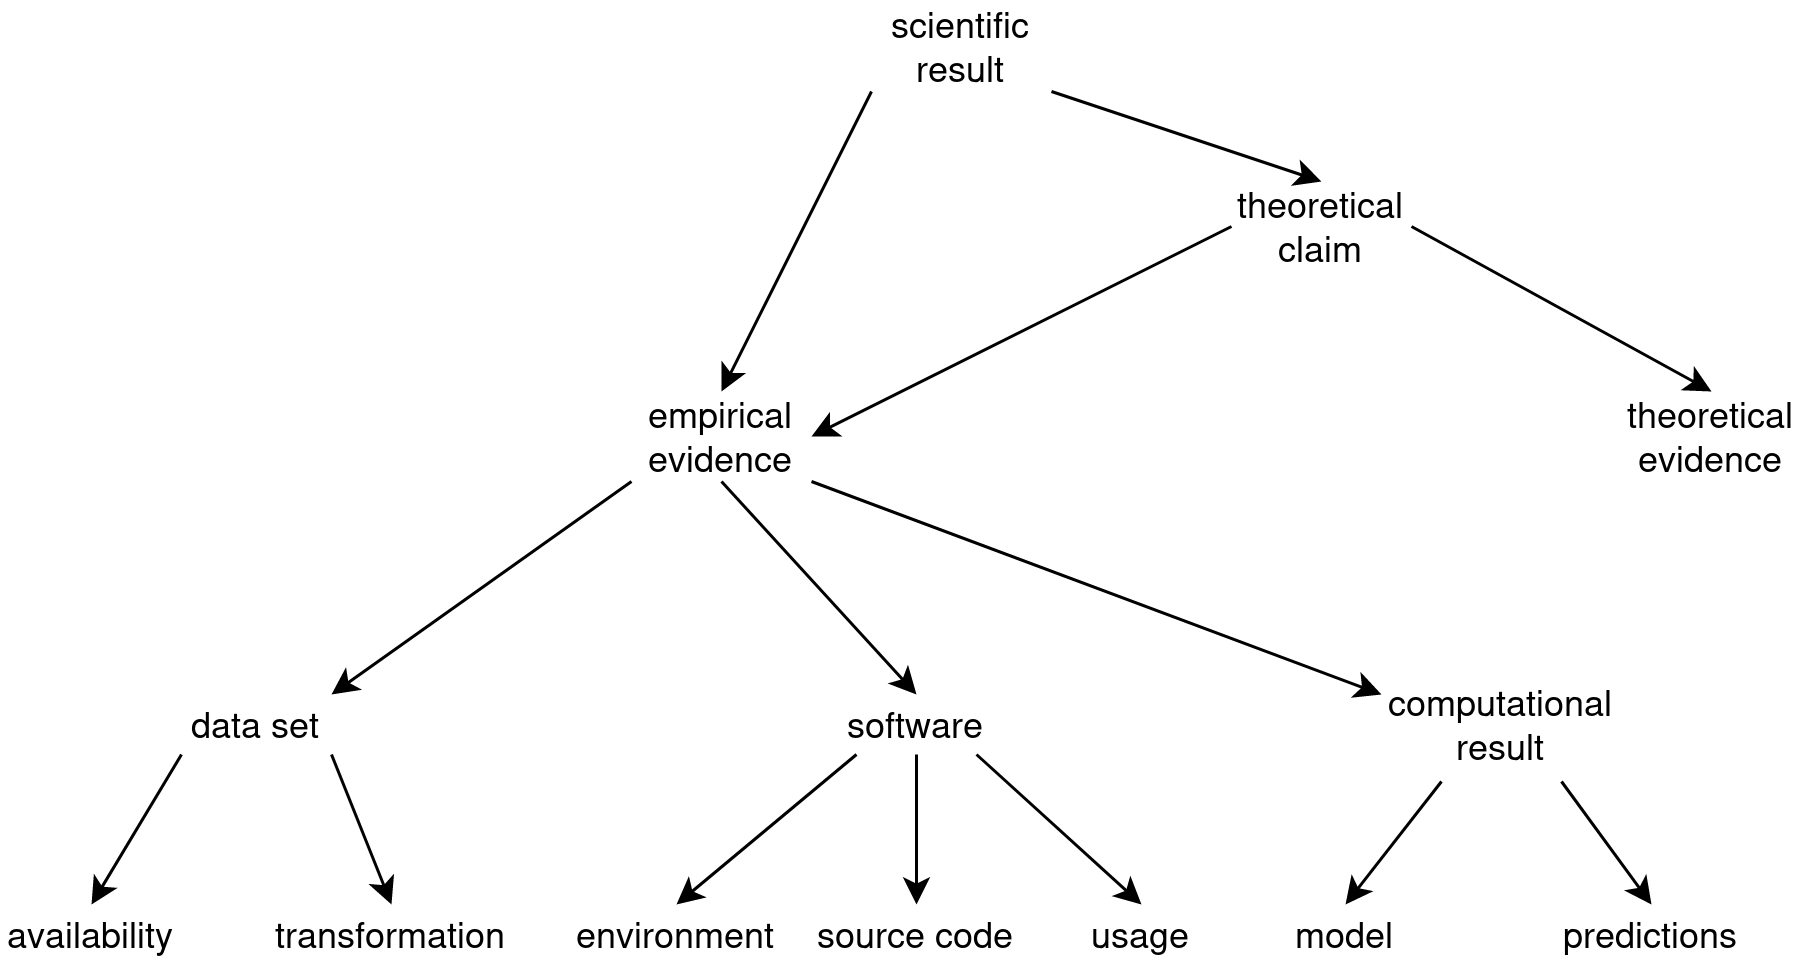
We now present our ontology of reproducibility in machine learning (Figure 1) which connects possible errors or difficulties that could arise when trying to reproduce the results of a single scientific study. Our proposed ontology is structured as a hierarchy and starts on the top level with the general notion scientific result. It can be based on empirical or theoretical evidence. Because we are (subsequently) interested in research that uses experiments for producing evidence we do not subdivide the theoretical category. In contrast we propose a fine-grained structuring for the empirical category. To reflect the related central aspects of data processing we use the ontological entities data set, software and computational results as the main subcategories for the empirical category. Each of these aggregate again a set of subentities. For example, the data set category encompasses the availability and transformation of data. Similarily, the software category has as central subcategory source code but also includes environment and usage as subcategories. Most importantly, we include the derived model and its predictions in the computational result category. Figure 1 shows the main categories and their subcategories in a overview schema.
We further evaluate every considered research paper within the proposed ontology based on a set of questions. In the following we want to describe the formalization of these questions and their motivations, which are based on potentially occurring errors and their impact on the scientific reproducibility. For a detailed list of the ontology we refer to Table 7 in the Appendix B. As we follow an open world semantic with our ontology the questions are formulated in such a way that answering them negatively is good for reproducibility. This also means that in the subsequent questioning, a missing answer does not indicate the non-existence of the corresponding property. We included several questions that remained unanswered for all surveyed publications (a good thing), but could be helpful in obtaining a finer distinction of reproducibility if the situation they capture occurs.
3.2 Data Set
One central aspect of scientific result in machine learning is the data set to which previous and proposed methods are applied. A common approach is to evaluate methods over multiple different but similarly structured data sets. Reproducibility is only possible with detailed knowledge about process for obtaining and preparing used data sets.222But even then there are special cases where methods select data samples or generates them (e.g. active learning, reinforcement learning), and reproducibility is handicapped. Those explanation minimize the risk of working with a data that follows a different data distribution than the one used in the original study. With this category of the ontology we want to focus on if the publication and accompanying material include steps (manual or automated) that describe how to obtain data sets.
3.2.1 Availability
The questions from this category aim to reflect nuances in obtaining and understanding the data sets used by the publication.
- D1—Is the data set format not documented?
-
Applicable mainly for publications that introduce a now or heavily modify an existing data set, it is otherwise difficult to adapt methods for reproducibility.
- D2—Was the data set version not set explicitly?
-
Over time data sets can undergo changes for individual samples through relabeling or extension, which leads to the necessity of keeping track of the used version of the data set.
- D3—Was the data set not directly accessible?
-
As most data sets currently used in machine learning are distributed over the web, a direct download link provides a good start for reproducibility.
- D4—Did the access not work at time of study?
-
Unfortunately the provided hyperlinks tend to cease to point to their original resource.
- D5—Is the data set privacy restricted?
-
Although not very frequently occurring in broadly used machine learning data sets, license or privacy concerns can create restrictions for access.
- D6—Does the data set require a restrictive license agreement for accessing?
- D7—Is the data set available on request only?
-
Loosely connected with the previous points, if it is necessary to go through a more elaborate process for obtaining data set.
3.2.2 Transformation
In general a data set needs to be adapted before a method can be applied. The questions from this category deal with evaluating those pre-processing steps.
- D8—Are manual steps necessary for pre-processing?
-
A series of manual steps for transforming a data set could easily be a source of mistakes, therefor an automatic solution is preferred.
- D9—Is there only an incomplete description for pre-processing steps?
-
Furthermore the provided explanations or scripts could not be enough to get the data set in the necessary form. Especially for lesser known data sets it is helpful if detailed descriptions or utility functions are provided that work around intricacies of individual samples.
- D10—Are the train, validation and test splits unclear?
-
Usually only a part of the data set is used for training, whereas other parts are used for validation and testing. The process of allocation should be reproducible, be it through provided files or deterministic functions.
- D11—Is the number of samples not documented?
-
An easy way of checking one attribute of the transformation is counting the obtained samples. Additionally it gives a high-level overview over the data efficiency of the presented approach.
3.3 Software
The implementation and application is a central part of a proposed machine learning method. It is one aspect of the research protocol and acts as description of the executed experiments. It operates on one or more data sets and produces computational results. In this category ancillary software and code written by the authors, as well as reproducibility components connected to hardware, are combined. This was done to keep the ontology clearly laid out.
3.3.1 Environment
Questions from this category deal with general behavior of the target system, which heavily influences the context of execution of the experiments.
- S1—Is the exact version of dependencies not documented?
-
Multiple dependencies can interact in intricate ways. This makes pinning of exact versions necessary for avoiding possible bugs connected to incompatible versions as well as prevent time consuming fixing of conflicts.
- S2—Is the specified version of dependencies not available anymore?
-
Depending on the age of the publication and the type of the used dependency the old versions could have disappeared from distribution channels and are not hosted by developers or supporters of the project anymore.
- S3—Is necessary hardware unavailable?
-
A lot of special hardware requirements can be circumvented by simulations with virtual machine or container images, but this leads to time consuming overhead in the reproducibility attempt or is not realisable in reasonable time at all.
- S4—Are any seeds for random number generators not set?
-
Multiple dependencies each can have different random number generator, where each has to be set for getting closer to reproducibility of an experiment.
- S5—Are important variables unclear?
-
Some setting of an experiment run (e.g. number of GPUs used) can have significant impact on results or even sideeffects onto other settings.
3.3.2 Usage
This category of the ontology groups together aspects regarding how the experiments were started. For the set of considered machine learning papers it is not necessary to consider user input beyond starting configuration.
- S6—Is the documentation not up-to-date?
-
Few publications include a dedicated documentation of their provided source code. If only a simple Readme file is included, it should at least be not misleading for the reproducibility attempt with its statements.
- S7—Are necessary arguments not clear?
-
Depending on implementation some arguments might me necessary to run an experiment but neither defaults or used values are explained or provided.
- S8—Are there missing hyperparameters?
-
Similar to previous question the values for hyperparameters for the experiments are generally of importance when reproducing it as they influence outcome significantly.
- S9—Are train/test scripts incomplete?
-
Including the individual commands of an experiment in a single file usually facilitates the reproducibility attempt. How to start these scripts can be a source of uncertainty if certain flags or variable values used in provided script are missing, wrong, only corrected later and/or not explained at all. Additionally if pre-processing steps are not included or other steps in the computational pipeline are missing, reproducibility is affected. Furthermore it could be the case that not all experiments presented in the paper have scripts.
- S10—Is it unclear which version of scripts was used?
-
It is only natural for the main source code of the publication to undergo changes before (and after) publication to accommodate for bugs and reviews. Problems arise when those changes are not reflected in accompanying scripts or instructions or when multiple scripts for same experiment exist simultaneously.
3.3.3 Source Code
The questions in this category are concerned with the source code files that implement the ideas of the scientific experiment. We do not have separate questions regarding the availability of source code itself similar to the data set category because we only focus on papers that provide source code with a non-restrictive license.
- S11—Is there a bug that was never fixed?
-
Over time authors and external contributors could find differences or errors between original publication, its revisions and the implementation.
- S12—Are there issue solutions that were not applied?
-
Usually the detection of problems of the implementation is accompanied by public discussions on the website that hosts the implementation. But it can happen, that the discussed solution was neither implemented or merged from external source code fork.
- S13—Was a bug fix distributed through other channels?
-
On the other hand one can get a hint in public discussions that the fix was distributed (manually) through some other channel like emails or direct messages to selected/active group of participants. In those cases it is not clear what the detailed changes where and how they affect reproducibility.
- S14—Did the API change?
-
This question is connected to an above usage question regarding different versions of scripts. Now we consider the other side, e.g. the entry points to core parts of the implementations changed but this is not reflected elsewhere be it documentation or other supporting material. The reproducibility effort is furthermore increased if traceability of versions is limited by convoluted history in the version control system.
- S15—Did an out of memory error occur?
-
Considered as a special type of error it is only recorded if there are no specification from requirements or those are not correct. As our goal is to evaluate reproducibility generally we do not determine the specifics that caused this error.
- S16—Are steps for one experiment missing?
-
If necessary source code for one experiment is not included, reproducibility for this experiment can only obtained with more difficulties.
- S17—Are steps for all experiments missing?
-
Additionally to the previous point we want to evaluate the possible situation that the publication uses libraries or code that is not included in the provided source code. This makes reproducibility nearly impossible.
- S18—Is the hyperparameter search not included?
-
As hyperparameter search is integral part of experiments it is important for reproducibility to have an explanation or process in the implementation on how the search was carried out.
- S19—Is only the general idea (and no experiments) implemented?
-
Another reason for the absence of experiments could be that the publication only proposes a new machine learning algorithm or a building block for an existing one.
3.4 Computational Result
The result obtained through a computational experiment represent the evidence of a scientific claim. A full reproduction of a scientific result, and the corresponding evaluation, depends on the successful completion of the reproducibility steps for data set and software. Problems arise when this is not the case. This implies that we can not obtain a model or predictions for the further evaluation steps. If the supplementary material of the publication in question does include the learned model it is still possible to perform the subsequent reproducibility steps. However, this is a rare case. Ideally contemporary scientific results in machine learning should be reproducible in terms of data set and software as well as provide the learned model. This case even allows for a more in-depth comparison and analysis between the reproduced and the provided models.
3.4.1 Model
For now there is only one questions in this category. As outline above the simple access to model weights is necessary for full reproducibility, especially if other factors increase difficulty of obtaining a optimized model independently. As such it is often overlooked but even when considered, the practical problem of making the model available has still no ready-made solution. There are a few existing platforms that allow for combined hosting of source code, data sets and models. Limitations can be encountered quickly if data sets and models are large or several of them are used or provided.
- R1—Are there no parameters (weights) of the obtained model provided?
-
As large parts of contemporary machine learning approaches use larger data set and models, it takes more and more time and computing resources to run the proposed method. Providing model weights can therefor act as a form of shortcut if comparison with other approaches is in focus. Depending on programming language and format it provides checks on specifications of models. Additionally when reproducibility fails it gives possibility to find cause and more importantly at least check author claims that way.
3.4.2 Predictions
With this category we want to capture aspects of the output of the train/test data set of the model and how these affect reproducibility. Depending on presented results a comparison of a variety of evaluation metrics can be helpful, especially when inference takes longer time or larger resources requirements than available for the specific reproducibility attempt.
- R2—Are there small deviation to obtained model?
-
We answer this questions positively when comparing the central evaluation metrics reported by original authors with evaluated metrics on the reproduced model a difference in the range of more than is observed.
- R3—Are strong differences in few experiments observed?
-
Similarly to above we assign this attribute when the difference of evaluation metrics are in a range of more than .
- R4—Are strong differences in almost all experiments observed?
-
As an extension to the previous question we assign this attribute when almost no reasonable reproducibility of outcomes can be obtained.
- R5—Are the claimed results only supported by small sample size?
-
Individual runs of a machine learning algorithm are rarely exact reproducible, even with the best efforts for obtaining reproducibility, by both original authors and those who reproduce the work. By averaging over a few executions the expressiveness of the results can be strengthened. We set the threshold for this at less than 5 samples.
- R6—Are there no predictions (outputs of classes or decisions) on the data sets?
-
If the original publication provides the class predictions or decisions made otherwise by the model it gives the reproducibility attempt the possibility to investigate more comprehensive metrics for differences in model behavior. Although making the complete set of predictions available is not always feasible (e.g. for large data sets or methods from other fields such as reinforcement learning), it could be for non-trivial parts of data set.
3.5 Limitations and Extensions
It is apparent that this ontology is designed using a basic formalization language. All connections between the entities can be read as part of. The authors are well-aware of the ML-Schema (Publio et al., 2018). However, we decided to not include or build upon it, since: i) several aspects of reproducibility could not be expressed using ML-Schema; ii) the focus of the ML-Schema is on interchanging information on machine learning algorithms and not on the reproducibility of an scientific result. An example for this is the lack of consideration of the influence of the seed for the random number generator.
There is a series of possible changes or extensions that we did not include in the presented version of the ontology. For example, our ontology does not consider detailed information about theoretical evidence. This is mainly motivated by the survey in Section 4 that focuses on empirical results. In the empirical evidence category the designation software is slightly misleading because it additionally contains aspects related to hardware. One may rename this category or add hardware as its own subcategory of empirical evidence. Analogously the entity source code might be extended with details about different modes of availablity and documentation. A special attribute might be the application of version control software.
Certain aspects of reproducibility are not considered yet, e.g. that plots, figures and tables can be automatically generated. Often authors omit to provide the corresponding source code for visualization. Furthermore, our ontology does not capture data provenance aspects.
Additionally it seems the longer it has been since publication, the lower the achievable degree of reproducibility. This can be exemplified by aging hard- and software that was used for the experiment and might not be available anymore.
Finally in our ontology we treat the presence or absence of an attribute categorically. Hence in certain cases evaluating a research work our ontology is a difficult task. Conversely any subsequent ontological operation and explanation is independent of any interpretation of numerical values.
4 Reproducibility of Major Graph Neural Network Research Results
The first main goal of the present work is to achieve a scientific overview over the state of reproducibility in the research field of graph neural networks. For this we first depict our method of candidate selection in Subsection 4.1 and thereafter discuss all our findings with respect to our reproducibility ontology.
4.1 Candidate Selection
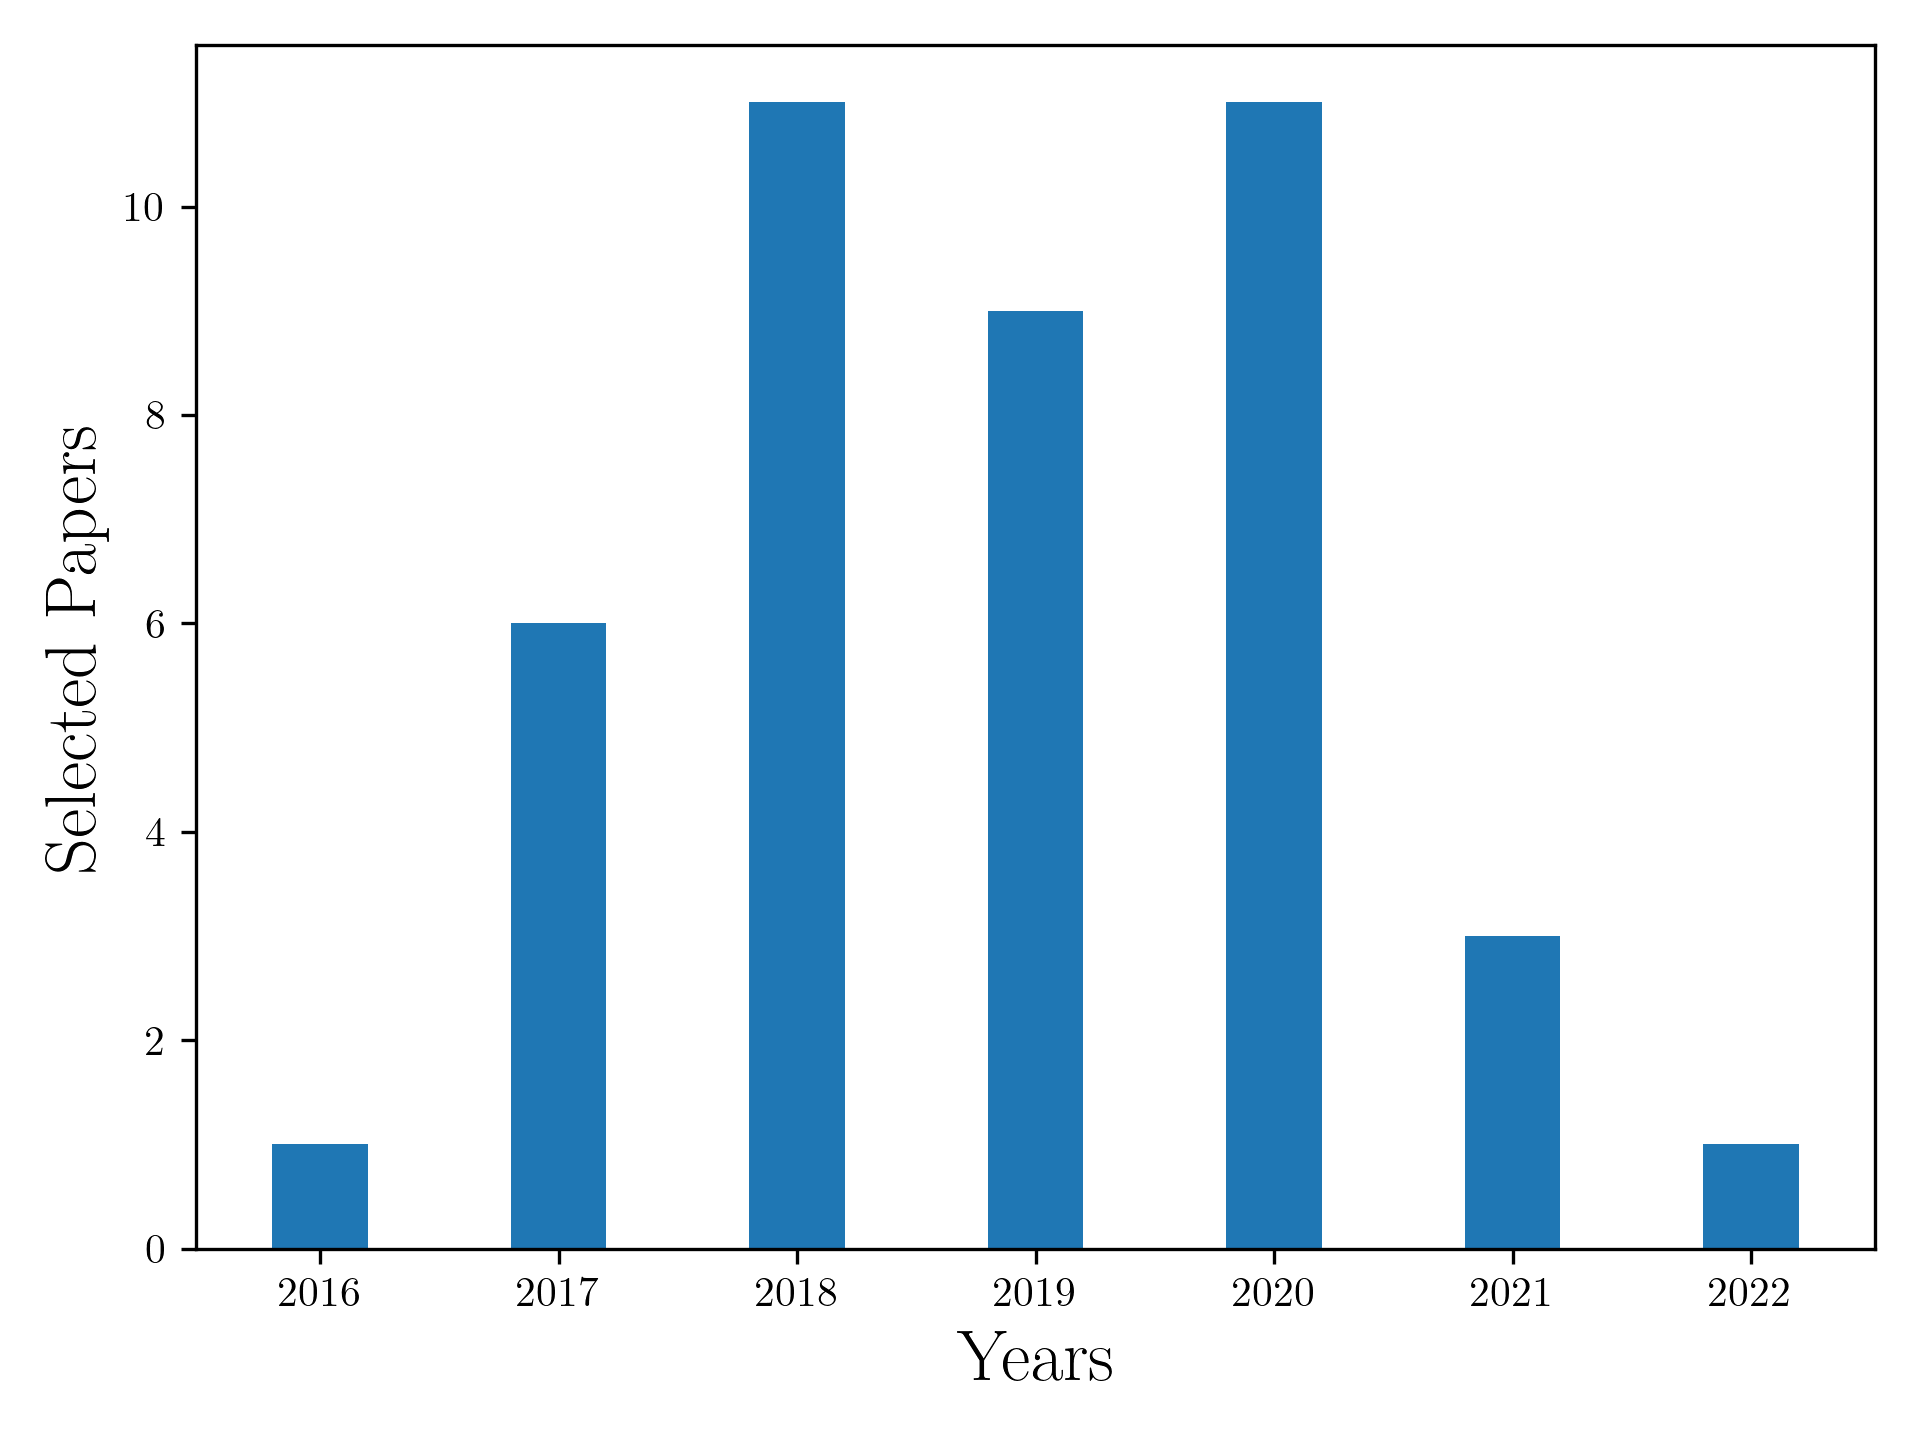
The main criterion for selecting a paper was its impact on the research field of graph neural networks. In the following we describe in detail our procedural steps. As a lower bound for the publication year we selected 2016, the year of the publication of the seminal GCN paper (Kipf & Welling, 2016). On the other hand we considered works that were published before 2023. Most importantly we required that the paper in question has an experimental evaluation, due to the overall objective of the study to investigate the influence of intrinsic dimension. We also included research works that were only in the preprint stage.
As the citation count is an often used proxy for measuring scientific impact, and at the same time readily available, we employ it in our selection process. In detail, we use the Semantic Scholar (Allen Institute for Artificial Intelligence, 2022) search engine for selecting papers based on their average citation count since their publication.333In other words, we rank search results for the keyword graph neural network based on the score: . In our selection process we discarded all papers without publicly available source code for their experiments. We further discarded papers that either covered implementation details of software libraries or focused on applications of existing methods. Finally we refined our selection with the help of several domain experts that pointed us to important research works from the domain of graph neural networks.
Our selection process started out with 9223 unique candidates. We then calculated each paper’s score and selected the 100 papers with the highest scores. We manually ignored works that did not propose a new method in the field of machine learning. This included surveys, coding frameworks, and works that only applied Graph Convolutional Network (GCN) methods to other field of science. Additionally, publications applying methods to very specific data sets and those with time-dependent or spatial data were not included.
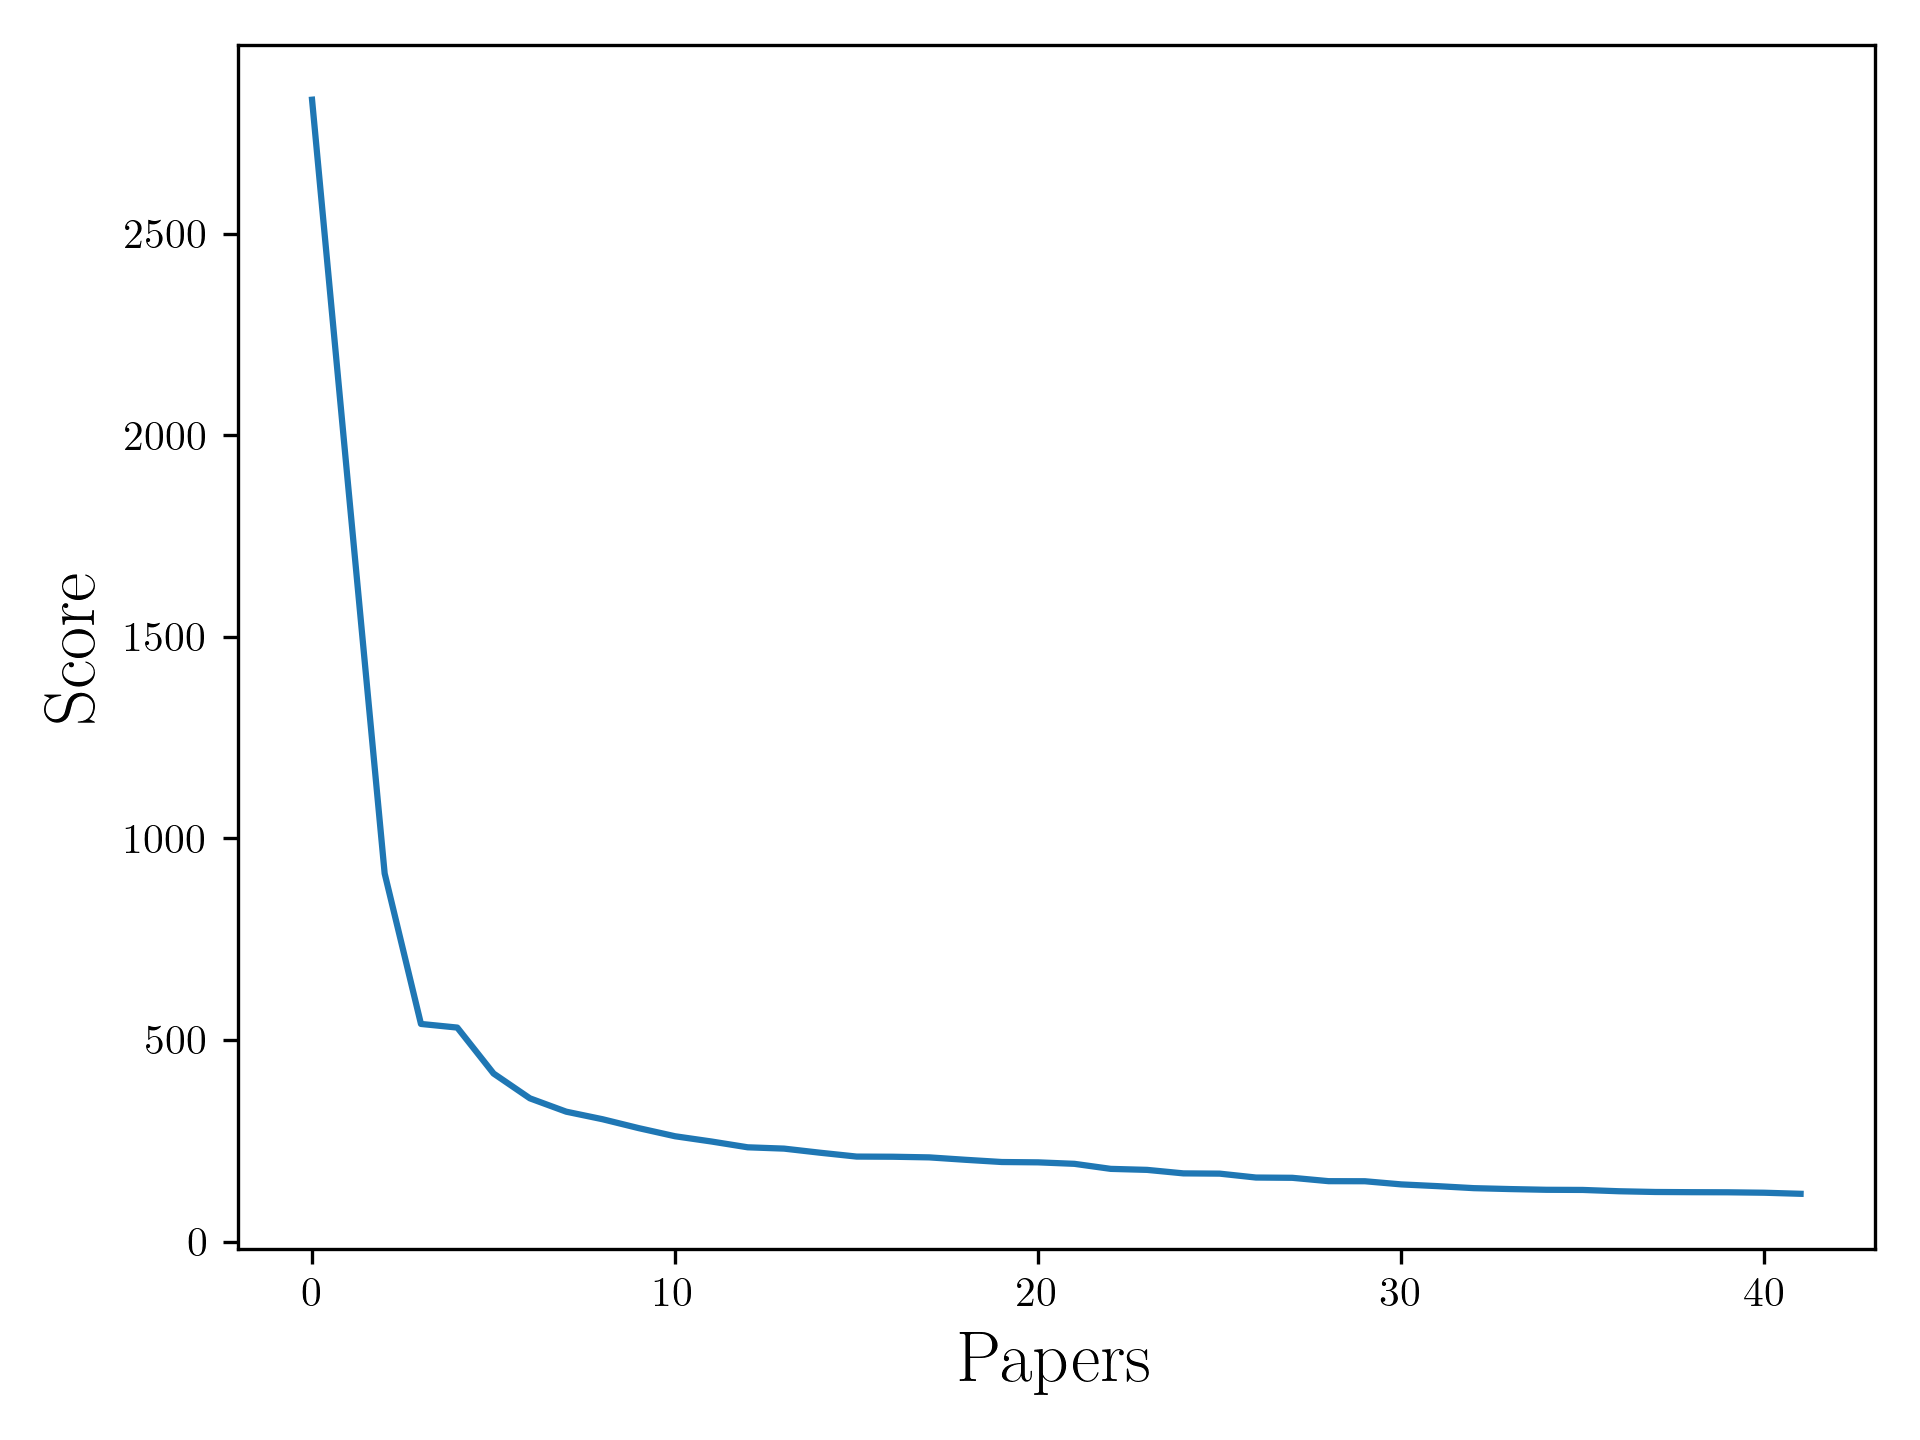
Out of those remaining 55 results we applied the source code criterion and arrived at papers. In Figure 2 we depict the yearly distribution of the number of papers (a) and their score distribution (b).
Now the following limitation of the selection method becomes more apparent. As citations are distributed over publications and there is an increasing number of papers published each year, older papers have advantage over newer ones. Conversely, the evaluation function dampens the influence of older publications to a much lesser extent.
On the other hand we wanted our selection method to reflect a “normal” search behavior of a researcher. The power-law distribution of citations is a well known property of citation networks (Price, 1965) and also somewhat expected because they are social networks which accompany the scientific process. More specifically methods of more frequently cited papers are chosen more often than those with less citations (Hazoglu et al., 2017). The power-law distribution of the citations (and subsequently the score) motivated selecting only a few papers as those publications had the majority of the impact on the field measured by the above method.
We provide a list of considered papers in LABEL:tab:survey:considered in the appendix. We starting with selecting candidates for the reproducibility survey before deciding on the automated process presented above.
Incompatibility in hardware requirements and bugs within the provided source code were the primary reasons for determining at this stage if a paper was not reproducible. If these issues could not be resolved with reasonable effort, even with experience using the libraries, the paper was deemed irreproducible. Regrettably we were not able to fully map the preceding manual pre-selection to an automated process. The difficulty in reproducing the results was due to the uncontrollable non-determinism introduced by the usage of the Semantic Scholar API over multiple runs and new citation data resulting in changes in the rankings over several months.
Furthermore, the collections used did not always include papers for which the reproducibility attempt failed. However, once we obtained a set of considered papers, we refrained from further optimizing the selection process to include all reproduced or not reproduced papers. We acknowledge the possibility of producing a positivity bias by excluding publications where reproducibility failed completely. However, we believe this is preferable to conveying a skewed perspective of the reproducibility of the survey itself and the field of graph neural networks in general.
Therefore, the collection contains 6 publications, for which we completed the complete assignment of the described reproducibility attributes. SGC and GraphSAGE were successfully reproduced candidates determined from prior iterations of the selection process. Since we already had experience with the publication for SAGN+SLE, we included it as well. The final selection of reproduced papers can be seen in Table 1 together with their abbreviations used in the following.
| Abbreviation | Title | Reference Key |
|---|---|---|
| GCN | \usebibentryKipf2016SemiSupervisedCWtitle | Kipf & Welling (2016) |
| R-GCN | \usebibentrySchlichtkrull2017ModelingRDtitle | Schlichtkrull et al. (2018) |
| GraphSAGE | \usebibentryHamilton2017InductiveRLtitle | Hamilton et al. (2017) |
| DiffPool | \usebibentryYing2018HierarchicalGRtitle | Ying et al. (2018) |
| SGC | \usebibentrysgc_proceedingstitle | Wu et al. (2018a) |
| SAGN+SLE | \usebibentrysagn_sle_arxivtitle | Sun & Wu (2021) |
4.2 General Observations with Respect to our Ontology
Reproducing experimental results from the selected scientific research was challenging due to various factors. It is usually the case that papers taken alone do not provide enough information to replicate the experiments independently. Correspondingly we have always started the reproducibility attempt with the associated source code. One major issue is that those repositories often lack crucial dependency information (S1), making it difficult to even run the entry point scripts without errors. To overcome these challenges, it was necessary to search through accompanying discussions and seek clarification on exact parameters and commands that may be missing or not functioning correctly. Additionally it is often the case that the commands provided in the simple documentations to run experiments rarely work as expected (S6, S7). Furthermore, the availability of different data sets adds complexity to the reproducibility process, especially considering that many publications were released before coordinated efforts to unify the data set landscape, for example the Open Graph Benchmark (Hu et al., 2020a). However, data sets are generally accessible, although it is rarely the case that the preprocessing steps are explained (D9). Another common point is the aspect of hyperparameter search, which is not included in most provided software, even when mentioned in the publication (S18). Lastly, it is common for papers to lack the provision of the model (R1) or predictions of the model on specific data (R6). We will include in the following a more detailed description of specific problems grouped by the main categories Data Set, Software and Computational Result that were encountered during the reproducibility attempts. For a better overview we will focus on selected points that stand out.
We want to emphasize that in our ontology it is not beneficial to have an attribute as it is evidence that the reproducibility is more difficult. In cases where it was not clear whether an attribute was present, we chose not to disclose it.
4.2.1 Category: Data Set
GCN: We observe that the data set used in the research is conveniently available as it is included in the repository. However, there is a lack of explanation regarding the preprocessing steps (D9). Despite this, a working function is provided, which can be used for the transformation process.
R-GCN: A similar point as in GCN regarding (D9) applies.
GraphSAGE: The availability of the web of science data set is limited to those with the corresponding license (D6) and upon request (D7). Additionally, manual preparation (download) of the data sets is required (D8).
DiffPool: The implementation does not use proper train/test splits because the approach is only evaluated with k-fold validation (D10).
SGC: A similar point as in GCN regarding (D9) applies.
SAGN+SLE: Except of the general observations of missing explanation of the preprocessing steps (D9) the aspects of the data set category are sufficiently reproducible.
| data set | |||||||||||
|
availability |
transformation |
||||||||||
|
metadata |
download |
preprocessing |
selection |
||||||||
|
D1 |
D2 |
D3 |
D4 |
D5 |
D6 |
D7 |
D8 |
D9 |
D10 |
D11 |
|
| GCN | |||||||||||
| Relational GCN | |||||||||||
| GraphSage | |||||||||||
| Diffpool | |||||||||||
| SGC | |||||||||||
| SAGN+SLE | |||||||||||
4.2.2 Category: Software
GCN: The dependencies are not properly specified (S1), which made it challenging to set up and run the experiments. It is worth noting that the documentation is not up to date (S6) and contains misleading information.
R-GCN: Firstly, there is no requirements file provided (S1), making it challenging to recreate the necessary environment. Additionally, information about the specific Python interpreter version used is hidden. Furthermore, the seeds for randomization are not set (S4).
GraphSAGE: The necessary arguments for the evaluation scripts are not stated (S7), leaving researchers unsure of the required inputs. Furthermore, there are discussions about possible values, adding ambiguity to the code (S8). Additionally, the evaluation scripts themselves are incomplete or misleading, further hindering reproducibility (S9). The software used in the study has some bugs that affect reproducibility (S11). For example, the evaluation script for the ppi data set is incomplete, but a fix is available in pull requests (S12).
DiffPool: Unfortunately there is no explicit list of necessary requirements (S1) and only a minimal README file (S6). Additionally it seems that the provided commands do not work (S7, S8 and S9) and that the seeds for randomization are not set before the experiments (S4). The implementation also did not include steps to reproduce two experiments with the reddit-12k or collab data sets (S16).
SGC: No features of that category that hindered the reproducibility were observed.
SAGN+SLE: Again, there is no requirements file provided (S1). Unfortunately we encountered out-of-memory errors (S15) when trying to reproduce experiments using data sets ogb-papers and ogb-mag. It could be argued that this would mean that the necessary hardware is unavailable (S3) but maybe it could be fixed by changing hyperparameters like batch size.
| software | |||||||||||||||||||
|
environment |
usage |
source code |
|||||||||||||||||
|
dependencies |
variables |
documentation |
scripts |
bugs |
experiments |
||||||||||||||
|
S1 |
S2 |
S3 |
S4 |
S5 |
S6 |
S7 |
S8 |
S9 |
S10 |
S11 |
S12 |
S13 |
S14 |
S15 |
S16 |
S17 |
S18 |
S19 |
|
| GCN | |||||||||||||||||||
| Relational GCN | |||||||||||||||||||
| GraphSage | |||||||||||||||||||
| Diffpool | |||||||||||||||||||
| SGC | |||||||||||||||||||
| SAGN+SLE | |||||||||||||||||||
4.2.3 Category: Computational Result
GCN: When examining the results, it is observed that there are small deviations in the test set accuracy, typically within a range of (R2). However, the statistical analysis in the paper is weak as it does not provide information on the standard deviation (R5). Although the authors claim to have run the experiments with multiple seeds, there is no evidence of this in the code, which raises concerns about the robustness of the reported results. We were not able to reproduce the experiments with the neil data set because of the difficulties to prepare and use the data set.
R-GCN: A similar observation regarding multiple runs was made for this publication as well. Additionally, the results of the study exhibit both small deviations and strong differences in different parts. For the AIFB, MUTAG, and AM data sets, small deviations of approximately in accuracy are observed (R2). However, for the BGS data set, a significant difference of is observed, indicating a substantial variation in the results (R4).
GraphSAGE: The results of the study exhibit small deviations, typically within a range of , for the available data sets (R2). However, the statistical analysis is weak, suggesting that the experiments were only run once (R5).
DiffPool: Due to time constraints we were only able to reproduce the experiments for the DD and Enzymes data set and observed small deviations (R2). Even though k-fold validation was used the experiment was only run once (R5).
SGC: No feature other than the usual were observed.
SAGN+SLE: Similar to other survey candidates we obtain results that exhibit small deviations, typically within a range of , for the available data sets (R2).
| computational result | ||||||
|---|---|---|---|---|---|---|
|
model |
predictions |
|||||
|
|
||||||
|
R1 |
R2 |
R3 |
R4 |
R5 |
R6 |
|
| GCN | ||||||
| Relational GCN | ||||||
| GraphSage | ||||||
| Diffpool | ||||||
| SGC | ||||||
| SAGN+SLE | ||||||
4.3 Discussion
Regarding the reproducibility ontology we observed that most paper look almost the same in data set category but needed quite different effort during reproducibility attempt. This is particularly visible in the fact that attributes D1 to D5 are not fulfilled in any of the attempts. The ease of reproducibility was decided mainly through information provided in the README document of the source code. This means that the ontology does not capture this aspect that well for this category even if there is a corresponding attribute in the source code category.
The software category on the other hand allowed for a very good differentiation of the different papers with regard to their reproducibility. Here too, some attributes do not seem to be contribute to deciding on the degree of reproducibility. However, further reproducibility attempts may find that these currently unused attributes become helpful for this goal.
The computational result category has some attributes that are common to all reproduced papers. This suggests that the corresponding properties (providing model weights and predictions) are the most difficult to obtain. We observed multiple papers that included only a low number of repetition for the experiment in the original paper. This could be due to higher computing requirements. We also found that we had included too few cases of possible evaluation scenarios, and that those that were included were too broadly defined. Furthermore, there are no attributes to assess the degree of reproducibility of follow-up or downstream tasks also addressed in the original work.
5 Influence of Intrinsic Dimensionality on Model Performance
The second main goal of the present work is to investigate the influence of intrinsic dimensionality on model behavior. We begin by stating the mathematical groundwork of the concept of geometric \acID in Subsection 5.1 and afterwards present our experiments and results.
As already mentioned the geometric intrinsic dimension (Hanika et al., 2022) is a computational accessible approach for measuring how a given data set is affected by the phenomenon of concentration of measure (Gromov & Milman, 1983; Milman, 1988; 2000), which itself is deeply connected to the \aclCOD (Pestov, 1999; 2007b; 2007a; 2010b; 2010a). Of central importance are feature functions that concentrate. This means that they map most of the values of their domain near the mean or median of their image set. Pestov has surmised that features of this type contribute the most to the \aclCOD. In his approach all 1-Lipschitz function are considered as potential feature functions. In the revised axiomatic system introduced by Hanika et al. (2022) the notion of a dimension function emerged. Such a function allows for estimating the extent to which the provided function concentrate on the data set without having to evaluate all possible feature functions. This is motivated by the fact that machine learning algorithms usually only have access to a limited selection of feature functions of this type. The computations or approximations of the dimension function of a data set were improved in recent works (Stubbemann et al., 2023a). In this work we want to build upon the results obtained by using the geometric intrinsic dimension for feature selection (Stubbemann et al., 2023b).
5.1 Foundations of the Concentration-based Intrinsic Dimension
We start by briefly recapitulating the mathematical definitions that the \aclID builds upon. The interested reader is referred to the cited works for more in depth explanations.
Definition 1.
Let be a triple consisting of a set of data points and a set of feature functions from to . Consider the function . We require that fulfills and is a complete and separable metric space with being a Borel probability measure on . We call a geometric data set.
In the following we will limit our considerations to the special case of finite geometric data sets, hence those with and being the normalized counting measure as a further restriction.
We will now introduce the building blocks that give rise to a dimension function that fulfills the aforementioned axioms postulated in Hanika et al. (2022). Such a function will indicate a geometric data set with data points that can be better discriminated by the corresponding set of feature functions by a low value.
Given a feature we want to evaluate how it can discriminate sets of a specific measure (e.g. size ) for a fraction of the whole . For this we use can use the following function:
| (1) |
By considering all feature from the feature set we arrive at the
| (2) |
When considering all possible values for we obtain a way to describe the ability of a feature set of a geometric data set to discriminate data points in :
| (3) |
It turns out that we need one more step to get the dimension function we are looking for:
| (4) |
For the case of finite geometric data sets it follows that the \acID can be explicitly calculated with the help of the following expression
| (5) |
Using the notation , and this can be rewritten as
| (6) |
5.1.1 Approximation of Intrinsic Dimension
The straightforward computation of the equations in the previous section is hindered by the task to iterate through all subsets of size . This yields an exponential complexity with respect to for computing . As suggested by Hanika et al. (2022) and later proven by Stubbemann et al. (2023a), we can instead use algorithms with a quadratic runtime complexity in to compute the \acID. Furthermore for settings where a quadratic runtime is still not sufficient, the authors propose the following concept.
Let be a strictly increasing and finite sequence of natural numbers. We call a support sequence of . We additionally define
| (7) | ||||
and call accordingly the lower intrinsic dimension of and the upper intrinsic dimension of .
This results in giving us lower and upper bounds for and thus for the \acID. By using upper and lower bounds, we can obtain the following approximation of the \acID:
| (8) |
Stubbemann et al. (2023a) provides an algorithm for calculating this approximation.
5.2 Dimension based Feature Selection
The intrinsic dimension of a data set refers to a measure of concentration that capture the underlying structure or information of the data. It is challenging to quantify the impact of intrinsic dimensionality on a particular machine learning method, which motivates the need to investigate its effect. On way to achieve that is by discarding the features that have the most significant influence on the dimensionality of the data set. By removing these features, we can observe whether there is a change in the performance of the trained model or not. This approach allows us to examine the relationship between intrinsic dimensionality and model performance. Feature selection can be seen as a means to an end in this research. It serves as a tool to identify and eliminate the features that contribute the most to the dimensionality of the data set. To calculate the influence of dimensionality and perform feature selection, we rely on methods demonstrated in Stubbemann et al. (2023b) which we will briefly include in the following.
The discriminability of with respect to feature is defined as
| (9) |
Note, that one data point with an outstanding value can have a strong influence on via drastically increasing . To weaken this phenomenon, we weight higher for smaller values of .
The normalized discriminability of with respect to which we define as
| (10) |
The normalized intrinsic dimensionality of with respect to is then given via
| (11) |
The higher this value is for a given feature, the more it contributes to the intrinsic dimension and as such diminishes the possibility of distinguishing the data points.
Stubbemann et al. (2023b) provides an algorithm for calculating the normalized intrinsic dimensionality directly.
5.2.1 Approximation of Discriminability
Unfortunately, an explicit calculation of the discriminability is infeasible for larger data sets as the algorithm scales quadratically with the number of data points. We can, however, use a similar approach to the previously referenced method of approximating the intrinsic dimension with the help of support sequences to approximate the discriminability as well.
For a feature and a support sequence we call
| (12) |
the upper normalized discriminability with respect to and and
| (13) |
the lower normalized discriminability with respect to and .
We define the upper/lower normalized intrinsic dimensionality with respect to and via and . Equipped with these we then can assign each feature their approximated normalized intrinsic dimensionality with respect to and :
| (14) |
Stubbemann et al. (2023b) provides an algorithm for calculating this approximation of the normalized intrinsic dimensionality.
5.3 Experimental Execution and Impact on Intrinsic Dimension
As we want to demonstrate the effect of intrinsic dimension of the different data sets on the methods of the reproduced papers we discard features with the highest (approximated) normalized intrinsic dimensionality.
For this we first extract the logic for loading and preprocessing from every paper source code and use a concatenation of samples from both train and test data in the cases where it could not be avoided. Crucially we do not give the machine learning method more access to the test data than in the original implementation.
Contemporary machine learning data sets are usually comprised of a matrix. For graph data, this usually refers to the data of the nodes . In addition, the connectivity information, given by the adjacency matrix , and any edge features, are also considered. However, aggregating this information into a feature matrix by neighborhood aggregation of the form (for a small positive integer) does not change the qualitative insights provided by the intrinsic dimension, as shown by previous work (Stubbemann et al., 2023b). Because additionally many methods themselves perform forms of aggregation, we have refrained from taking neighborhoods into account. Therefore we use only the matrix of node features of shape where indicates the number of samples and the number of attributes per sample. For each data set in our investigation we use the following representation as a geometric data set as introduced in Definition 1. The set is comprised of the samples where each sample consists of the attributes . We chose the set of component selectors as the set of feature functions . Together with the counting measure for a subset we complete our special instance of the geometric data set .
The sizes of all used node feature matrices can be seen in Subsection 5.3.
| Data Set Name | \colb | \colc | \cold | \cole |
Data set preparation
For each research paper, we initially extract the essential components for loading and preprocessing the data sets from the source code supplied by the authors. We use these to obtain the node feature matrices of the data sets used. In instances where it is unavoidable, we resort to concatenating the node feature matrices from both the training and test data. An important aspect to note is that we strictly ensure the machine learning method does not have more access to the test data than what was granted in the original implementation.
Our rationale for applying feature selection after preprocessing is as follows: With our approach we want to investigate how methods are influenced by the data on which they are applied, e.g. how the model “sees” the data. Some forms of preprocessing change the empirical data distribution and preprocessing usually does not contain any learnable parameters. Additionally the model in question has almost never explicit information about the applied preprocessing steps. Thereby we do not consider the preprocessing steps as part of the model. This makes it easier to disentangle the influence, otherwise we would also include the change of the preprocessing by the feature selection in the resulting observations and discussions.
Feature selection
We used the algorithm for direct calculation of the discriminability (Stubbemann et al. (2023b), Algorithm 1) for data sets with less than samples. For larger data sets, we employed the approximating version (Stubbemann et al. (2023b), Algorithm 2). In those cases we first choose a geometric sequence of length with and and use the support sequence (Subsection 5.2.1) which results from via discarding duplicated elements. We then discarded for every factor the corresponding fraction of the features with highest (approximated) normalized intrinsic dimensionality from all data points. After the selection we run the machine learning algorithms of the corresponding papers on the feature reduced data sets with the same (hyper-) parameters configuration as the original. For evaluation we collected the same scores as the original works (accuracy or f1 scores) over repeated training runs with ten different seeds.444An exception was the diffpool enzymes experiment, where only a smaller number of runs was feasible given the runtime of the algorithm. We do not test other feature selection methods as similar investigations were already done in Stubbemann et al. (2023b).
5.4 Observations
We present in this section the computational results and observations for the experiment. Here we focus on the details corresponding to the two research works GCN and SAGN+SLE. Afterwards we will state general observations for the remaining experiments, but refer the reader to Appendix C for accompanying plots.
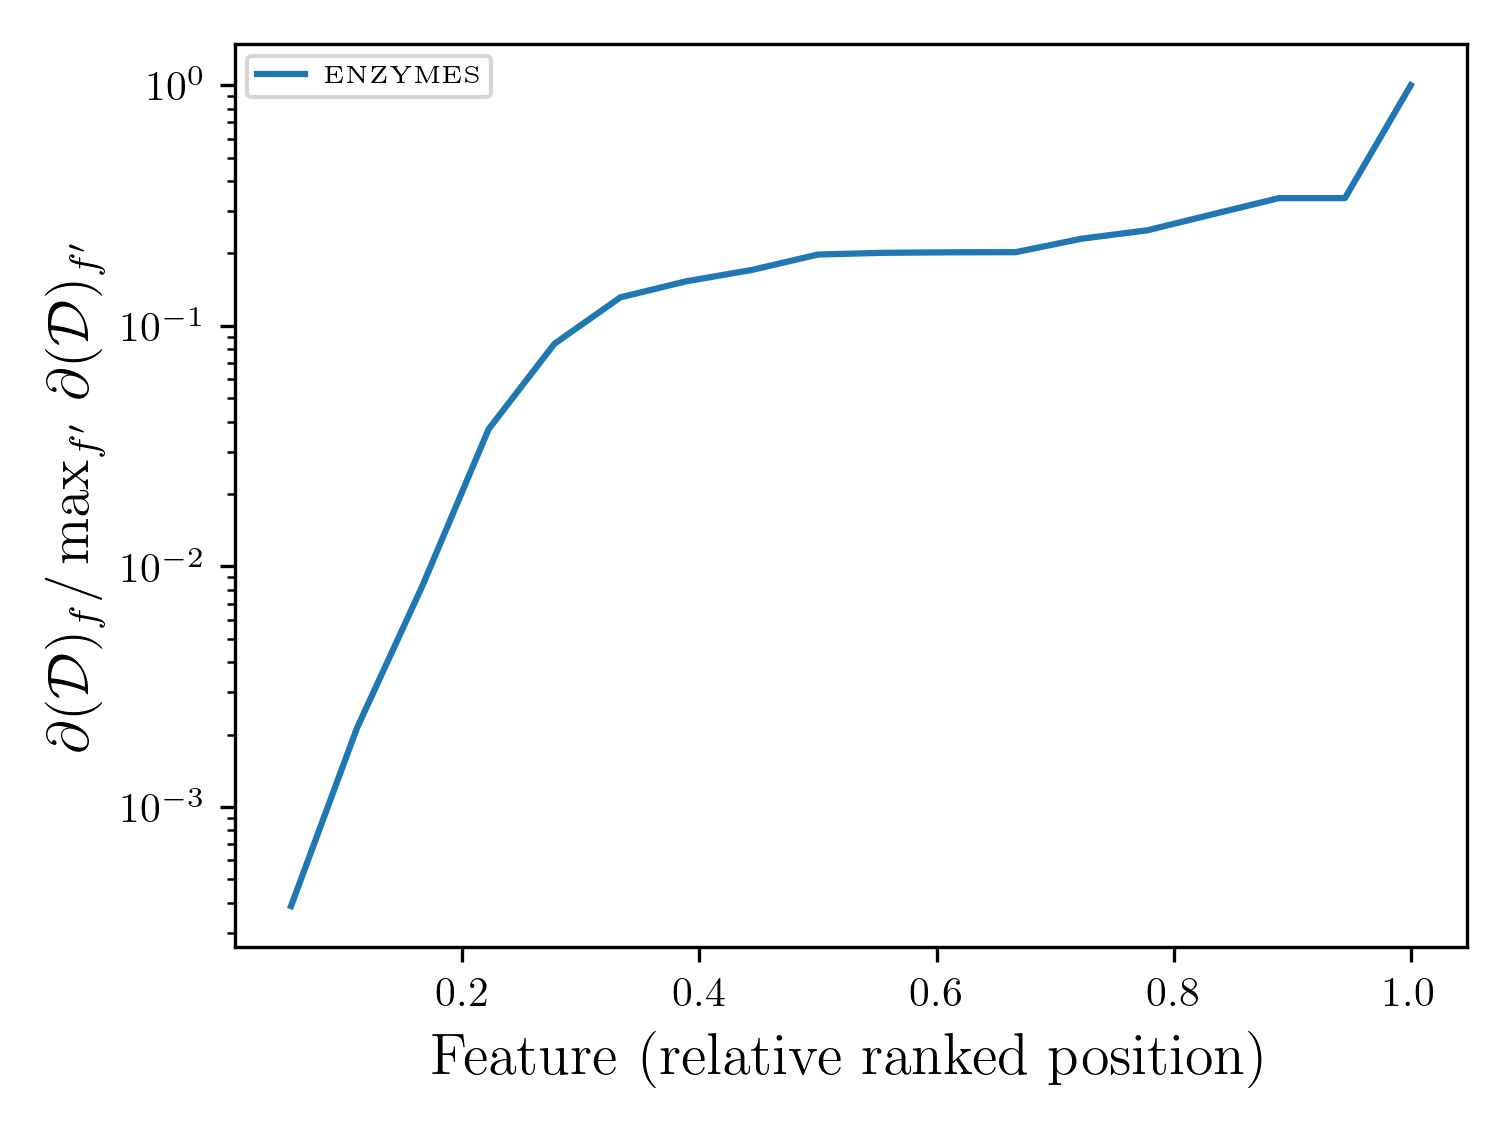
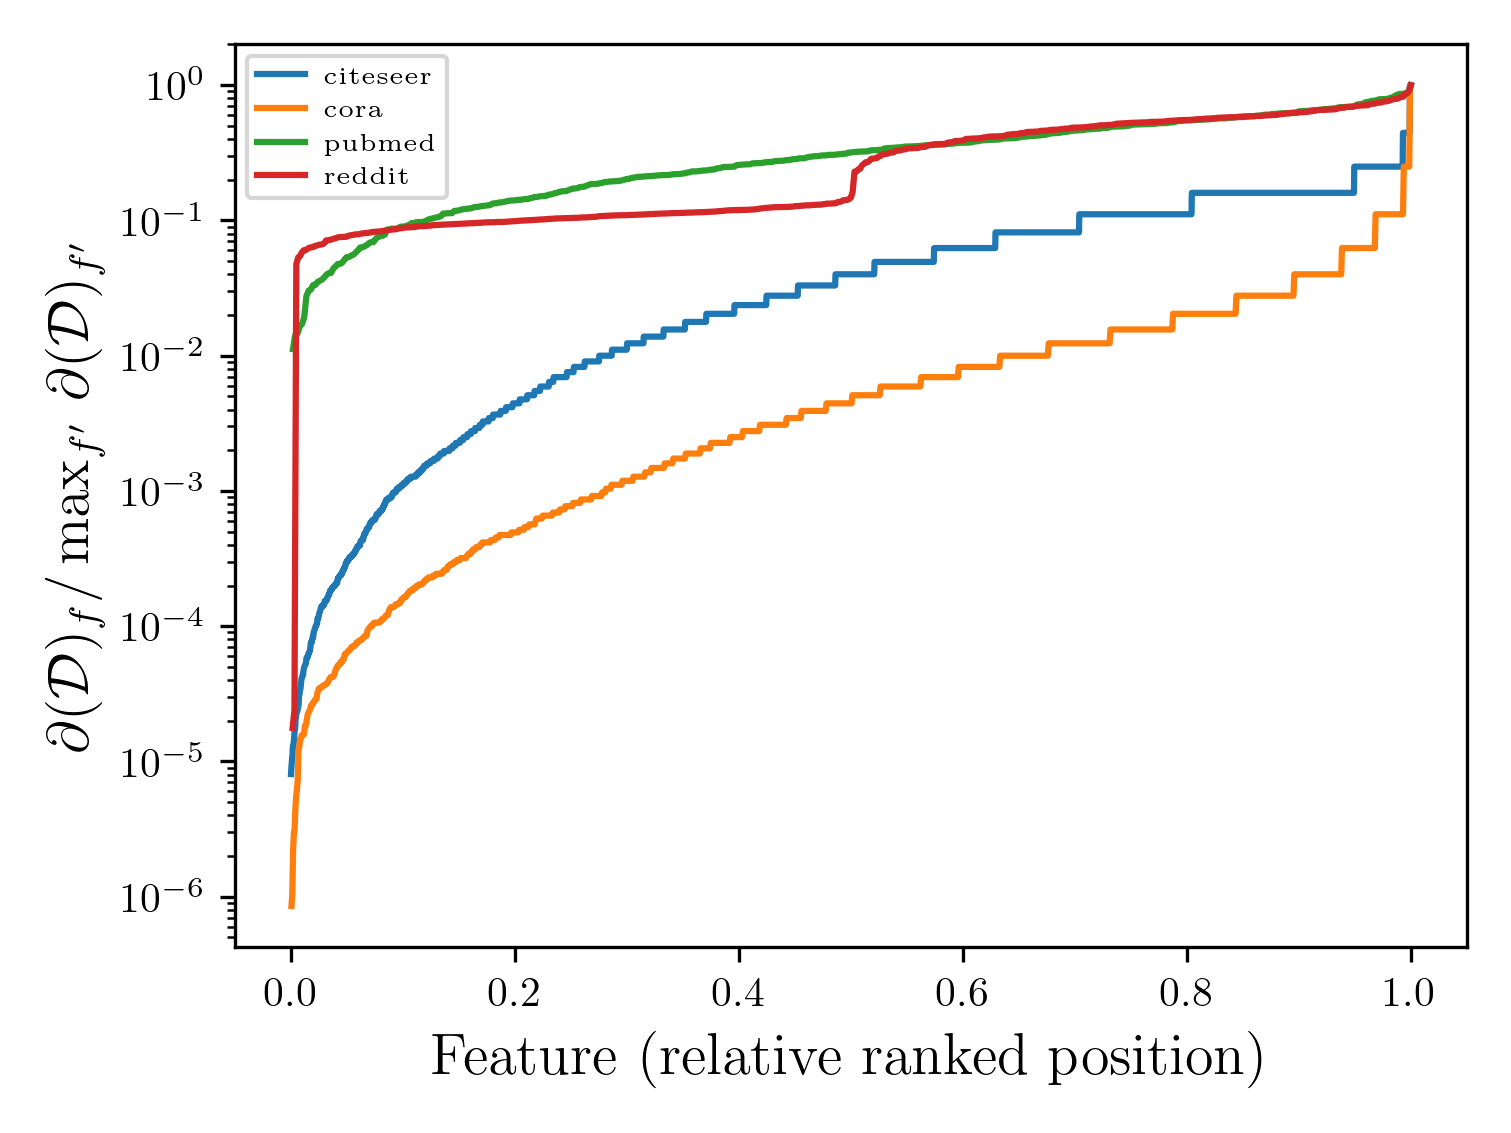
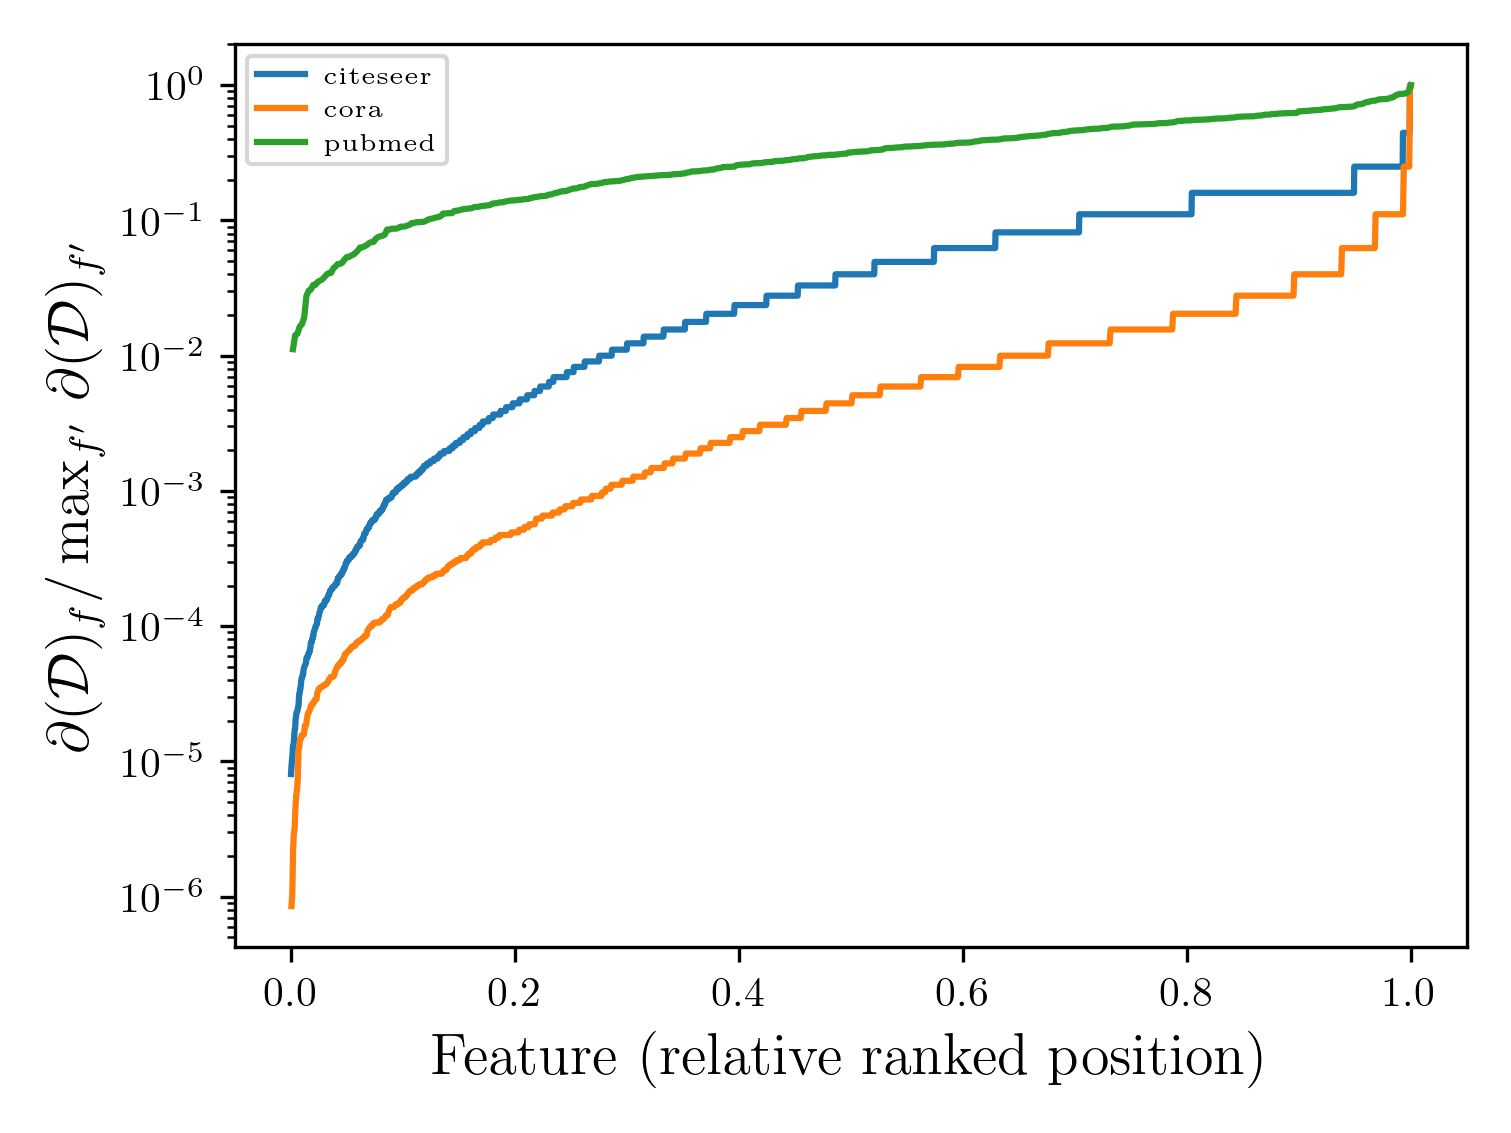
In Figure 2(c) we show the analysis for the intrinsic dimensionality of the three data sets from GCN. Because the data sets are differently sized we need to find a common representation. First we order the feature set for each data set using the normalized intrinsic dimensionality of each feature as the score. On the x-axis we give the relative position of the sorted feature set, i.e., position indicates that the corresponding feature is at the sorted position . As the measured normalized intrinsic dimensionality can vary widely between the data sets we decided to normalize it by dividing, for each data set , the value by . The corresponding values are depicted in the y-axis in Figure 2(c).
We observe that all curves increase monotonically in value with respect to the ranked position of the features. This is expected as we sort by this value. However, the slope is solely dependent on the individual contributions of the features to the intrinsic dimension. The stair case pattern is not an artifact of the plot but rather results directly from the data set and its preprocessing. This indicates that a lot of features have the same normalized intrinsic dimensionality per step.
We further observe that the pubmed data set (green) entails features with a similar high normalized intrinsic dimension. Or more general, the higher the line in the plot the more similar are the values of the individual features of a data set compared to the maximal feature value . This allows for comparing the feature behavior of the different data sets. For example, with respect to this property we observe that the cora data set (orange) has more diverse distributed features compared to the pubmed or citeseer data set (blue).
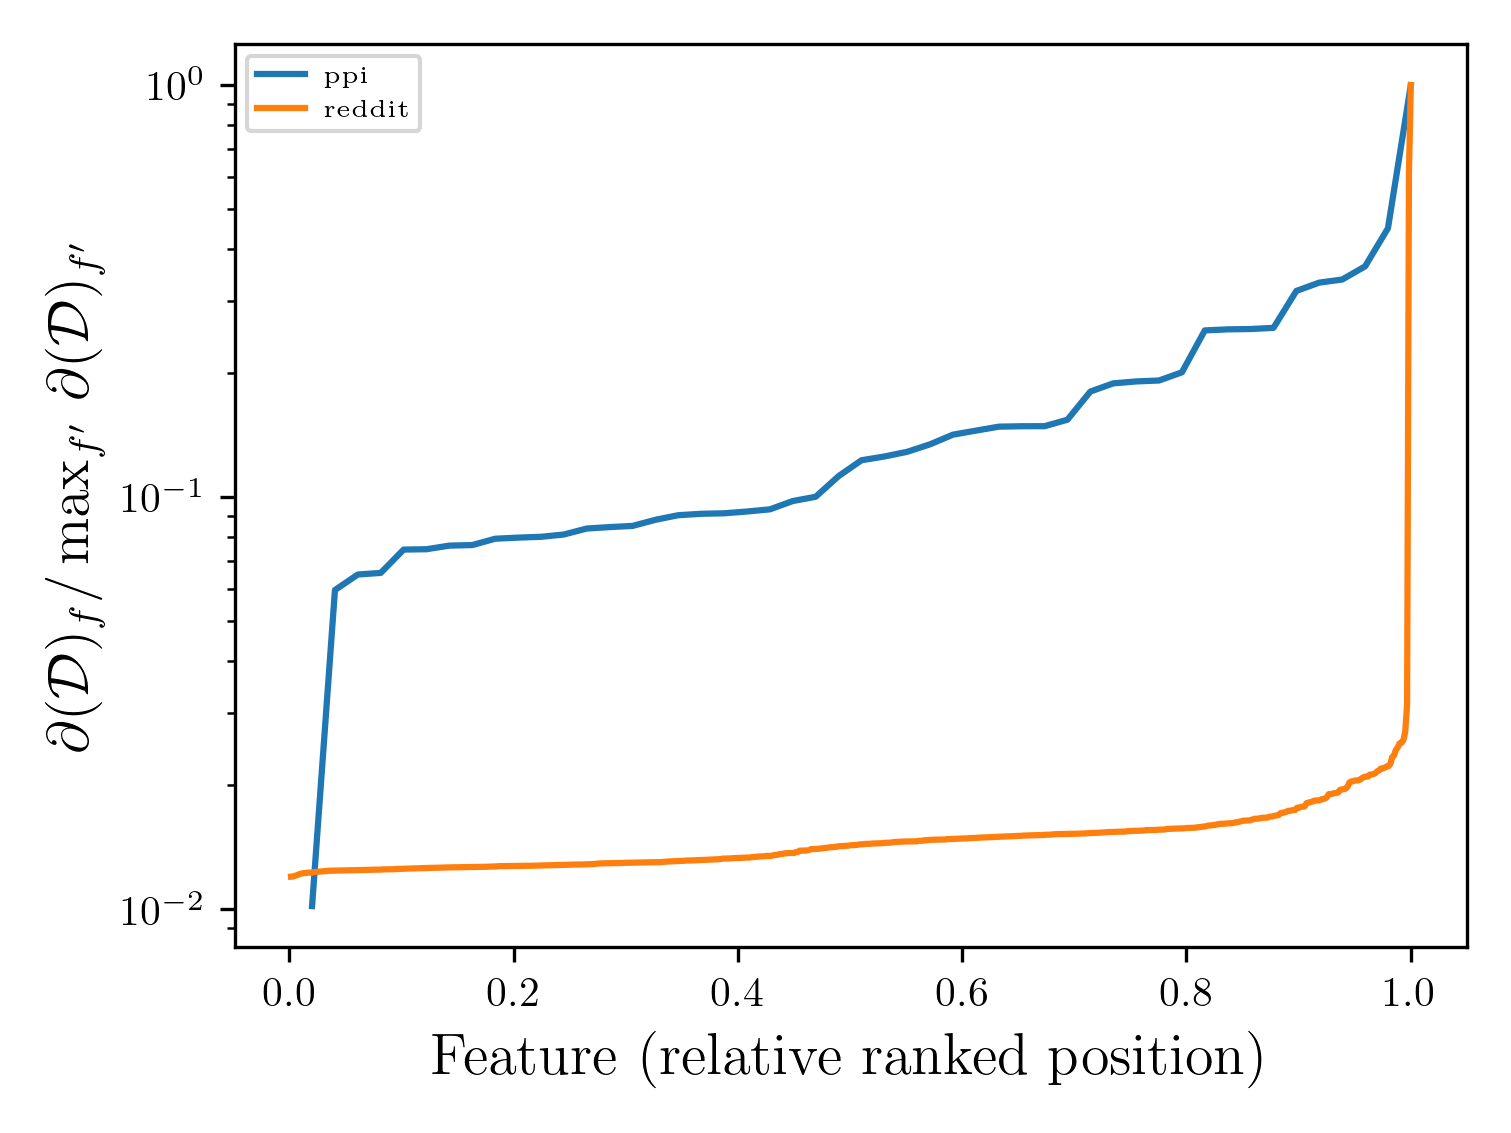
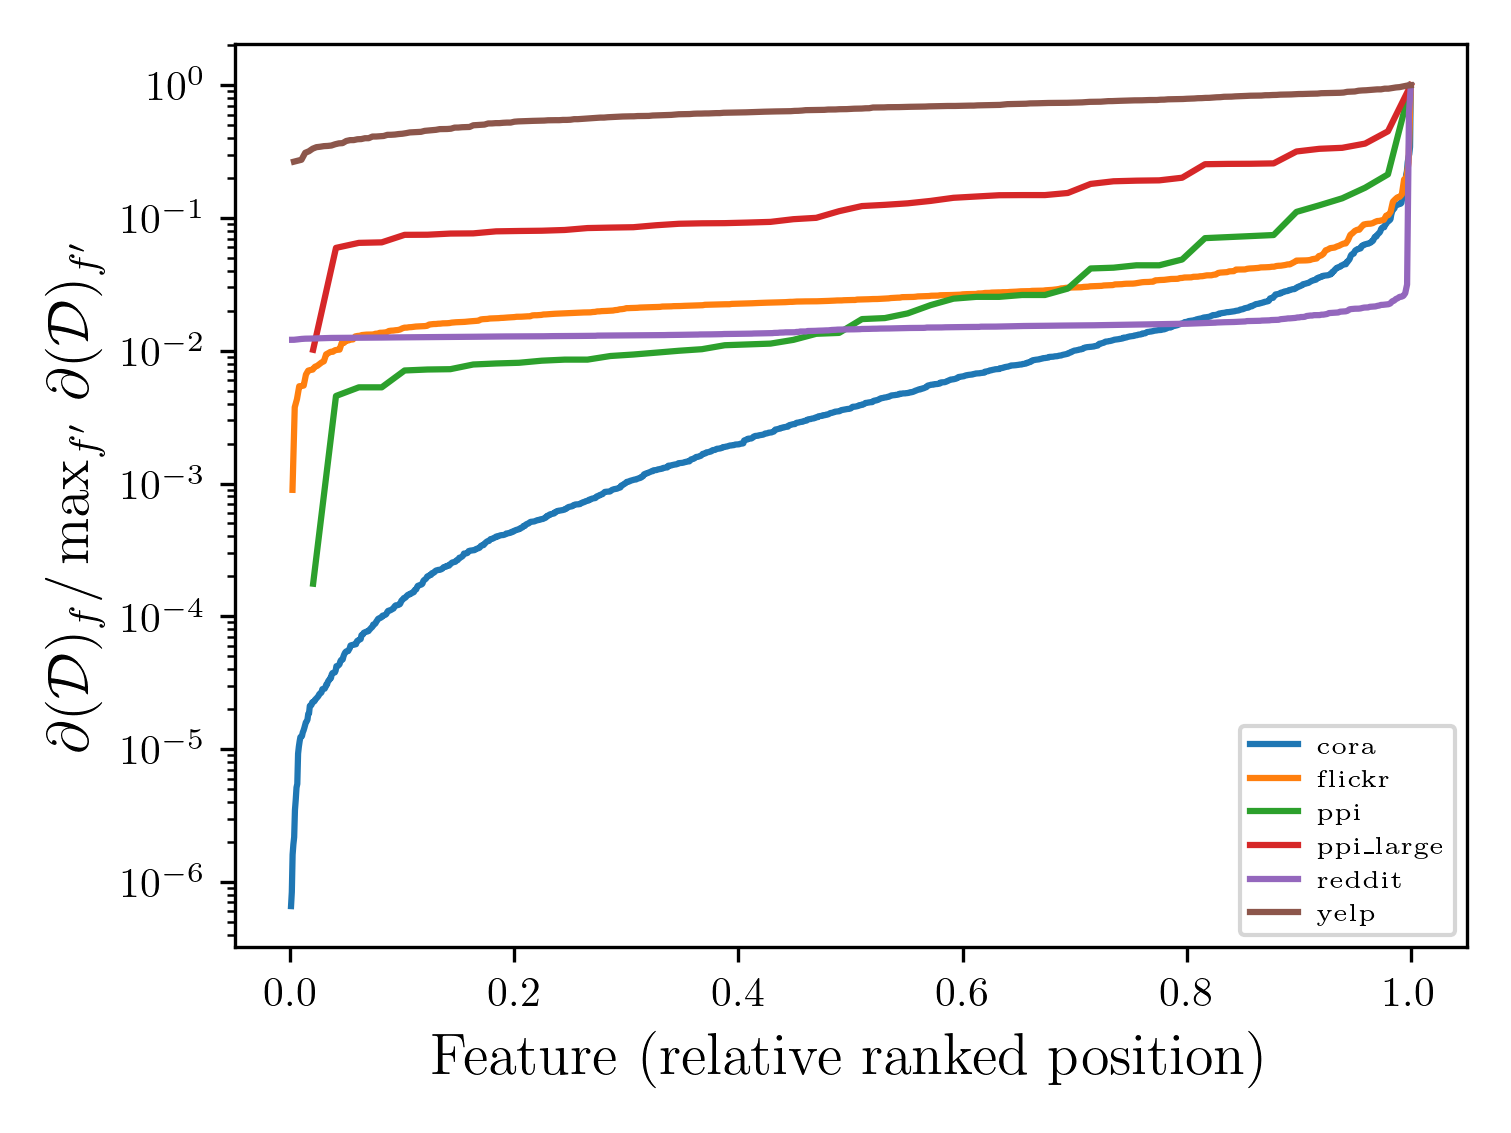
Figure 3(a) demonstrates that the distributions for the normalized intrinsic dimension of the data sets used for the SAGN+SLE method are of greater variety than those discussed earlier. We can see that the cora data set does not have a prominent stair case pattern, which can be explained by different preprocessing steps that smooth the features relative to each other. One standout distribution is that of the reddit data set, which is shaped like a hockey stick.
As we calculated the (approximated) normalized intrinsic dimensionality on the data sets, occasionally different normalized rankings for what seems to be the same data set emerged through different steps of their preprocessing. A highly visible example can be found in Appendix C with the reddit data set in the GraphSAGE (Figure 7(a)) and SGC (Figure 8(a)) experiments.
Accuracy and Intrinsic Dimension
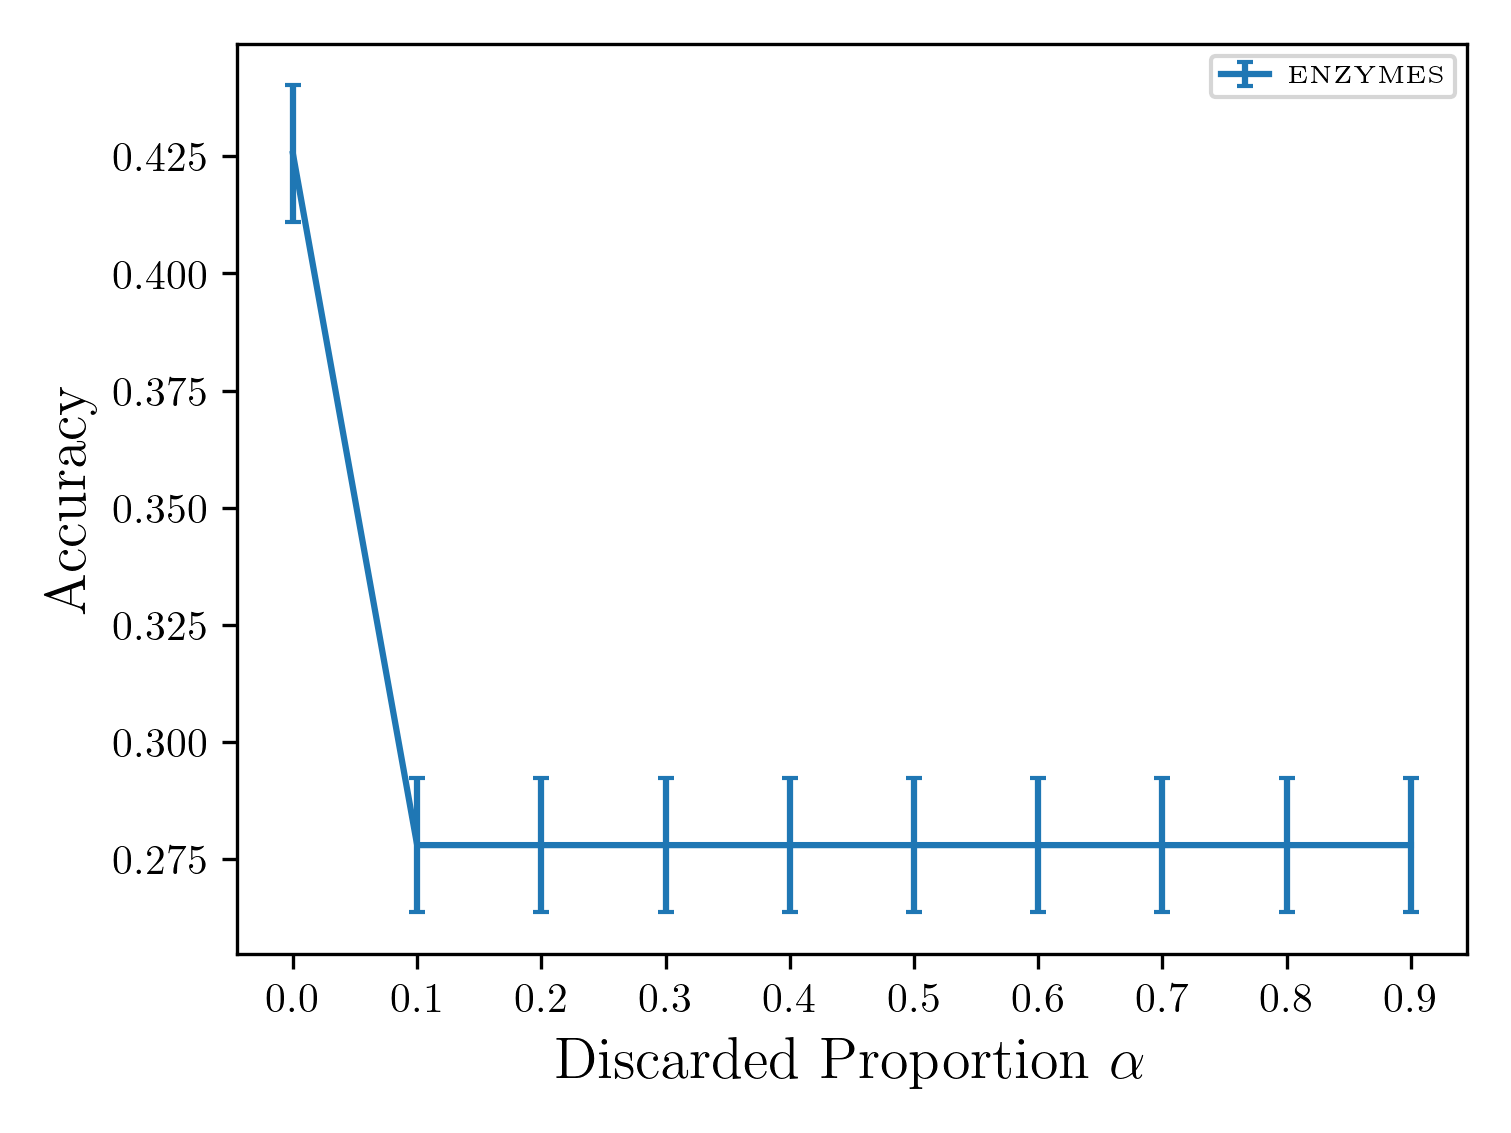
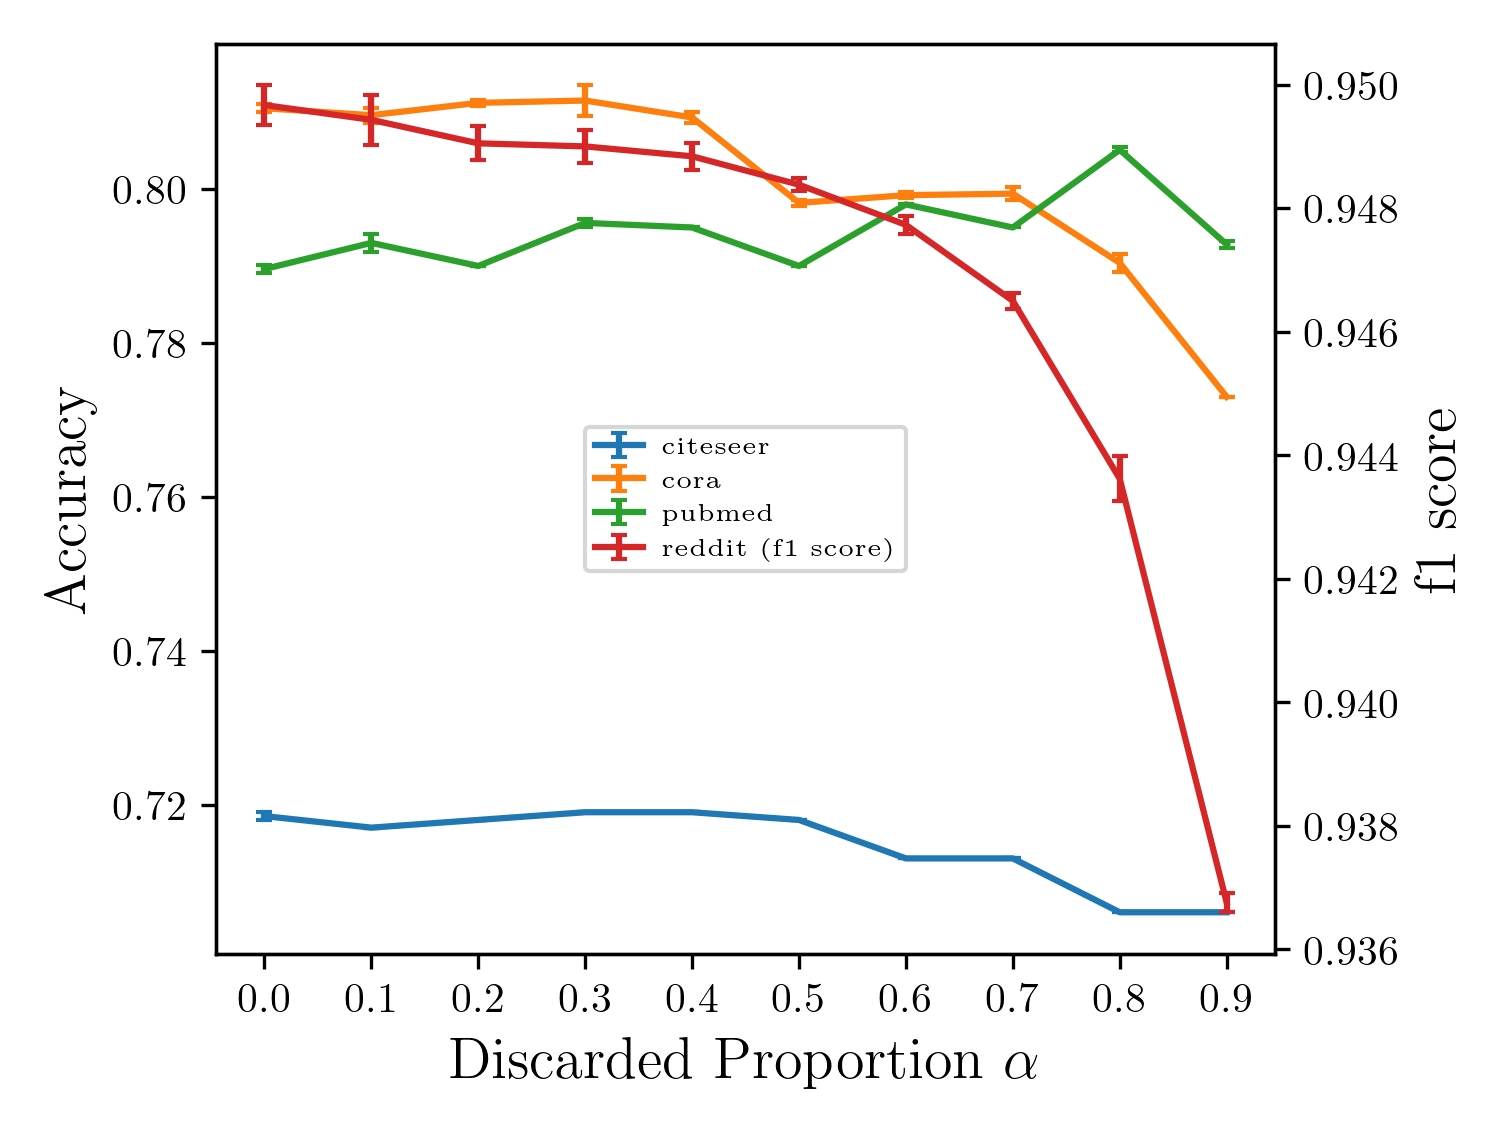
Figure 2(d) shows the accuracy of the resulting model when applying the GCN machine learning method to the feature reduced data sets. In this experiment, both the training and test data sets are feature-reduced. This ensures that the algorithm is trained and tested on the same set of features.
For each data set we reduced the number of features in steps of 1% up until 10% was reached. Here the percentage steps are taken with respect to the size of the complete feature set . Afterwards we continued with 10% steps. Both are indicated on the x-axis in Figure 2(d). After training the corresponding model we collected the obtained accuracy, similar to the original work. To achieve a meaningful estimate for the model behavior with regard to our dimensional data set perturbation, we measure the average over ten identical runs with different seeds. The resulting standard deviation is shown via error bars in the plot. Similar plots for the other papers can be found in Appendix C.
We observed that the methods sometimes failed to converge for smaller discarding values (). This behavior was very irregular and we did not include these runs and their corresponding discarding values in the figures. Our investigation into the causes showed that this was usually due to some artifacts of the machine learning method, such as early stopping.
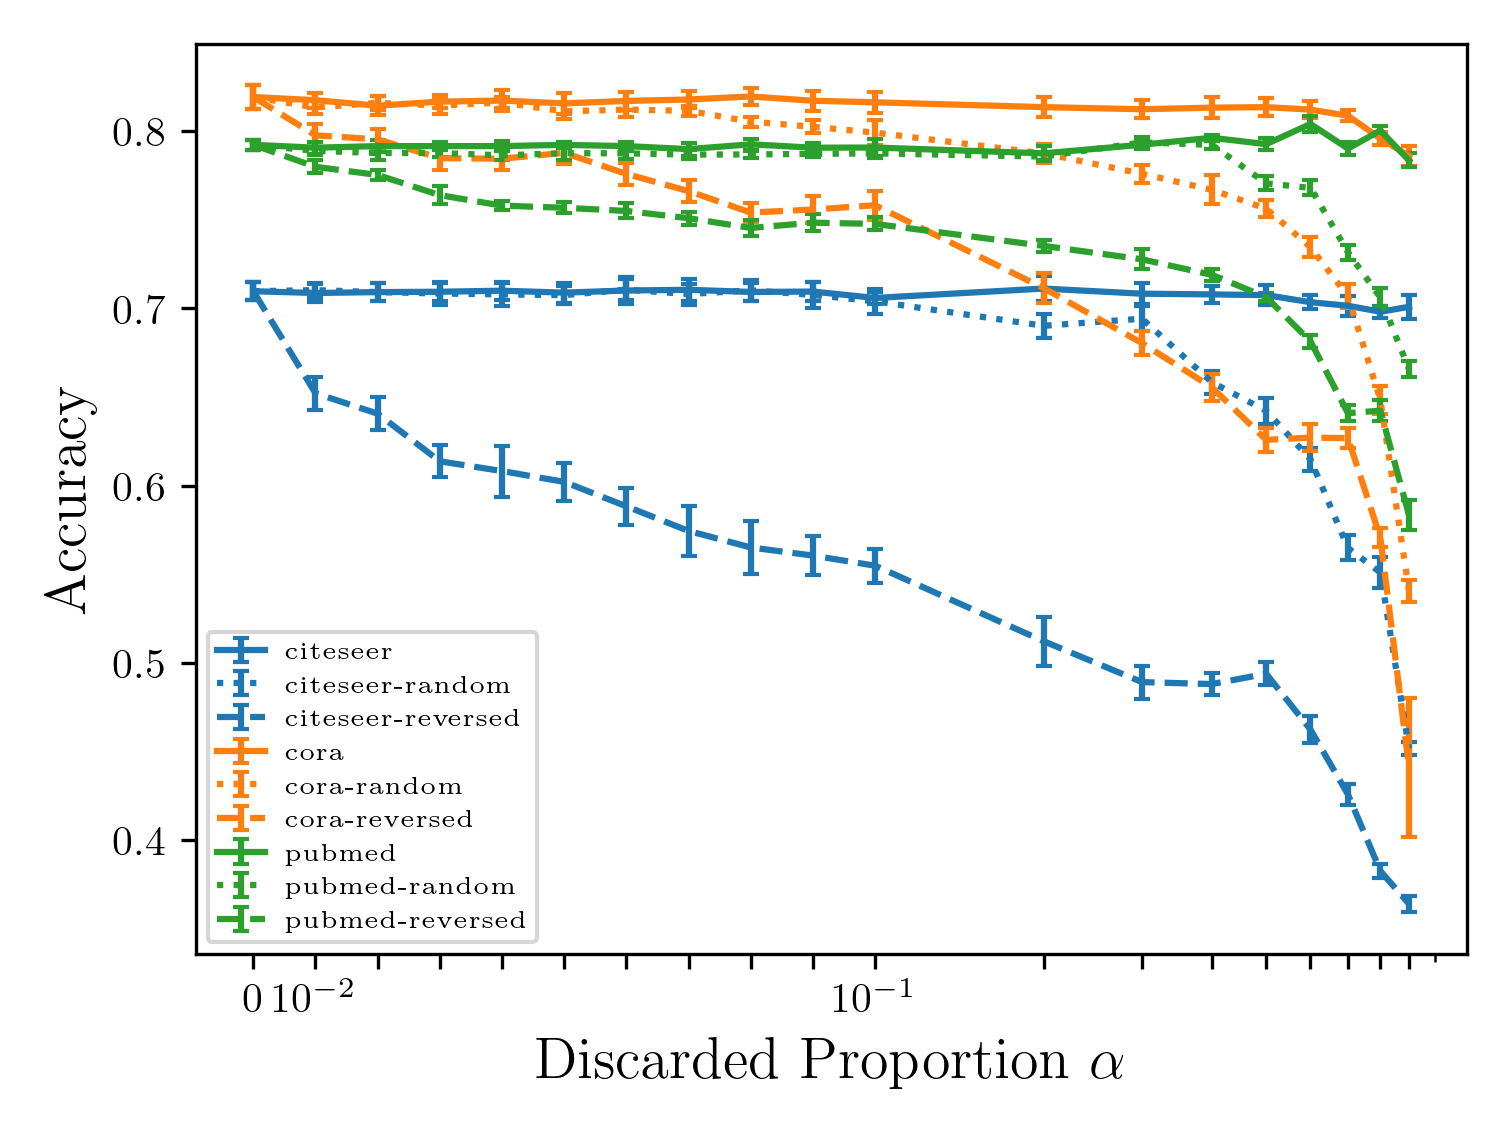
Additionally we conduct further experiments with random or reversed feature selection, where the latter means the discarding of features with the lowest normalized intrinsic dimensionality first. For the sake of completeness, by random we refer to the process of randomly selecting features from . For all discarded data sets we applied the GCN method with ten different seeds. Due to the expected long run times, these extended experiments (random/reversed, 1% discard steps) were not conducted for methods other than GCN.
For all data sets the resulting model performances are relatively stable under the aforementioned primary discarding method. Yet when applying the reverse selection method a fast deteriorating performance can be observed. This behavior starts already at the smallest discarded proportion and is very pronounced.
A more intricate detail can be observed for the random discarding method by combining the information from the two Figures 2(c) and 2(d). We find that the higher the line in Figure 2(c) the later (i.e., higher values of ) the break off between performance of normal and random discarding in Figure 2(d).
We also see small fluctuations and drops in performance at the highest discarding values. This becomes more apparent when directly visualizing the differences to the proposed discarding method.
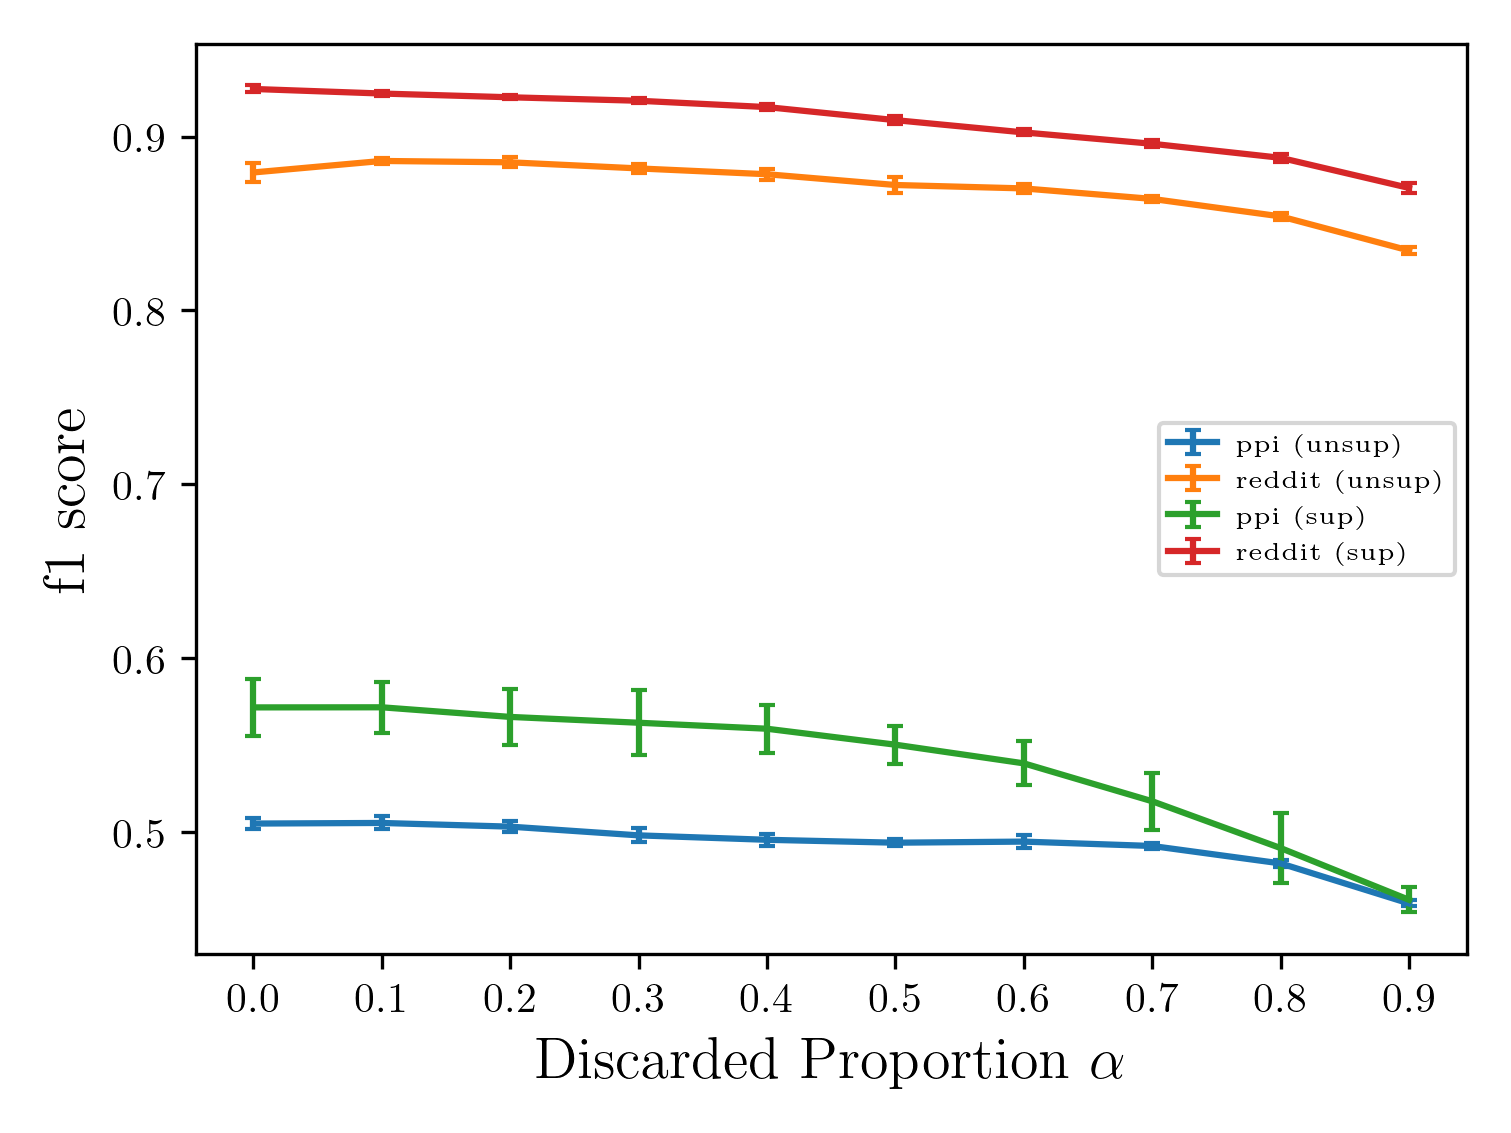
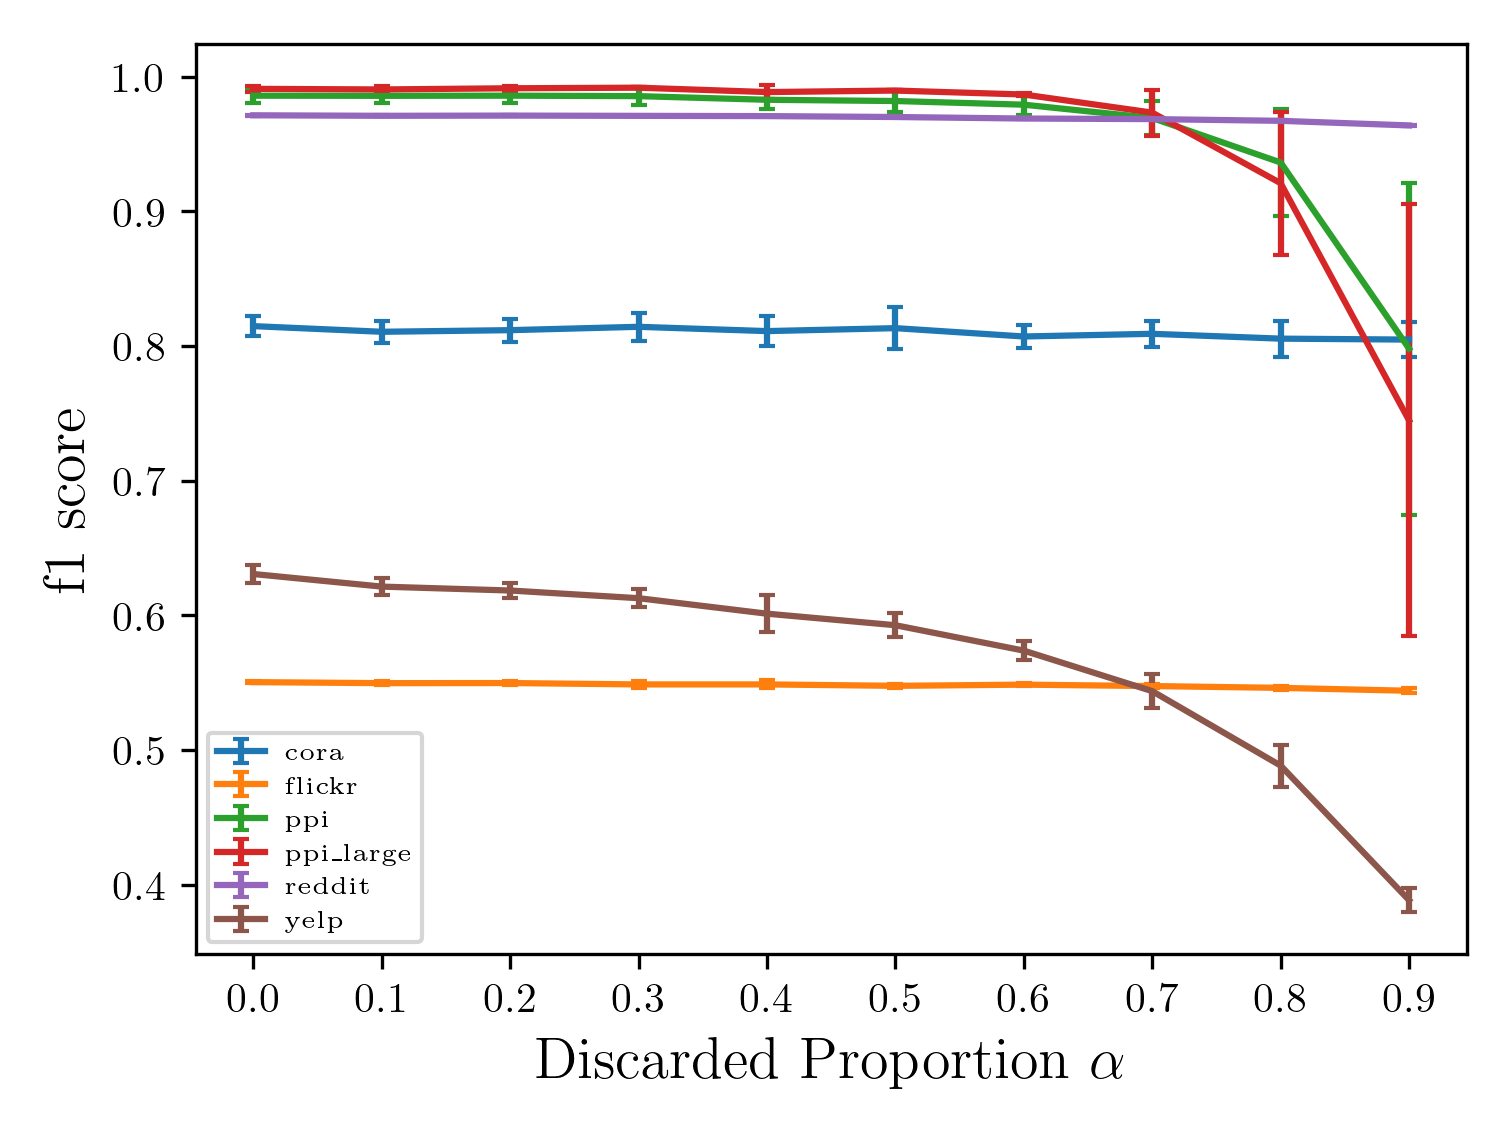
This picture changes slightly when looking at the results related to the SAGN+SLE experiments in Figure 3(b). For some data sets the same stagnating behavior is evident. For others, however, there is a marked drop in performance. Especially for the two ppi data sets there is a greater variation in performance. Another different behavior can be seen for the yelp data set, where the performance starts to decrease for lower discard factors.
5.5 Discussion
We now want to contextualize the observations and results. The Figures 2(c) and 3(a) show the distributions of \acNID and we observe that distinct values arise for different data sets. We may note that the figures show relative and not absolute \acNID and therefore their respective values should not be compared. Moreover, even without this relative scaling does the mathematical modeling of the intrinsic dimension not allow a direct comparison.
For our discussion we compare the different values of \acNID to the performance of the corresponding models, as shown in Figures 2(d) and 3(b). From this we can infer the following link. consider the difference between the lowest and the highest value of the \acNID for a given data set. We find that this difference decreases in the following order: pubmed, citeseer, cora. If we look to the corresponding model performance in Figure 2(d), we observe that the performance of the random feature selection divergences for different proportions . Interestingly this happens in the same order as before, albeit at different levels of accuracy. The difference between the lowest and highest values of \acNID indicates that the individual contributions to the \acID by the corresponding features is more evenly distributed. For example, in the case of a horizontal line every feature contributes equally to the \acID. Conversely, a -shape, as observed in Figure 3(a) for the reddit data set, indicates that a small number of features is responsible for almost all of the \acID value. Based on these deductions, we propose the following explanation. In a certain sense, features with a low \acNID can be used by machine learning methods to distinguish more data points. These features may allow a learning procedure to have a more stable convergence, a shorter runtime, and a higher final performance. In our experimental study, we focus on the interplay between the \acID and the achieved model performance. At this point we may note that all presented experiments are based on the same principal optimization task of \acSGD.
The observations concerning the shape of distribution of \acNID described above may permit to draw a connection to the simplicity bias in neural networks (Arpit et al., 2017; Shah et al., 2020; Valle-Pérez et al., 2019), the tendency of \acSGD to find simple models. Although the need for further investigations arises, the hypothesized link would then be in line with the assumption that \acSGD weights features that carry more information higher.
In our random experiment we uniformly discard from the set of features. In every step one may lose low and high dimensional features following the distributions as shown in Figures 2(c) and 3(a). This means for a certain discarding proportion there are almost no features with low \acNID available. Until those disappear, \acSGD has the possibility to use them for obtaining the objective. But when those “good” features are not included anymore the situation changes and the performance deteriorates rapidly. On the other hand if the features are discarded in order of decreasing \acNID then the inevitable deterioration of model performance can be postponed for quite a bit. Conversely when discarding features in a reverse order, e.g. ascending \acNID, the performance drops rapidly as the model has no access to those “good” features from the beginning.
However, we can not exclude the effect of artifacts of the method. Especially in the reverse case, where for example a non-convergent behavior in the beginning triggers an early stopping condition that lead to aborting the optimization routine. As we regard the methods as black boxes, we have not investigated these possibilities further.
Turning to Figure 3(a) we observe a few data sets that have a similar distribution of \acNID as those in Figure 2(c). However, it seems that for some the contribution to the total \acNID are distributed more evenly among the features. This is particularly evident for the yelp data set. On the other hand the distribution for the reddit data set is far more extreme, where only a small set of features have extraordinary high contribution to overall \acNID. This figure also clearly shows the influence of preprocessing on the \acNID distribution. Whereas before in Figure 2(c) the line for the cora data set was clearly a step function, it has now become a much smoother slope. It seems that this has almost no influence on the achieved model performance in both cases.
Based on the definitions of \acID and \acNID, it is evident that these functions should have higher values for a data set than for any of its subsets, as long as the set of feature functions remains constant. This is clearly demonstrated in the graphs for both versions of the ppi data set, where one is the super set of the other. It is worth noting that the final model performances for these data sets have a high standard deviation, which is much higher than in any other experiments. A definitive cause could not be determined, but it seems reasonable to assume that some artifact of the method or some form of mode collapse produced these high variations. The detailed figures for the remaining experiments can be found in the appendix. Now we will discuss the insights that can be obtained through an overarching analysis. To achieve this, we will resort to an inter-method comparison since only a few data sets have been processed by multiple papers. The aim is to identify similar distributions of \acNID and compare the effects on model performance. If both methods behave differently on these (possibly different) data sets, this could indicate that the \acNID has an impact on the methods.
The GraphSAGE and SAGN+SLE methods both use the reddit data set with the same preprocessing. The former shows a slight deterioration, while the latter shows almost no change in model performance.
The SAGN+SLE method is applied on the yelp data set, while the GCN and SGC methods are used on the pubmed data set. The \acNID distributions are quite similar, but the performance on the yelp data set continuously worsens with higher , while the performance on the pubmed data set remains stable until the highest discarding proportions.
Both the GCN and SGC methods use the citeseer data set with the same preprocessing. The first method shows very stable performance, but the second method shows minor deterioration.
The GCN, SGC and SAGN+SLE methods all use the cora data set. Although the preprocessing is the same in GCN and SGC, there is a clear difference in performance.
The SAGN+SLE and GraphSAGE method both use the large ppi data set mentioned earlier, but in both cases the performance deteriorates significantly, starting at different discarding proportions and speeds.
One possible alternative hypothesis for the aforementioned observations is that the machine learning tasks being addressed can be resolved using only the information provided by the adjacency matrix of the graph data. In this case, the reduction of available node features would not affect the final performance. Contrary to this, observations from experiments with reversed feature discarding suggest that that the previous statement may not be accurate, as these observations showed a far greater deterioration of model performance than the other way around.
In general this highlights a limitation of the current approach, as the chosen feature functions do not take into account graph edges. This indirectly connects to the earlier discussion on the modeling choice of what to use as the underlying set for the geometric data set. We decided to use the node features as the base set and ignored the edge features or the adjacency matrix. By using a different modeling the set of feature functions could be extended or constructed completely different.
These comparisons in their entirety form a strong indication that there is an influence of the \acNID on the model performance. Although we have only used the \acNID as an auxiliary tool to measure the \acID, it shows that different methods are influenced by the \acID of the data set itself. However, it is difficult to quantify the extent of this dependence on the concentration phenomenon given the present experiments on these very different methods.
At this point it is necessary to go into more detail regarding the graphs for the experiments for the DiffPool model. The original code accompanying the DiffPool publication uses an one-hot encoding of the node label as node attributes instead of the available original node attributes. The paper does not state this in any way and the results do not seem to be straightforward reproducible when changing to using the conventional node attributes. Nonetheless, we continued with this change to make it compatible with the other experiments and our method. Therefore the graph for the reached accuracy starts much lower for zero and low discarding fractions as the originally claimed performance would suggest.
5.6 Summarizing the Analysis and Limitations
We present an overview over all experiments by combining the information about the intrinsic dimensionality and the model performance when discarding features. For this, we calculate the sum of the (approximated) normalized discriminability of remaining features after discarding a fraction . The so obtained value can be normalized by the total sum of (approximated) normalized discriminability of all features. We perform this calculation for different values of and all data sets. We plot these values against the achieved performance measure (accuracy or f1 score) for the corresponding configuration. The results are depicted in Figure 5.
From this we can derive the striking observation that most models can cope with data sets that are reduced to about of their original dimensionality without performance loss. Despite the large differences in the number of samples and features among the data sets, we cannot observe a significant correlation between these characteristics and the change in model performance.
Through experiments with reversed feature selection (Figure 3) it became evident that there is an effect of the intrinsic dimension on the different learning methods. More specifically we observed that this effect depends on the particular method, e.g. reddit data set as discussed in Subsection 5.5.
Our study is limited in various aspects, which we will discuss below. We observe in our investigation a low frequency of overlapping use of data sets. This is a result of the selection process and the underlying requirements for reproducibility. Hence, comparing different methods on the dimensionally reduced data sets is hard. However, the data sets citeseer, cora, pubmed and reddit have non-trivial support over the considered papers. For them we see very similar behavior as described in the previous paragraph (cf. Figure 5).
Furthermore our results build upon a rather small set of selected candidates. This could be tackled with allocating more time for achieving reproducibility per paper, which would allow for fixing or circumvent reproducibility barriers by searching for the right combination of technical tricks. It might also be possible to apply the individual methods from the publications to the other data sets as well.
The proposed method only indirectly measures the effects of the concentration of measure phenomenon through the perspective of the geometric intrinsic dimension. Additionally we can not give extensive overview over complete \acID influence. This is due to the fact that it is unclear if the \acML methods can draw on more (complicated) feature functions than the considered ones their processing of the data. In this case, the current restriction would be a hindrance to measuring the true impact of the \acID on the methods. However, for the used function class we can build upon the guaranteed computability. Looking back on the results, it might not be necessary as in even this restricted scope a influence could be showed.
Furthermore the present work includes no comparison with other approaches of measuring dimension influence and any feature selection methods based on it. Although it is not so clear if those methods would measure the same properties of the \acML methods given their different underlying theoretical frameworks.
Overall the experiments show that the distribution of dimensionality contributes to the deterioration of the model performance. Yet, more experiments are necessary to determine a thorough characterization of this dependency, especially by using more extensive feature function classes that capture the geometric intrinsic dimension more thoroughly.
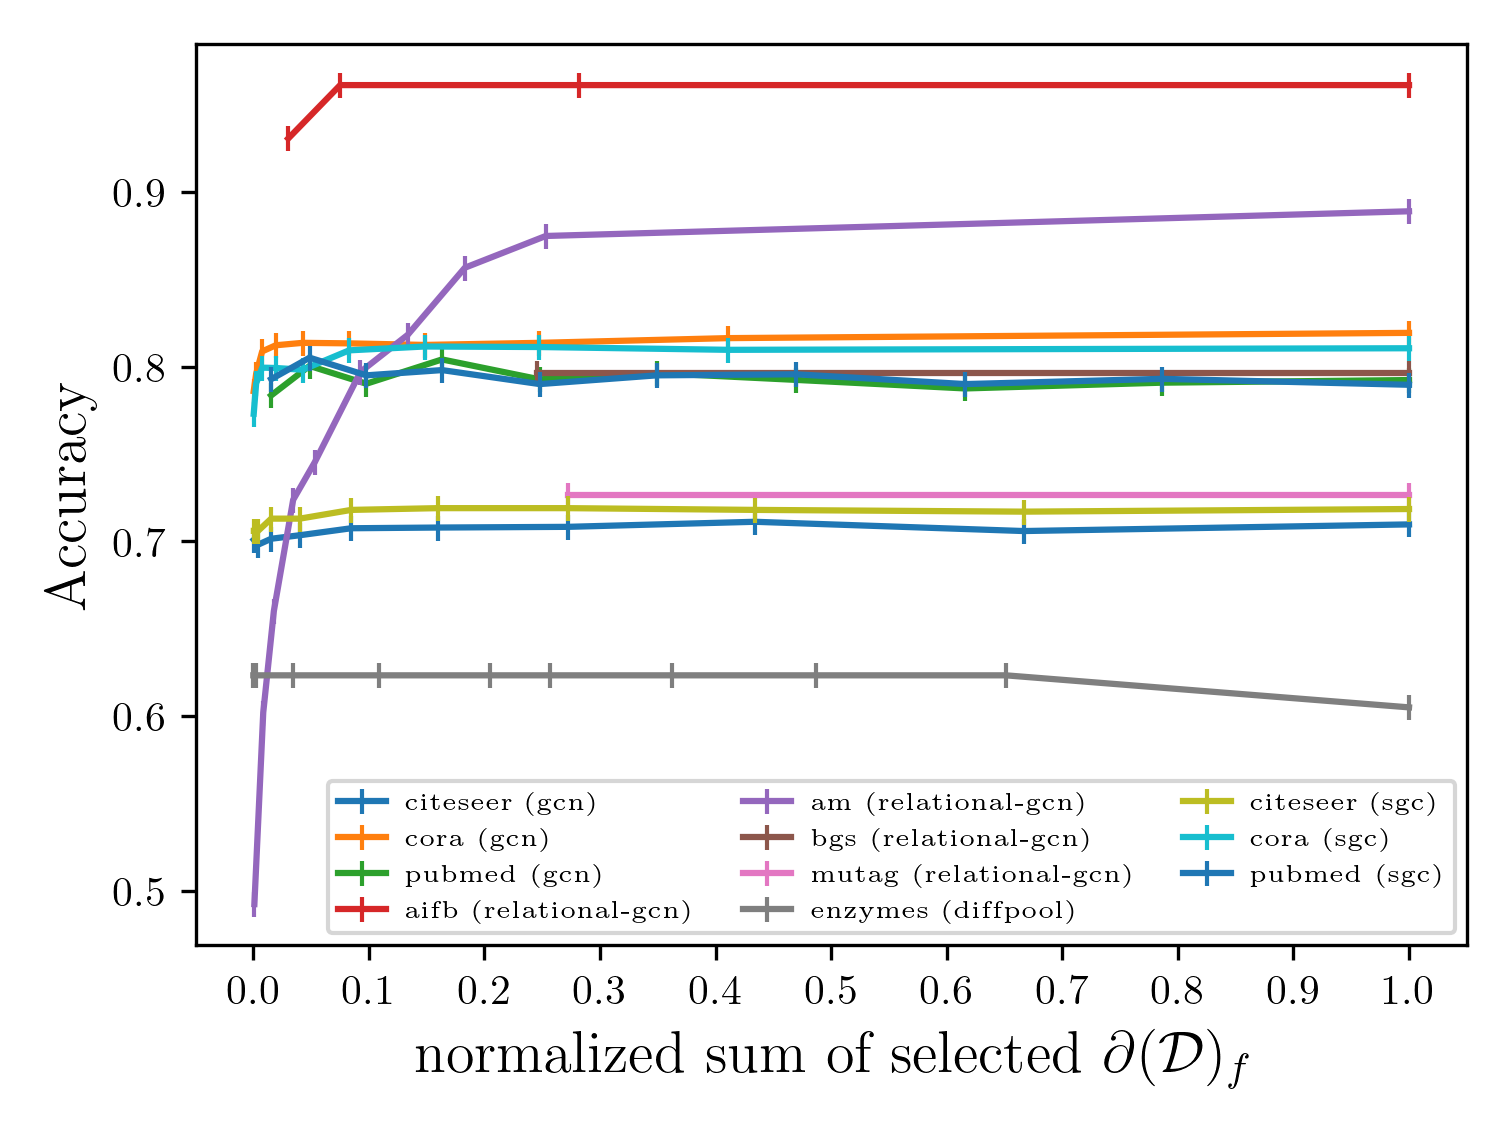
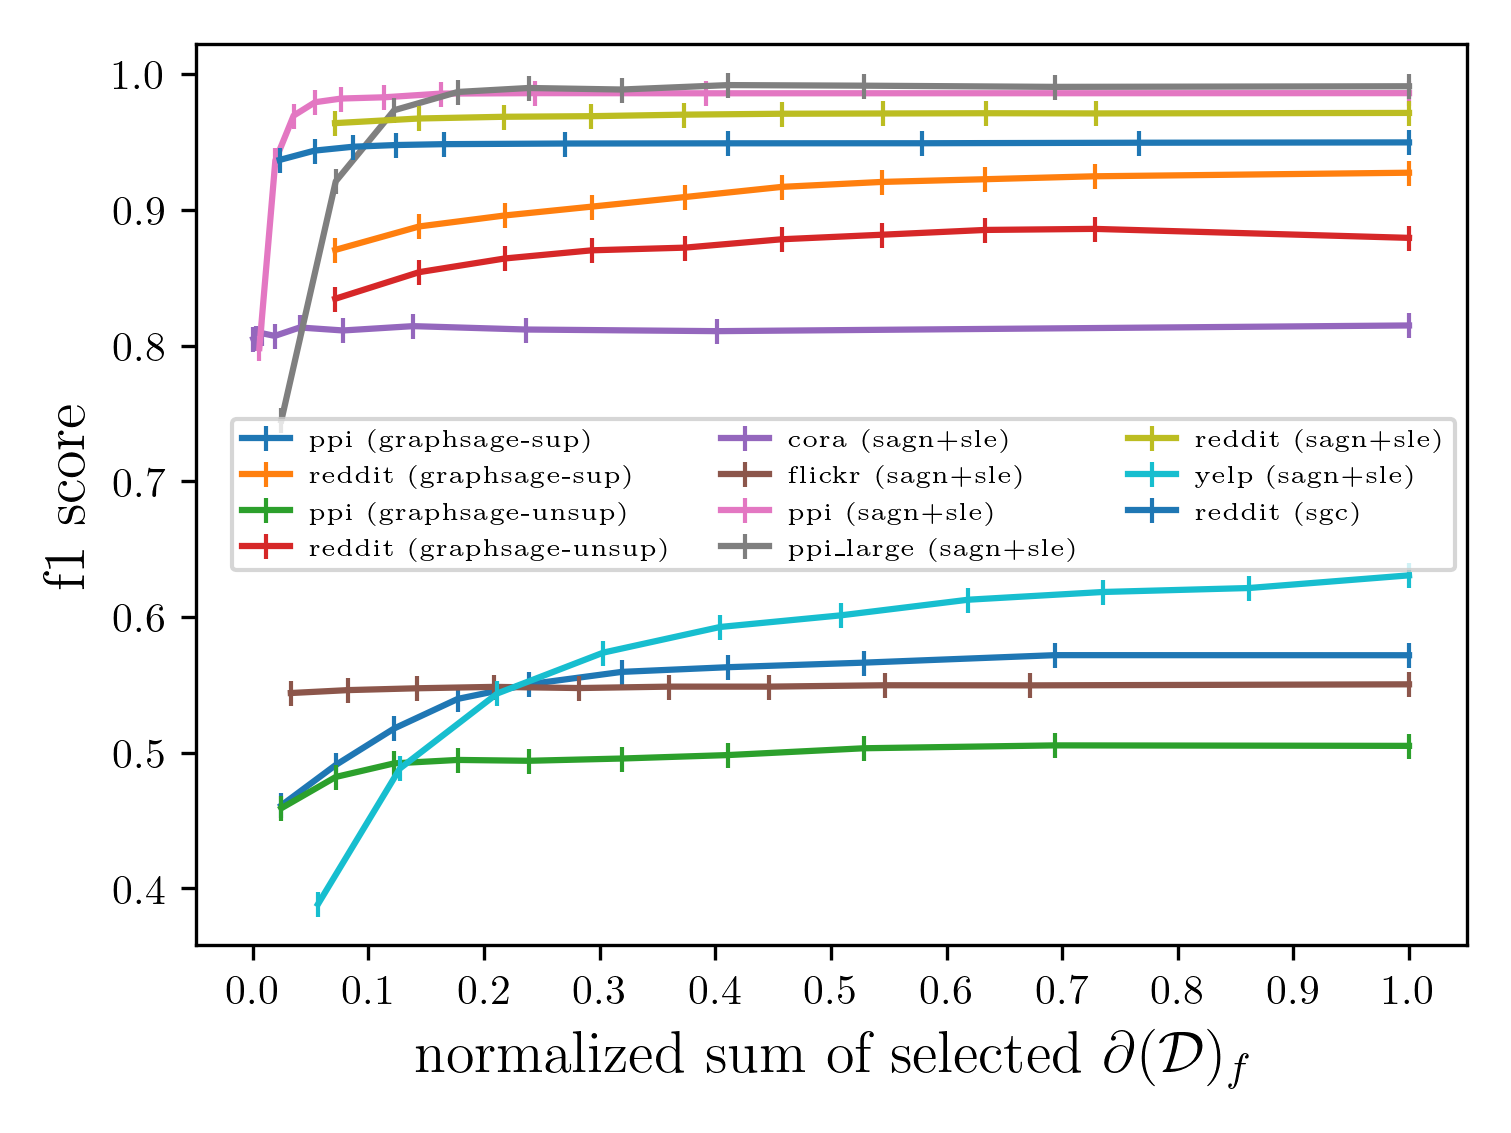
6 Reproducibility of the Presented Work
As a publication about reproducibility is is only fair to also consider the own reproducibility as well. In general the reproducibility of our own work is limited by the reproducibility of the used papers. We rely exclusively on data sets provided by them and our source code build upon on the one published by them. For our experiments we do not need to change the (hyper-) parameter of models. To achieve high degree of reproducibility we provide the individual scripts for the reproducibility and dimensionality experiments. This includes explicitly specified environments that were used and the necessary changes to the original source code. We tried to follow general guidelines (Pineau et al., 2021; paperswithcode, 2021) and our own ontology. In total the experiments produced around 600 models (6 papers, 10 factors, 10 seeds). It is not feasible to provide weights for all of them, especially if the original source code did not include sophisticated management of paths where checkpoints were saved to. Given the special form of our publication we do not provide the model weights. The complete resources for source code, logs, and results of our experiments can be found at https://zenodo.org/doi/10.5281/zenodo.10727907.
7 Conclusions
In this work, we presented an ontology to investigate reproducibility of machine learning research. This ontology can be used to evaluate reproducibility of scientific publications in a standardized manner. For this, we assume that scientific evidence can be generated via theoretical evidence (for example via theorems and proofs) or via empirical evidence provided by scientific experiments. In machine learning, reproducibility research mainly focuses on the extend to which other researchers can re-execute the experiments with the same results. Thus, our work mainly focuses on empirical evidence for which we propose concrete attributes for evaluating the level of reproducibility of a specific work. These attributes can be separated into three categories, namely data set, software and computational result.
If reproducibility is given, the next step is to identify relevant influential factors for the experiments outcome. Such a factor which is commonly investigated is the intrinsic dimension, which measures the influence of the \aclCOD on a specific dataset. In the second part of our work, we investigated to which extent results of empirical experiments depend on the intrinsic dimension of the datasets used for training. To be more detailed, we analyzed wether changes on the intrinsic dimensionality of used data sets coincide with experiment outcomes, measured by model performance.
To give a practical example on the usage of our ontology, we provided detailed descriptions of how the attributes of our ontology can be used to evaluate the reproducibility of research on graph neural networks. Furthermore, we investigated which of the well-known methods are not affected by modifications of the intrinsic dimensionality of the datasets on which they are trained on.
Our investigation shows that attributes of reproducibility which are part of the data set category of our ontology are equally covered by most works on graph neural networks. Here, we only found major differences between the different methods when it comes to the extend to which the datasets are documented as part of the README. The amount of documentation was one of the key factors on successful reproduction with a reasonable effort. The documentation of a specific work is covered by our ontology in the category software. In general, the software category allowed for an accurate differentiation of the different papers with regard to their reproducibility.
Attributes falling under the category computational result can be split into two parts. One part consists of weakly separating attributes which either present basic reproducibility rules which are fulfilled by all of our methods or strict requirements that none of the investigated methods satisfy. The other part consist of attributes which enable the distinction of the different methods, as these attributes are only covered by a part of the investigated methods.
The findings presented in the study in the second part of our work provide compelling evidence that the \acID has an influence on \acML algorithms. To be more detailed, our experiments show that dropping features with high individual \acID has a varying impact on model performance. For example, for the GCN method, dropping high-dimensional features does not fundamentally decrease accuracies. In contrast, dropping these features when learning with GraphSAGE leads to stronger deterioration of performance. On the other hand, dropping features with low individual \acID first leads to stronger performance drops for all methods. This indicates that current used graph learning approaches are susceptible to changes of the intrinsic dimensionality while their robustness towards the discarding of non-discriminative features (i.e., features with high individual \acID) strongly varies.
8 Recommendations
Based on our findings, we recommend the following points as best practice for reproducible machine learning research.
-
•
Write one main script that does everything necessary. That means setup/teardown or preparation of the compute environment, downloading and preprocessing of data sets, and running of all reported experiments. It might be beneficial to chose an existing software package when handling larger data or when working on compute clusters.
-
•
Log all relevant information into files. This includes all results, used input parameters and also chosen hyperparameters if a form of hyperparameter optimization was done. Often, such information is only printed to the output terminal, which hinders reproducibility.
-
•
Store checkpoints of all used models. If multiple runs with only different seeds are desired, the wrapping script/software should make sure that no computed checkpoint is overwritten in the next iteration.
-
•
A workflow management systems is helpful for automated aggregation and evaluation of outputs and creation of visualizations. The reproducibility of a research paper is strongly enhanced if all steps from the experiment to the final paper, including reported results, tables, and displayed figures, can be automatically created by a dedicated script which is part of the published code. This full procedure can easily be implemented via a workflow management system.
Furthermore, we give three recommendations on how to account for the concept of intrinsic dimensionality in the scope of machine learning research.
-
•
Consider the intrinsic dimensionality of the used training data sets when comparing machine learning algorithms. Our experiments indicate that well-established graph neural network approaches heavily suffer from increasing intrinsic dimensionality of the input data. Hence, when comparing their performance, it is crucial to know the \acID of the used data to estimate to which extent performance differences are caused by the \aclCOD.
-
•
Investigate if discarding of high-dimensional features is possible for the chosen GNN. For certain graph neural network models it is possible to discard a significant fraction of features with high normalized intrinsic dimensionality without a fundamental drop in performance. For example, when regarding the GCN model, dropping up to 70% of the total number of features is possible without decreasing accuracies, while this is not possible for GraphSAGE.
-
•
Account for transformations of the \acNID-distributions induced via preprocessing. Preprocessing of features usually incorporates global interactions between them (i.e., averages), which changes the \acNID distribution in non-trivial ways. One such case was observed for example for the reddit data set, where both SAGN+SLE and SGC applied different preprocessing procedures which resulted in widely different \acNID distributions. As mentioned above, this change of the \acNID distributions can fundamentally influence model performance.
9 Limitations and Future Work
Our current study has some limitations which we will address in the future. First, as discussed in Subsection 4.3, our ontology is limited to a fixed granularity. We realized that the varying needed depth of reproducibility analysis can not be represented by the proposed ontology. Thus, we will develop a a hierarchy of ontologies with different fine-grains by further splitting or aggregating current attributes. For example. depending on the amount of different experiments provided by a paper, it may be reasonable to reformulate R2 to R4 into more detailed cases to capture different error ranges and fractions of not reproducible results.
Second our current study is concentrated on one specific concept of intrinsic dimensionality. However, as discussed in Section 2, a variety of different \acID estimators exist. Hence, future work will investigate which of the reported observations generalize over different concepts for intrinsic dimensionality.
Thirdly, our approach only considers intrinsic dimensionality for a specific feature sets, namely the usual coordinate projections. However, different machine learning methods may incorporate different aspects of the data. Thus, future work will investigate how these different aspects can be formalized as feature functions. This will lead to an \acID not on for models instead of dat sets. Here, the crucial problem will be the identification of a finite and computational feasible feature set which captures the model behavior.
Acknowledgment
The authors thank the State of Hesse, Germany for funding this work as part of the LOEWE Exploration project “Dimension Curse Detector” under grant LOEWE/5/A002/519/06.00.003(0007)/E19.
References
- Abu-El-Haija et al. (2019) Sami Abu-El-Haija, Bryan Perozzi, Amol Kapoor, Hrayr Harutyunyan, N. Alipourfard, Kristina Lerman, G. V. Steeg, and A. Galstyan. Mixhop: Higher-order graph convolutional architectures via sparsified neighborhood mixing. ArXiv, abs/1905.00067:21–29, 4 2019. URL https://arxiv.org/pdf/1905.00067.
- Akyürek et al. (2022) Ekin Akyürek, Tolga Bolukbasi, Frederick Liu, Binbin Xiong, Ian Tenney, Jacob Andreas, and Kelvin Guu. Tracing knowledge in language models back to the training data. ArXiv, abs/2205.11482, 5 2022. URL https://arxiv.org/pdf/2205.11482.
- Allen Institute for Artificial Intelligence (2022) Allen Institute for Artificial Intelligence. Semantic Scholar, 2022. URL https://www.semanticscholar.org/. [Online; accessed 2023-12-11].
- Arpit et al. (2017) Devansh Arpit, Stanisław Jastrzębski, Nicolas Ballas, David Krueger, Emmanuel Bengio, Maxinder S Kanwal, Tegan Maharaj, Asja Fischer, Aaron Courville, Yoshua Bengio, et al. A closer look at memorization in deep networks. In Doina Precup and Yee Whye Teh (eds.), International conference on machine learning, volume 70, pp. 233–242. PMLR, JMLR.org, 8 2017. URL https://proceedings.mlr.press/v70/arpit17a/arpit17a.pdf.
- ashleve and Contributors (2022) ashleve and Contributors. Lightning Hydra Template, 2022. URL https://github.com/ashleve/lightning-hydra-template. [Online; accessed 2023-11-22].
- Bo et al. (2021) Deyu Bo, Xiao Wang, Chuan Shi, and Huawei Shen. Beyond low-frequency information in graph convolutional networks. In AAAI Conference on Artificial Intelligence, volume 35, pp. 3950–3957. Association for the Advancement of Artificial Intelligence (AAAI), 5 2021. doi: 10.1609/aaai.v35i5.16514. URL https://arxiv.org/pdf/2101.00797.
- Bouthillier et al. (2019) Xavier Bouthillier, César Laurent, and Pascal Vincent. Unreproducible research is reproducible. In Kamalika Chaudhuri and Ruslan Salakhutdinov (eds.), International Conference on Machine Learning, volume 97, pp. 725–734. PMLR, 5 2019.
- Casadevall & Fang (2010) Arturo Casadevall and Ferric C. Fang. Reproducible science. Infection and Immunity, 78(12):4972 – 4975, 12 2010. ISSN 0019-9567. URL https://europepmc.org/articles/pmc2981311?pdf=render.
- Chen et al. (2022) Boyuan Chen, Mingzhi Wen, Yong Shi, Dayi Lin, Gopi Krishnan Rajbahadur, and Zhen Ming Jiang. Towards training reproducible deep learning models. 2022 IEEE/ACM 44th International Conference on Software Engineering (ICSE), pp. 2202–2214, 5 2022. doi: 10.1145/3510003.3510163.
- Collberg et al. (2015) Christian Collberg, Todd Proebsting, and Alex M Warren. Repeatability and benefaction in computer systems research. University of Arizona TR, 14(4), 2015.
- Corso et al. (2020) Gabriele Corso, Luca Cavalleri, D. Beaini, P. Lio’, and Petar Velickovic. Principal neighbourhood aggregation for graph nets. ArXiv, abs/2004.05718, 4 2020. URL https://export.arxiv.org/pdf/2004.05718.
- Deng & Hooi (2021) Ailin Deng and Bryan Hooi. Graph neural network-based anomaly detection in multivariate time series. ArXiv, abs/2106.06947:4027–4035, 6 2021. ISSN 2374-3468. doi: 10.1609/aaai.v35i5.16523. URL https://arxiv.org/pdf/2106.06947.
- Feng et al. (2018) Yifan Feng, Haoxuan You, Zizhao Zhang, R. Ji, and Yue Gao. Hypergraph neural networks. In AAAI Conference on Artificial Intelligence, pp. 3558–3565, 9 2018. doi: 10.1609/aaai.v33i01.33013558. URL https://ojs.aaai.org/index.php/AAAI/article/download/4235/4113.
- François et al. (2007) Damien François, Vincent Wertz, and Michel Verleysen. The concentration of fractional distances. IEEE Transactions on Knowledge and Data Engineering, 19(7):873–886, 7 2007. ISSN 1041-4347. doi: 10.1109/tkde.2007.1037.
- Freire et al. (2012) Juliana Freire, Philippe Bonnet, and Dennis Shasha. Computational reproducibility: state-of-the-art, challenges, and database research opportunities. Proceedings of the 2012 ACM SIGMOD International Conference on Management of Data, 5 2012. doi: 10.1145/2213836.2213908.
- Fu et al. (2020) Xinyu Fu, Jiani Zhang, Ziqiao Meng, and Irwin King. Magnn: Metapath aggregated graph neural network for heterogeneous graph embedding. Proceedings of The Web Conference 2020, 4 2020. doi: 10.1145/3366423.3380297. URL https://arxiv.org/pdf/2002.01680.
- Ganter & Wille (1997) Bernhard Ganter and Rudolf Wille. Formal Concept Analysis: Mathematical Foundations. Springer-Verlag, Berlin, Heidelberg, 1st edition, 1997. ISBN 3540627715. doi: 10.1007/978-3-642-59830-2.
- Golay et al. (2016) Jean Golay, Michael Leuenberger, and Mikhail F. Kanevski. Feature selection for regression problems based on the morisita estimator of intrinsic dimension: Concept and case studies. Pattern Recognit., 70:126–138, 1 2016.
- Goodman et al. (2016) Steven N. Goodman, Daniele Fanelli, and John P. A. Ioannidis. What does research reproducibility mean? Science Translational Medicine, 8(341):341ps12 – 341ps12, 6 2016. ISSN 1946-6234.
- Gromov & Milman (1983) Mikhael Gromov and Vitali Milman. A topological application of the isoperimetric inequality. American Journal of Mathematics, 105(4):843–854, 8 1983. ISSN 0002-9327. doi: 10.2307/2374298.
- Gundersen (2020) Odd Erik Gundersen. The fundamental principles of reproducibility. ArXiv, abs/2011.10098, 11 2020.
- Gundersen & Kjensmo (2018) Odd Erik Gundersen and Sigbjørn Kjensmo. State of the art: Reproducibility in artificial intelligence. In Sheila A. McIlraith and Kilian Q. Weinberger (eds.), AAAI Conference on Artificial Intelligence, volume 32. Association for the Advancement of Artificial Intelligence (AAAI), 4 2018. doi: 10.1609/aaai.v32i1.11503. URL https://ojs.aaai.org/index.php/AAAI/article/download/11503/11362.
- Gundersen et al. (2018) Odd Erik Gundersen, Yolanda Gil, and David W. Aha. On reproducible ai: Towards reproducible research, open science, and digital scholarship in ai publications. AI Mag., 39(3):56–68, 9 2018. ISSN 0738-4602. URL https://www.aaai.org/ojs/index.php/aimagazine/article/download/2816/2710.
- Gundersen et al. (2022a) Odd Erik Gundersen, Kevin Coakley, and Christine R. Kirkpatrick. Sources of irreproducibility in machine learning: A review. ArXiv, abs/2204.07610, 4 2022a. ISSN 2331-8422. doi: 10.48550/arxiv.2204.07610.
- Gundersen et al. (2022b) Odd Erik Gundersen, Saeid Shamsaliei, and Richard Juul Isdahl. Do machine learning platforms provide out-of-the-box reproducibility? Future Gener. Comput. Syst., 126:34–47, 1 2022b. ISSN 0167-739X. doi: 10.1016/j.future.2021.06.014.
- Hamilton et al. (2017) William L. Hamilton, Zhitao Ying, and Jure Leskovec. Inductive representation learning on large graphs. In Isabelle Guyon, Ulrike von Luxburg, Samy Bengio, Hanna M. Wallach, Rob Fergus, S. V. N. Vishwanathan, and Roman Garnett (eds.), NIPS, volume 30, pp. 1024–1034, 6 2017. URL https://papers.nips.cc/paper/6703-inductive-representation-learning-on-large-graphs.pdf.
- Hamm & Steinwart (2020) Thomas Hamm and Ingo Steinwart. Adaptive learning rates for support vector machines working on data with low intrinsic dimension. The Annals of Statistics, 3 2020. doi: 10.48550/arxiv.2003.06202. URL https://arxiv.org/pdf/2003.06202.
- Hammoudeh & Lowd (2022) Zayd Hammoudeh and Daniel Lowd. Training data influence analysis and estimation: A survey. ArXiv, abs/2212.04612, 12 2022. doi: 10.48550/arxiv.2212.04612. URL https://arxiv.org/pdf/2212.04612.
- Hanika et al. (2022) Tom Hanika, Friedrich Martin Schneider, and Gerd Stumme. Intrinsic dimension of geometric data sets. Tohoku Mathematical Journal, 74(1):23 – 52, 3 2022. ISSN 0040-8735. doi: 10.2748/tmj.20201015a. URL https://arxiv.org/pdf/1801.07985.
- Hazoglu et al. (2017) Michael J. Hazoglu, Vivek Kulkarni, Steven S. Skiena, and Ken A. Dill. Citation histories of papers: sometimes the rich get richer, sometimes they don’t. ArXiv, abs/1703.04746, 3 2017. ISSN 2331-8422.
- He et al. (2020) Xiangnan He, Kuan Deng, Xiang Wang, Yan Li, Yongdong Zhang, and Meng Wang. Lightgcn: Simplifying and powering graph convolution network for recommendation. Proceedings of the 43rd International ACM SIGIR Conference on Research and Development in Information Retrieval, 2 2020. doi: 10.1145/3397271.3401063. URL https://arxiv.org/pdf/2002.02126.
- Hein & Audibert (2005) Matthias Hein and Jean-Yves Audibert. Intrinsic dimensionality estimation of submanifolds in rd. Proceedings of the 22nd international conference on Machine learning, 2005.
- Hong et al. (2020) D. Hong, Lianru Gao, Jing Yao, Bing Zhang, A. Plaza, and J. Chanussot. Graph convolutional networks for hyperspectral image classification. IEEE Transactions on Geoscience and Remote Sensing, 59:5966–5978, 8 2020. ISSN 0196-2892. doi: 10.1109/tgrs.2020.3015157. URL https://arxiv.org/pdf/2008.02457.
- Houle (2013) Michael E. Houle. Dimensionality, discriminability, density and distance distributions. 2013 IEEE 13th International Conference on Data Mining Workshops, pp. 468–473, 12 2013. doi: 10.1109/icdmw.2013.139.
- Hu et al. (2020a) Weihua Hu, Matthias Fey, Marinka Zitnik, Yuxiao Dong, Hongyu Ren, Bowen Liu, Michele Catasta, and Jure Leskovec. Open graph benchmark: Datasets for machine learning on graphs. ArXiv, abs/2005.00687, 5 2020a. doi: 10.48550/arxiv.2005.00687.
- Hu et al. (2020b) Ziniu Hu, Yuxiao Dong, Kuansan Wang, and Yizhou Sun. Heterogeneous graph transformer. Proceedings of The Web Conference 2020, 4 2020b. doi: 10.1145/3366423.3380027. URL https://dl.acm.org/doi/pdf/10.1145/3366423.3380027.
- ICLR (2019) ICLR. Reproducibility workshop series, 2019. URL https://sites.google.com/view/icml-reproducibility-workshop. [Online; accessed 2023-11-15].
- Ivie & Thain (2018) Peter Ivie and Douglas Thain. Reproducibility in scientific computing. ACM Computing Surveys (CSUR), 51(3):1 – 36, 7 2018. ISSN 0360-0300. doi: 10.1145/3186266.
- Jin et al. (2020) Wei Jin, Yao Ma, Xiaorui Liu, Xianfeng Tang, Suhang Wang, and Jiliang Tang. Graph structure learning for robust graph neural networks. Proceedings of the 26th ACM SIGKDD International Conference on Knowledge Discovery & Data Mining, 8 2020. doi: 10.1145/3394486.3403049. URL https://dl.acm.org/doi/pdf/10.1145/3394486.3403049.
- Kim & Oh (2022) Dongkwan Kim and Alice H. Oh. How to find your friendly neighborhood: Graph attention design with self-supervision. ArXiv, abs/2204.04879, 4 2022. doi: 10.48550/arxiv.2204.04879. URL https://arxiv.org/pdf/2204.04879.
- Kim et al. (2016) Jisu Kim, Alessandro Rinaldo, and Larry A. Wasserman. Minimax rates for estimating the dimension of a manifold. J. Comput. Geom., 10:42–95, 5 2016. ISSN 1920-180X. doi: 10.20382/jocg.v10i1a3. URL https://inria.hal.science/hal-02425684/document.
- Kipf & Welling (2016) Thomas Kipf and M. Welling. Semi-supervised classification with graph convolutional networks. ArXiv, abs/1609.02907, 9 2016. URL https://export.arxiv.org/pdf/1609.02907.
- Kitzes et al. (2018) Justin Kitzes, Daniel Turek, and Fatma Deniz. The practice of reproducible research: case studies and lessons from the data-intensive sciences. Univ of California Press, 2018.
- Klicpera et al. (2018) Johannes Klicpera, Aleksandar Bojchevski, and Stephan Günnemann. Predict then propagate: Graph neural networks meet personalized pagerank. In International Conference on Learning Representations, 9 2018. URL https://openreview.net/pdf?id=H1gL-2A9Ym.
- Koh & Liang (2017) Pang Wei Koh and Percy Liang. Understanding black-box predictions via influence functions. In Doina Precup and Yee Whye Teh (eds.), International Conference on Machine Learning, volume 70, pp. 1885–1894. JMLR.org, 3 2017. URL https://proceedings.mlr.press/v70/koh17a/koh17a.pdf.
- Koçak et al. (2019) Burak Koçak, Ece Ateş, Emine Sebnem Durmaz, Melis Baykara Ulusan, and Ozgur Kilickesmez. Influence of segmentation margin on machine learning–based high-dimensional quantitative ct texture analysis: a reproducibility study on renal clear cell carcinomas. European Radiology, 29(9):1–11, 2 2019. ISSN 0938-7994. doi: 10.1007/s00330-019-6003-8.
- Laptev et al. (2020) Aleksandr Laptev, Roman Korostik, Aleksey Svischev, Andrei Andrusenko, Ivan Medennikov, and Sergey V. Rybin. You do not need more data: Improving end-to-end speech recognition by text-to-speech data augmentation. 2020 13th International Congress on Image and Signal Processing, BioMedical Engineering and Informatics (CISP-BMEI), pp. 439–444, 10 2020. doi: 10.1109/cisp-bmei51763.2020.9263564. URL https://arxiv.org/pdf/2005.07157.
- Latorre et al. (2021) Fabian Latorre, Leello Tadesse Dadi, Paul Rolland, and Volkan Cevher. The effect of the intrinsic dimension on the generalization of quadratic classifiers. In Marc’Aurelio Ranzato, Alina Beygelzimer, Yann N. Dauphin, Percy Liang, and Jennifer Wortman Vaughan (eds.), Neural Information Processing Systems, volume 34, 12 2021. URL https://infoscience.epfl.ch/record/289659.
- Lee et al. (2019) Junhyun Lee, Inyeop Lee, and Jaewoo Kang. Self-attention graph pooling. ArXiv, abs/1904.08082, 4 2019. URL https://arxiv.org/pdf/1904.08082.pdf.
- Li et al. (2019) G. Li, Matthias Müller, Ali K. Thabet, and Bernard Ghanem. Deepgcns: Can gcns go as deep as cnns? 2019 IEEE/CVF International Conference on Computer Vision (ICCV), pp. 9266–9275, 10 2019. doi: 10.1109/iccv.2019.00936. URL https://arxiv.org/pdf/1904.03751.
- Lightning AI and Contributors (2022) Lightning AI and Contributors. Lightning, 2022. URL https://github.com/Lightning-AI/lightning. [Online; accessed 2023-11-22].
- Liu et al. (2020a) Chao Liu, Cuiyun Gao, Xin Xia, David Lo, John C. Grundy, and Xiaohu Yang. On the replicability and reproducibility of deep learning in software engineering. ArXiv, abs/2006.14244, 6 2020a. doi: 10.1145/3477535.
- Liu et al. (2020b) Meng Liu, Hongyang Gao, and Shuiwang Ji. Towards deeper graph neural networks. In Rajesh Gupta, Yan Liu, Jiliang Tang, and B. Aditya Prakash (eds.), Proceedings of the 26th ACM SIGKDD international conference on knowledge discovery & data mining, pp. 338–348. ACM, 8 2020b. doi: 10.1145/3394486.3403076. URL https://dl.acm.org/doi/pdf/10.1145/3394486.3403076.
- Marcheggiani & Titov (2017) Diego Marcheggiani and Ivan Titov. Encoding sentences with graph convolutional networks for semantic role labeling. ArXiv, abs/1703.04826, 3 2017. doi: 10.18653/v1/d17-1159. URL https://arxiv.org/pdf/1703.04826.pdf.
- Milman (1988) Vitali Milman. The heritage of p. lévy in geometrical functional analysis. Astérisque, 157(158):273–301, 1988.
- Milman (2000) Vitali Milman. Topics in asymptotic geometric analysis. In Visions in Mathematics, pp. 792–815. Springer, 2000. ISBN 978-3034604246. doi: 10.1007/978-3-0346-0425-3_8.
- Mo & Huang (2012) Dengyao Mo and Samuel H. Huang. Fractal-based intrinsic dimension estimation and its application in dimensionality reduction. IEEE Transactions on Knowledge and Data Engineering, 24(1):59–71, 1 2012. ISSN 1041-4347. doi: 10.1109/tkde.2010.225.
- Morris et al. (2018) Christopher Morris, Martin Ritzert, Matthias Fey, William L. Hamilton, J. E. Lenssen, Gaurav Rattan, and Martin Grohe. Weisfeiler and leman go neural: Higher-order graph neural networks. In AAAI Conference on Artificial Intelligence, pp. 4602–4609. Cornell University, 10 2018. doi: 10.1609/aaai.v33i01.33014602. URL https://export.arxiv.org/pdf/1810.02244.
- National Academies of Sciences, Engineering and Medicine (2019) National Academies of Sciences, Engineering and Medicine. Reproducibility and Replicability in Science. The National Academies Press, Washington, DC, 9 2019. ISBN 978-0-309-48616-3. doi: 10.17226/25303. URL https://nap.nationalacademies.org/catalog/25303/reproducibility-and-replicability-in-science.
- Nature Special (2018) Nature Special. Challenges in irreproducible research, 2018. URL https://www.nature.com/collections/prbfkwmwvz/. [Online; accessed 2023-11-15].
- paperswithcode (2021) paperswithcode. Tips for Publishing Research Code, 2021. URL https://github.com/paperswithcode/releasing-research-code. [Online; accessed 2023-11-15].
- Pei et al. (2020) Hongbin Pei, Bingzhen Wei, K. Chang, Yu Lei, and Bo Yang. Geom-gcn: Geometric graph convolutional networks. ArXiv, abs/2002.05287, 4 2020. URL https://arxiv.org/pdf/2002.05287.
- Peng (2011) Roger D. Peng. Reproducible research in computational science. Science, 334(6060):1226 – 1227, 12 2011. ISSN 0036-8075. URL https://europepmc.org/articles/pmc3383002?pdf=render.
- Perez & Wang (2017) Luis Perez and Jason Wang. The effectiveness of data augmentation in image classification using deep learning. ArXiv, abs/1712.04621, 12 2017. URL https://arxiv.org/pdf/1712.04621.pdf.
- Pestov (1999) Vladimir Pestov. On the geometry of similarity search: Dimensionality curse and concentration of measure. Inf. Process. Lett., 73:47–51, 1 1999. doi: 10.1016/S0020-0190(99)00156-8. URL https://arxiv.org/pdf/cs/9901004v1.
- Pestov (2007a) Vladimir Pestov. An axiomatic approach to intrinsic dimension of a dataset. Neural networks : the official journal of the International Neural Network Society, 21(2-3):204–213, 12 2007a. doi: 10.1016/j.neunet.2007.12.030. URL https://arxiv.org/pdf/0712.2063v1.
- Pestov (2007b) Vladimir Pestov. Intrinsic dimension of a dataset: what properties does one expect? 2007 International Joint Conference on Neural Networks, pp. 2959–2964, 8 2007b. doi: 10.1109/ijcnn.2007.4371431. URL https://arxiv.org/pdf/cs/0703125.
- Pestov (2010a) Vladimir Pestov. Indexability, concentration, and vc theory. In J. Discrete Algorithms, volume 13, pp. 2–18. ACM, 9 2010a. doi: 10.1145/1862344.1862346.
- Pestov (2010b) Vladimir Pestov. Intrinsic dimensionality. ArXiv, abs/1007.5318:8–11, 7 2010b. ISSN 1946-7729. doi: 10.1145/1862413.1862416. URL https://arxiv.org/pdf/1007.5318.pdf.
- Pestov (2011) Vladimir Pestov. Is the kk-nn classifier in high dimensions affected by the curse of dimensionality? Comput. Math. Appl., 65:1427–1437, 2011. doi: 10.1016/j.camwa.2012.09.011.
- Pham et al. (2020) Hung Viet Pham, Shangshu Qian, Jiannan Wang, Thibaud Lutellier, Jonathan Rosenthal, Lin Tan, Yaoliang Yu, and Nachiappan Nagappan. Problems and opportunities in training deep learning software systems: An analysis of variance. 2020 35th IEEE/ACM International Conference on Automated Software Engineering (ASE), pp. 771–783, 9 2020. doi: 10.1145/3324884.3416545.
- Pineau (2020) Joelle Pineau. The machine learning reproducibility checklist, v2.0, 2020. URL https://www.cs.mcgill.ca/~jpineau/ReproducibilityChecklist-v2.0.pdf. [Online; accessed 2023-11-15].
- Pineau et al. (2021) Joelle Pineau, Philippe Vincent-Lamarre, Koustuv Sinha, Vincent Larivière, Alina Beygelzimer, Florence d’Alché Buc, Emily B. Fox, and H. Larochelle. Improving Reproducibility in Machine Learning Research (A Report from the NeurIPS 2019 Reproducibility Program). JMLR, 22(164):1–20, 8 2021. URL http://jmlr.org/papers/v22/20-303.html.
- Plesser (2018) Hans Ekkehard Plesser. Reproducibility vs. replicability: A brief history of a confused terminology. Frontiers in Neuroinformatics, 11, 1 2018. ISSN 1662-5196. doi: 10.3389/fninf.2017.00076. URL https://www.frontiersin.org/articles/10.3389/fninf.2017.00076/pdf.
- Pope et al. (2021) Phillip E. Pope, Chen Zhu, Ahmed Abdelkader, Micah Goldblum, and Tom Goldstein. The intrinsic dimension of images and its impact on learning. ArXiv, abs/2104.08894, 4 2021. URL https://export.arxiv.org/pdf/2104.08894.
- Price (1965) Derek J. Price. Networks of scientific papers. Science, 149 3683(3683):510–5, 7 1965. ISSN 0036-8075.
- Pruthi et al. (2020) Garima Pruthi, Frederick Liu, Mukund Sundararajan, and Satyen Kale. Estimating training data influence by tracking gradient descent. ArXiv, abs/2002.08484, 2 2020. URL https://export.arxiv.org/pdf/2002.08484.
- Publio et al. (2018) Gustavo Correa Publio, Diego Esteves, Agnieszka Lawrynowicz, P. Panov, Larisa N. Soldatova, Tommaso Soru, Joaquin Vanschoren, and Hamid Zafar. Ml-schema: Exposing the semantics of machine learning with schemas and ontologies. ArXiv, abs/1807.05351, 7 2018.
- Qiu et al. (2020) J. Qiu, Qibin Chen, Yuxiao Dong, Jing Zhang, Hongxia Yang, Ming Ding, Kuansan Wang, and Jie Tang. Gcc: Graph contrastive coding for graph neural network pre-training. Proceedings of the 26th ACM SIGKDD International Conference on Knowledge Discovery & Data Mining, 6 2020. doi: 10.1145/3394486.3403168. URL https://arxiv.org/pdf/2006.09963.
- Raff (2019) Edward Raff. A step toward quantifying independently reproducible machine learning research. ArXiv, abs/1909.06674, 9 2019.
- ReScience C (2023) ReScience C. Rescience c journal, 2023. URL http://rescience.github.io/. [Online; accessed 2023-09-09].
- Salamon & Bello (2016) Justin Salamon and Juan Pablo Bello. Deep convolutional neural networks and data augmentation for environmental sound classification. IEEE Signal Processing Letters, 24:279–283, 8 2016. doi: 10.1109/lsp.2017.2657381.
- Satorras & Bruna (2017) Victor Garcia Satorras and Joan Bruna. Few-shot learning with graph neural networks. ArXiv, abs/1711.04043, 11 2017. URL https://export.arxiv.org/pdf/1711.04043.
- Satorras et al. (2021) Vıctor Garcia Satorras, Emiel Hoogeboom, and Max Welling. E (n) equivariant graph neural networks. In Marina Meila and Tong Zhang (eds.), International conference on machine learning, volume 139, pp. 9323–9332. PMLR, PMLR, 2 2021.
- Schlichtkrull et al. (2018) Michael Schlichtkrull, Thomas N Kipf, Peter Bloem, Rianne Van Den Berg, Ivan Titov, and Max Welling. Modeling relational data with graph convolutional networks. In Aldo Gangemi, Roberto Navigli, Maria-Esther Vidal, Pascal Hitzler, Raphaël Troncy, Laura Hollink, Anna Tordai, and Mehwish Alam (eds.), The Semantic Web: 15th International Conference, ESWC 2018, Heraklion, Crete, Greece, June 3–7, 2018, Proceedings 15, volume 10843, pp. 593–607. Springer, Springer Science+Business Media, 2018. ISBN 978-3319934167. doi: 10.1007/978-3-319-93417-4_38. URL https://research.vu.nl/ws/files/246718572/Modeling_Relational_Data_with_Graph_Convolutional_Networks.pdf.
- Shah et al. (2020) Harshay Shah, Kaustav Tamuly, Aditi Raghunathan, Prateek Jain, and Praneeth Netrapalli. The pitfalls of simplicity bias in neural networks, 6 2020. URL https://proceedings.neurips.cc/paper/2020/file/6cfe0e6127fa25df2a0ef2ae1067d915-Paper.pdf.
- Shahriari et al. (2022) Mostafa Shahriari, Rudolf Ramler, and Lukas Fischer. How do deep-learning framework versions affect the reproducibility of neural network models? Machine Learning and Knowledge Extraction, 4(4):888–911, 10 2022. ISSN 2504-4990. doi: 10.3390/make4040045. URL https://www.mdpi.com/2504-4990/4/4/45/pdf?version=1665735645.
- Simonovsky & Komodakis (2017) M. Simonovsky and N. Komodakis. Dynamic edge-conditioned filters in convolutional neural networks on graphs. 2017 IEEE Conference on Computer Vision and Pattern Recognition (CVPR), pp. 29–38, 7 2017. ISSN 1063-6919. doi: 10.1109/cvpr.2017.11. URL https://arxiv.org/pdf/1704.02901.
- Sinha & Forde (2020) Koustuv Sinha and Jessica Zosa Forde. ML Reproducibility Tools and Best Practices, 2020. URL https://koustuvsinha.com/practices_for_reproducibility. [Online; accessed 2023-11-15].
- Springer Nature (2020) Springer Nature. Reporting standards and availability of data, materials, code and protocols. Nature, 2020. URL https://www.nature.com/nature/editorial-policies/reporting-standards. [Online; accessed 2023-11-15].
- Stodden et al. (2013) Victoria Stodden, David H. Bailey, Jonathan Michael Borwein, Randall J. LeVeque, William J. Rider, and W. A. Stein. Setting the default to reproducible reproducibility in computational and experimental mathematics. ICERM Workshop, 46, 2013.
- Stubbemann et al. (2023a) Maximilian Stubbemann, Tom Hanika, and Friedrich Martin Schneider. Intrinsic dimension for large-scale geometric learning. Transactions on Machine Learning Research, 2023, 2023a. URL https://openreview.net/forum?id=85BfDdYMBY.
- Stubbemann et al. (2023b) Maximilian Stubbemann, Tobias Hille, and Tom Hanika. Selecting features by their resilience to the curse of dimensionality. CoRR, abs/2304.02455, 2023b. doi: 10.48550/ARXIV.2304.02455.
- Sun & Wu (2021) Chuxiong Sun and Guoshi Wu. Scalable and adaptive graph neural networks with self-label-enhanced training. ArXiv, abs/2104.09376, 4 2021. ISSN 2331-8422. URL https://export.arxiv.org/pdf/2104.09376.
- Suryakumar et al. (2013) Divya Suryakumar, Andrew H. Sung, and Qingzhong Liu. Influence of machine learning vs. ranking algorithm on the critical dimension. International Journal of Future Computer and Communication, pp. 215–219, 2013. ISSN 2010-3751. doi: 10.7763/ijfcc.2013.v2.155.
- Syrgkanis & Zampetakis (2020) Vasilis Syrgkanis and Manolis Zampetakis. Estimation and inference with trees and forests in high dimensions. In Jacob Abernethy and Shivani Agarwal (eds.), Proceedings of Thirty Third Conference on Learning Theory, volume 125 of Proceedings of Machine Learning Research, pp. 3453–3454. PMLR, 09–12 Jul 2020. URL https://proceedings.mlr.press/v125/syrgkanis20a.html.
- Tatman et al. (2018) Rachael Tatman, J. Vanderplas, and Sohier Dane. A practical taxonomy of reproducibility for machine learning research. 2nd Reproducibility in Machine Learning Workshop at ICML, 6 2018. URL https://openreview.net/pdf?id=B1eYYK5QgX.
- Tatti et al. (2006) Nikolaj Tatti, Taneli Mielikäinen, A. Gionis, and Heikki Mannila. What is the dimension of your binary data? Sixth International Conference on Data Mining (ICDM’06), pp. 603–612, 12 2006. ISSN 1550-4786. doi: 10.1109/icdm.2006.167.
- Tian et al. (2020) Yonglong Tian, Chen Sun, Ben Poole, Dilip Krishnan, Cordelia Schmid, and Phillip Isola. What makes for good views for contrastive learning. ArXiv, abs/2005.10243:6827–6839, 5 2020. URL https://arxiv.org/pdf/2005.10243.
- Traina et al. (2010) Caetano Traina, Agma J. M. Traina, Leejay Wu, and Christos Faloutsos. Fast feature selection using fractal dimension. J. Inf. Data Manag., 1(1):3–16, 5 2010. ISSN 2178-7107. doi: 10.1184/r1/6605570.v1.
- Tsuchiya et al. (2019) Haruki Tsuchiya, Shinji Fukui, Yuji Iwahori, Yoshitsugu Hayashi, Witsarut Achariyaviriya, and Boonserm Kijsirikul. A method of data augmentation for classifying road damage considering influence on classification accuracy. In Imre J. Rudas, János Csirik, Carlos Toro, János Botzheim, Robert J. Howlett, and Lakhmi C. Jain (eds.), International Conference on Knowledge-Based Intelligent Information & Engineering Systems, volume 159, pp. 1449–1458. Elsevier BV, 2019. doi: 10.1016/j.procs.2019.09.315.
- Valle-Pérez et al. (2019) Guillermo Valle-Pérez, Chico Q. Camargo, and Ard A. Louis. Deep learning generalizes because the parameter-function map is biased towards simple functions. ICLR, 2019.
- Velickovic et al. (2017) Petar Velickovic, Guillem Cucurull, Arantxa Casanova, Adriana Romero, P. Lio’, and Yoshua Bengio. Graph attention networks. ArXiv, abs/1710.10903, 10 2017. URL https://arxiv.org/pdf/1710.10903.
- Wan et al. (2021) Zhi Wan, Yading Xu, and Branko Savija. On the Use of Machine Learning Models for Prediction of Compressive Strength of Concrete: Influence of Dimensionality Reduction on the Model Performance. Materials, 14(4):713, 2 2021. ISSN 1996-1944. doi: 10.3390/ma14040713. URL https://www.mdpi.com/1996-1944/14/4/713/pdf?version=1612864652.
- Wang et al. (2018) Hongwei Wang, Fuzheng Zhang, Xing Xie, and Minyi Guo. Dkn: Deep knowledge-aware network for news recommendation. In Pierre-Antoine Champin, Fabien L. Gandon, Mounia Lalmas, and Panagiotis G. Ipeirotis (eds.), Proceedings of the 2018 world wide web conference, pp. 1835–1844. ACM, 1 2018. doi: 10.1145/3178876.3186175.
- Wang et al. (2019a) Xiang Wang, Xiangnan He, Yixin Cao, Meng Liu, and Tat-Seng Chua. Kgat: Knowledge graph attention network for recommendation. Proceedings of the 25th ACM SIGKDD International Conference on Knowledge Discovery & Data Mining, 5 2019a. doi: 10.1145/3292500.3330989.
- Wang et al. (2019b) Xiang Wang, Xiangnan He, Meng Wang, Fuli Feng, and Tat-Seng Chua. Neural graph collaborative filtering. Proceedings of the 42nd International ACM SIGIR Conference on Research and Development in Information Retrieval, 7 2019b. doi: 10.1145/3331184.3331267. URL https://arxiv.org/pdf/1905.08108.
- Wang et al. (2019c) Xiao Wang, Houye Ji, C. Shi, Bai Wang, Peng Cui, Philip S. Yu, and Yanfang Ye. Heterogeneous graph attention network. The World Wide Web Conference, 5 2019c. doi: 10.1145/3308558.3313562. URL https://arxiv.org/pdf/1903.07293.
- Wu et al. (2018a) Felix Wu, Tianyi Zhang, Amauri H. de Souza, Christopher Fifty, Tao Yu, and Kilian Q. Weinberger. Simplifying graph convolutional networks. In PMLR, 2018a.
- Wu et al. (2018b) Shu Wu, Yuyuan Tang, Yanqiao Zhu, Liang Wang, Xing Xie, and T. Tan. Session-based recommendation with graph neural networks. ArXiv, abs/1811.00855, 11 2018b. doi: 10.1609/aaai.v33i01.3301346.
- Xu et al. (2018) Keyulu Xu, Weihua Hu, J. Leskovec, and S. Jegelka. How powerful are graph neural networks? ArXiv, abs/1810.00826, 10 2018. doi: 10.48550/arxiv.1810.00826. URL https://arxiv.org/pdf/1810.00826.
- Yao et al. (2018) Liang Yao, Chengsheng Mao, and Yuan Luo. Graph convolutional networks for text classification. ArXiv, abs/1809.05679, 9 2018. doi: 10.48550/arxiv.1809.05679. URL https://arxiv.org/pdf/1809.05679.
- Ying et al. (2018) Rex Ying, Jiaxuan You, Christopher Morris, Xiang Ren, William L. Hamilton, and J. Leskovec. Hierarchical graph representation learning with differentiable pooling. Neural Information Processing Systems, pp. 4805–4815, 6 2018. URL https://export.arxiv.org/pdf/1806.08804.
- You et al. (2020) Yuning You, Tianlong Chen, Yongduo Sui, Ting Chen, Zhangyang Wang, and Yang Shen. Graph contrastive learning with augmentations. ArXiv, abs/2010.13902:5812–5823, 10 2020. URL https://proceedings.neurips.cc/paper/2020/file/3fe230348e9a12c13120749e3f9fa4cd-Paper.pdf.
- Yun et al. (2019) Seongjun Yun, Minbyul Jeong, Raehyun Kim, Jaewoo Kang, and Hyunwoo J. Kim. Graph transformer networks. Neural Information Processing Systems, 32:11960–11970, 11 2019. URL https://papers.nips.cc/paper/9367-graph-transformer-networks.pdf.
- Zellers et al. (2017) Rowan Zellers, Mark Yatskar, Sam Thomson, and Yejin Choi. Neural motifs: Scene graph parsing with global context. 2018 IEEE/CVF Conference on Computer Vision and Pattern Recognition, pp. 5831–5840, 11 2017. doi: 10.1109/cvpr.2018.00611. URL https://export.arxiv.org/pdf/1711.06640.
- Zhang et al. (2019) Chuxu Zhang, Dongjin Song, Chao Huang, A. Swami, and N. Chawla. Heterogeneous graph neural network. Proceedings of the 25th ACM SIGKDD International Conference on Knowledge Discovery & Data Mining, 7 2019. doi: 10.1145/3292500.3330961. URL https://dl.acm.org/doi/pdf/10.1145/3292500.3330961.
- Zhang & Chen (2018) Muhan Zhang and Yixin Chen. Link prediction based on graph neural networks. Neural Information Processing Systems, 31:5171–5181, 12 2018. URL https://arxiv.org/pdf/1802.09691.pdf.
- Zhang et al. (2018) Yuhao Zhang, Peng Qi, and Christopher D. Manning. Graph convolution over pruned dependency trees improves relation extraction. ArXiv, abs/1809.10185, 9 2018. doi: 10.18653/v1/d18-1244. URL https://arxiv.org/pdf/1809.10185.
- Zhu et al. (2020) Jiong Zhu, Yujun Yan, Lingxiao Zhao, Mark Heimann, L. Akoglu, and Danai Koutra. Beyond homophily in graph neural networks: Current limitations and effective designs. arXiv: Learning, 6 2020. doi: 10.48550/arxiv.2006.11468. URL https://arxiv.org/pdf/2006.11468.
Appendix A Considered Publications
In our survey, we began by collecting a list of publications to consider (Subsection 4.1). We utilized the Semantic Scholar API, employing the search term “graph neural network” to obtain a set of results. These results were then processed with a dedicated script to calculate the scoring metric for each publication. Out of the vast array of publications, we selected the top 100 papers based on these scores.
The process of reproducing the list proved to be a challenge, because of a significant degree of variability due to the non-deterministic nature of the Semantic Scholar API. This variability was particularly noticeable with regard to page ordering and the contents of the first 10000 entries. Over time we started reproducibility attempts of publications that are now no longer part of the list.
In our filtering process, we manually excluded entries that were surveys, coding frameworks, or lacked a clear connection to graph neural networks. We also ignored works that only applied Graph Convolutional Network (GCN) methods to other field of science or used time-dependent or spatial data, especially in the field of chemistry. The reason for this was that the feature selection approach used later was not directly applicable to such work, or at best uninformative. Additionally, publications applying methods to very specific data sets were not included in our list.
Some well-known papers, such as GraphSAINT, were not included because they did not appear under the search term used. This absence also explains why SAGN+SLE, SGC, and GraphSAGE do not appear in the list. To better cover the field of graph neural network research, additional search terms like “graph convolutional network” would be necessary. The subsequent changes in criteria led to a high rate of skipped publications in the full list, which was generated end of May 2023.
| Publication | Score | Status |
| Semi-Supervised Classification with GCNs (Kipf & Welling, 2016) | 2832.57 | i |
| Graph Attention Networks (Velickovic et al., 2017) | 1869.83 | e |
| How Powerful are GNNs? (Xu et al., 2018) | 913.2 | s |
| Modeling Relational Data with GCNs (Schlichtkrull et al., 2018) | 540.0 | i |
| LightGCN: Simplifying and Powering Graph Convolution Network for Recommendation (He et al., 2020) | 531.0 | s |
| Neural Graph Collaborative Filtering (Wang et al., 2019b) | 417.0 | d |
| Heterogeneous Graph Attention Network (Wang et al., 2019c) | 355.5 | s |
| Hierarchical Graph Representation Learning with Differentiable Pooling (Ying et al., 2018) | 322.4 | i |
| Graph Contrastive Learning with Augmentations (You et al., 2020) | 303.67 | s |
| KGAT: Knowledge Graph Attention Network for Recommendation (Wang et al., 2019a) | 281.5 | s |
| GCNs for Text Classification (Yao et al., 2018) | 261.4 | d |
| Link Prediction Based on GNNs (Zhang & Chen, 2018) | 248.4 | s |
| GCNs for Hyperspectral Image Classification (Hong et al., 2020) | 234.0 | d |
| DeepGCNs: Can GCNs Go As Deep As CNNs? (Li et al., 2019) | 230.75 | s |
| E(n) Equivariant GNNs (Satorras et al., 2021) | 220.5 | s |
| Weisfeiler and Leman Go Neural: Higher-order GNNs (Morris et al., 2018) | 211.0 | s |
| Predict then Propagate: GNNs meet Personalized PageRank (Klicpera et al., 2018) | 210.6 | s |
| Heterogeneous Graph Transformer (Hu et al., 2020b) | 209.0 | s |
| Heterogeneous GNN (Zhang et al., 2019) | 203.0 | s |
| Geom-GCN: Geometric GCNs (Pei et al., 2020) | 196.67 | s |
| Session-based Recommendation with GNNs (Wu et al., 2018b) | 193.0 | d |
| Self-Attention Graph Pooling (Lee et al., 2019) | 180.5 | s |
| GCC: Graph Contrastive Coding for GNN Pre-Training (Qiu et al., 2020) | 178.0 | s |
| Few-Shot Learning with GNNs (Satorras & Bruna, 2017) | 169.33 | s |
| Dynamic Edge-Conditioned Filters in CNNs on Graphs (Simonovsky & Komodakis, 2017) | 168.67 | e |
| How to Find Your Friendly Neighborhood: Graph Attention Design with Self-Supervision (Kim & Oh, 2022) | 159.0 | s |
| Beyond Homophily in GNNs: Current Limitations and Effective Designs (Zhu et al., 2020) | 158.33 | s |
| GNN-Based Anomaly Detection in Multivariate Time Series (Deng & Hooi, 2021) | 150.0 | d |
| DKN: Deep Knowledge-Aware Network for News Recommendation (Wang et al., 2018) | 149.8 | d |
| MixHop: Higher-Order Graph Convolutional Architectures via Sparsified Neighborhood Mixing (Abu-El-Haija et al., 2019) | 142.0 | s |
| MAGNN: Metapath Aggregated GNN for Heterogeneous Graph Embedding (Fu et al., 2020) | 137.67 | s |
| Principal Neighbourhood Aggregation for Graph Nets (Corso et al., 2020) | 132.67 | s |
| Hypergraph Neural Networks (Feng et al., 2018) | 128.6 | s |
| Graph Transformer Networks (Yun et al., 2019) | 128.25 | s |
| Beyond Low-frequency Information in GCNs (Bo et al., 2021) | 125.0 | s |
| Encoding Sentences with GCNs for Semantic Role Labeling (Marcheggiani & Titov, 2017) | 123.17 | d |
| Neural Motifs: Scene Graph Parsing with Global Context (Zellers et al., 2017) | 122.67 | d |
| Graph Convolution over Pruned Dependency Trees Improves Relation Extraction (Zhang et al., 2018) | 122.4 | d |
| Graph Structure Learning for Robust GNNs (Jin et al., 2020) | 121.33 | s |
| Towards Deeper GNNs (Liu et al., 2020b) | 118.67 | s |
Appendix B Reproducibility Context
The data collected during the successful reproducibility attempts in Section 4 can be summarized in a Formal Context (Ganter & Wille, 1997), where the papers make up the object set and the analyzed features of reproducibility the attribute set. A cross for paper and feature means that this feature was observed for the paper. Based on the definitions of the features, this indicates a negative aspect of reproducibility occurring in the paper.
| data set | software | computational result | ||||||||||||||||||||||||||||||||||
|
availability |
transformation |
environment |
usage |
source code |
model |
predictions |
||||||||||||||||||||||||||||||
|
metadata |
download |
preprocessing |
selection |
dependencies |
variables |
documentation |
scripts |
bugs |
experiments |
|
||||||||||||||||||||||||||
|
D1—format not documented |
D2—version not specified |
D3—no direct access |
D4—access not possible |
D5—privacy restricted |
D6—license restricted |
D7—on request only |
D8—manual steps |
D9—incomplete description |
D10—train/test splits unclear |
D11—number of samples not documented |
S1—exact version not documented |
S2—specified version not available anymore |
S3—necessary hardware unavailable |
S4—seeds not set |
S5—important values unclear |
S6—not up to date |
S7—necessary arguments not clear |
S8—missing hyperparameters |
S9—incomplete train/test scripts |
S10—unclear which version was used |
S11—never fixed |
S12—issue solutions not applied |
S13—fix distributed through other channels |
S14—api changes |
S15—out of memory |
S16—one missing |
S17—all missing |
S18—hyperparameter search not included |
S19—only general idea implemented |
R1—no model weights |
R2—small deviations |
R3—strong differences in parts |
R4—strong differences everywhere |
R5—weak statistics |
R6—no predictions |
|
| GCN | ||||||||||||||||||||||||||||||||||||
| Relational GCN | ||||||||||||||||||||||||||||||||||||
| GraphSage | ||||||||||||||||||||||||||||||||||||
| Diffpool | ||||||||||||||||||||||||||||||||||||
| SGC | ||||||||||||||||||||||||||||||||||||
| SAGN+SLE | ||||||||||||||||||||||||||||||||||||
Appendix C Presentation of other Experiments
Here we want to include figures presenting the results from the influence experiments not yet presented in detail. The diagrams are structured the same way as the ones presented in Subsection 5.4 For each experiment we first show the normalized distribution of normalized intrinsic dimensionality for the used data sets (after preprocessing). For data sets with more than samples, an algorithm for calculating the approximated \acNID is used. Additionally a second figure presents the accuracy/f1 scores obtained when training on the feature reduced data sets. For a more detailed explanation see description accompanying Figure 3.
Some data sets have so few features that the steps of the discarding process are smaller than one feature. This leads to fewer data points, which in turn give the impression of only partially complete graphs for visualizations of normalized distribution of the \acNID or accuracy for given discarding proportions as the necessary granularity can not be achieved (see Figure 6).
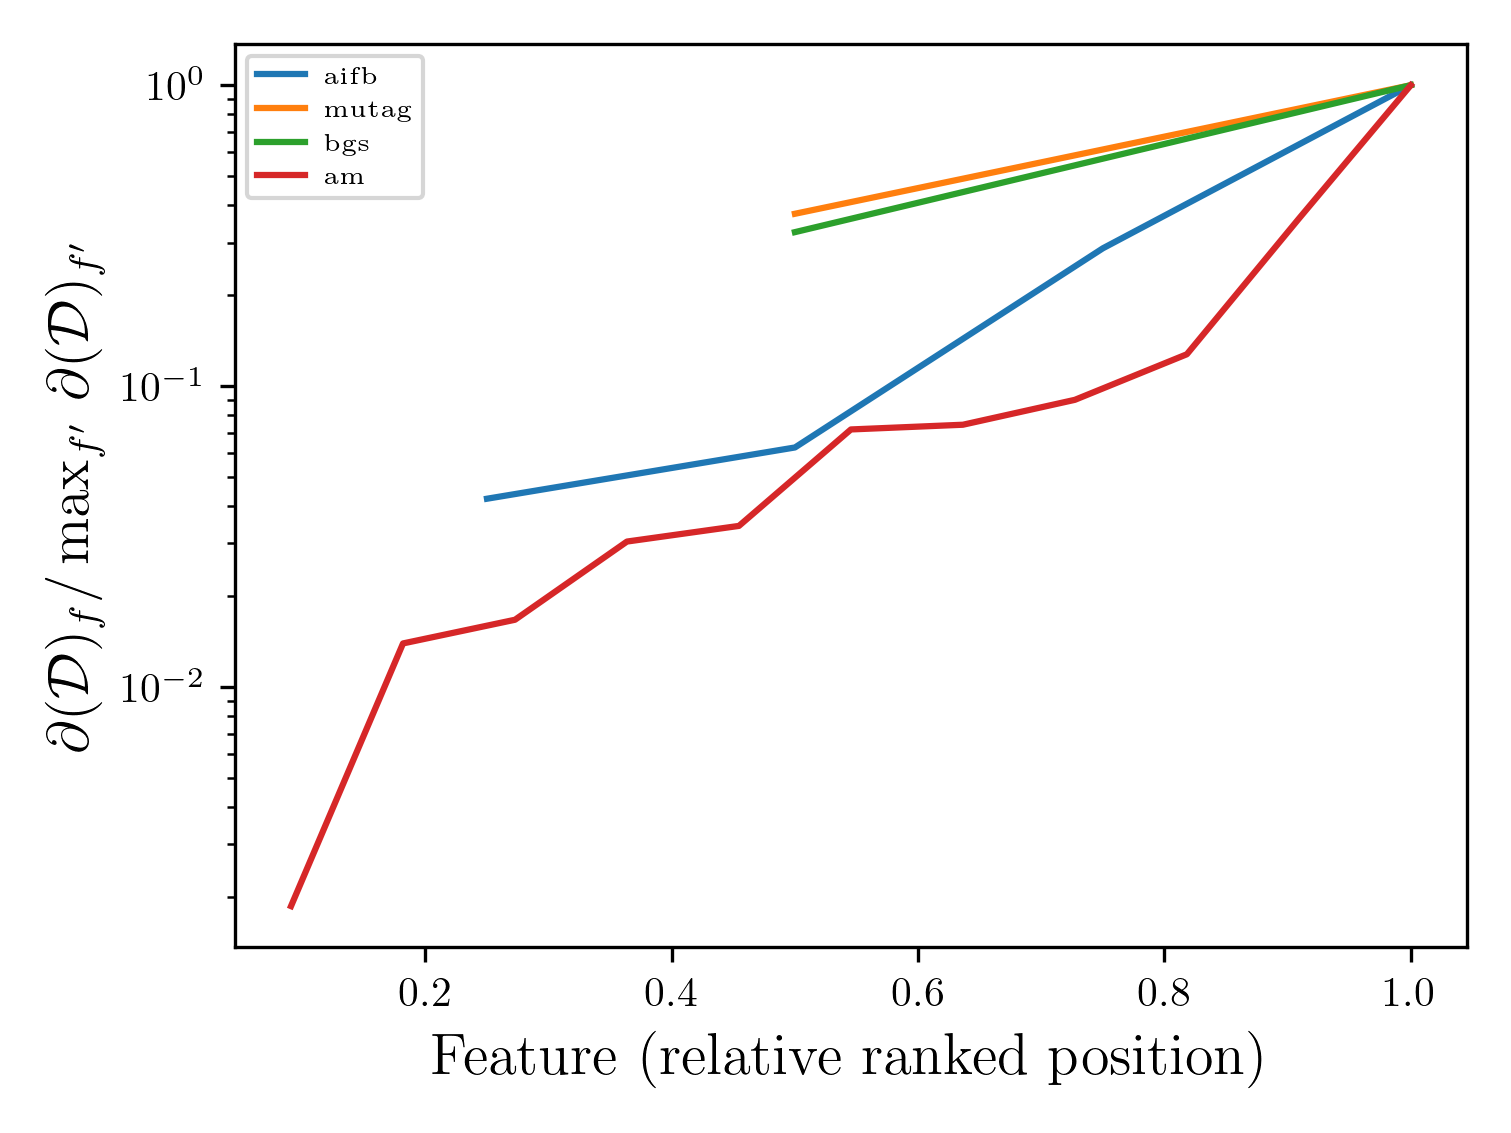
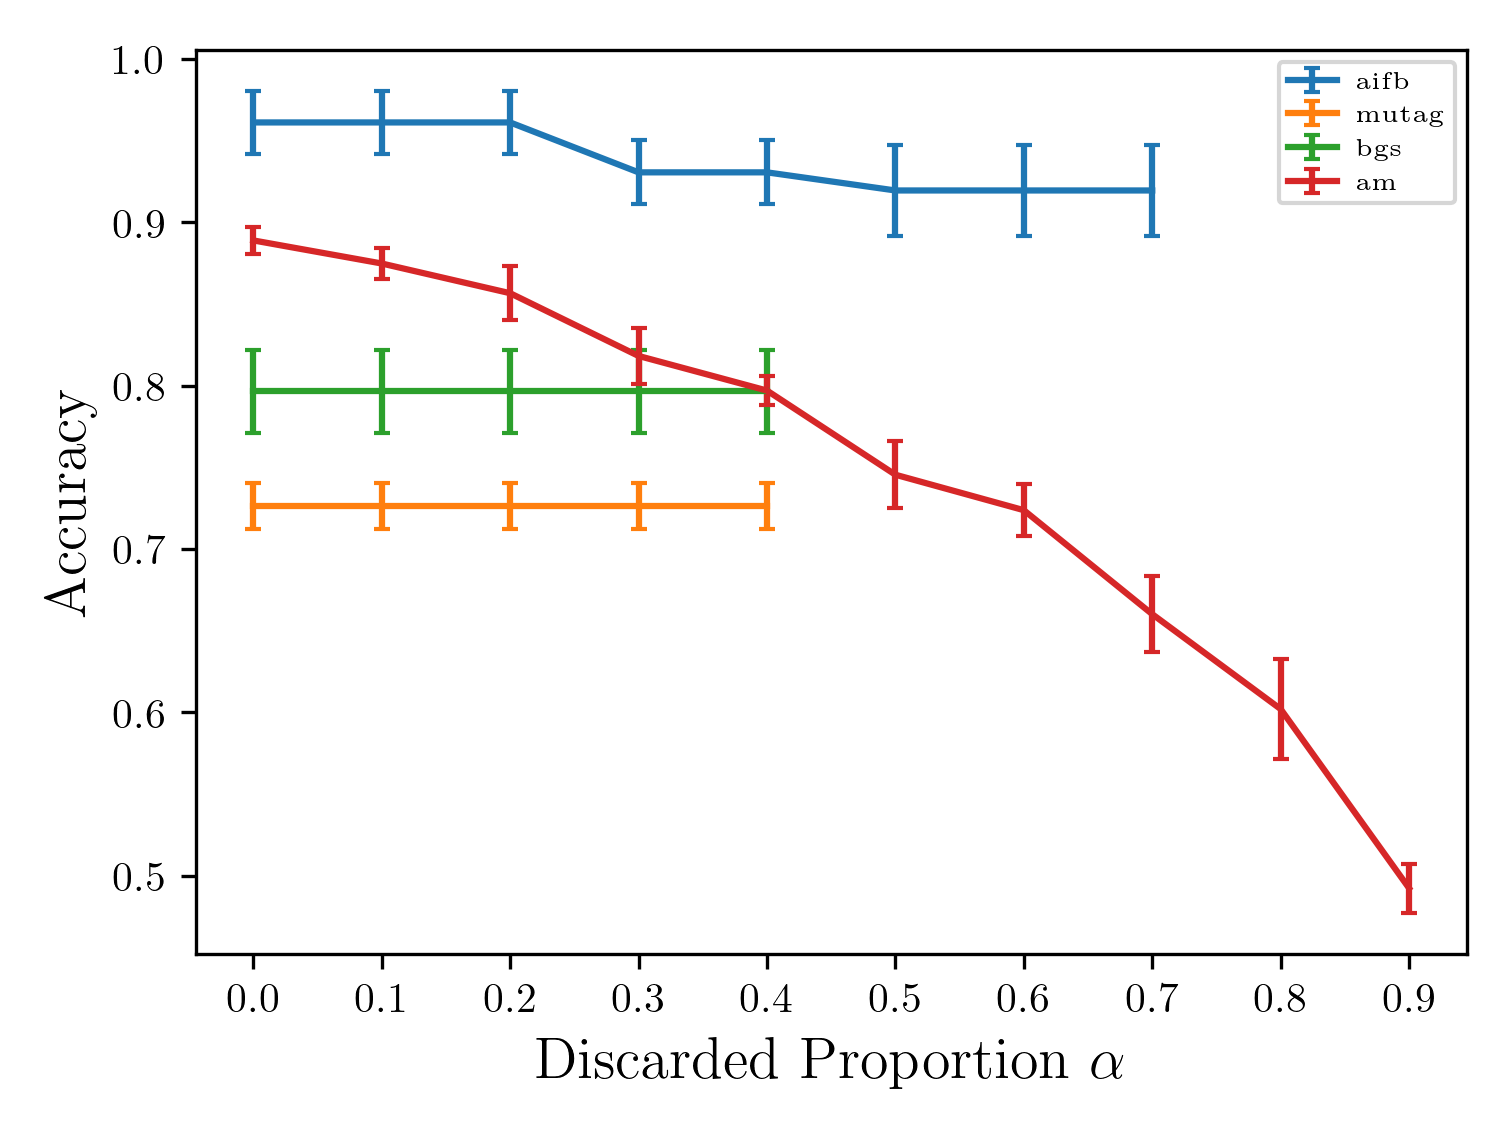
The DiffPool publication used only two data sets, of which only one, namely the enzymes data set, has features for the graph nodes. Therefore we were not able to apply the described method to the other data set. Furthermore we encountered another problem during the DiffPool experiments (see Figure 7). It is strongly implied in the paper that the method uses the node features in its computations. However, a close examination of the source code reveals that in the default configuration, the node features are built from the classification targets of the associated graph. By changing the corresponding parameter in the training script to a different argument, which we decided on the basis of which preprocessing modifications it induced, no improvements could be observed. On the contrary, the overall performance of the method got worse. Nevertheless, we present the results obtained, which again show, that the DiffPool method does not use the node features in a comprehensible way.