Misinformation is not about Bad Facts: An Analysis of the Production and Consumption of Fringe Content
Abstract
What if misinformation is not an information problem at all? Our findings suggest that online fringe ideologies spread through the use of content that is consensus-based and “factually correct”. We found that Australian news publishers with both moderate and far-right political leanings contain comparable levels of information completeness and quality; and furthermore, that far-right Twitter users often share from moderate sources. However, a stark difference emerges when we consider two additional factors: 1) the narrow topic selection of articles by far-right users, suggesting that they cherrypick only news articles that engage with specific topics of their concern, and 2) the difference between moderate and far-right publishers when we examine the writing style of their articles. Furthermore, we can even identify users prone to sharing misinformation based on their communication style. These findings have important implications for countering online misinformation, as they highlight the powerful role that users’ personal bias towards specific topics, and publishers’ writing styles, have in amplifying fringe ideologies online.
1 Introduction
Misinformation can broadly be defined as false and inaccurate narratives that people may believe and communicate despite the existence of a social or expert consensus on the topic. Although not purposefully spread to create harm (which would be called disinformation), misinformation can cause significant societal disruption. For example, anti-vaccination rhetoric can cause families to withhold vaccination and expose children to life-threatening but preventable diseases such as measles and poliomyelitis, with potentially fatal consequences (Attwell, Smith, and Ward 2021). The reach and consequences of misinformation are amplified by the increasing use of online social media as a primary source of news and information (Shearer and Mitchell 2021). For example, Kydd (2021) blames social media for mainstreaming conspiracy theorizing, resulting in the attack on the US Capitol by devout QAnon followers. Due to the diverse range of ways misinformation can influence believers, it follows that misinformation cannot be studied in isolation. It is crucial to consider what is being shared in context: who is sharing it, who are the likely consumers and how it is being shared to reach the audiences effectively. In this work, we examine how far-right and fringe online groups share and leverage news media articles to advance their narratives, to understand the role of news publishers in potentially unintentionally propagating misinformation.
Research Questions: In this paper, we use content- and style-based measures to show that misinformation, like any other content, can be styled to target particular online cohorts. Together, these elements and their users make up a misinformation ecosystem. In particular, we answer the following research questions (RQs):
-
•
RQ1: What role do the style and content of news media play in enabling the spread of misinformation?
-
•
RQ2 Can we differentiate fringe groups based on linguistic styles?
-
•
RQ3 Can we differentiate contents from producers and consumers based on linguistic styles?
Our contributions are as follows:
-
1.
We provide an analysis that comparatively examines the ideological landscape of Australian news and how users selectively share news to further their own ends regardless of the source (RQ1).
-
2.
We propose a classifier to identify linguistic styles within extreme online groups as well as styles that are commonly used in the online misinformation space. (RQ2).
-
3.
We show that production and consumption of misinformation exhibit different patterns that can be differentiated by styles (RQ3).
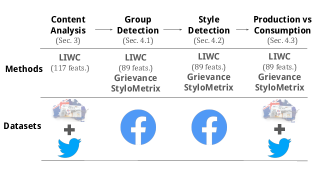
Fig. 1 depicts the steps of our analysis, the used datasets and methods. We expand each contribution below.
Landscape of Australian news (Section 3)
Starting from the assumption that misinformation is an information production problem, much of the prior work has studied the connection between misinformation, and the publishers’ political leaning (Calvillo et al. 2020; Das and Ahmed 2022). We conducted a comprehensive analysis of Australian news media consumption, focusing on several key aspects. Firstly, we utilized the Trust Index, a metric measuring information completeness, to compare news articles from legacy news media publishers with distinct ideological stances. Secondly, we examined writing style differences across these sources. Additionally, we delved into the sharing patterns of news articles by highly partisan online users.
Our analysis revealed content-based differentiations among news sources and extreme ideological cohorts. Interestingly, we observed significant differences when comparing articles shared by extreme online users with articles published by far-right news media, particularly in terms of linguistic patterns. Notably, we found less distinction between far-right and moderate articles. Even in cases where differences were statistically significant, the effect sizes were small, indicating that the sharing of extreme content is less tied to the source’s reliability and more about how users interpret and leverage a source.
This leads us to the conclusion that misinformation may be less of an issue related to information production and more of an issue tied to information consumption. To explore this further, we investigate whether it is an information consumption problem.
Classification of Extreme Online Groups and Styles (Section 4)
This study uses stylistic metrics from established dictionaries (such as LIWC and the Grievance dictionary) to construct stylistic classifiers. Using these stylistic classifiers, we can accurately distinguish vulnerable misinformation consumers (like anti-vaccination and far-right) from regular online social media users (Section 4.1). We further show that we can detect extreme ideological users’ writing styles, as categorized by our manual labeling (Section 4.2). Lastly, we show that we can successfully distinguish far-right sources from far-right consumers using a stylistic classifier (Section 4.3).
2 Datasets and Measures
We present the datasets and measures used in this work.
2.1 News and social media datasets
Australian news by Google News.
To evaluate the potential role of Australian news publications in facilitating misinformation dissemination, we collect Australian news articles sourced from Google News via The Daily Edit (TDE) platform. TDE aggregates news articles from Google News, encompassing 14 distinct topics: ‘Climate Change,’ ‘Sport,’ ‘Human Migration,’ ‘World,’ ‘Finance,’ ‘Technology,’ ‘Taiwan,’ ‘Top Stories,’ ‘Entertainment,’ ‘Australia,’ ‘Business,’ ‘Health,’ ‘Science,’ and ‘China.’ These are all the topics available when the region is set to Australia (AU) in Google News. The collection period for the news articles spans from November 9, 2022, to January 11, 2023. The dataset contains articles published by news publishers.
TDE computes a Trust Index score for each article as follows. Articles about the same event are grouped into stories. Articles are represented as sequences of sentences; all similar sentences within a story are clustered together, and clusters are interpreted as details. Consequently, each article has a set of supporting details (common narrative elements across multiple sources in a story). TDE computes an article’s Trust Index based on the percentage of details it covers from a story – i.e., the article’s informational completeness.
The political leaning of publishers.
We use an external media bias dataset from allsides111https://www.allsides.com/, which assesses the political leaning of news publishers on a five-point scale, ranging from extreme- and moderate-left to center to moderate- and extreme-right. Note that these media bias ratings represent the average viewpoint of individuals across the political spectrum rather than the perspective of any single individual or group (Park et al. 2021; Newman et al. 2021). We consolidate the extreme- and moderate-left categories into a single ‘left’ class and merge the extreme- and moderate-right categories into a ‘right’ class. This results in three political leaning classes: left, center, and right.
| Top Stories | Australia | World | Technology | Sport | Entertainment | Health | |
|---|---|---|---|---|---|---|---|
| L | 4264 () | 2346 () | 2288 () | 671 () | 1270 () | 1165 () | 396 () |
| C | 2783 () | 2193 () | 1894 () | 539 () | 609 () | 993 () | 355 () |
| R | 3768 () | 2504 () | 1876 () | 259 () | 1243 () | 1179 () | 257 () |
| Total | 10815 | 7043 | 6058 | 1469 | 3122 | 3337 | 1008 |
| China | Business | Science | Finance | Human migration | Climate change | Taiwan | |
| L | 908 () | 720 () | 319 () | 435 () | 442 () | 318 () | 48 () |
| C | 846 () | 668 () | 513 () | 382 () | 436 () | 270 () | 44 () |
| R | 435 () | 621 () | 128 () | 200 () | 198 () | 105 () | 34 () |
| Total | 2189 | 2009 | 960 | 1017 | 1076 | 693 | 126 |
Far-right Twitter users.
We use a manually curated list containing Australian far-right coded Twitter users (Bailo, Johns, and Rizoiu 2023) and collect their most recent tweets using the Twitter API (at most tweets for each user). The collected tweets span from February 22, 2009 to December 9, 2022. These tweets contained urls and among the urls, articles were also in Google News dataset (Section 3). We expand the articles by linking to the publishers present in either the Google News or allsides dataset which results in news articles (Section 4). Then we collected the content of each article using urllib.parse Python library222 https://docs.python.org/3/library/urllib.parse.html. We successfully downloaded the texts of articles at the end.
Facebook groups.
We manually assemble two lists of Facebook pages for specific ideologies, namely Australian Antivax and Far-right pages. Australian Far-right has 14 Facebook pages and Australian Antivax has 6 Facebook pages. Using CrowdTangle API, we collect all posts from the Facebook pages between January 23, 2021 and February 24, 2023. We collect posts from the Far right pages and posts from the Antivax pages.
2.2 Linguistic Measurements of Style
We utilize three linguistic metrics that quantify linguistic attributes within text.
LIWC
is one of the most widely used text analysis tools in psychology, which has recently been adopted by computational social scientists to draw insights into human behavior through computational methods (Chung and Pennebaker 2018). It includes both content (e.g., death, religion) and function (e.g., conjunctions, articles) words. LIWC (version 2022)333https://www.liwc.app/ has 117 categories in total. However, in order to capture the stylistic differences of the extreme groups without contamination from content, we removed content-related features such as religion and family. We use 89 style-related categories in Section 4.
Grievance
is a psycholinguistic dictionary that can be used to automatically understand language use in the context of grievance-fueled violence threat assessment (van der Vegt et al. 2021). We use it because a study about militant right-wing extremism (Stankov 2021) suggests that a critical ingredient of a militant extremist mindset distinguishing it from social conservatism is grudge, which it can detect. We include Grievance dictionary even though it is a content-based measurement due to its ability to extract violence and threat-specific words.
StyloMetrix
is a grammar-related statistical representation of text. It allows for representing a text sample of any length with a linguistic vector of a fixed size (Okulska and Zawadzka 2023). It has several preferable characteristics over well-known contextual embedding, such as BERT. First, StyloMetrix vectors encode entire documents, resolving the issue of varying text lengths. This could help when combining texts from multiple platforms, such as Facebook and Twitter. Second, StyloMetrix vectors encode the entire sample’s stylistic structure, not the words’ “meanings”. Okulska and Zawadzka (2023) show that show that StyloMetrix (without a semantic layer) is sufficient to detect the genre of the text.
3 Australian News: production and sharing (RQ1)
Here, we answer RQ1 and investigate whether the content from publishers with different ideological leanings exhibits deviation in terms of topic coverage, the Trust Index of articles published, and linguistic patterns. We also examine how users share these articles to promote their own agendas.
3.1 Coverage and Trust of publishers
Coverage by topic.
We extracted the Google News articles from publishers with identified stances based on the media bias data (note that not all publishers from the Google News dataset are present in the allsides dataset). Table 1 shows the number of articles from the stance-identified publishers for each topic. Across all topics, except ‘Entertainment,’ we observe a higher number of left-leaning articles than right-leaning ones. Particularly noteworthy is the disparity in percentages within the ‘Climate change’ and ‘Technology’ topics, where the count of right-leaning articles is substantially lower than that of left-leaning articles.
| Top Stories | Australia | World | Technology | Sport | Entertainment | Health | ||||||||||||||||
|---|---|---|---|---|---|---|---|---|---|---|---|---|---|---|---|---|---|---|---|---|---|---|
| Trust Index | N | N | N | N | N | N | N | |||||||||||||||
| L | 0.60 | 0.20 | 4264 | 0.63 | 0.21 | 2346 | 0.60 | 0.20 | 2288 | 0.58 | 0.19 | 671 | 0.62 | 0.20 | 1270 | 0.61 | 0.19 | 1165 | 0.61 | 0.20 | 396 | |
| C | 0.59 | 0.20 | 2783 | 0.61 | 0.21 | 2193 | 0.57 | 0.21 | 1894 | 0.55 | 0.20 | 539 | 0.55 | 0.20 | 609 | 0.63 | 0.20 | 993 | 0.58 | 0.21 | 355 | |
| R | 0.54 | 0.20 | 3768 | 0.60 | 0.21 | 2504 | 0.53 | 0.20 | 1876 | 0.51 | 0.19 | 259 | 0.55 | 0.20 | 1243 | 0.60 | 0.19 | 1179 | 0.59 | 0.20 | 257 | |
| Effect size | 0.31 | 0.11 | 0.36 | 0.36 | 0.35 | 0.03 | 0.10 | |||||||||||||||
| p value | 0.0000 | 0.0001 | 0.0000 | 0.0000 | 0.0000 | 0.5287 | 0.2218 | |||||||||||||||
| China | Business | Science | Finance | Human migration | Climate change | Taiwan | ||||||||||||||||
| Trust Index | N | N | N | N | N | N | N | |||||||||||||||
| L | 0.60 | 0.20 | 908 | 0.63 | 0.19 | 720 | 0.61 | 0.19 | 319 | 0.58 | 0.18 | 435 | 0.58 | 0.21 | 442 | 0.57 | 0.18 | 318 | 0.66 | 0.20 | 48 | |
| C | 0.58 | 0.20 | 846 | 0.60 | 0.20 | 668 | 0.62 | 0.19 | 513 | 0.54 | 0.18 | 382 | 0.54 | 0.20 | 436 | 0.57 | 0.20 | 270 | 0.55 | 0.19 | 44 | |
| R | 0.52 | 0.20 | 435 | 0.61 | 0.19 | 621 | 0.60 | 0.19 | 128 | 0.52 | 0.18 | 200 | 0.51 | 0.21 | 198 | 0.53 | 0.18 | 105 | 0.57 | 0.20 | 34 | |
| Effect size | 0.38 | 0.08 | 0.08 | 0.33 | 0.31 | 0.22 | 0.40 | |||||||||||||||
| p value | 0.0000 | 0.1414 | 0.4423 | 0.0001 | 0.0003 | 0.0695 | 0.0793 | |||||||||||||||
Informational completeness by political leaning.
We conduct a comparative analysis of the Trust Index for articles from left-, center-, and right-leaning publishers. For each topic and political group, Table 2 provides the mean (), standard deviation (), and the number of articles (). We assess whether there is a significant difference between Trust Index of left- and right-leaning news articles using independent samples -tests. We report the test p-value, and we emphasize statistically significant results (). We also quantify the effect size for each test using Cohen’s d (Cohen 2013). Generally, a d value of 0.2 indicates a small effect size and is considered medium.
There are several observations from Table 2. First, the mean Trust Index for articles from left-leaning publishers (L in Table 2) consistently surpasses that of the right-leaning, regardless of the topic’s statistical significance. This indicates that, in general, left-leaning articles tend to be more informationally complete. The standard deviations of the Trust Index is nearly identical across all groups and topics. Second, several topics such as ‘World’, ‘China’, ‘Technology’, ‘Finance’ and ‘Human Migration’ achieve statistical significance but only moderate effect size. ‘Taiwan’ exhibits the largest effect size among all topics; however, it does not reach statistical significance due to the limited number of articles in the ’Taiwan’ category (refer to Table 1). Conversely, ‘Australia’ shows a statistically significant difference, albeit with only a small effect size ().
Conclusion.
While the distinction between left- and right-leaning publishers is statistically significant for specific topics, the practical impact of this difference is marginal in the real world, given the small or non-existent effect size.
3.2 Is the content from far-right publishers different from the moderates?
Here, we ask whether Google News articles’ content and writing style differ based on the political leaning of the publishers. More specifically, we are interested in far-right publishers (as per the allsides classification) vs all the others that we dub here moderates.
Setup.
We manually inspect randomly selected articles and identify four specific topics – ‘Top Stories,’ ‘Australia,’ ‘Finance,’ and ‘Climate Change’ – that exhibited interesting content contrasts. Table 3 shows the number of articles from far-right and moderate publishers for each category. We gather the content of each article using the beautifulsoup Python library444beautifulsoup: https://pypi.org/project/beautifulsoup4/. Next, we use LIWC to analyze the text of each article and perform t-tests to find whether articles from far-right publishers show statistically significant differences from moderates. To present significant results, we use the Bonferroni correction, i.e., where .
| Top Stories | Australia | Finance | Climate change | ||||||
| Num articles | Moderate | Far-right | Moderate | Far-right | Moderate | Far-right | Moderate | Far-right | |
| 9459 | 148 | 6880 | 46 | 1073 | 13 | 881 | 12 | ||
| Significant categories | |||||||||
| Authentic | 34.79 | 28.37 | |||||||
| 23.47 | 20.50 | ||||||||
| Effect size | 0.27 | ||||||||
| Words Per Sentence | 23.77 | 20.64 | 23.50 | 21.11 | |||||
| 9.96 | 4.09 | 6.90 | 4.18 | ||||||
| Effect size | 0.32 | 0.35 | |||||||
| pronoun | 7.47 | 8.73 | |||||||
| 4.17 | 3.70 | ||||||||
| Effect size | 0.30 | ||||||||
| ppron | 4.48 | 5.86 | |||||||
| 3.19 | 3.19 | ||||||||
| Effect size | 0.34 | ||||||||
| you | 0.34 | 0.69 | |||||||
| 1.11 | 0.91 | ||||||||
| Effect size | 0.32 | ||||||||
| shehe | 1.77 | 2.36 | |||||||
| 1.94 | 1.93 | ||||||||
| Effect size | 0.30 | ||||||||
| tentat | 1.17 | 1.42 | |||||||
| 1.13 | 0.81 | ||||||||
| Effect size | 0.22 | ||||||||
| Social | 10.67 | 12.11 | |||||||
| 4.89 | 4.57 | ||||||||
| Effect size | 0.29 | ||||||||
| polite | 0.38 | 0.19 | |||||||
| 0.78 | 0.31 | ||||||||
| Effect size | 0.24 | ||||||||
| comm | 2.01 | 2.54 | |||||||
| 1.61 | 1.30 | ||||||||
| Effect size | 0.29 | ||||||||
| male | 0.51 | 1.63 | |||||||
| 1.11 | 1.32 | ||||||||
| Effect size | 1.01 | ||||||||
| Lifestyle | 4.70 | 3.60 | 5.06 | 2.81 | |||||
| 3.18 | 1.71 | 3.60 | 1.71 | ||||||
| Effect size | 0.35 | 0.63 | |||||||
| work | 2.59 | 2.08 | 3.11 | 1.51 | |||||
| 2.36 | 1.42 | 2.72 | 1.22 | ||||||
| Effect size | 0.22 | 0.59 | |||||||
| money | 1.10 | 0.44 | 1.48 | 0.41 | |||||
| 2.09 | 1.10 | 2.14 | 0.70 | ||||||
| Effect size | 0.33 | 0.50 | |||||||
| AllPunc | 16.45 | 17.98 | |||||||
| 4.66 | 4.36 | ||||||||
| Effect size | 0.33 | ||||||||
| time | 5.08 | 3.87 | |||||||
| 2.67 | 1.64 | ||||||||
| Effect size | 0.45 | ||||||||
| emo_neg | 0.26 | 0.65 | |||||||
| 0.37 | 0.41 | ||||||||
| Effect size | 1.03 | ||||||||
Results.
Table 3 presents the 21 pairs (LIWC category, article topic) for which the difference between the far-right publishers and the moderates is statistically significant – 14 LIWC categories for ‘Top stories,’ 5 for ‘Australia’ and one for each of ‘Finance’ and ‘Climate change.’ However, most of these have low () or moderate () effect sizes; only two such topic-category pairs show large effect sizes (). In ‘Finance’, far-right publishers use significantly more words from the male category – containing 230 words such as ‘he,’ ‘his,’ ‘him’ or ‘man’ (). The second is ‘Climate change’, with far-right articles using statistically significantly more words in the Negative Emotions category (618 words such as ‘bad,’ ‘hate,’ ‘hurt,’ ‘worry,’ ‘fear’) and the effect size is large ().
Conclusion.
The linguistic signals captured by LIWC alone are insufficient for distinguishing extreme (far-right) publishers from moderate ones. Corroborated with the conclusion from Section 3.1, this indicates little difference in what publishers of different political leanings produce.
3.3 Far-right articles: production vs. consumption
| Words Per Sentence | Culture | politic | Lifestyle | money | |||||||||||||
| # articles | |||||||||||||||||
| Top Stories | 148 | 20.64 | 4.09 | 0.93 | 2.27 | 2.18 | 0.43 | 1.37 | 1.97 | 0.47 | 3.60 | 1.70 | 0.77 | 0.44 | 1.10 | 0.69 | |
| Australia | 46 | 21.11 | 4.18 | 0.86 | 2.23 | 2.02 | 0.44 | 1.02 | 1.59 | 0.59 | 2.81 | 1.71 | 0.96 | 0.41 | 0.70 | 0.70 | |
| Far-right | Finance | 13 | 21.56 | 3.56 | 0.80 | 1.48 | 0.77 | 0.68 | 0.79 | 0.80 | 0.67 | 9.12 | 2.44 | – | 5.30 | 2.44 | – |
| publishers | Climate change | 12 | 21.60 | 4.60 | – | 2.03 | 1.80 | – | 1.61 | 1.86 | – | 3.64 | 2.24 | – | 0.67 | 1.00 | – |
| Top Stories | 9459 | 23.77 | 9.96 | 0.40 | 1.98 | 2.49 | 0.57 | 1.28 | 2.09 | 0.59 | 4.70 | 3.18 | 0.54 | 1.10 | 1.99 | 0.53 | |
| Australia | 6880 | 23.50 | 6.90 | 0.52 | 2.37 | 2.61 | 0.42 | 1.68 | 2.29 | 0.41 | 5.06 | 3.60 | 0.42 | 1.48 | 2.14 | 0.37 | |
| Moderate | Finance | 1073 | 22.79 | 7.11 | 0.62 | 1.86 | 1.73 | 0.58 | 0.94 | 1.35 | 0.66 | 9.64 | 3.34 | -0.75 | 6.17 | 3.30 | -1.25 |
| publishers | Climate change | 881 | 24.48 | 8.91 | 0.37 | 2.27 | 2.46 | 0.43 | 1.57 | 2.15 | 0.43 | 4.85 | 2.47 | 0.46 | 1.51 | 1.87 | 0.33 |
| far-right Twitter shared | 11643 | 27.13 | 6.98 | 3.60 | 3.11 | 2.78 | 2.86 | 6.67 | 4.02 | 2.46 | 2.92 | ||||||
Here, we assess whether there is a difference in the linguistic styles of the articles far-right users share. Note there is a difference with the analysis in the previous Section 3.2: there we analyzed the difference in information production by far-right publishers, here we investigate information consumption and sharing by far-right users.
Setup.
The far-right Twitter users share articles from the Google News dataset on the four topics of interest – ‘Top Stories,’ ‘Australia,’ ‘Finance,’ and ‘Climate Change’. We process these articles’ content using LIWC. Finally, we perform t-tests (Bonferroni corrected) to compare articles shared by the far-right Twitter users with 1) articles produced by far-right publishers and 2) articles produced by moderate publishers. Table 4 shows select LIWC categories that show statistically significant differences.
Results.
There are several noteworthy findings. First, we find (LIWC category, article topic) pairs statistically significantly different when comparing articles from far-right producers with articles shared by far-right Twitter users. In comparison, there are significantly different pairs between articles from moderate publishers and those shared by far-right Twitter users. However, only pairs significantly differ between far-right and moderate publishers (see Section 3.2). This indicates that far-right publishers are more similar to moderate publishers than to those far-right Twitter users share. Investigating the mean values () and standard deviation () yields a similar conclusion – the differences between what the far-right Twitter users chose to share and what is produced by the far-right publisers are larger the differences between far-right and moderate publishers. Second, the LIWC categories that showed significant differences were Words Per Sentence (WPS), Culture, and Politic, where the articles shared by the Twitter users showed significantly higher mean values. ‘Climate change’ did not show significant results in any LIWC category. We also report Lifestyle and money, which showed significant differences in ‘Top stories’ and ‘Australia’ with high effect sizes. Third, the articles shared by Twitter users use more words from the categories of Culture and, specifically, its subcategory, politic, compared to the far-right-leaning articles from the Google news dataset. This indicates that far-right Twitter users share more political articles than the general Google News sample suggests. This seems intuitive, as most conspiracy theories touch on politics.
Conclusion.
The above results suggest that information consumption patterns of online far-right users differ from the information production by far-right publishers. We hypothesize that these users do not share random samples of the articles produced by far-right publishers. They rather cherrypick the articles most useful for their arguments. We note that users may not necessarily express agreement or a positive point of view of the article that they share. In fact, far-right Twitter users regularly share articles from reputable and left-leaning publishers. Many of these articles are about politics, so negative responses may be anticipated.
4 Style over Content
In this section, we propose a style classifier and attempt to distinguish different online extreme groups (Section 4.1), styles (Section 4.2), and producing from sharing (Section 4.3).
4.1 Identify Extreme Groups using Styles (RQ2)
Lee et al. (2022) showed that political groups with left- and right-leaning ideologies exhibit distinct tendencies when consuming and disseminating information on social media platforms. We curated two collections of Facebook groups and collected their activity from over two years, presenting two datasets of extreme groups – antivax and far-right, as detailed in Section 2.
Why style?
Style words reflect how people communicate, whereas content words convey what they say in terms of meaning and topic. Style words are more closely linked to measures of people’s social and psychological worlds (Tausczik and Pennebaker 2010). Styles encompass a range of linguistic features, including sentence structure, grammar, and punctuation patterns. Unlike the content, which can be influenced by subject matter, external sources, or intentional deception, stylistic features are intrinsic to one’s writing and are less prone to deliberate manipulation.
We focus on stylistic differences because a group’s contents or topics of interest can dynamically change; however, stylistic fingerprints persist (da Rocha et al. 2022). Another reason to consider style over content-related features is that stylistic representation is applicable across domains, while content-related features are constrained to specific topics.
Method and design.
We begin by demonstrating the classification performance in distinguishing between extreme groups. Subsequently, we differentiate various text styles, irrespective of their association with specific groups.
We design a predictive experiment aimed at evaluating and contrasting the effectiveness of three dictionary-based stylistic metrics (LIWC, Grievance and StyloMetrix). The task is to distinguish posts from the two extreme Facebook groups and a normal (non-extreme) group – we created the normal group to encompass a wide range of discussions, from cooking to non-profit organizations. To put the performance of stylistic classifiers into context, we compare against a content-based baseline – the popular text encoding technique, BERT (Devlin et al. 2018) commonly used in textual classification tasks.
In contrast to the three dictionary-based encodings, BERT also considers the contextual information for each instance of a given word, enhancing its capabilities. The BERT embeddings used in this study are the mean-pooled representations of the activations from the last layer of the en_stsb_distilbert_base model. This approach captures contextual information from the entire input sentence and produces fixed-length vectors suitable for downstream tasks.
| BERT | LIWC | Grievance | StyloMetrix | LGS | ||
|---|---|---|---|---|---|---|
| Logistic regression | accuracy | 0.80 | 0.73 | 0.56 | 0.69 | 0.74 |
| macro F1 | 0.79 | 0.73 | 0.54 | 0.68 | 0.74 | |
| Linear SVC | accuracy | 0.76 | 0.66 | 0.57 | 0.71 | 0.68 |
| macro F1 | 0.76 | 0.61 | 0.55 | 0.70 | 0.64 | |
| Random Forest | accuracy | 0.75 | 0.72 | 0.65 | 0.70 | 0.77 |
| macro F1 | 0.75 | 0.71 | 0.63 | 0.69 | 0.76 |
This exercise aims to evaluate various feature sets, not the classification algorithms. We interpret the difference in prediction performance as a difference in the representativity of the feature sets. Table 5 reports classification performance of three off-the-shelf classifiers. We randomly sampled posts from each list of groups (Far right, Antivax and normal). The reported performance is the average result of 5-fold cross-validation. We compare the three basic stylistic feature sets (LIWC, Grievance and StyloMetrix) and their concatenation – denoted as LGS.
Results.
Since BERT leverages the content and style of the given text, it is often the best-performing feature set. However, stylistic-based classifiers outperform the content-based classifiers: using the Random Forest classifier, LGS outperforms BERT. In other words, based solely on the style and without leveraging the content of a given post, we can predict which ideological group the post came from. The true positive rate for the normal group was , for Far right group is , and for Antivax group is . We notice that some posts from Antivax group were misclassified as Far right, while only few posts from Far right were misclassified as Antivax. This is because anti-vax space is a unique niche with far-right elements, while far-right groups generally discuss diverse topics.
4.2 Identifying Styles
Here, we classify the writing styles of posts. This predictive exercise differs from the one in Section 4.1; here, we test whether human-labeled styles can be detected using a style-based classifier; we distinguished user groups in Section 4.1.
Method and design.
First, a research team member with expertise in literature science manually annotated the writing style of text samples from the Far right and Antivax groups ( for each group). They employed a deep qualitative approach in which the style labels were generated alongside the labeling. We identified styles that are extensively used in misinformation online environments by manually inspecting them. The labeled styles in these samples are “Casual”, “Empowerment”, “Clickbait”, “Expert” and “Intimacy”. This annotation is a result of sampling 50 posts from both Far right and Antivax then We remove the posts with no style; Table 6 shows the number of posts per style.
| Casual | Empowerment | Clickbait | Expert | Intimacy | Total | |
|---|---|---|---|---|---|---|
| Far right | 11 | 21 | 1 | 13 | 1 | 47 |
| Antivax | 11 | 4 | 1 | 0 | 0 | 16 |
| 22 | 25 | 2 | 13 | 1 | 63 |
| Style | Classifier | LGS | BERT | ||
|---|---|---|---|---|---|
| macro F1 | Accuracy | macro F1 | Accuracy | ||
| Empowerment | Random Forest | 0.60 | 0.58 | 0.51 | 0.54 |
| Logistic Regression | 0.49 | 0.52 | 0.67 | 0.66 | |
| Casual | Random Forest | 0.67 | 0.5 | 0.54 | 0.55 |
| Logistic Regression | 0.45 | 0.52 | 0.67 | 0.70 | |
| Expert | Random Forest | 0.47 | 0.5 | 0.42 | 0.5 |
| Logistic Regression | 0.40 | 0.73 | 0.57 | 0.46 | |
“Clickbait” and “Intimacy” have only two and one exemplars, respectively, so we remove them and classify “Casual”, “Empowerment” and “Expert” styles. For each of the style, we performed a binary classification by randomly sampling negative samples to balance the sample size. For the Random Forest classifier, we used max tree depth = and the number of trees = due to the small sample size.
Results.
Table 7 reports the classification results. In general, the stylistic features, LGS, perform better with the Random Forest classifier and BERT shows better performance with the Logistic Regression which is expected due to the nature of these features. While it is true that the Random Forest classifier may not fully leverage the rich contextual information in BERT embeddings, we aimed to assess whether it could still yield valuable insights or competitive results when compared to more complex models. This experimental choice was made to offer a comparative perspective on different feature representations and classifiers.
For all three styles, the LGS stylistic features outperform BERT with the Random Forest classifier measured by macro F1 score, which is consistent with the results presented in Table 5 for group style classification. “Expert” style was the most challenging for both classifiers since there were only samples.
4.3 Identify Far-right articles using Styles: production vs. consumption (RQ3)
Inspired by the findings in Section 3.3, we hypothesise that far-right production can be differentiated from far-right consumption. In this section, we the style classifier to distinguish far-right production from far-right consumption. We add moderate production for comparison purposes.
Method and design.
We use Twitter shared articles explained in Section 2 as far-right consumption data since these were shared by far-right Twitter users. In order to increase the number of articles produced by far-right publishers, as well as moderate, we expand the number of articles as follows: for each article shared by Twitter users if the publisher of the article is referenced in allsides data, we add this article to far-right production or moderate production based on the leaning of the publisher. After the expansion, we finally have Twitter shared articles (consumption), moderate articles and far-right produced articles. To balance the sample size among the three classes, we randomly sample articles from Twitter shared and moderate produced articles so that all three classes have samples.
Results.
The reported scores in Table 8 are averaged over 10-fold stratified cross-validation.
| Classifier | LGS | BERT | |||
|---|---|---|---|---|---|
| macro F1 | Accuracy | macro F1 | Accuracy | ||
| consumption | Random Forest | 0.65 | 0.65 | 0.40 | 0.54 |
| Logistic Regression | 0.56 | 0.59 | 0.50 | 0.60 | |
| FR production | Random Forest | 0.75 | 0.65 | 0.64 | 0.54 |
| Logistic Regression | 0.70 | 0.59 | 0.71 | 0.60 | |
| MD production | Random Forest | 0.53 | 0.65 | 0.52 | 0.54 |
| Logistic Regression | 0.48 | 0.59 | 0.58 | 0.60 | |
In Section 4.2, we observed that our curated stylistic features (LGS) perform better with Random Forest classifier while BERT could outperform with Logistic Regression in most cases. In Table 8, we see that LGS with Random Forest classifier consistently outperforms BERT with Logistic Regression except for articles from moderate publishers. In addition, even when LGS with Random Forest classifier did not outperform BERT with Logistic Regression, the performance difference was minimal as witnessed by the case of far-right produced articles.
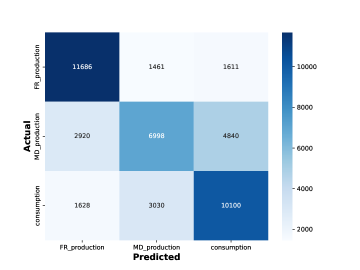
Fig. 2 reports the confusion matrix of the three class classification from Random Forest classifier. This result is the average of 10-fold stratified cross-validation. The most notable observation is that far-right produced articles are easily distinguished from the others as well as far-right consumption. The most number of confusions occurred between the articles between the far-right consumption and the moderate produced. These findings reinforce the previous observations from Section 3.3 that far-right production and far-right consumption patterns are different.
5 Related Work
In this section, We investigate content-based misinformation detection methods and their associated limitations, as well as style-based approaches.
Content-based methods.
Traditionally, misinformation detection techniques have relied on content-based information, such as encoded texts using language models. Alkhodair et al. (2020) proposed a recurrent neural network model for detecting rumors in breaking news using word embeddings. Similarly, Horne and Adali (2017) integrated three types of features, including stylistic elements, to classify fake news. Their findings revealed significant distinctions between fake and real news content. Meanwhile, Sarnovskỳ, Maslej-Krešňáková, and Ivancová (2022) concentrated on identifying fake news within the Slovak online sphere. They applied deep learning models to Word2Vec representations of the texts. While these models demonstrated significant performance, it is worth noting that the dataset predominantly comprised articles centered around COVID-19.
A significant shortcoming of content-based methods lies in the dynamic nature of misinformation topics. Models trained on predefined subjects may struggle to adapt to emerging themes. Furthermore, training deep learning models requires substantial data to mitigate the risk of overfitting. To address these limitations, Raza and Ding (2022) introduced a context-based model focusing on social aspects to identify fake news. This model incorporates users’ social interactions, such as comments on news articles, posts, and replies, as well as upvotes and downvotes. This approach could serve as a valuable complement, especially when engagement data is readily available.
Style-based methods.
Whitehouse et al. (2022) showed that general-purpose content-based classifiers tend to overfit to specific text sources. They introduced a style-based classification approach; however, the proposed stylometric features leverage the categories in the General Inquirer (GI) dictionary, encompassing content-specific words related to religion and politics. We omit such specific categories in this work when employing the Linguistic Inquiry and Word Count (LIWC).
More recently, Kumarage et al. (2023) demonstrated the effective detection of AI-generated texts in Twitter timelines using various stylistic signals. Their study showed that classifiers employing the proposed stylometric features outperformed Bag of Words and Word2Vec embeddings. Notably, they mentioned that among the stylometric features, punctuation and phraseology features proved to be the most significant. While these findings are motivating, their research primarily focuses on distinguishing between human and AI-authored content within a given Twitter timeline. In contrast, our goal is to discriminate between different writing styles, such as intimate and expert styles. In another attempt to verify authorship using style representations, Wegmann, Schraagen, and Nguyen (2022), content-controlled style representations were proposed. Authors demonstrated that by controlling different levels of contents, e.g., authorship verification within texts from the same conversation or the same domain, the performance varies. They also manually inspected the resulting clusters to find out what styles are learned such as ‘punctuation’. In our proposed work, we attempt to learn and distinguish styles used by extreme groups since we observed that certain styles were strategically adopted by these groups to reach vulnerable demographics in online misinformation space.
6 Conclusion and Discussion
In this paper, we showed that misinformation is conveyed through styled messages by detecting styles in extreme online communities and being able to distinguish the communities using styles rather than content. Specifically, Facebook pages which share misinformation can be distinguished by the style of the posts made within each group. The classification results showed that stylistic measures can outperform the content-based classifier. This is intriguing since the two groups, especially an anti-vaccination group, can be easily identified through the analysis of content-related vocabulary.
We also evidenced that far-right produced contents are significantly different from what far-right online users consume. We showed that the far-right production and the far-right consumption can be distinguished by using stylistic features. This indicates that misinformation consumers prefer certain styles of information as opposed to the contents of information.
This study has limitations across multiple dimensions. Firstly, the Facebook group dataset is constrained in its post volume. Additionally, the availability of labeled style data was even more scarce, limiting the generalizability of the findings. Our plan in the future is to apply active learning process to label more posts efficiently. Secondly, we focused only on styles of messages in order to distinguish and observe effects styled text. While studying online misinformation space, we noticed that misinformation producers not only strategically adopt styles to effectively spread the information, but also utilise formats such as graphics, videos and reports. By considering these facets of misinformation packaging, we can enhance the results further. Lastly, we intend to explore and develop our understanding of the vulnerable demographics in online spaces. We observed that extremist online groups aimed at these personas tailor their content according to these preferences. Better understanding the patterns and styles of misinformation that the vulnerable demographics are attracted to can serve as a guiding reference for policy makers, suggesting the adoption of a comparable strategy to effectively counter the dissemination of misinformation.
Ethical Statement
Data Collection and Management
All data that we obtained was publicly available at the time of data collection. We discarded deleted, protected, and private content at the time of analysis. Therefore, the analyses reported in this work does not compromise any user privacy.
Broader Potential Impact of Work
By exploring landscape of Australian news media and online misinformation space, we hope to raise awareness of how the language styles used in these online communities may appeal to vulnerable demographics. Also, understanding how misinformation is styled and packaged showed insights on how we can approach affected population with reliable information. Awareness goes both ways, though, and the results presented in the paper could also lead to malicious users learning about ways to easily manipulate the target audience. However, based on our observation, creators of misinformation with intention to reach a target population are already styling their messages accordingly. By showing that misinformation consumers are attracted to styled messages, we hope any entities involved in misinformation intervention campaigns utilize these findings.
References
- Alkhodair et al. (2020) Alkhodair, S. A.; Ding, S. H.; Fung, B. C.; and Liu, J. 2020. Detecting breaking news rumors of emerging topics in social media. Information Processing & Management, 57(2): 102018.
- Attwell, Smith, and Ward (2021) Attwell, K.; Smith, D. T.; and Ward, P. R. 2021. ‘If your child’s vaccinated, why do you care about mine?’ Rhetoric, responsibility, power and vaccine rejection. Journal of Sociology, 57(2): 268–285.
- Bailo, Johns, and Rizoiu (2023) Bailo, F.; Johns, A.; and Rizoiu, M.-A. 2023. Riding information crises: the performance of far-right Twitter users in Australia during the 2019–2020 bushfires and the COVID-19 pandemic. Information, Communication & Society, 1–19.
- Calvillo et al. (2020) Calvillo, D. P.; Ross, B. J.; Garcia, R. J.; Smelter, T. J.; and Rutchick, A. M. 2020. Political ideology predicts perceptions of the threat of COVID-19 (and susceptibility to fake news about it). Social Psychological and Personality Science, 11(8): 1119–1128.
- Chung and Pennebaker (2018) Chung, C. K.; and Pennebaker, J. W. 2018. What do we know when we LIWC a person? Text analysis as an assessment tool for traits, personal concerns and life stories. The Sage handbook of personality and individual differences, 341–360.
- Cohen (2013) Cohen, J. 2013. Statistical power analysis for the behavioral sciences. Routledge.
- da Rocha et al. (2022) da Rocha, M. A.; de Morais, P. S. G.; da Silva Barros, D. M.; dos Santos, J. P. Q.; Dias-Trindade, S.; and de Medeiros Valentim, R. A. 2022. A text as unique as a fingerprint: Text analysis and authorship recognition in a Virtual Learning Environment of the Unified Health System in Brazil. Expert Systems with Applications, 203: 117280.
- Das and Ahmed (2022) Das, R.; and Ahmed, W. 2022. Rethinking fake news: Disinformation and ideology during the time of COVID-19 global pandemic. IIM Kozhikode Society & Management Review, 11(1): 146–159.
- Devlin et al. (2018) Devlin, J.; Chang, M.-W.; Lee, K.; and Toutanova, K. 2018. Bert: Pre-training of deep bidirectional transformers for language understanding. arXiv preprint arXiv:1810.04805.
- Horne and Adali (2017) Horne, B.; and Adali, S. 2017. This just in: Fake news packs a lot in title, uses simpler, repetitive content in text body, more similar to satire than real news. In ICWSM, volume 11, 759–766.
- Kumarage et al. (2023) Kumarage, T.; Garland, J.; Bhattacharjee, A.; Trapeznikov, K.; Ruston, S.; and Liu, H. 2023. Stylometric Detection of AI-Generated Text in Twitter Timelines. arXiv:2303.03697.
- Kydd (2021) Kydd, A. H. 2021. Decline, radicalization and the attack on the US Capitol. Violence: An International Journal, 2(1): 3–23.
- Lee et al. (2022) Lee, J.; Wu, S.; Ertugrul, A. M.; Lin, Y.-R.; and Xie, L. 2022. Whose Advantage? Measuring Attention Dynamics across YouTube and Twitter on Controversial Topics. In ICWSM, volume 16, 573–583.
- Newman et al. (2021) Newman, N.; Fletcher, R.; Schulz, A.; Andi, S.; Robertson, C. T.; and Nielsen, R. K. 2021. Reuters Institute digital news report 2021. Reuters Institute for the Study of Journalism.
- Okulska and Zawadzka (2023) Okulska, I.; and Zawadzka, A. 2023. Styles with Benefits. The StyloMetrix Vectors for Stylistic and Semantic Text Classification of Small-Scale Datasets and Different Sample Length.
- Park et al. (2021) Park, S.; Fisher, C.; McGuinness, K.; Lee, J. Y.; and McCallum, K. 2021. Digital news report: Australia 2021. News and Media Research Centre (UC).
- Raza and Ding (2022) Raza, S.; and Ding, C. 2022. Fake news detection based on news content and social contexts: a transformer-based approach. International Journal of Data Science and Analytics, 13(4): 335–362.
- Sarnovskỳ, Maslej-Krešňáková, and Ivancová (2022) Sarnovskỳ, M.; Maslej-Krešňáková, V.; and Ivancová, K. 2022. Fake news detection related to the covid-19 in slovak language using deep learning methods. Acta Polytechnica Hungarica, 19(2): 43–57.
- Shearer and Mitchell (2021) Shearer, E.; and Mitchell, A. 2021. News use across social media platforms in 2020.
- Stankov (2021) Stankov, L. 2021. From social conservatism and authoritarian populism to militant right-wing extremism. Personality and individual differences, 175: 110733.
- Tausczik and Pennebaker (2010) Tausczik, Y. R.; and Pennebaker, J. W. 2010. The psychological meaning of words: LIWC and computerized text analysis methods. Journal of language and social psychology, 29(1): 24–54.
- van der Vegt et al. (2021) van der Vegt, I.; Mozes, M.; Kleinberg, B.; and Gill, P. 2021. The grievance dictionary: Understanding threatening language use. Behavior research methods, 1–15.
- Wegmann, Schraagen, and Nguyen (2022) Wegmann, A.; Schraagen, M.; and Nguyen, D. 2022. Same Author or Just Same Topic? Towards Content-Independent Style Representations. In Gella, S.; He, H.; Majumder, B. P.; Can, B.; Giunchiglia, E.; Cahyawijaya, S.; Min, S.; Mozes, M.; Li, X. L.; Augenstein, I.; Rogers, A.; Cho, K.; Grefenstette, E.; Rimell, L.; and Dyer, C., eds., Proceedings of the 7th Workshop on Representation Learning for NLP, 249–268. Dublin, Ireland: Association for Computational Linguistics.
- Whitehouse et al. (2022) Whitehouse, C.; Weyde, T.; Madhyastha, P.; and Komninos, N. 2022. Evaluation of fake news detection with knowledge-enhanced language models. In ICWSM, volume 16, 1425–1429.
Supplementary materials accompanying the paper Misinformation is not about Bad Facts: An Analysis of the Production and Consumption of Fringe Content.
Appendix A Details of Stylistic measures
We summarize the linguistic measures we used in Table 9. The full list of features of StyloMetrix is found here555https://github.com/ZILiAT-NASK/StyloMetrix/blob/v0.1.0/resources/metrics˙list˙en.md.
| LIWC | Grievance | StyloMetrix | |
|---|---|---|---|
| Summary | LIWC is a transparent text analysis program that counts words in psychologically meaningful categories | Grievance dictionary assess grievance-fuelled communications through language | StyloMetrix is a tool for creating text representations as StyloMetrix vectors |
| # features | 89 | 22 | 175 |
| features | Segment, WC, Analytic, Clout, Authentic, Tone, WPS, BigWords, Dic, Linguistic, function, pronoun, ppron, i, we, you, shehe, they, ipron, det, article, number, prep, auxverb, adverb, conj, negate, verb, adj, quantity, Drives, affiliation, achieve, power, Cognition, allnone, cogproc, insight, cause, discrep, tentat, certitude, differ, memory, Affect, tone_pos, tone_neg, emotion, emo_pos, emo_neg, emo_anx, emo_anger, emo_sad, swear, Social, socbehav, prosocial, polite, conflict, moral, comm, socrefs, substances, risk, curiosity, allure, Perception, attention, motion, space, visual, auditory, feeling, time, focuspast, focuspresent, focusfuture, Conversation, netspeak, assent, nonflu, filler, AllPunc, Period, Comma, QMark, Exclam, Apostro, OtherP | deadline, desperation, fixation, frustration, god, grievance, hate, help, honour, impostor, jealousy, loneliness, murder, paranoia, planning, relationship, soldier, suicide, surveillance, threat, violence, weaponry |