Possible GeV gamma-ray emission from the pulsar wind nebula in CTA 1
Abstract
We report a detection of GeV -ray emission potentially originating from the pulsar wind nebula in CTA 1 by analyzing about 15 yr of Fermi Large Area Telescope data. By selecting an energy range from 50 GeV to 1 TeV to remove contamination from the -ray pulsar PSR J0007+7303, we have discovered an extended -ray source with a TS value of 44.94 in the region of CTA 1. The obtained flux is measured to be 6.71 2.60 erg with a spectral index of 1.61 0.36, which allows for a smooth connection with the flux in the TeV band. CTA 1 is also considered to be associated with 1LHAASO J0007+7303u, which is an Ultra-High-Energy source listed in the recently published catalog of the Large High Altitude Air Shower Observatory. We assume that the radiation originates from the pulsar wind nebula and that its multi-wavelength spectral energy distribution can be explained well with a time-dependent one-zone model.
keywords:
gamma-rays: general — ISM: supernova remnants — methods: data analysis1 Introduction
The detection and characterization of Ultra-High-Energy (UHE; 0.1 PeV) -ray sources have significant implications for our understanding of the origin and acceleration mechanisms of cosmic rays. The Large High Altitude Air Shower Observatory (LHAASO) is a revolutionary project that aims to explore the high-energy universe with remarkable sensitivity (Cao et al., 2019). The LHAASO collaboration has made a breakthrough by reporting the detection of 12 UHE -ray sources with statistical significance exceeding 7 and a maximum energy of up to 1.4 PeV (Cao et al., 2021), sparking further exploration of UHE gamma-ray sources. Recently, the first catalog of -ray sources detected by LHAASO was published (Cao et al., 2023), containing a total of 90 -ray sources with an extended size smaller than 2∘ and a significance of detection at a 5 significance level. Among these sources, 43 exhibit UHE emission at a 4 significance level. 1LHAASO J0007+7303u is a TeV source in the first LHAASO catalog, detected by both the Water Cherenkov Detector Array (WCDA) and the 1 km2 array (KM2A) as a UHE source with a significance of TS100 = 171.6. This source is considered to be associated with the shell-type supernova remnant (SNR) CTA 1 (approximately 0.∘12 away) (Cao et al., 2023).
CTA 1 (G119.5+10.2) was first proposed as a composite SNR through radio observations by Harris & Roberts (1960), and it was first detected in the X-ray band by Seward et al. (1995). In the center of the region, there was a faint compact point source called RX J0007.0+7303, which was considered to be a pulsar candidate powering the nebula (Seward et al., 1995; Slane et al., 1997). Deeper observations of RX J0007.0+7303 were conducted using , ASCA satellites (Slane et al., 2004), and the observatory (Halpern et al., 2004), revealing that it is a point source embedded in a nebula with a jet-like feature. Additionally, the source 3EG J0010+7309, which is associated with RX J0007.0+7303, has been reported as a radio-quiet -ray pulsar candidate (Mattox et al., 1996). Although no -ray pulsations had been found, the constant -ray flux, the hard power-law spectrum, and the steepening of the spectrum above approximately 2 GeV, confirmed that the source was a -ray pulsar (Brazier et al., 1998). The Fermi Large Area Telescope (Fermi-LAT) satellite then discovered a -ray pulsar (PSR J0007+7303) in CTA 1, which had a period of 316.86 ms and a period derivative of 3.614 s s-1, making it the first pulsar discovered by -rays (Abdo et al., 2008). Subsequently, X-ray pulsations were detected (Caraveo et al., 2010; Lin et al., 2010). However, neither radio nor optical counterparts of RX J0007.0+7303 were detected (Mignani et al., 2013).
The TeV -ray emission from CTA 1 was discovered by Aliu et al. (2013) using the observatory. The extended source, VER J0006+729, was detected at a 6.5 significance level, with a two-dimensional Gaussian of 0.30∘ 0.24∘ at a distance of 5′ from PSR J0007+7303. Previously, Abdo et al. (2012) reported potentially GeV extended emission after analyzing 2 yr of Fermi-LAT data in the off-pulse emission of PSR J0007.0+7303, but they only provided upper limits. On the other hand, Li et al. (2016) using 7 yr of Fermi-LAT data and updated response functions, did not detect GeV emission compatible with CTA 1 or the highly energetic ( 100 GeV) pulsar wind nebula. Instead, they provided an upper limit. In a more recent study, Ackermann et al. (2018) reported GeV emission with a radius of approximately 0.98∘, spatially consistent with the radio emission from CTA 1. However, there was a discrepancy in the flux normalization between the GeV and TeV spectra. In this work, we reanalyze the GeV emission from CTA 1 using about 15 yr of Fermi-LAT data.
2 FERMI-LAT Data Analysis
2.1 Data Selection
We analyzed about 15 yr (from 2008 August 4 to 2023 May 24) of data toward CTA 1 in a 10∘ radius centered on PSR J0007+7303 (logged as 4FGL J0007.0+7303 in 4FGL-DR3; Abdollahi et al., 2022) with the available software Fermipy (Wood et al., 2017). The newest response functions P8R3SOURCEV3 and the Pass 8 events with “source” event class (evtype = 3 and evclass = 128) was selected, while the expression of “(DATAQUAL 0)(LATCONFIG==1)” was used to filter a good time interval. The maximum zenith angle was fixed to to limit contamination of -rays from the Earth’s limb. To search for potential -rays from the PWN, we chose an energy band of 50 GeV1 TeV to suppress the contamination of PSR J0007+7303.
The sources in the Data Release 3 of the fourth Fermi-LAT source catalog (4FGL-DR3; Abdollahi et al., 2022) were considered in the analysis. The isotropic -ray background emission (isoP8R3SOURCEV3v1) and the diffuse Galactic interstellar emission (glliemv07) were used to construct the background model. In the analysis that follows, the normalization and spectral parameters are free for the sources within in the background model. The normalization parameters of the isotropic and Galactic components are also left free.
2.2 Spatial Analysis
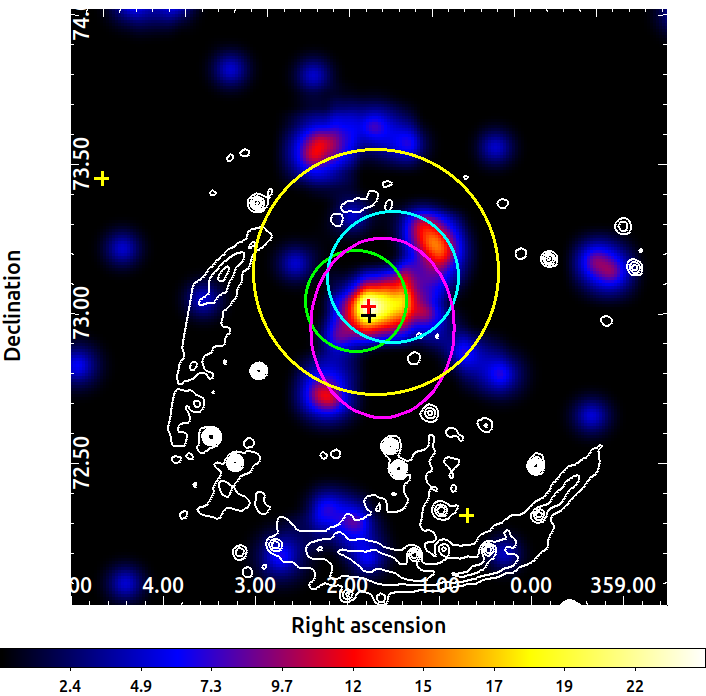
To investigate the possibility of detecting the radiation originating from PWN in CTA 1, we first generated a test statistic (TS) map centred on 4FGL J0007.0+7303 (R.A. = 1.∘768, Decl. = 73.∘051; Abdollahi et al., 2022). In order to minimize contamination from PSR J0007+7303, we set an energy threshold of 50 GeV. We performed a fitting procedure for the background sources and subtracted 4FGL J0007.0+7303 to create the excess TS map in the energy range of 50 GeV to 1 TeV. Here, 4FGL J0007.0+7303, which corresponds to PSR J0007+7303, is a point source listed in the 4FGL catalog with a PLSuperExpCutoff4 spectrum (Abdollahi et al., 2022).
In Figure 1, a significant excess of GeV -ray radiation is evident at the observed positions of the other detectors. Based on LHAASO’s observations (Cao et al., 2023), 1LHAASO J0007+7303u was detected by KM2A as an extended source located at R.A. = 1∘.91 and Decl. = 73∘.07 with 0∘.17 and by WCDA as a point source located at R.A. = 1∘.48 and Decl. = 73∘.15 with a 95% error radius of 0∘.22. The locations can be seen in Figure 1, denoted by cyan and green circles. Meanwhile, magenta ellipse of 0.∘30 0.∘24 indicates the VERITAS’s observation (Aliu et al., 2013). To determine the best morphological model describing the excess radiation, we utilized to calculate the best-fit location based on the initial position with the maximum TS value. The best-fit location for the excess radiation was R.A. = 1∘.76 and Decl. = 73∘.02, with a 1 error of 0∘.06, marked in Figure 1 as a black cross and labelled as SrcA for convenience.
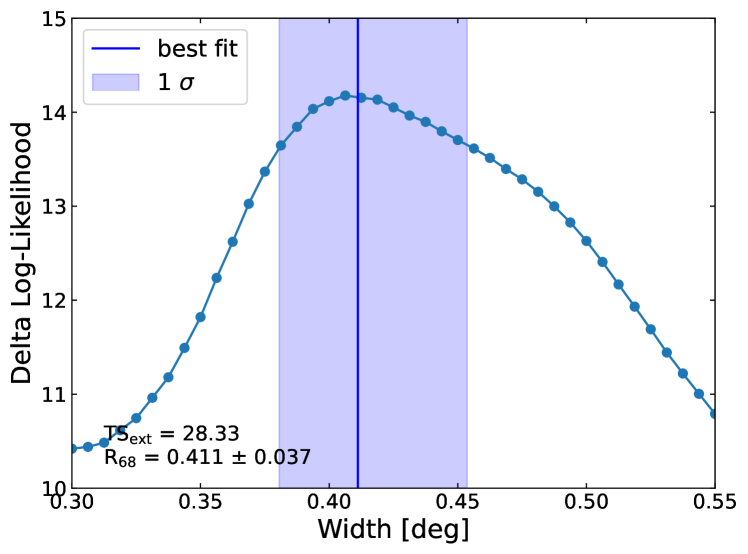
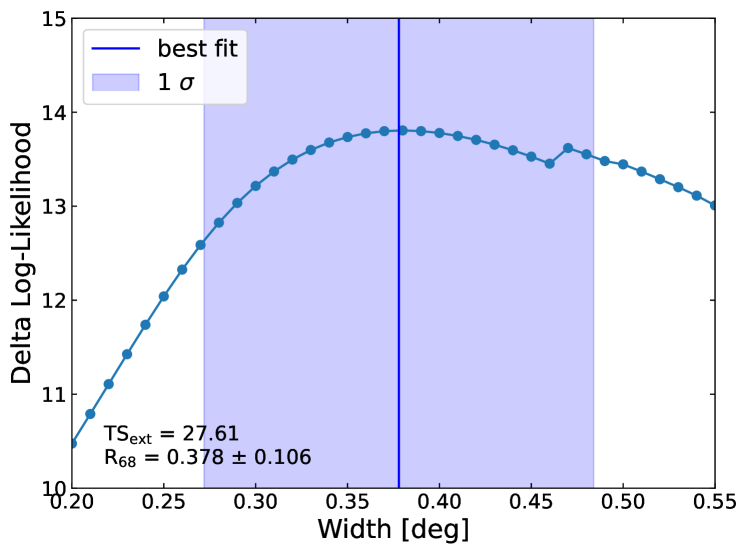
We first tested the power-law spectrum point-source model, with a spectral index of 2.0, at the best-fit position. Spatial extension models such as the uniform disk and the 2D Gaussian models were also applied to judge the best-fit model. We applied both models to the extension analysis of SrcA using the programme in (Wood et al., 2017). As a result, SrcA obtained a value of 27.61 in the 2D Gaussian template and 28.33 in the uniform disk template. Here, the value is defined as = 2 , where the and represent the maximum likelihood values of the extended and point-like model, respectively (Lande et al., 2012). Therefore, we will chose the extended model to describe SrcA as 16 (a significance level of 4 ).
We calculated the delta log-likelihood value, defined as , for various radii in order to determine the optimal extended model. The distribution of delta log-likelihood values for the various templates is shown in Figure 2. Comparing the two templates, we found that the disk template had a higher value and less uncertainty. As a result, we selected the disk template to analyze the excess -ray radiation in this region. Using the best-fit positions and extension of the different extended models, we performed a likelihood analysis again. During the fitting process, the spectrum type of power-law was used. The results of the fitting, which including the point-source model’s, are conveniently presented in Table 1.
2.3 Spectral Analysis
| Model | Position | Extension (∘) | Spectral Index | TS Value | |
|---|---|---|---|---|---|
| Point source | , | … | 2.06 0.78 | 27.60 | … |
| Uniform disk | , | 1.61 0.36 | 44.94 | 28.33 | |
| 2D Gaussian | , | 1.68 0.35 | 42.10 | 27.61 |
| E | Band | E2 dN/dE | TS Value | |
|---|---|---|---|---|
| (MeV) | (MeV) | (10-12 erg cm-2 s-1) | ||
| 82377 | 50000135721 | 1.38 0.50 | 17.68 | |
| 223606 | 135721368400 | 1.70 0.88 | 11.41 | |
| 606959 | 3684001000000 | 3.18 1.92 | 12.27 |
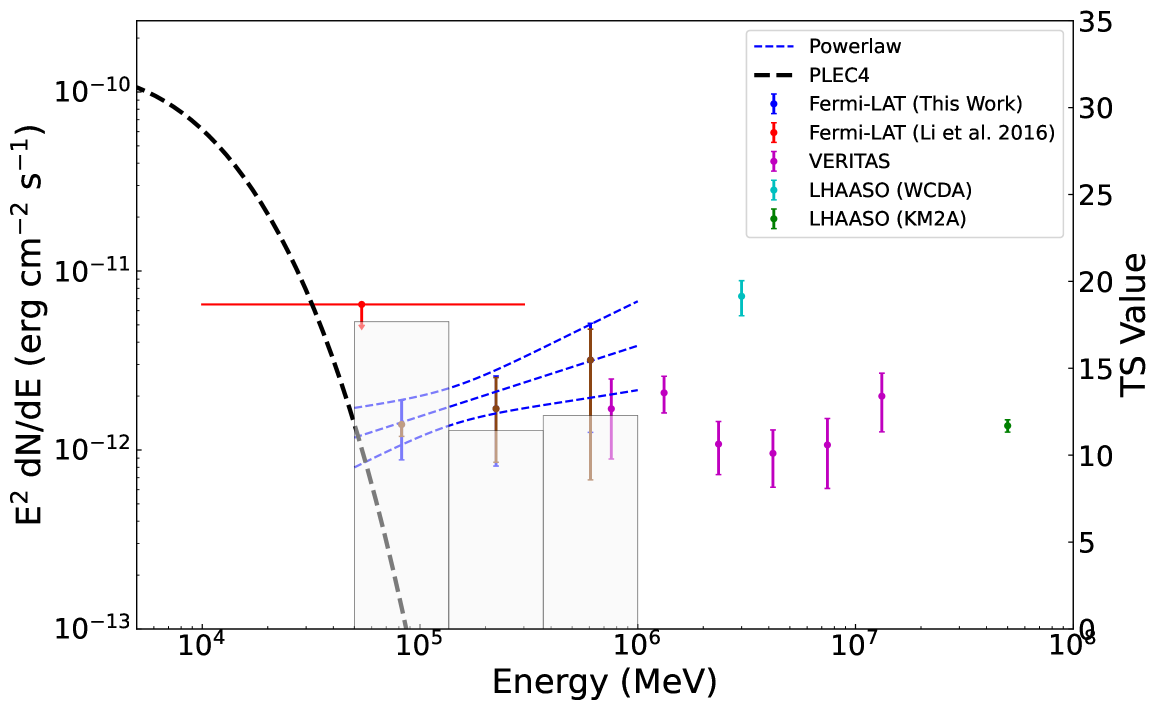
Acero et al. (2013) collected a large number of PWNe detected by Fermi-LAT and studied the correlations between different energy bands, establishing new constraints. Using 45 months of Fermi-LAT data, they derived an upper limit of 6.9 erg on the flux of CTA 1 between the 10316 GeV band. Li et al. (2016) performed a detailed analysis of the radiation properties of PSR J0007+7303 during the off-peak and the on-peak phase intervals. However, no point-like or extended -ray emission between 10 and 300 GeV was detected during the off-peak phase of PSR J0007+7303, resulting an upper limit of instead. According to The Third Fermi Large Area Telescope Catalog of Gamma-ray Pulsars (Smith et al., 2023), the spectral energy distribution (SED) of PSR J0007+7303 peaks at 2.44 0.03 GeV. We assumed that the contribution of pulsar to GeV flux can be described by a PLEC4 model (For details, see Abdollahi et al., 2022). As shown in Figure 3, the flux of the pulsar exponentially decays in the GeV band. When selecting the energy range from 50 GeV to 1 TeV, an extended source in the region overlapping observations from other telescopes exhibits GeV -ray emission with a hard spectral index of 1.61. This indicates that the high-energy radiation may originate from the PWN in CTA 1. This suggests that above 50 GeV, the pulsar no longer contributes significantly to the -ray emission. Therefore, to obtain higher photon statistics, the utilization of pulsar gating is unnecessary.
Based on the uniform disk model with an extension of = , we obtained a global fitted flux of (6.71 2.60) erg with a spectral index of 1.61 0.36 and a TS value of 44.94 calculated by the likelihood analysis in the energy range of 50 GeV1 TeV. We divided the data from 50 GeV to 1 TeV band into 3 logarithmically equal energy bins and performed the same likelihood analysis for each bin. The results are displayed as blue dots in Figure 3, with specific values listed in Table 2. In the Fermi High-Latitude Extended Sources Catalog (Ackermann et al., 2018), a significantly extended ( 0.∘98) -ray source (FHES J0006.7+7314) was reported, which is thought to be associated with the CTA 1. However, there was a mismatch in flux normalization observed between the two spectra. In our work, the derived flux does not exceed the upper limit defined in previous work (Acero et al., 2013; Li et al., 2016). The obtained hard spectral index value of 1.61 agrees with the typical hard spectral index observed in PWNe by Fermi-LAT (Acero et al., 2013). Furthermore, as shown in Figure 4, the GeV SED could smoothly connect to the TeV one.
2.4 Systematic Uncertainties Analysis
The systematic errors in the Fermi-LAT data are considered from two main origins: imperfect modelling of the Galactic diffuse emission and uncertainties regarding the calibration of the effective area. For the first aspect, we estimated the systematic error by repeated analyses using the Galactic diffuse model with artificially altered normalization of (Abdo et al., 2010, 2013), and for the second aspect, we used the bracketing Aeff method111https://fermi.gsfc.nasa.gov/ssc/data/analysis/scitools/Aeff_Systematics.html (Ackermann et al., 2012). The specific systematic error values we listed in Table 2.
3 Discussion

| Parameters | |
| Age (tage,kyr) | 10 |
| Initial spin-down luminosity (,) | |
| Current spin-down luminosity (,) | |
| Initial spin-down timescale (,yr) | 3900 |
| Particle index () | 1.8 |
| Particle index () | 2.0 |
| Break Lorentz factor () | 8 104 |
| Magnetic energy ratio () | 0.4 |
| Magnetic field strength (B,G) | 3.25 |
The hadronic origin of VER J0006+729 has been extensively investigated. According to the findings of Martín et al. (2016), the mass of the molecular clouds is insufficient to explain the observed TeV emission. Additionally, Aliu et al. (2013) found that the much smaller extent of VER J0006+729 compared to the supernova remnant (SNR) contradicts the SNR shell hypothesis. Therefore, we favour the leptonic PWN origin scenario for VER J0006+729.
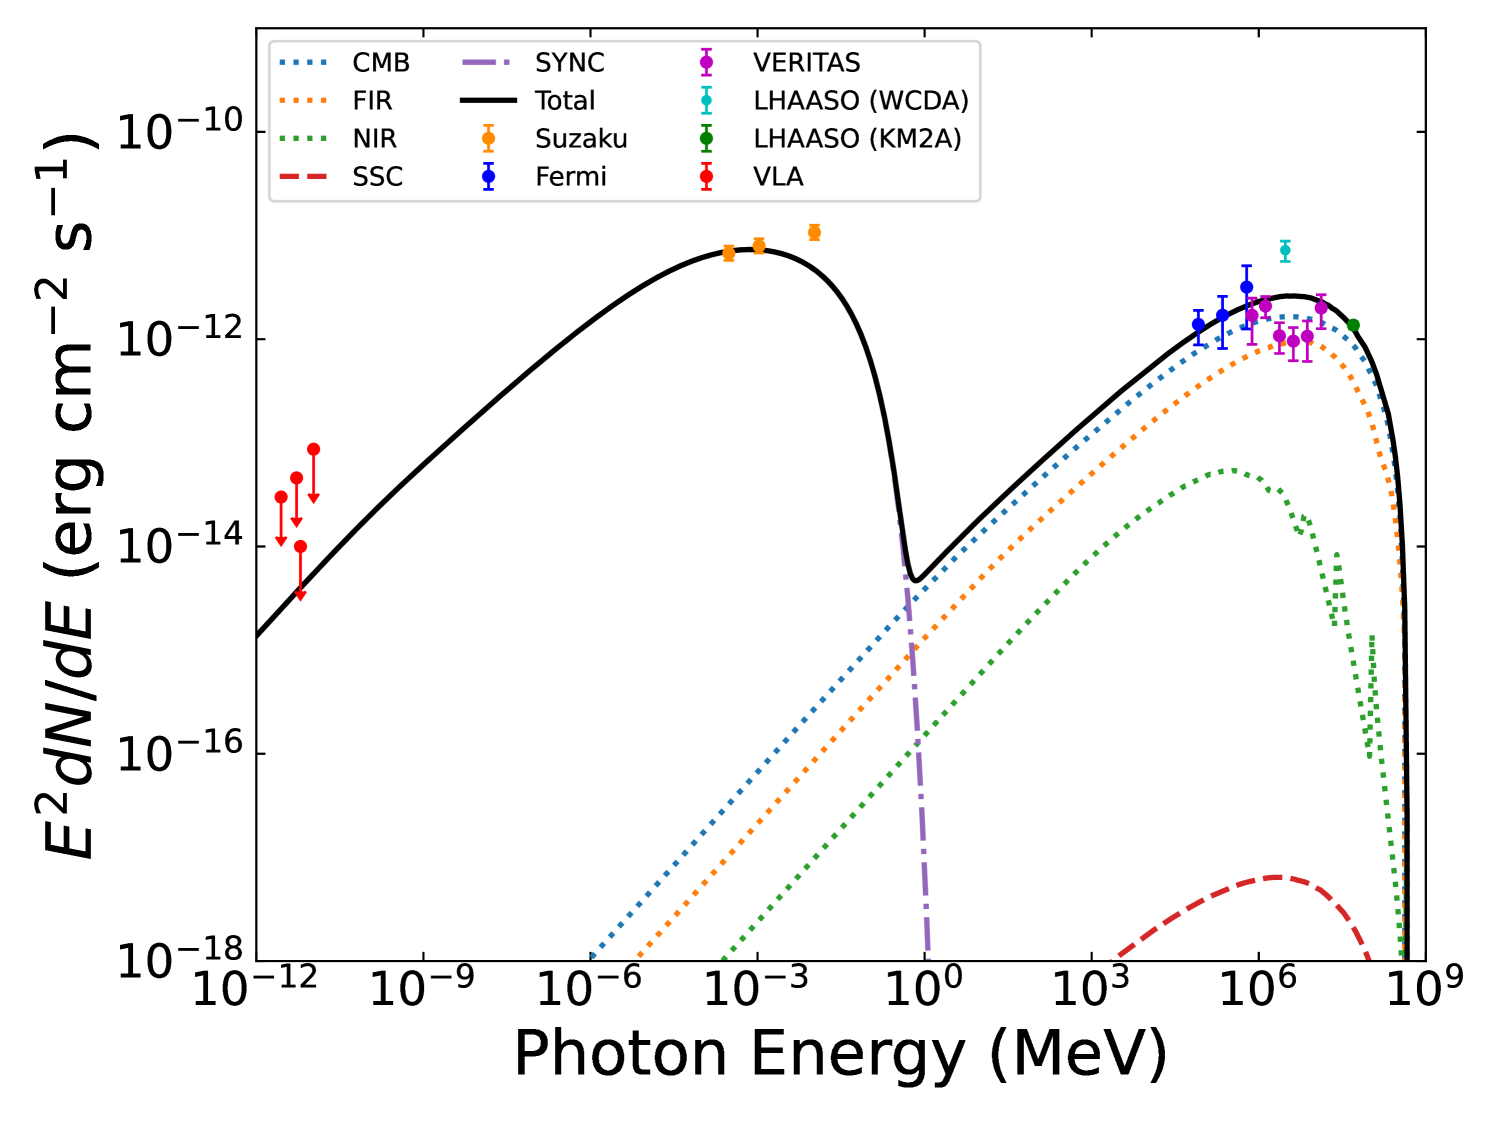
The SED of PWNe exhibit a bimodal structure, with the low-energy component generated through synchrotron from radio to X-ray band, while the high-energy component in the -ray band is produced by inverse Compton scattering off the soft photon field. Aliu et al. (2013) used the 1.4 GHz image from Pineault et al. (1997) to estimate the radio flux within a 20 arcmin radius around the pulsar, and here we adopt this flux as an upper limit for the radio emission. Giacani et al. (2013) also presented new high angular resolution and high sensitivity radio observations toward PSR J0007+7303 at 1.5 GHz with the Jansky Very Large Array, and set an upper limit considering a size for the nebula of 20 arcmin in radius. In the X-ray band, Lin et al. (2012) detected a 10 arcmin extended feature with that may correspond to the bow shock of the nebula. In the TeV -ray band, the TeV source VER J0006+729 associated with CTA 1 was detected by (Aliu et al., 2013), which has a photon spectrum described by a power-law spectrum with a differential spectral index of and the normalization . CTA 1 is also thought to be associated with a UHE source 1LHAASO J0007+7303u catalogued in the first LHAASO catalog (Cao et al., 2023), with a flux of detected by WCDA at 3 TeV and a flux of detected by KM2A at 50 TeV. The aforementioned observational data, as well as the Fermi-LAT data analyzed in this work, are plotted in Fig. 4.
We considerd a time-dependent one-zone model for the radiative evolution of a PWN (For details, see Torres et al., 2014; H. E. S. S. Collaboration et al., 2018). The spin-down power of an energetic pulsar is continuously transferred to high-energy particles and magnetic field in the PWN, and the spin-down power L(t) evolves in time as (Gaensler & Slane, 2006)
| (1) |
where is the initial luminosity, the breaking index n is assumed to be 3.0 here. And the initial spin-down time-scale of the pulsar is (Gaensler & Slane, 2006)
| (2) |
where is the characteristic age can be derived from the period and the period derivative.
The particle distribution follows the equilibrium equation (e.g. Martín et al., 2012)
| (3) |
We assumed that the injection rate of particles follow a broken power-law distribution, i.e.,
| (4) |
in which is the break Lorentz factor, and and are the spectral indices.
The expansion behaviour of the PWN in the SNR environment is determined by the age of the system t, the initial spin-down time-scale , and the reverse-shock interaction time , which as follows (Mayer et al., 2012; H. E. S. S. Collaboration et al., 2018):
| (5) |
The magnetic field strength evolves with time can be calculated by (Tanaka & Takahara, 2010; Martín et al., 2012)
| (6) |
The young pulsar PSR J0007+7303 in CTA 1 has a period of 316 ms, a spin-down power of and a characteristic age of = 13 kyr (Abdo et al., 2012), which is energetic to power the nebula (Slane et al., 2004). We adopt a distance of 1.4 kpc in this paper (Pineault et al., 1993). The interstellar radiation field including CMB, the near-infrared (NIR) background with = 25.0 K and = 0.3 eV cm-3 and far-infrared (FIR) background with = 3000 K and = 0.6 eV cm-3 were calculated using GALPROP code (Porter et al., 2006) by Zhu et al. (2018). We assumed that the nebula has an age of 10 kyr, and that the corresponding and are 3900 yr and . For the particle spectrum, we assumed a broken power-law with = 1.8, = 2.0 and = 8 104, and the resulting SED at tage is shown in Fig. 4. With the magnetic energy ratio = 0.4, the magnetic field strength in the nebula is 3.25 G.
As the PWNe evolve continuously inside the SNR, the expansion of the PWNe results in a gradual decrease in magnetic field strength (Torres et al., 2014). In the model proposed by Gelfand et al. (2009), as the PWNe evolve to about 10 kyr, the magnetic field strength decreases to a few G. In this work, we obtained a relatively low magnetic field strength of 3.25 G. Similar low values have also been adopted for several PWNe, such as HESS J1826130 (Burgess et al., 2022), LHAASO J1908+0621 (De Sarkar & Gupta, 2022; Li et al., 2021; Crestan et al., 2021), LHAASO J2226+6057 (Joshi et al., 2023; De Sarkar et al., 2022), and HESS J1303631 (H. E. S. S. Collaboration et al., 2012).
As shown in Fig. 4, with these reasonable parameters, the observed SED can be well reproduced. In addition, we present in Fig. 5 the evolution of the SED at different ages from 1 to 14 kyr, which is able to fit the observation data points well when the nebula age is 10 kyr. Finally, the fitting parameters we used for the model are summarized in Table 3.
It is well known that PWNe are a prominent population of TeV sources in the Milky Way 222http://tevcat.uchicago.edu/ as observed by various instruments in recent years (Park & VERITAS Collaboration, 2015; H. E. S. S. Collaboration et al., 2018; Albert et al., 2020). In particular, the detection of photons with energies up to 1 PeV from the Crab Nebula implies the presence of PeV electron accelerators (Pevatrons) (Lhaaso Collaboration et al., 2021). Observations from LHAASO have revealed numerous hundred TeV sources in the Milky Way (Cao et al., 2021, 2023), a significant fraction of which can be attributed to PWNe (Wu et al., 2023; Tian et al., 2023; Xia et al., 2023) and are plausible candidates for PeVatrons (de Oña Wilhelmi et al., 2022). The detection of UHE -rays from CTA 1, suggests its potential as a PeVatron. Future observations in the UHE band can provide further insights into the energy distribution of particles within CTA 1.
4 Summary
In this paper, we analyzed the GeV -ray emission toward CTA 1 using about 15 yr of Fermi-LAT data. Under the hypothesis of a uniform disk model with an extension of = , we obtained a global flux of (6.71 2.60) erg with a spectral index of 1.61 0.36 and a TS value of 44.94 in the 50 GeV1 TeV energy band. The GeV emission could potentially be from the PWN in the CTA 1, wherein the source is powered by PSR J0007+7303 and emits -rays through inverse Compton scattering. The SED could be reasonably reproduced by a time-dependent one-zone model with a broken power-law spectrum. CTA 1 has also been detected by and LHAASO instruments. The UHE -ray emission detected by LHAASO implies the potential for particle acceleration to the PeV range. Further in-depth observations and analyses are needed to clarify the maximum energy of the particles in the PWN.
Acknowledgements
We thank the public data provided by Fermi-LAT. This research is supported by NSFC through Grants 12063004 and 12393852, as well as grants from the Yunnan Provincial Government (YNWR-QNBJ-2018-049), Yunnan Fundamental Research Projects (grant No. 202201BF070001-020), and the Program of Yunnan University (KC-22221102).
DATA AVAILABILITY
The data produced in this paper will be shared on reasonable request to the corresponding author.
References
- Abdo et al. (2008) Abdo A. A., et al., 2008, Science, 322, 1218
- Abdo et al. (2010) Abdo A. A., et al., 2010, ApJ, 722, 1303
- Abdo et al. (2012) Abdo A. A., et al., 2012, ApJ, 744, 146
- Abdo et al. (2013) Abdo A. A., et al., 2013, ApJS, 208, 17
- Abdollahi et al. (2022) Abdollahi S., et al., 2022, ApJS, 260, 53
- Acero et al. (2013) Acero F., et al., 2013, ApJ, 773, 77
- Ackermann et al. (2012) Ackermann M., et al., 2012, ApJS, 203, 4
- Ackermann et al. (2018) Ackermann M., et al., 2018, ApJS, 237, 32
- Albert et al. (2020) Albert A., et al., 2020, ApJ, 905, 76
- Aliu et al. (2013) Aliu E., et al., 2013, ApJ, 764, 38
- Brazier et al. (1998) Brazier K. T. S., Reimer O., Kanbach G., Carraminana A., 1998, MNRAS, 295, 819
- Burgess et al. (2022) Burgess D. A., et al., 2022, ApJ, 930, 148
- Cao et al. (2019) Cao Z., et al., 2019, arXiv e-prints, p. arXiv:1905.02773
- Cao et al. (2021) Cao Z., et al., 2021, Nature, 594, 33
- Cao et al. (2023) Cao Z., et al., 2023, arXiv e-prints, p. arXiv:2305.17030
- Caraveo et al. (2010) Caraveo P. A., De Luca A., Marelli M., Bignami G. F., Ray P. S., Saz Parkinson P. M., Kanbach G., 2010, ApJ, 725, L6
- Crestan et al. (2021) Crestan S., Giuliani A., Mereghetti S., Sidoli L., Pintore F., La Palombara N., 2021, MNRAS, 505, 2309
- De Sarkar & Gupta (2022) De Sarkar A., Gupta N., 2022, ApJ, 934, 118
- De Sarkar et al. (2022) De Sarkar A., Zhang W., Martín J., Torres D. F., Li J., Hou X., 2022, A&A, 668, A23
- Gaensler & Slane (2006) Gaensler B. M., Slane P. O., 2006, ARA&A, 44, 17
- Gelfand et al. (2009) Gelfand J. D., Slane P. O., Zhang W., 2009, ApJ, 703, 2051
- Giacani et al. (2013) Giacani E., Rovero A. C., Cillis A., Pichel A., Dubner G., 2013, in International Cosmic Ray Conference. p. 2656
- H. E. S. S. Collaboration et al. (2012) H. E. S. S. Collaboration et al., 2012, A&A, 548, A46
- H. E. S. S. Collaboration et al. (2018) H. E. S. S. Collaboration et al., 2018, A&A, 612, A2
- Halpern et al. (2004) Halpern J. P., Gotthelf E. V., Camilo F., Helfand D. J., Ransom S. M., 2004, ApJ, 612, 398
- Harris & Roberts (1960) Harris D. E., Roberts J. A., 1960, PASP, 72, 237
- Joshi et al. (2023) Joshi J. C., Tanaka S. J., Miranda L. S., Razzaque S., 2023, MNRAS, 520, 5858
- Lande et al. (2012) Lande J., et al., 2012, ApJ, 756, 5
- Lhaaso Collaboration et al. (2021) Lhaaso Collaboration et al., 2021, Science, 373, 425
- Li et al. (2016) Li J., Torres D. F., de Oña Wilhelmi E., Rea N., Martin J., 2016, ApJ, 831, 19
- Li et al. (2021) Li J., et al., 2021, ApJ, 913, L33
- Lin et al. (2010) Lin L. C. C., Huang R. H. H., Takata J., Hwang C. Y., Kong A. K. H., Hui C. Y., 2010, ApJ, 725, L1
- Lin et al. (2012) Lin L. C. C., et al., 2012, MNRAS, 426, 2283
- Martín et al. (2012) Martín J., Torres D. F., Rea N., 2012, MNRAS, 427, 415
- Martín et al. (2016) Martín J., Torres D. F., Pedaletti G., 2016, MNRAS, 459, 3868
- Mattox et al. (1996) Mattox J. R., Koh D. T., Lamb R. C., Macomb D. J., Prince T. A., Ray P. S., 1996, A&AS, 120, 95
- Mayer et al. (2012) Mayer M., Brucker J., Holler M., Jung I., Valerius K., Stegmann C., 2012, arXiv e-prints, p. arXiv:1202.1455
- Mignani et al. (2013) Mignani R. P., de Luca A., Rea N., Shearer A., Collins S., Torres D. F., Hadasch D., Caliandro A., 2013, MNRAS, 430, 1354
- Park & VERITAS Collaboration (2015) Park N., VERITAS Collaboration 2015, in 34th International Cosmic Ray Conference (ICRC2015). p. 771 (arXiv:1508.07070), doi:10.22323/1.236.0771
- Pineault et al. (1993) Pineault S., Landecker T. L., Madore B., Gaumont-Guay S., 1993, AJ, 105, 1060
- Pineault et al. (1997) Pineault S., Landecker T. L., Swerdlyk C. M., Reich W., 1997, A&A, 324, 1152
- Porter et al. (2006) Porter T. A., Moskalenko I. V., Strong A. W., 2006, ApJ, 648, L29
- Seward et al. (1995) Seward F. D., Schmidt B., Slane P., 1995, ApJ, 453, 284
- Slane et al. (1997) Slane P., Seward F. D., Bandiera R., Torii K., Tsunemi H., 1997, ApJ, 485, 221
- Slane et al. (2004) Slane P., Zimmerman E. R., Hughes J. P., Seward F. D., Gaensler B. M., Clarke M. J., 2004, ApJ, 601, 1045
- Smith et al. (2023) Smith D. A., et al., 2023, arXiv e-prints, p. arXiv:2307.11132
- Tanaka & Takahara (2010) Tanaka S. J., Takahara F., 2010, ApJ, 715, 1248
- Tian et al. (2023) Tian S., Zhou L., Gong Y., Wu K., Fang J., Yu H., 2023, PASP, 135, 074503
- Torres et al. (2014) Torres D. F., Cillis A., Martín J., de Oña Wilhelmi E., 2014, Journal of High Energy Astrophysics, 1, 31
- Wood et al. (2017) Wood M., Caputo R., Charles E., Di Mauro M., Magill J., Perkins J. S., Fermi-LAT Collaboration 2017, in 35th International Cosmic Ray Conference (ICRC2017). p. 824 (arXiv:1707.09551), doi:10.22323/1.301.0824
- Wu et al. (2023) Wu K., Zhou L., Gong Y., Fang J., 2023, MNRAS, 519, 1881
- Xia et al. (2023) Xia Q., Zhou L.-C., Fang J., 2023, Research in Astronomy and Astrophysics, 23, 105003
- Zhu et al. (2018) Zhu B.-T., Zhang L., Fang J., 2018, A&A, 609, A110
- de Oña Wilhelmi et al. (2022) de Oña Wilhelmi E., López-Coto R., Amato E., Aharonian F., 2022, ApJ, 930, L2