Large Language Models on Fine-grained Emotion Detection Dataset with Data Augmentation and Transfer Learning
Abstract
This paper delves into enhancing the classification performance on the GoEmotions dataset, a large, manually annotated dataset for emotion detection in text. The primary goal of this paper is to address the challenges of detecting subtle emotions in text, a complex issue in Natural Language Processing (NLP) with significant practical applications. The findings offer valuable insights into addressing the challenges of emotion detection in text and suggest directions for future research, including the potential for a survey paper that synthesizes methods and performances across various datasets in this domain.
1 Problem Description
Recently Large Language Models have gain enormous attention in the field of Natural Language Processing. The task of detecting subtle emotions in text is a complex issue in Natural Language Processing with numerous practical uses. A major hurdle is the lack of sufficiently large and annotated datasets for emotion detection. Demszky Demszky et al. (2020) created the GoEmotions dataset, which is the largest manually annotated dataset containing 58k English Reddit comments, labeled for 27 emotion categories and Neutral. The researchers also fine-tuned a BERT model on GoEmotions as a strong baseline in transfer learning across domains and taxonomies to show the potentials of this dataset.
In the initial experiments, our team dived deep into the original paper and reproduced the results of both fine-tuning BERT model on GoEmotions dataset and applying transfer learning technique using fine-tuned BERT to other emotion classification dataset with different taxonomies. We were able to achieve 0.49 macro-average F1 score on the 28-label classification task, which was slightly improved over the best result 0.46 reported in the original paper Demszky et al. (2020). However, we believe that there is still much room for improvement in term of classification performance on GoEmotions dataset. Therefore, our main objective in this study is to utilize different methods to enhance the classification performance on the fine-grained emotion detection dataset, GoEmotions, as much as possible.
2 Related Work
Our study builds upon the foundation laid by GoEmotions Demszky et al. (2020), a pioneering framework in emotion classification within textual content. GoEmotions excels in its comprehensive categorization, identifying expressions across 28 distinct emotional categories (27 emotions plus a neutral category). This framework is instrumental in enhancing sentiment analysis and interpreting a broad spectrum of human emotions, particularly in the context of concise social media posts.
In parallel, we draw insights from SODA (SOcial DiAlogues) Kim et al. (2023), a unique dataset in the realm of social dialogue systems. SODA synthesizes 1.5 million dialogues, integrating socially-grounded conversations from a pre-trained language model with contextual knowledge from the Atomic10x knowledge graph West et al. (2022). This integration addresses key challenges in dialogue agent training, namely diversity, scale, and quality, thereby surpassing traditional human-authored corpora in terms of consistency, specificity, and naturalness. SODA’s contributions are pivotal in developing dialogue agents that are more authentic and coherent.
Additionally, our work touches upon the critical concept of predictive uncertainty in Large Language Models (LLMs) Jing et al. (2024); Su et al. (2024). This uncertainty bifurcates into aleatoric uncertainty, rooted in inherent randomness in data, and epistemic uncertainty, originating from incomplete data knowledge. Recent scholarly efforts have been directed towards addressing these uncertainties in deep neural models, highlighting their significance in enhancing model reliability.
A notable development in this domain is presented in Li et al. (2023), which introduces the CUE (Contextual Uncertainty Elimination) framework. This innovative approach leverages a Variational Auto-encoder to modify latent text representations, thereby elucidating the sources of predictive uncertainty in LLM classifiers. CUE extends beyond mere identification of influential input tokens; it recalibrates text representations to provide a novel lens for interpreting uncertainty in LLM-based text classifiers. This advancement is pivotal in our understanding of LLM behavior, particularly in enhancing model transparency and developing effective strategies for uncertainty mitigation.
Our research is situated at the intersection of these significant developments, aiming to further the understanding and application of emotion classification in LLMs, while addressing the challenges and uncertainties inherent in these sophisticated models.
3 Limitations and Hypotheses
As previously mentioned, the GoEmotions dataset contains 58k Reddit comments, which are classified into 27 emotion categories plus neutral. During the annotation process, there are three annotators labeling the same data points and multiple labels for a data points are allowed. Although the creation of the dataset seems sound, this fine-grained emotion classification dataset still has limitations.
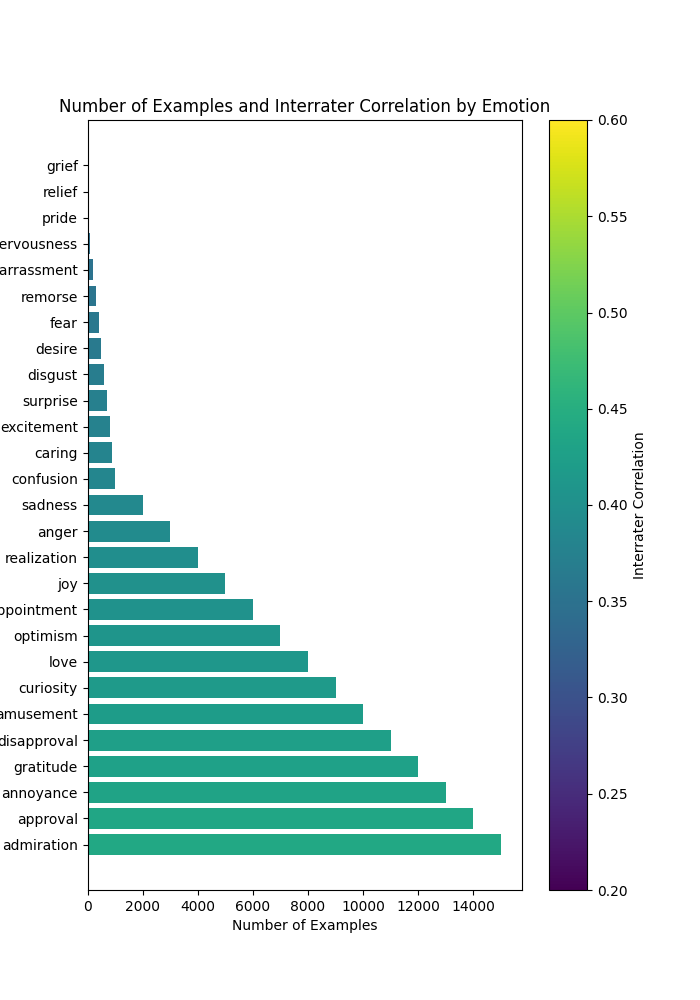
Firstly, the emotion categories in GoEmotions dataset have uneven distributions in nature. As shown in Figure 1, some emotion categories such as "admiration", "approval", and "annoyance" have more than 10k examples in the dataset, while some minority classes such as "pride", "relief", and "grief" only have less than 1k examples. As a result, there will be an approximately 10 times difference in training data sample size between some majority classes and minority classes, causing a nonnegligible difference on single category classification performance. For instance, Demszky and his team fine-tuned a BERT model on GoEmotions dataset and the "grief" category which has the least sample size in training set achieved all zeros across different evaluation metrics Demszky et al. (2020).
The second limitation of GoEmotions is that the dataset contains biases and is not representative of global diversity. Since the annotation process is all done by Indian English speakers and all data points come from English Reddit community, potential biases could be introduced during the data collecting and annotation process. To improve on this and remove biases, we may consider using annotators with more representative background and collecting data from multiple resources. These improvement methods are valuable for future work but may be out of this project’s scope.
Therefore, inspired by the first limitation of the dataset and several common practices we learned in class, our team has come up with three hypotheses to further improve the classification performance on GoEmotions dataset:
-
1.
State-of-the-art model like RoBERTa could outperform BERT on the GoEmotions dataset
-
2.
Data augmentation methods applied on GoEmotions dataset could improve the classification performance
-
3.
Transfer learning on a dataset with similar domain and different taxonomy could further improve the classification performance on GoEmotions dataset
Based on the aforementioned hypotheses, we designed three sets of experiments to validate our hypotheses which are briefly listed below and discussed in detail in section 4:
-
1.
fine-tune RoBERTa model on GoEmotions dataset and compare the performance with BERT benchmark
-
2.
apply three data augmentation techniques on original training dataset before fine-tuning RoBERTa, comparing the variance in performance
-
3.
fine-tune RoBERTa on CARER dataset Saravia et al. (2018) first and then fine-tune the trained model on augmented GoEmotions training dataset, comparing the variance in performance
4 Experiments and Results
4.1 Fine-tuning BERT on GoEmotions
The first set of experiments in the original GoEmotions paper Demszky et al. (2020) is to fine-tune a pre-trained bert-base-cased model on the GoEmotions dataset with three different taxonomy hierarchies. The first hierarchy we called it the original taxonomy, which contains 27 emotion labels and a neutral label. The second hierarchy is called the grouped taxonomy. The grouped taxonomy is generated by applying a hierarchical clustering on the original 27 labels using correlation as a distance metric, resulting in 3 categories and a neutral category. The last hierarchy is called the Ekman’s taxonomy Ekman (1992), which maps the original 27 emotion labels into 6 groups with a neutral group.
Therefore, 3 taxonomies correspond to 3 different multi-label emotion classification problem. As described in the original paper, we fine-tune a bert-base-cased model on the GoEmotions dataset three times, one for each taxonomy. The model structure will be different only in the last linear layer to fit the number of classes to predict. We keep the exactly same hyperparameter configuration as the original paper: batch_size of 16, learning_rate of 5e-5 and no learning rate scheduler. We use the AdamW optimizer Loshchilov and Hutter (2017) and cross-entropy as the loss function.
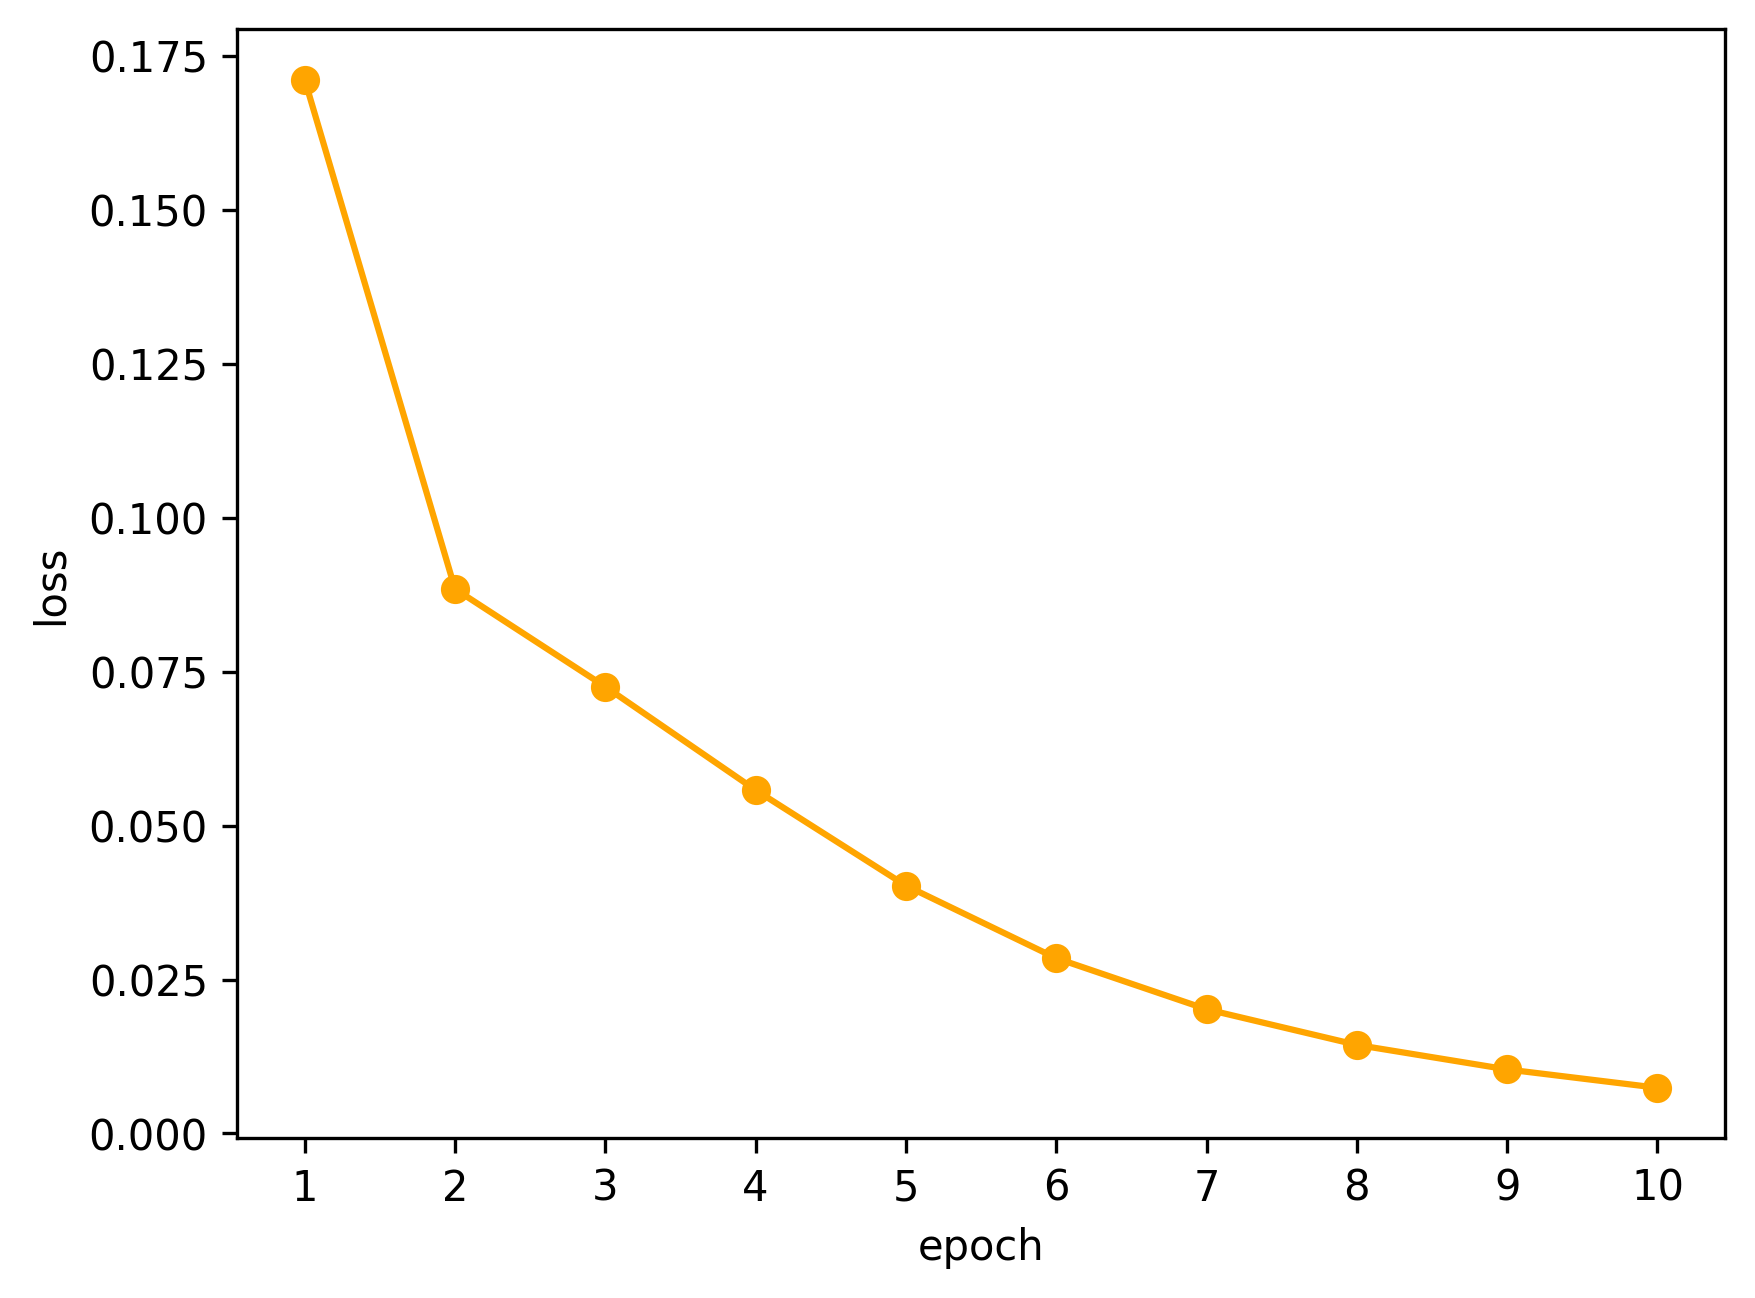
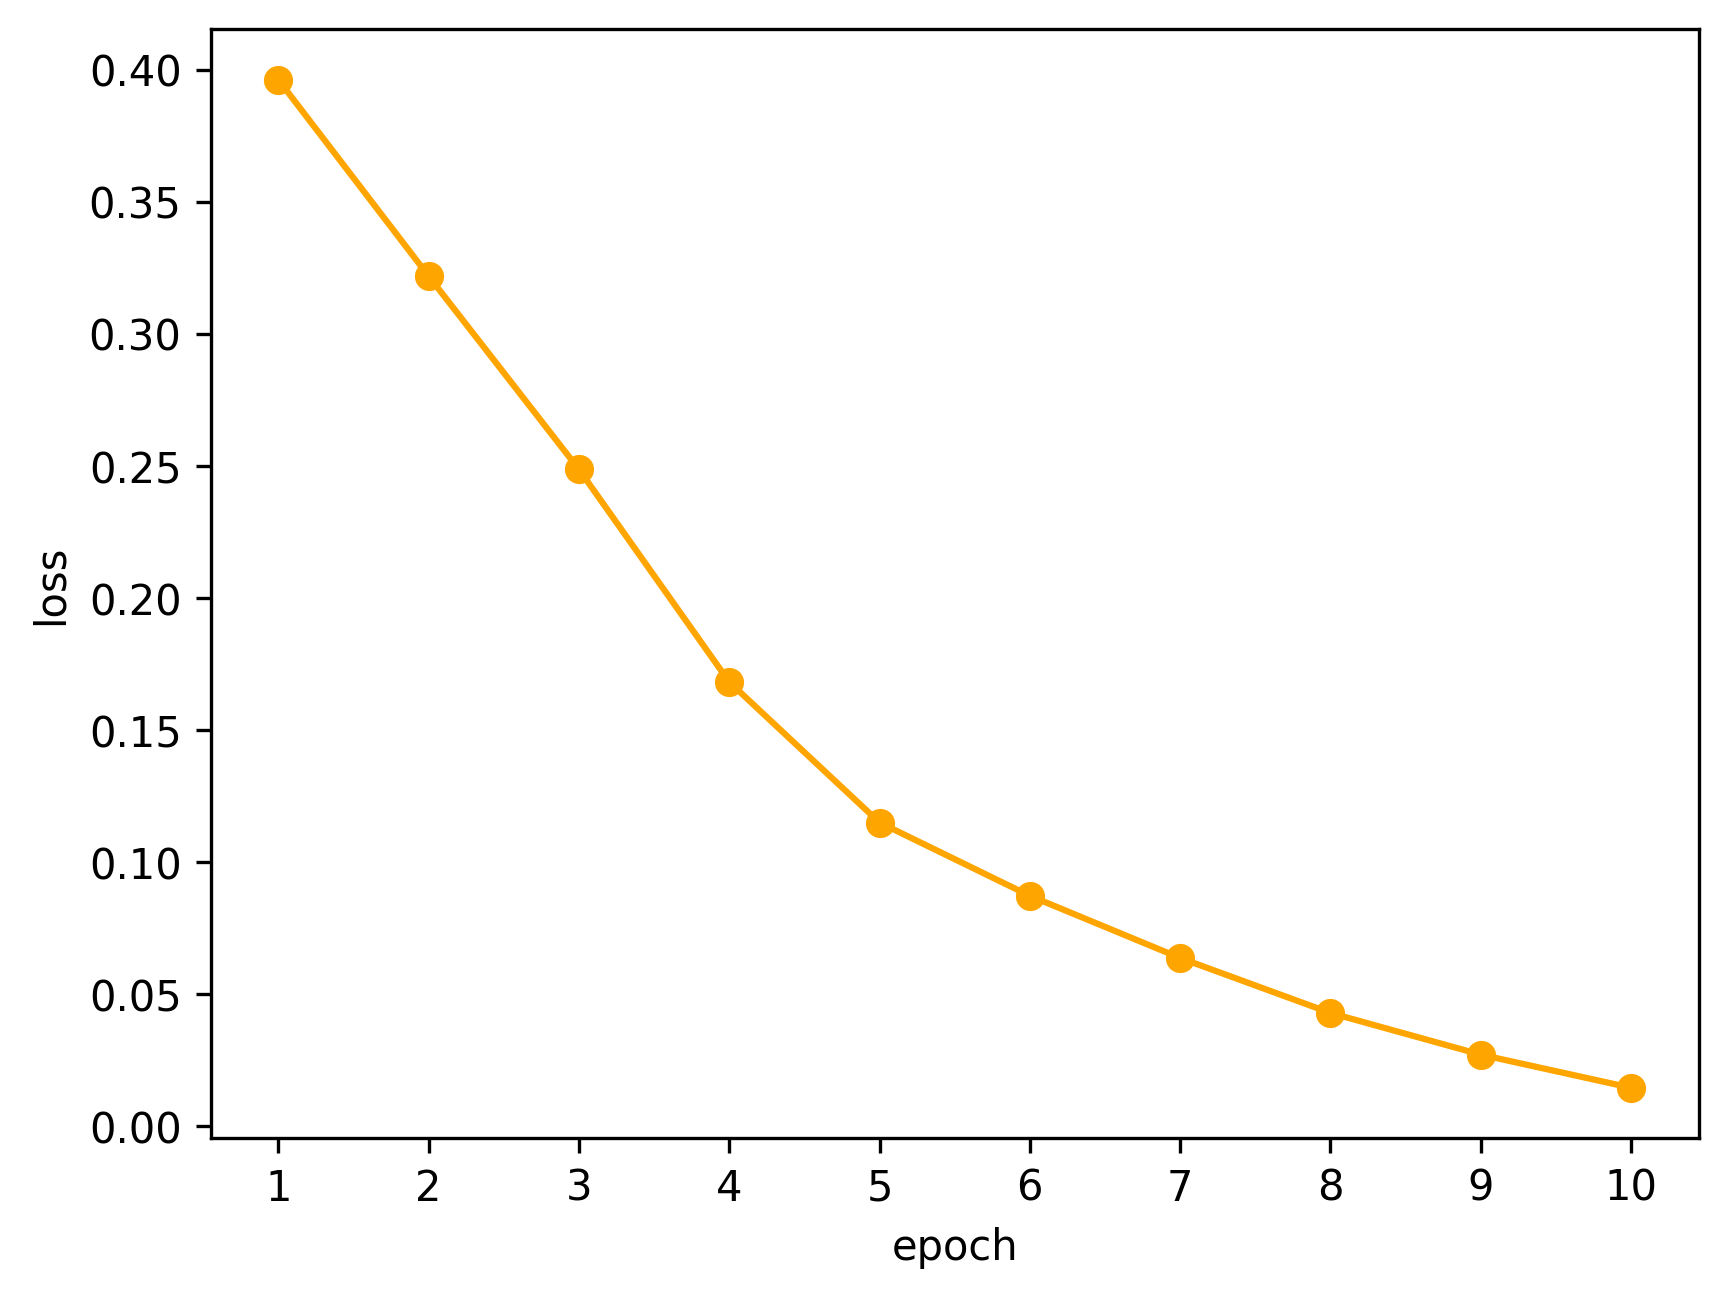
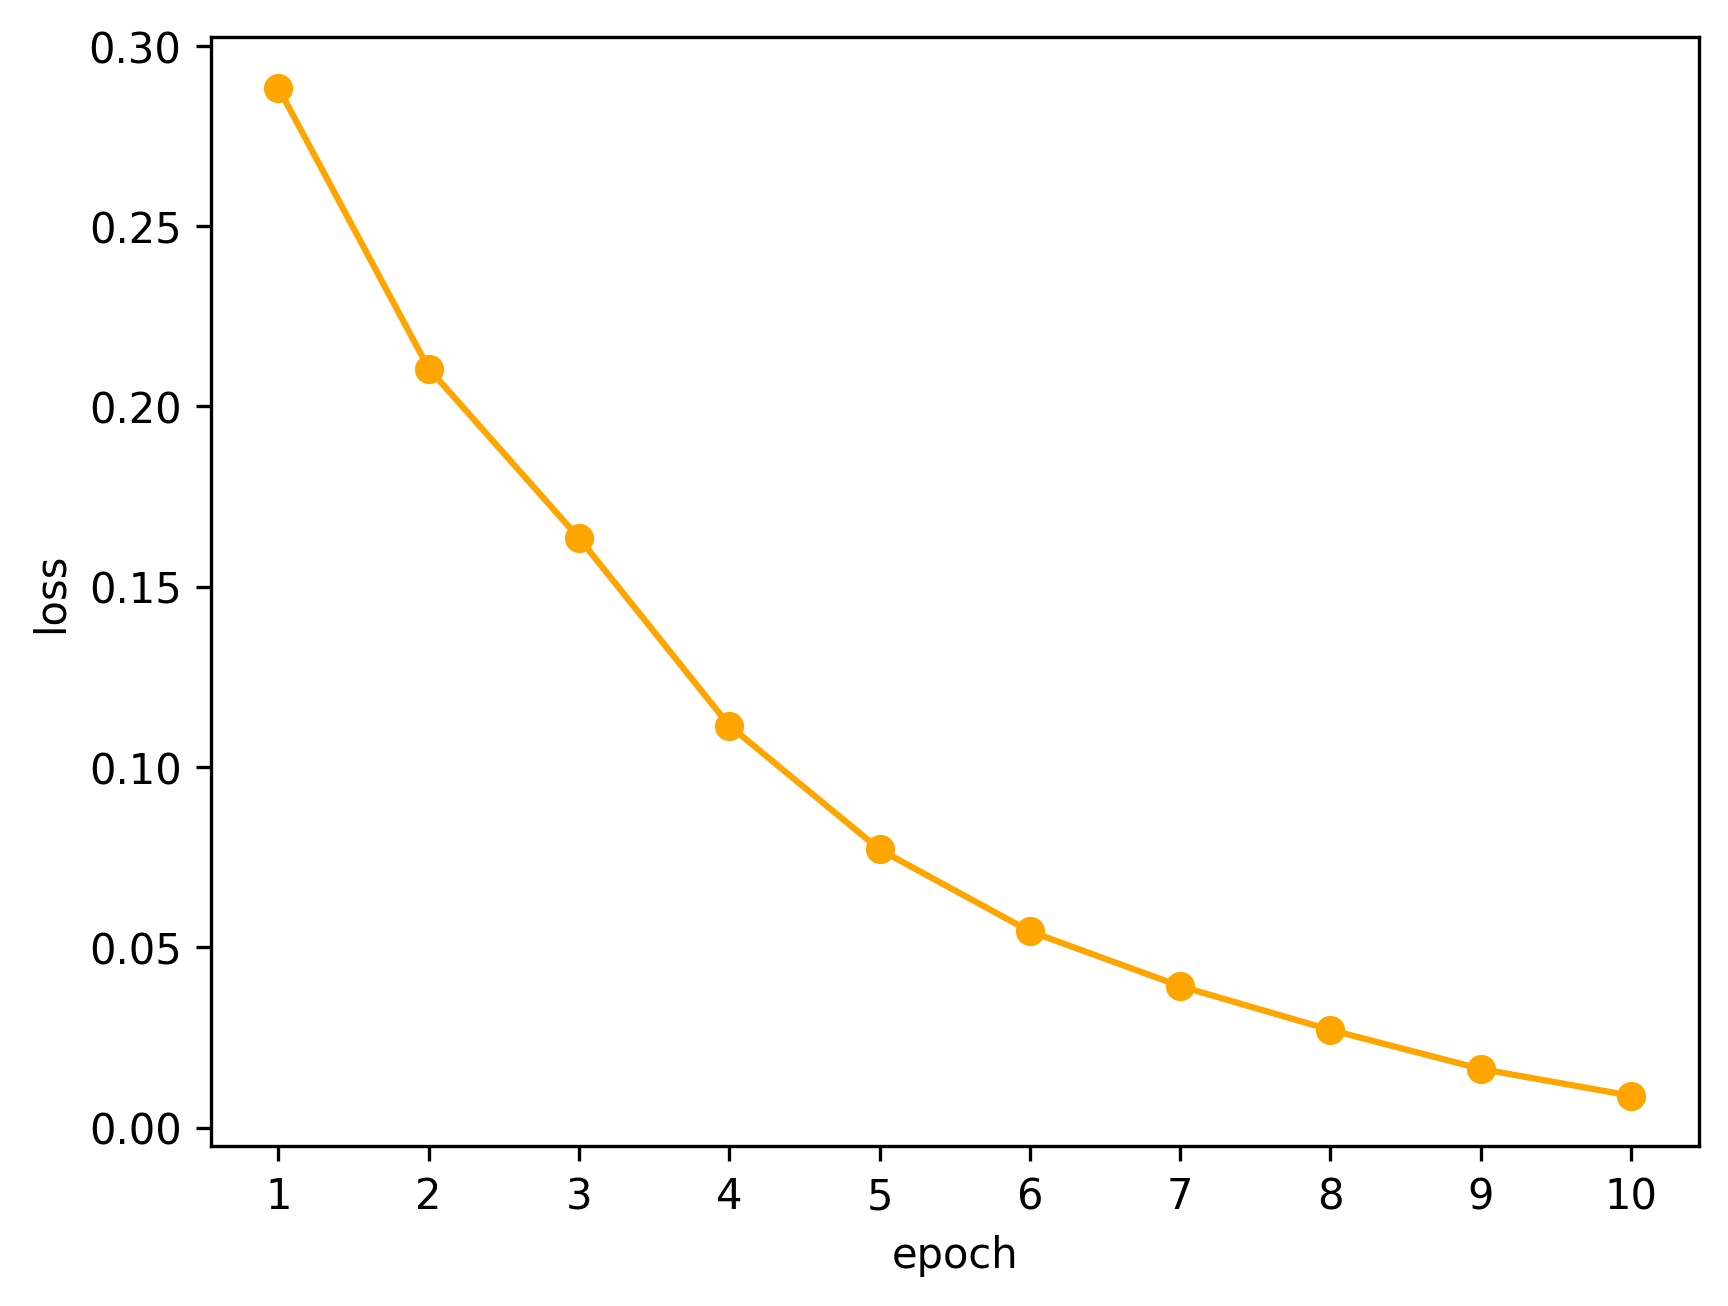
We trained 10 epochs for each classification task, and selected the best model using the macro-F1 score on the dev dataset. For the original, group, and Ekman’s taxonomy, the best dev macro-F1 are achieved at the , , and epoch respectively. Finally, we evaluated the performances of our best models on the test set. The detailed results on 3 taxonomies can be found in Table 1, Table 2, and Table 5.
| Emotion | Precision | Recall | F1 |
|---|---|---|---|
| admiration | 0.62 | 0.73 | 0.67 |
| amusement | 0.72 | 0.88 | 0.79 |
| anger | 0.47 | 0.48 | 0.48 |
| annoyance | 0.31 | 0.40 | 0.35 |
| approval | 0.33 | 0.41 | 0.36 |
| caring | 0.39 | 0.45 | 0.42 |
| confusion | 0.39 | 0.48 | 0.43 |
| curiosity | 0.44 | 0.53 | 0.48 |
| desire | 0.50 | 0.41 | 0.45 |
| disappointment | 0.31 | 0.27 | 0.29 |
| disapproval | 0.37 | 0.40 | 0.38 |
| disgust | 0.55 | 0.46 | 0.50 |
| embarrassment | 0.44 | 0.43 | 0.44 |
| excitement | 0.43 | 0.45 | 0.44 |
| fear | 0.62 | 0.71 | 0.66 |
| gratitude | 0.90 | 0.92 | 0.91 |
| grief | 0.43 | 0.50 | 0.46 |
| joy | 0.54 | 0.67 | 0.60 |
| love | 0.75 | 0.84 | 0.80 |
| nervousness | 0.31 | 0.48 | 0.38 |
| optimism | 0.55 | 0.56 | 0.55 |
| pride | 0.83 | 0.31 | 0.45 |
| realization | 0.21 | 0.23 | 0.22 |
| relief | 0.29 | 0.36 | 0.32 |
| remorse | 0.56 | 0.77 | 0.65 |
| sadness | 0.57 | 0.60 | 0.58 |
| surprise | 0.52 | 0.57 | 0.55 |
| neutral | 0.61 | 0.72 | 0.66 |
| macro-average | 0.50 | 0.54 | 0.51 |
| std | 0.16 | 0.18 | 0.16 |
| Sentiment | Precision | Recall | F1 |
|---|---|---|---|
| ambiguous | 0.50 | 0.74 | 0.60 |
| negative | 0.56 | 0.81 | 0.66 |
| neutral | 0.63 | 0.72 | 0.67 |
| positive | 0.80 | 0.84 | 0.82 |
| macro-average | 0.62 | 0.78 | 0.69 |
| std | 0.11 | 0.05 | 0.08 |
| Model | Precision | Recall | F1 |
|---|---|---|---|
| BERT | 0.40 | 0.63 | 0.46 |
| RoBERTa | 0.50 | 0.54 | 0.51 |
| Training | Precision | Recall | F1 |
|---|---|---|---|
| Original | 0.50 | 0.54 | 0.51 |
| EDA | IP | IP | IP |
| BERT Embed | IP | IP | IP |
| ProtAug | IP | IP | IP |
| Ekman Emotion | Precision | Recall | F1 |
|---|---|---|---|
| anger | 0.56 | 0.52 | 0.54 |
| disgust | 0.44 | 0.54 | 0.49 |
| fear | 0.55 | 0.74 | 0.63 |
| joy | 0.73 | 0.89 | 0.80 |
| neutral | 0.59 | 0.80 | 0.68 |
| sadness | 0.54 | 0.63 | 0.58 |
| surprise | 0.53 | 0.70 | 0.60 |
| macro-average | 0.56 | 0.69 | 0.62 |
| std | 0.08 | 0.13 | 0.10 |
Our final results are comparable with the original paper. We list all numerical results for comparison (the numbers inside the brackets come from the original paper). We achieved macro-Precision of 0.50 (0.40), macro-Recall of 0.54 (0.63), and macro-F1 of 0.51 (0.46) on GoEmotions taxonomy; macro-Precision of 0.62 (0.65), macro-Recall of 0.78 (0.74), and macro-F1 of 0.69 (0.69) on grouped taxonomy; macro-Precision of 0.56 (0.59), macro-Recall of 0.69 (0.69), and macro-F1 of 0.62 (0.64) on Ekman’s taxonomy.
We also plotted the training losses of three tasks in Figure 2. Figure 2(a), Figure 2(b), and Figure 2(c) prove that the argument in the original paper stating that 4 epochs are enough to acquire strong performance when fine-tuning BERT on the GoEmotions dataset.
4.2 Transfer Learning Experiment
In the paper, the authors also conducted transfer learning experiments on existing emotion benchmarks.
The experiment aims to demonstrate the effectiveness of transfer learning in emotion understanding across various domains and taxonomies using limited labeled data in a target domain. The researchers leverage GoEmotionsDemszky et al. (2020) as the baseline dataset for training their models.
The study uses nine datasets from the Bostan and Klinger (2018) Unified Dataset, focusing on three for detailed discussion due to their diverse domains. The chosen datasets are:
-
1.
ISEARR and Wallbott (1994): This dataset includes personal reports of emotional events from 3000 individuals with different cultural backgrounds. It consists of 8,000 sentences, each labeled with one of seven emotions: anger, disgust, fear, guilt, joy, sadness, and shame.
-
2.
EmoIntMarrese-Taylor and Matsuo (2017): Part of the SemEval 2018 benchmark, this dataset has 7,000 tweets with crowdsourced annotations. It focuses on the intensity of four emotions: anger, joy, sadness, and fear. The researchers use a cutoff of 0.5 to obtain binary annotations.
-
3.
Emotion-StimulusMohammad et al. (2018): Based on FrameNet’s emotion-directed frames, this dataset provides annotations for 2,400 sentences. Its taxonomy includes seven emotions: anger, disgust, fear, joy, sadness, shame, and surprise.
The experiments involve varying training set sizes, including 100, 200, 500, 1,000, and 80% of the dataset examples. For each size, 10 random splits are created, with the remaining examples serving as a test set. The results are reported with confidence intervals based on repeated experiments. All experiments maintain a batch size of 16, learning rate of 2e-5, and three epochs.
The goal of these experiments is to establish that GoEmotions can serve as a robust baseline for understanding emotions, even with limited labeled data in different domains, and to assess the effectiveness of different finetuning approaches in this context.
In this assignment 3, we show our reproducing results on ISEAR mainly because the other 2 experiments are highly similar with ISEAR, and the entire experiment is not considered as the major one. We use the exact setting of the paper mentioned which is summarized above. The difference is we use the BERT finetuned on Ekman as our base model because we find the labels from Ekman and ISEAR take high resemblance of each other.
Below in Figure 3 is the full our reproducing results on ISEAR.
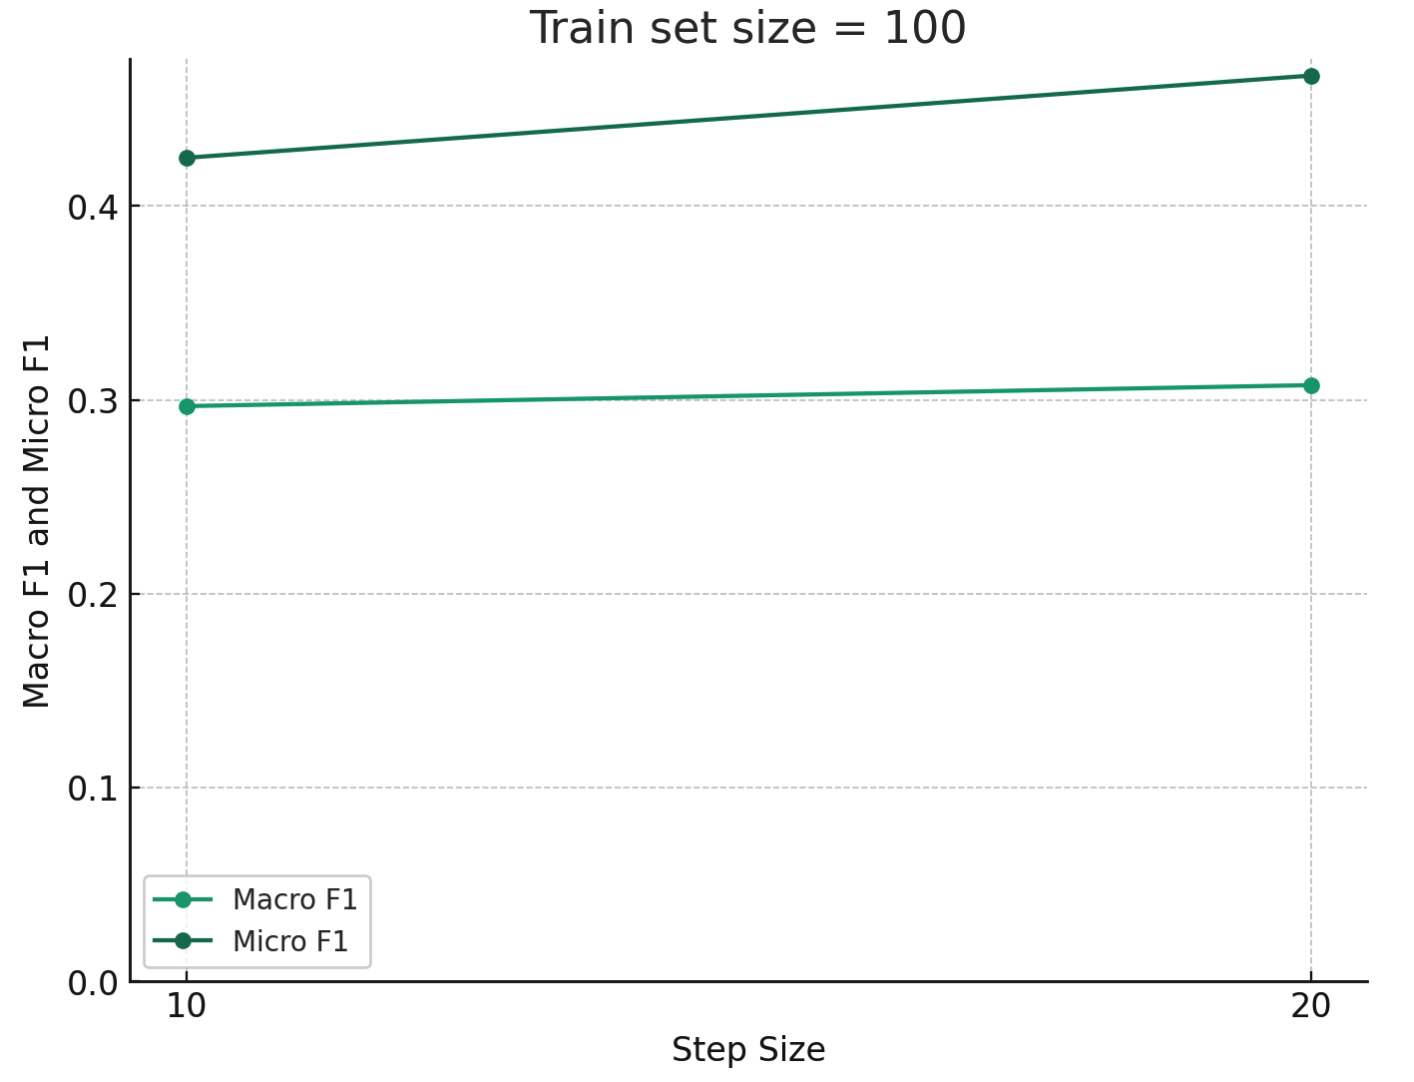
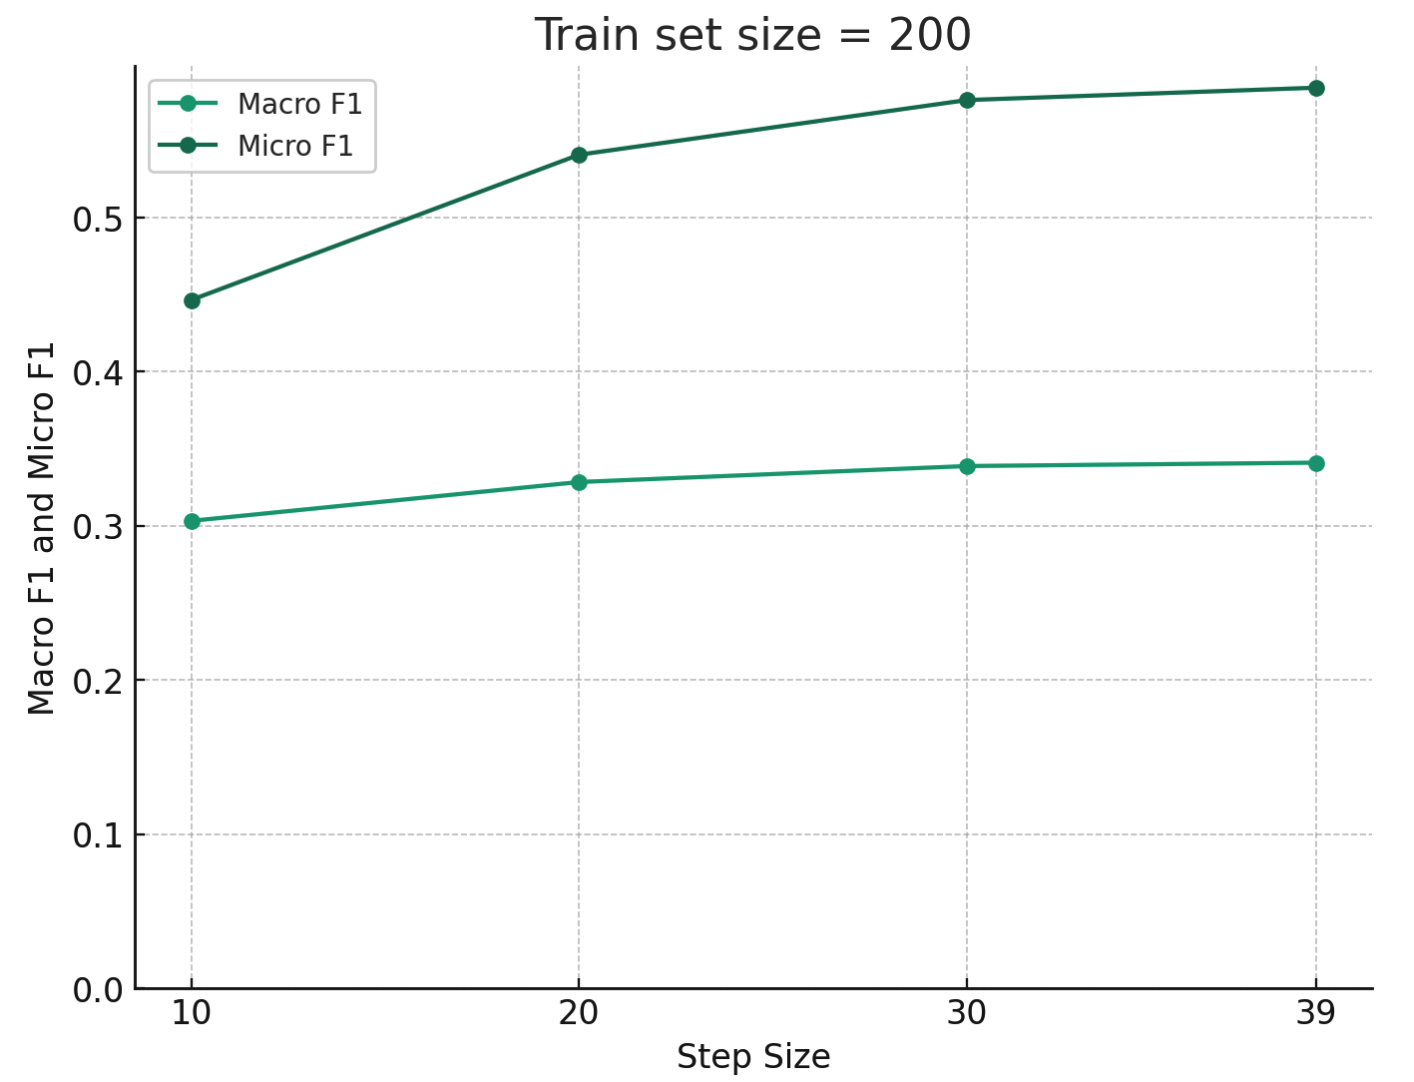
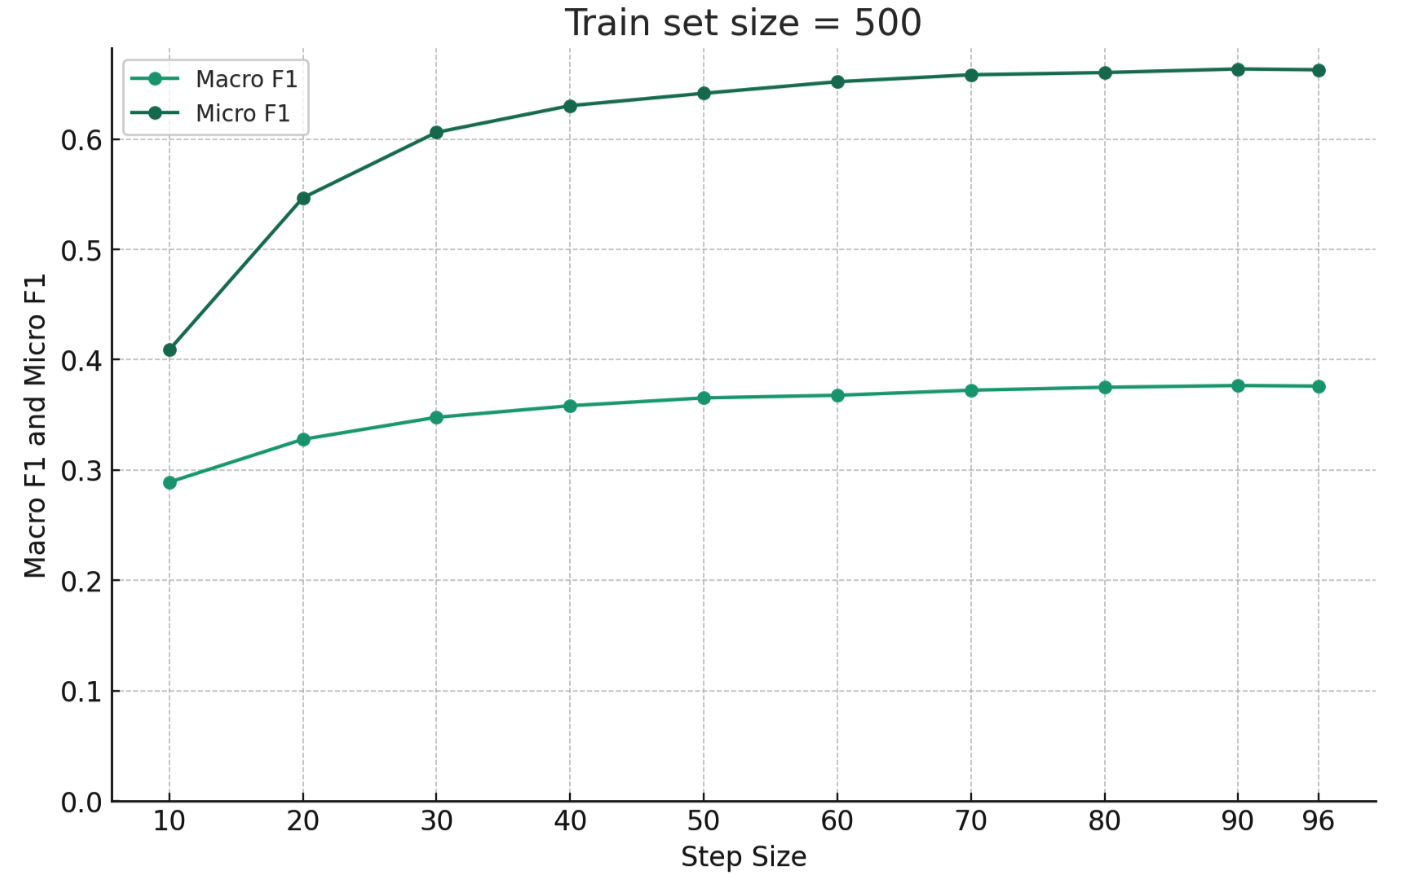
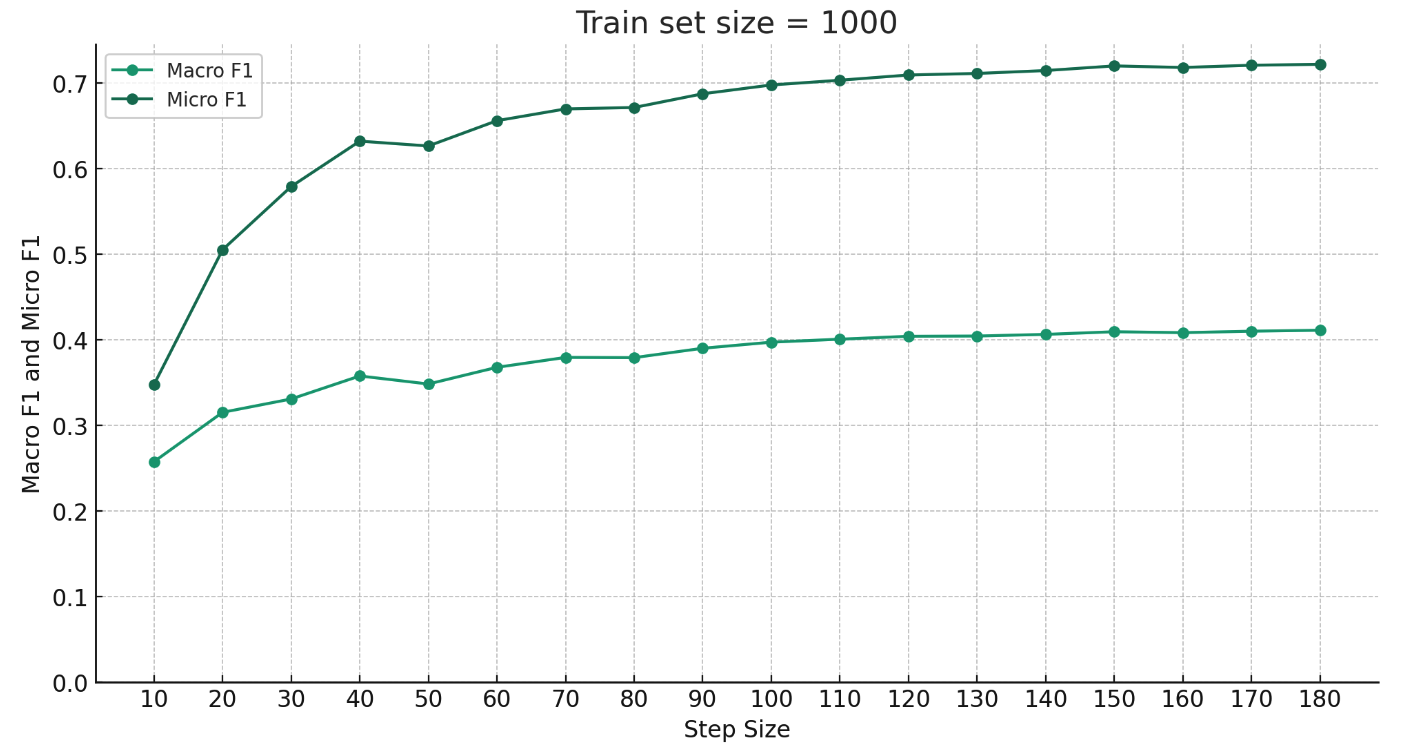
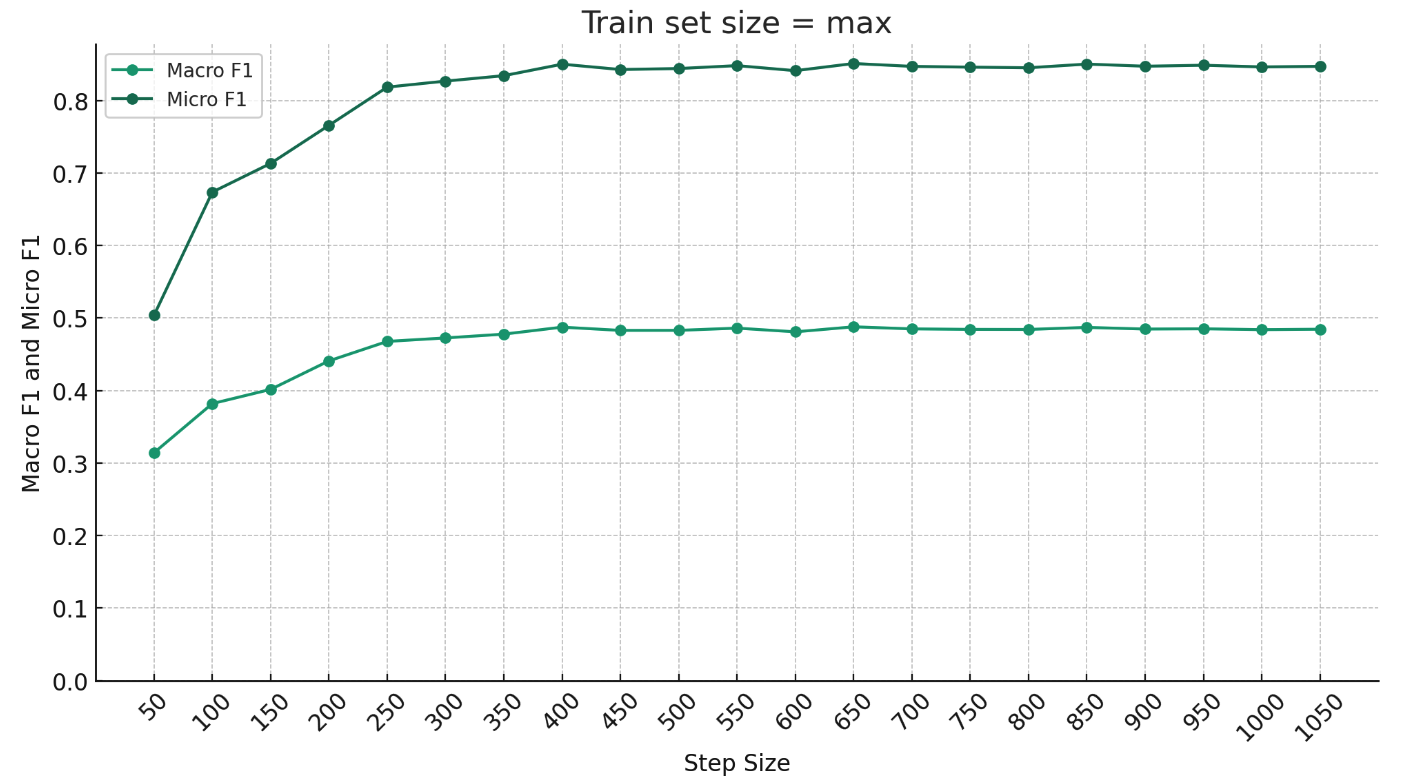
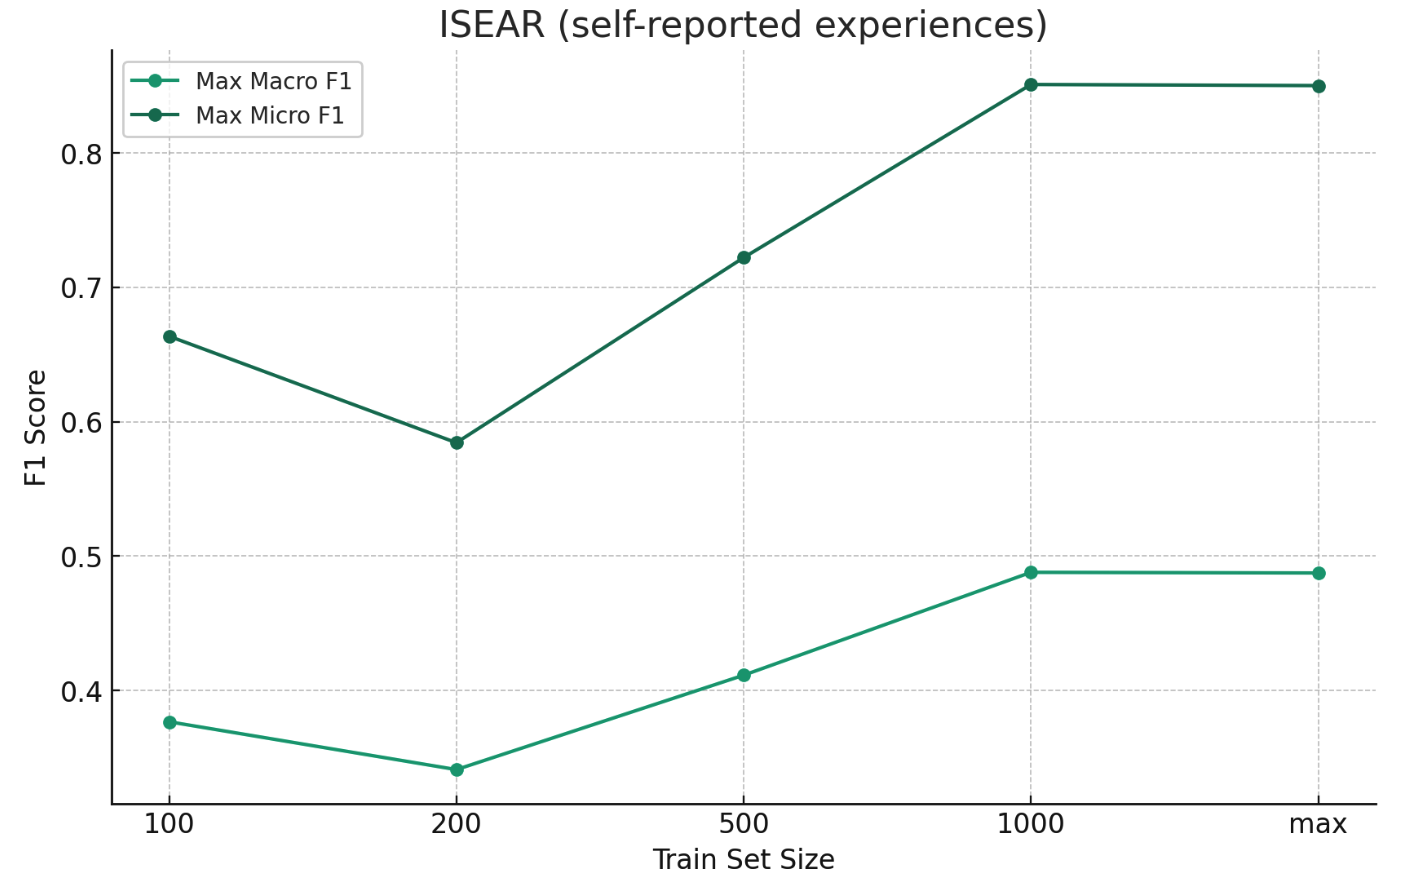
From Figure 3(f) it is easy to find that we reach nearly 90% in Micro F1 Score while the paper only reached around 60%. This is a very noticeable improvement in our reproduction of the paper.
4.3 Error Analysis
For the first set of experiments where we fine-tuned BERT model on three taxonomies, if we look into detail of F1 score for each emotion category, we almost achieved comparable or even better results than the original paper. Especially for the "grief" category in the original taxonomy where the precision, recall and F1 are all 0 in the original paper, we achieved precision of 0.43, recall of 0.50 and F1 score of 0.46 respectively. This is probably due to more training epochs that we adopted.
However, there are still much space for improvement. Firstly, the original GoEmotions dataset is still severely imbalanced. For instance, there are more than 15k data points for the emotion category "admiration", but less than 1k data points for the emotion category "relief". As a result, we achieved 0.67 F1 score on "admiration" category while only 0.32 F1 score on the "relief" category. We suggest that some data augmentation methods can be applied on the minority classes to further improve the model performance Su et al. (2022). Moreover, our model performance improvements mainly benefit from using more training epochs. So we believe that executing thorough and proper hyperparameter tuning process can help yield better performance as well.
4.4 A Stronger Baseline?
In comparison, we purpose to fine-tune a RoBERTa model Liu et al. (2019) on the GoEmotions training set as the new baseline to replace the BERT baseline proposed in the original paper Demszky et al. (2020). Since RoBERTa optimizes the set of pre-training tasks, the pre-training configuration, and the pre-training dataset Liu et al. (2019), it is expected to outperform the performance of the BERT baseline on GoEmotions in our use case.
We keep exactly the same hyperparameter configuration for RoBERTa as how BERT was trained in the original paper: batch_size of 16, learning_rate of 5e-5 and no learning rate scheduler. We use the AdamW optimizer Loshchilov and Hutter (2017) and cross-entropy as the loss function. Same as BERT baseline, we trained RoBERTa for 4 epochs on the training set to prevent overfitting and the performance comparison with BERT baseline is shown in Table 6.
| Model | Precision | Recall | F1 |
|---|---|---|---|
| BERT | 0.49 | 0.50 | 0.49 |
| RoBERTa | 0.53 | 0.45 | 0.47 |
We uncover that the BERT baseline outperforms the RoBERTa baseline in terms of the macro-averaged F1 score after being trained with the same configuration, which is contradict to our initial hypothesis. One possible explanation is that machine learning models are task-sensitive, which means even if RoBERTa generally performs better on a wide range of NLP tasks, there might be specific characteristics of the GoEmotions classification task that make BERT more suitable. For example, the GoEmotions dataset could be more closely aligned with the data distribution which BERT was pre-trained on. In this case, BERT might perform better than RoBERTa on this specific emotion classification task.
Given the experiment results, we disprove the hypothesis stated in section 3. And the and experiment design needs to be revised correspondingly:
-
2.
(revised) apply three data augmentation techniques on original training dataset before fine-tuning BERT, comparing the variance in performance
-
3.
(revised) fine-tune BERT on CARER dataset first and then fine-tune the trained model on augmented GoEmotions training dataset, comparing the variance in performance
4.5 Data Augmentation
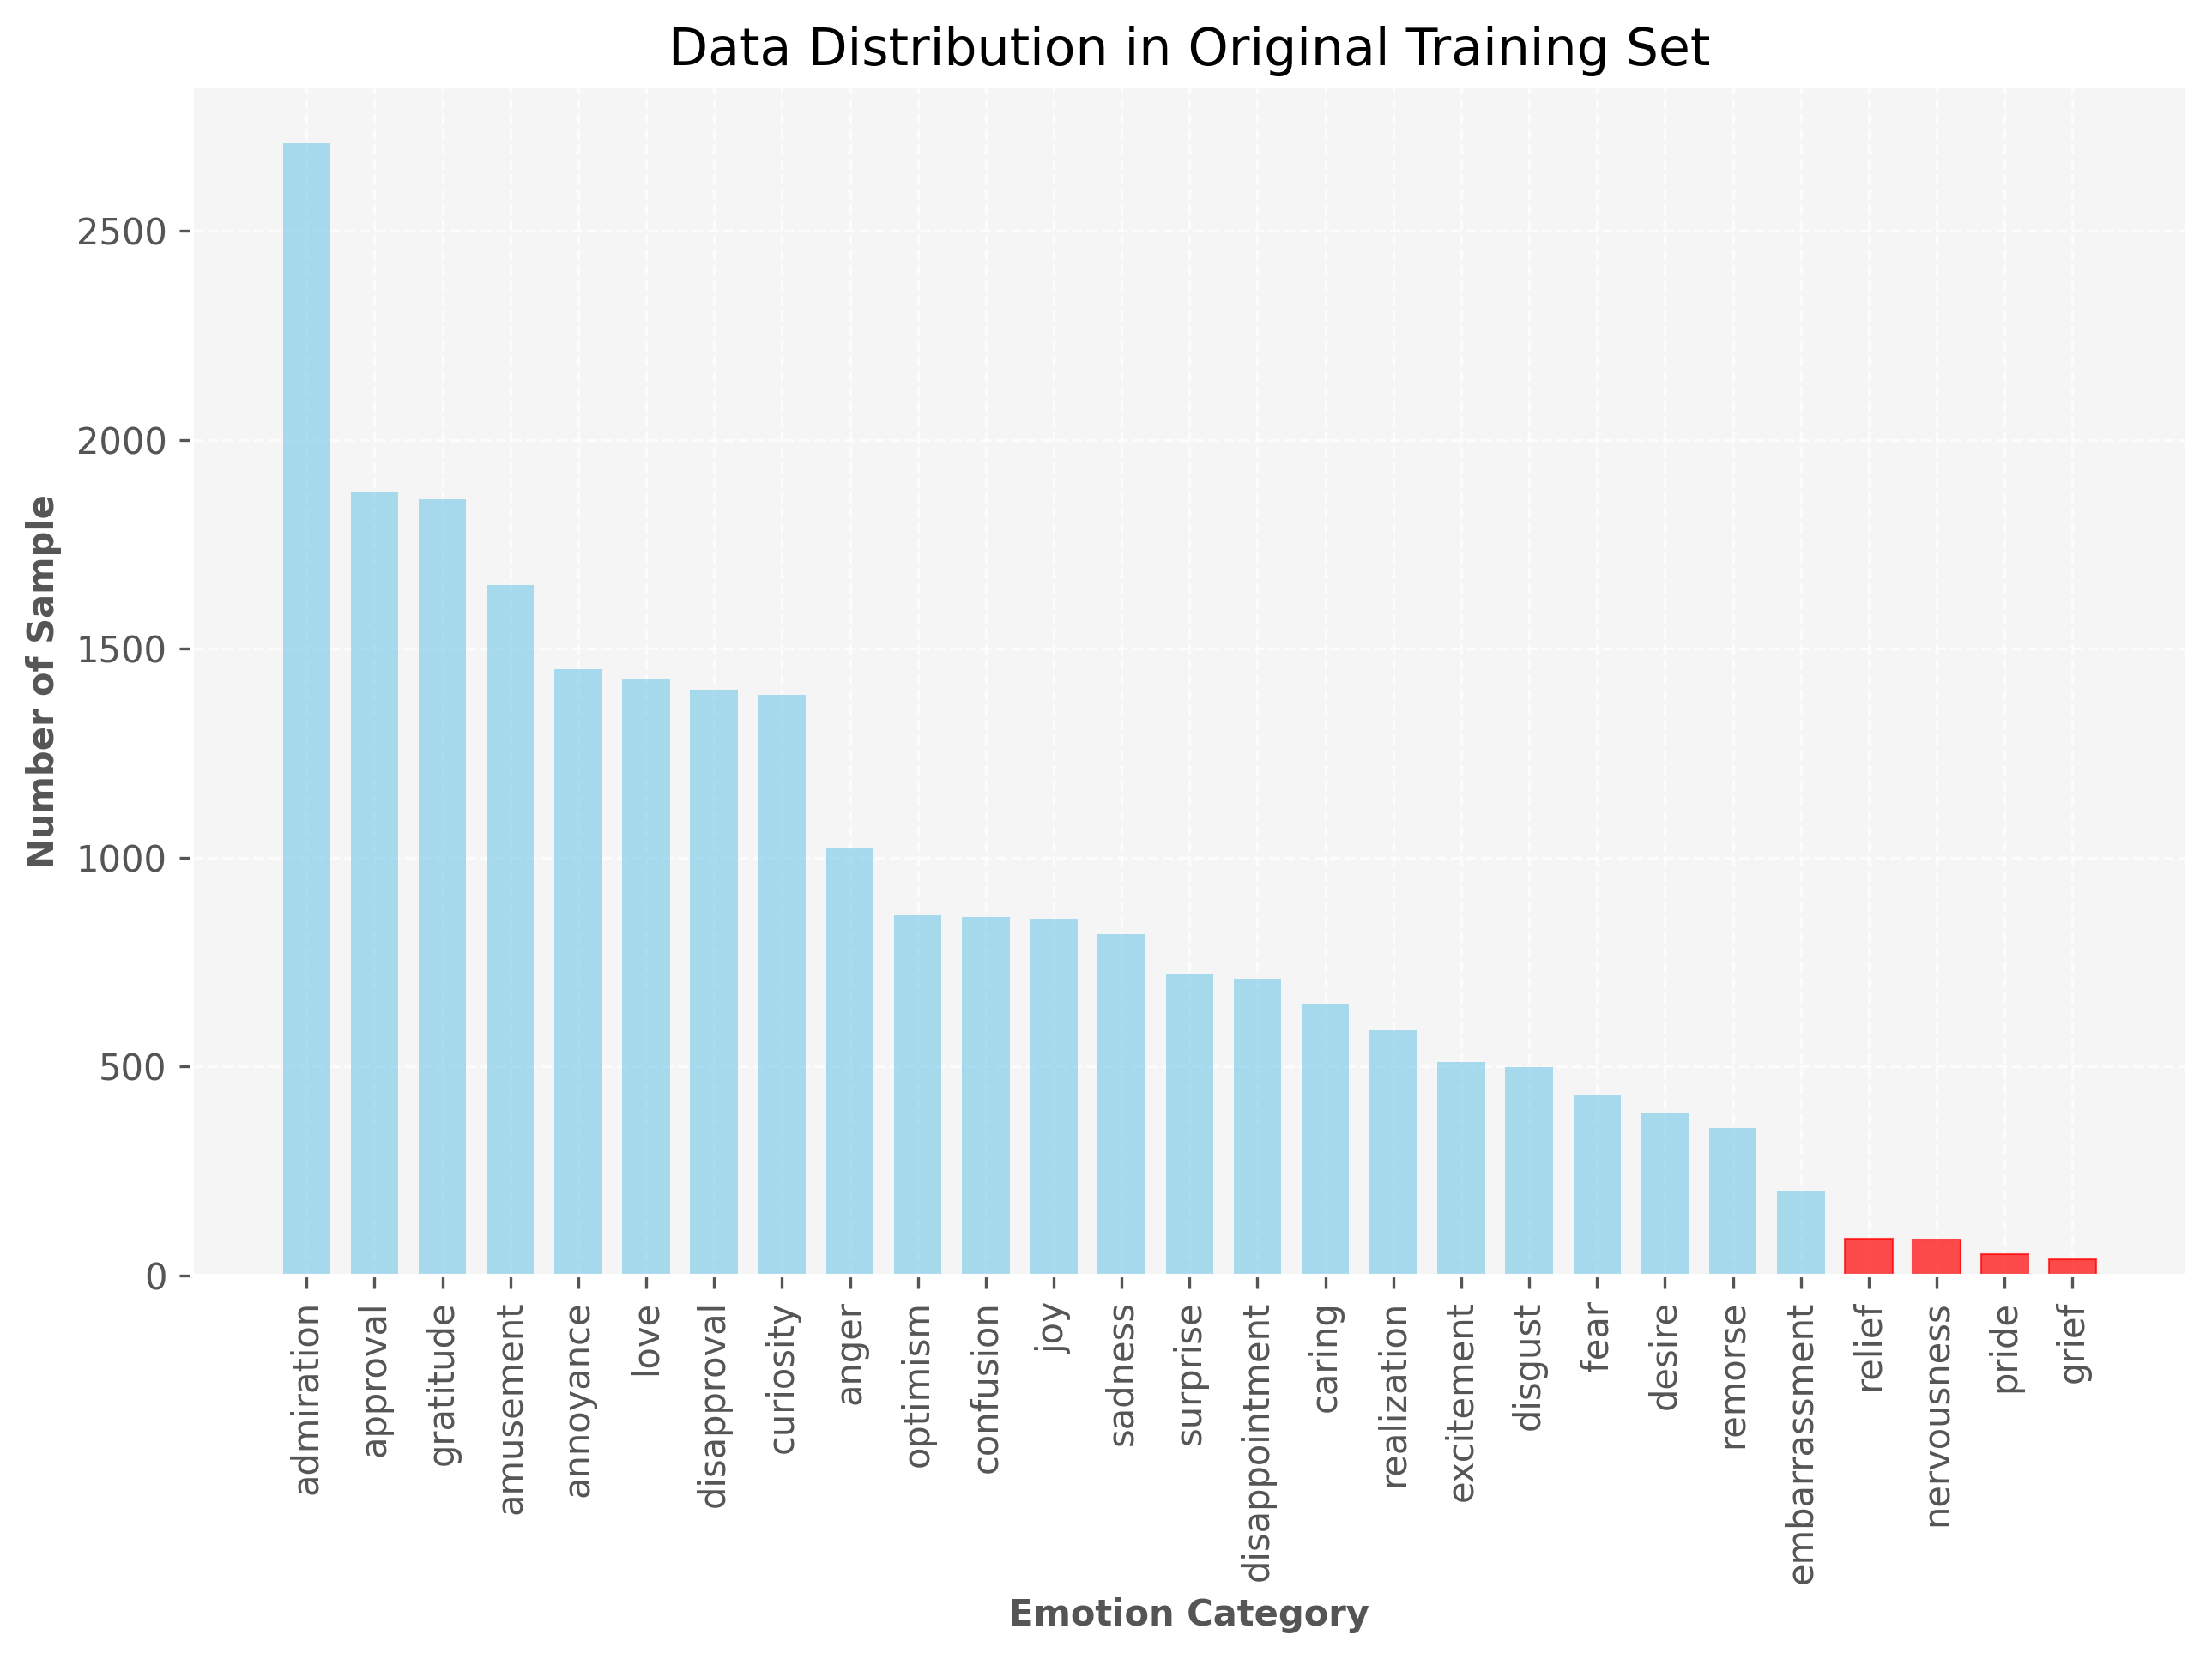
In the revised second set of experiments, we apply three data augmentation techniques on the original GoEmotions training set which contains 43410 data points. The data distribution of emotion categories in the original training set can be found at Figure 4(a). Since the "neutral" class dominants the dataset, we remove it from the visualization plot and only keep the rest 27 emotion categories. It can be easily seen that the distribution of original training set is imbalanced. Some categories such as "admiration" has more than 25k examples while some minority classes like "grief" only has 39 examples.
To mitigate the unevenness of the training data distribution, we applied 3 different data augmentation methods on each data point in the training set.
Easy Data Augmentation (EDA)
This straightforward method proposed by Wei et al. Wei and Zou (2019) has proven to be notably effective. EDA integrates various manipulations for the words present in the initial document. In our use case, for each sentence within the training data, EDA selects and executes one of the following operations with certain predefined probability:
-
•
Synonym Replacement: random words are replaced by random synonyms from a dictionary e.g. WordNet Miller (1995)
-
•
Random Swap: randomly chosen words are swapped
-
•
Random Deletion: random words are removed
This is a quite native approach since we are changing random words in the sentence, which means those words that have higher weights in the classification task may be affected.
BERT Embeddings
To address the drawback in EDA approach, a more sophisticated way to altering the original text without hurting the meaning and context of the sentence is to use BERT embeddings Devlin et al. (2019). Essentially, the word w in the original text is substituted with words forecasted by a model like BERT, considering the surrounding context of w in the original text. In our use case, a new word will be injected to random position according to contextual word embeddings or an original word will be replaced by a new word according to contextual embedding distances with predefined probability.
BART Paraphraser ProtAugment
The third method ProtAugment Dopierre et al. (2021) shifts the focus from individual words to rephrasing the entire original text. It uses BART, a model that "merges Bidirectional and Auto-Regressive Transformers" Lewis et al. (2019), for creating paraphrases. The authors of ProtAugment tuned BART specifically for paraphrase generation, employing multiple datasets for this purpose. Additionally, they employed techniques like Diverse Beam Search Vijayakumar et al. (2018) and Back Translation Mallinson et al. (2017) to help producing diverse outputs.
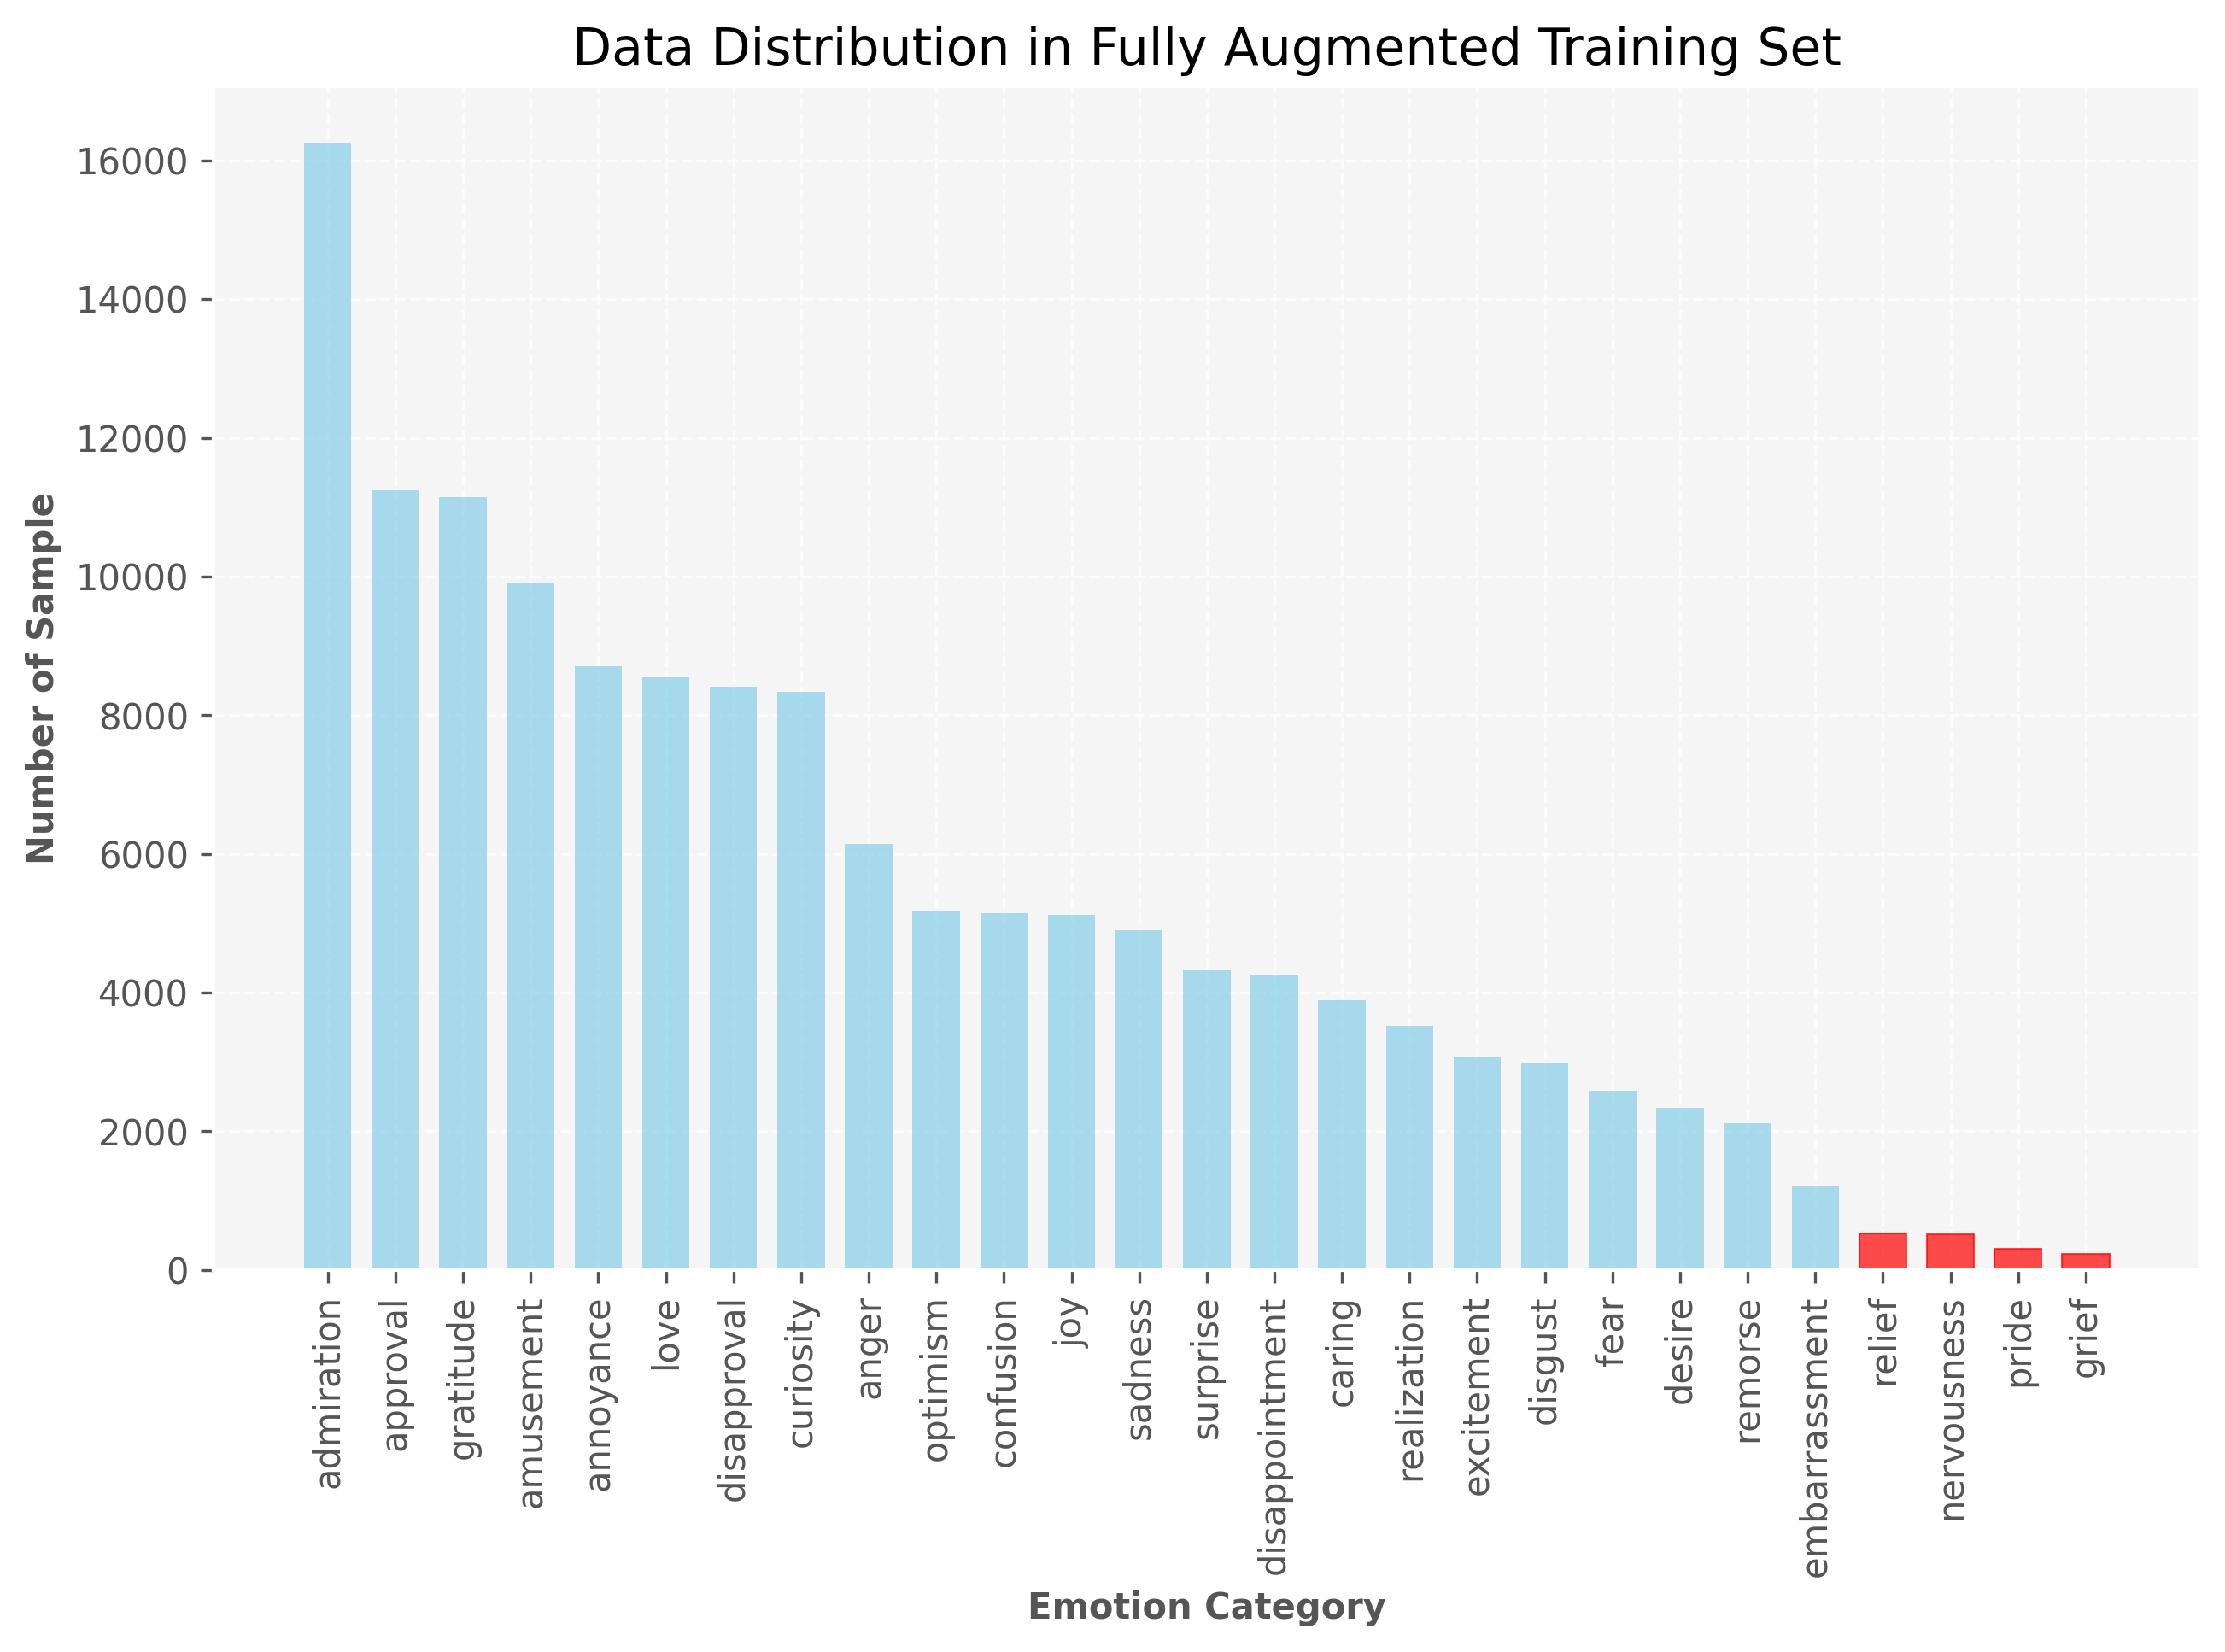
We augmented each training data point to generate 5 new data points per method, resulting in three fully augmented training set. Each fully augmented training set is 5 times larger than the original training set. We randomly picked one fully augmented training set (the one used ProtAugment method) to fine-tune a BERT model on it with the same training configuration as our baseline, the results are shown in Table 7.
| Training Set | Precision | Recall | F1 |
|---|---|---|---|
| Original | 0.49 | 0.50 | 0.49 |
| Fully Augmented | 0.49 | 0.41 | 0.44 |
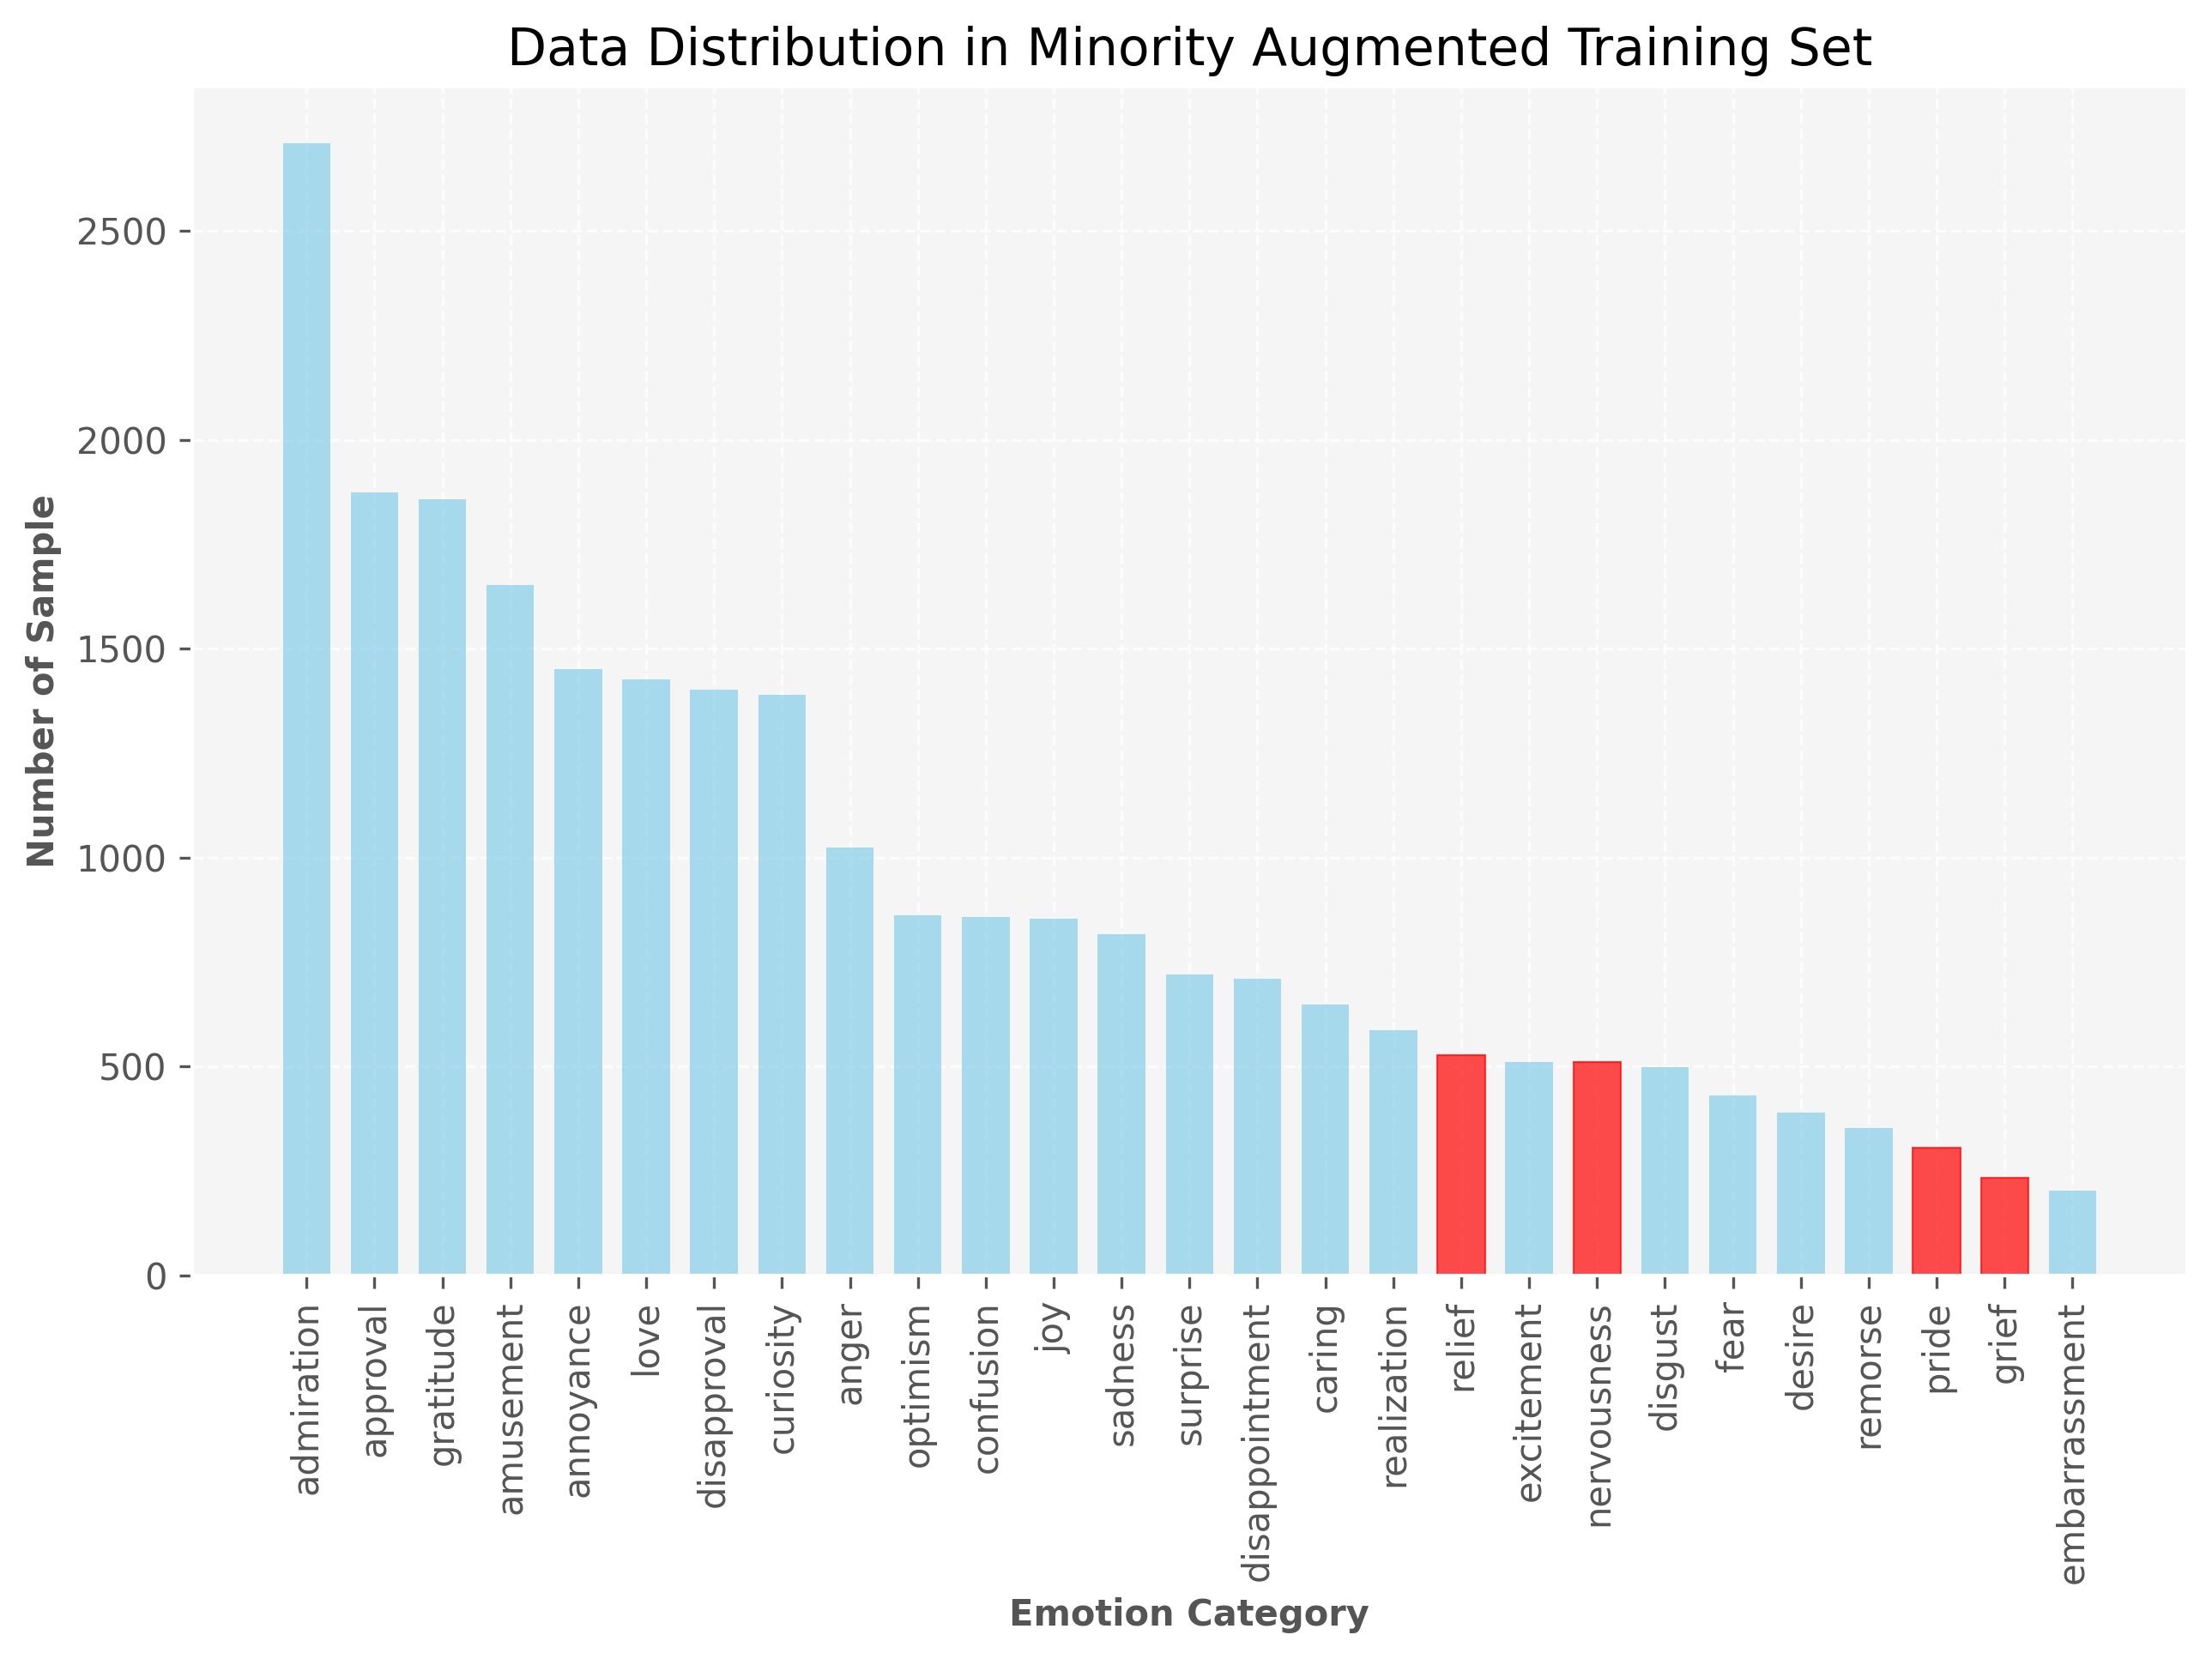
The experiment results show that the model performance on fully augmented dataset is not as good as our BERT baseline on the original training set. However, this is not surprising. Referring to the data distribution of fully augmented training set in Figure 4(b), we find that the shape of the distribution nearly stays the same but the scale of the distribution is expanded, which exacerbates the unevenness. This can also be proved by a dramatic increment in terms of standard deviation after fully augmented the dataset stated in Table 8. Therefore, the model will learn better on the majority classes in the fully augmented dataset, but learn even worse on those minority classes than our baseline.
| Training Set | Std |
|---|---|
| Original | 2350.36 |
| Full Augmented | 14102.14 |
| Minority Categories Augmented | 2303.25 |
One mitigation strategy is to only augment four minority classes in the original training set, namely "grief", "pride", "nervousness", and "relief". Similarly, we augmented each training data point in minority categories to generate 5 new data points per method, resulting in 3 different minority augmented training set. The new data distribution of the minority augmented training set can be found in Figure 4(c) with four minority classes highlighted in red. We also find that the standard deviation of the minority augmented training set distribution is much lower than that of the original training set (see Table 8), which means the original data unevenness is successfully mitigated.
Then our team tuned BERT model on three minority augmented dataset using the same training configuration as the baseline, used the same original testing set to do prediction, and reported the results in Table 9.
| Training Set | Precision | Recall | F1 |
|---|---|---|---|
| Original | 0.490 | 0.500 | 0.490 |
| EDA | 0.500 | 0.537 | 0.511 |
| BERT Embed | 0.518 | 0.528 | 0.511 |
| ProtAug | 0.519 | 0.533 | 0.517 |
These results show that all three augmentation methods on minority emotion categories can improve the BERT classification performance, which aligned with our expectation stated in the hypothesis. Among them, the model tuned on the ProtAugment training set gives the best performance in terms of macro-averaged F1 score, we also include the detailed category-wise performance for this model in Table 10.
| Emotion | Precision | Recall | F1 |
|---|---|---|---|
| admiration | 0.63 | 0.74 | 0.68 |
| amusement | 0.72 | 0.94 | 0.82 |
| anger | 0.48 | 0.50 | 0.49 |
| annoyance | 0.36 | 0.29 | 0.32 |
| approval | 0.53 | 0.35 | 0.42 |
| caring | 0.40 | 0.42 | 0.41 |
| confusion | 0.46 | 0.43 | 0.44 |
| curiosity | 0.46 | 0.77 | 0.57 |
| desire | 0.60 | 0.41 | 0.49 |
| disappointment | 0.31 | 0.23 | 0.26 |
| disapproval | 0.40 | 0.33 | 0.36 |
| disgust | 0.51 | 0.48 | 0.50 |
| embarrassment | 0.67 | 0.43 | 0.52 |
| excitement | 0.51 | 0.36 | 0.42 |
| fear | 0.58 | 0.78 | 0.66 |
| gratitude | 0.94 | 0.90 | 0.92 |
| grief | 0.20 | 0.33 | 0.25 |
| joy | 0.57 | 0.61 | 0.59 |
| love | 0.71 | 0.89 | 0.79 |
| nervousness | 0.36 | 0.35 | 0.36 |
| optimism | 0.63 | 0.56 | 0.60 |
| pride | 0.50 | 0.38 | 0.43 |
| realization | 0.27 | 0.19 | 0.22 |
| relief | 0.45 | 0.45 | 0.45 |
| remorse | 0.58 | 0.95 | 0.72 |
| sadness | 0.50 | 0.59 | 0.54 |
| surprise | 0.60 | 0.53 | 0.56 |
| neutral | 0.62 | 0.72 | 0.67 |
| macro-average | 0.52 | 0.53 | 0.52 |
| std | 0.15 | 0.22 | 0.17 |
4.6 Transfer Learning
In this section, we want to test the impact of introducing Transfer Learning into our experiment settings. This idea is learned from the original paper of GoEmotions Demszky et al. (2020), and we use CARER Saravia et al. (2018), another Emotion Classification Task Dataset, as additional data source.
4.6.1 CARER Overview
The CARER dataset is an Emotion Detection dataset that was collected using noisy labels and annotated via distant supervision. This dataset focuses on 6 primary emotions: anger, fear, joy, love, sadness, and surprise. The dataset is specifically tailored for emotion recognition tasks and is used in the context of multi-class and multi-label text classification, as well as in semantic textual similarity tasks. It serves as a significant resource for researchers and practitioners in the field of natural language processing, specifically for those working on emotion recognition from text. Table 11 shows the label distribution of CARER.
| Emotions | Amount | Hashtags |
|---|---|---|
| sadness | 214,454 | #depressed, #grief |
| joy | 167,027 | #fun, #joy |
| fear | 102,460 | #fear, #worried |
| anger | 102,289 | #mad, #pissed |
| surprise | 46,101 | #strange, #surprise |
| trust | 19,222 | #hope, #secure |
| disgust | 8,934 | #awful, #eww |
| anticipation | 3,975 | #pumped, #ready |
The CARER paper and dataset contribute significantly to the field of affective computing and natural language processing by providing a nuanced approach to emotion recognition in text, reflecting the complex ways in which emotions are expressed and understood in human language.
| Experiment | Accuracy | Precision | Recall | F1 Score |
| BERT on CARER (reference) | 93.75% | 92.21% | 91.14% | 91.58% |
| BERT on original GoEmotions (original paper) | N/A | 40% | 63% | 46% |
| BERT on PROT Augmented GoEmotions | N/A | 51.9% | 53.3% | 51.7% |
| CARER-BERT on original GoEmotions | 48.54% | 55.66% | 46.06% | 47.38% |
| CARER-BERT on EDA Augmented GoEmotions | 49.19% | 57.97% | 46.38% | 50.03% |
| CARER-BERT on BERT Augmented GoEmotions | 48.47% | 57.69% | 47.15% | 50.52% |
| CARER-BERT on PROT Augmented GoEmotions | 49.32% | 57.27% | 49.18% | 51.83% |
4.6.2 Experiment Setting
We pick BERT Devlin et al. (2019) as our base model, which is aligned with our other experiments, and we first finetune the base model on CARER Saravia et al. (2018). Then we train our model on 4 different Datasets: Oringinal GoEmotions, EDA Augmented GoEmotions, BERT Embedding Augmented GoEmotions, PROT Augmented GoEmotions. Note that all augmented methods are only applied to under-performanced categories.
We fine-tune BERT on CARER using the hyperparameters of: learning rate of 2e-5, epoch of 10, weight decay of 0.01, warm up steps of 500, batch size of 16 for both training and evaluating, and we set the random seed to 11711 to make sure reproducibility.
4.6.3 Transfer Learning Results
We show the results of Transfer Learning by adding CARER into the game, in Table 12. As mentioned in the above section 4.6.2, we have in total 4 sets of experiments, which are the BERT finetuned on CARER on 4 different datasets. We evaluate the performance using the original GoEmotions test set, and we report the results according to the best epoch among the 10 epochs trained. In all, we report the model predictions on macro average of Accuracy, Precision, Recall, and F1 Score.
The notation of CARER-BERT means using BERT finetuned on CARER as base model.
5 Error Analysis
5.1 Data Augmentation Analysis
| Emotion | F1-Original | F1-ProtAug |
|---|---|---|
| admiration | 0.65 | 0.68 |
| amusement | 0.80 | 0.82 |
| anger | 0.47 | 0.49 |
| annoyance | 0.34 | 0.32 |
| approval | 0.36 | 0.42 |
| caring | 0.39 | 0.41 |
| confusion | 0.37 | 0.44 |
| curiosity | 0.54 | 0.57 |
| desire | 0.49 | 0.49 |
| disappointment | 0.28 | 0.26 |
| disapproval | 0.39 | 0.36 |
| disgust | 0.45 | 0.50 |
| embarrassment | 0.43 | 0.52 |
| excitement | 0.34 | 0.42 |
| fear | 0.60 | 0.66 |
| gratitude | 0.86 | 0.92 |
| grief | 0.00 | 0.25 |
| joy | 0.51 | 0.59 |
| love | 0.78 | 0.79 |
| nervousness | 0.35 | 0.36 |
| optimism | 0.51 | 0.60 |
| pride | 0.36 | 0.43 |
| realization | 0.21 | 0.22 |
| relief | 0.15 | 0.45 |
| remorse | 0.66 | 0.72 |
| sadness | 0.49 | 0.54 |
| surprise | 0.50 | 0.56 |
| neutral | 0.68 | 0.67 |
| macro-average | 0.46 | 0.52 |
| std | 0.19 | 0.17 |
To conduct a comprehensive error analysis on the effectiveness of the data augmentation, we list the category-wise F1 scores of BERT tuned on the original training set and BERT tuned on the ProtAugment training set in Table 13.
On the whole, the macro-average F1 score has improved from 0.46 to 0.52 with the use of the augmented training set, indicating that the augmentation process has generally benefited the model’s ability to classify emotions across all categories. Moreover, the standard deviation of the F1 scores across emotions has decreased from 0.19 to 0.17, which suggests that the augmentation has not only improved the overall performance but also forced the model to learn more consistently across different emotion categories.
If we look into single category granularity, 23 out of 28 classes see improvements in F1 score. Especially for four augmented categories "grief", "pride", "nervousness", and "relief", we can see significant increment in their classification performance, indicating that the augmented training set provided sufficient examples in these four categories for the model to learn from, where previously it struggled to recognize these emotions. For the rest 19 categories with no augmentation but improved, we may conclude that the model can also benefit indirectly from the augmentation of other classes and directly benefit from the evenness of the data distribution. A few categories such as "annoyance", "disappointment", "desire", "disapproval", and "neutral" see a decrease in performance. This may indicate that the augmented data introduced some noise or confusion for these specific emotions, or there could be an issue of class imbalance that the augmentation didn’t address.
Based on the analysis, future work may involve further augmentation for underperforming categories or making the training set more balanced to ensure that the model can generalize well across all emotion categories.
5.2 Transfer Learning Analysis
From Table 12, we can easily gain several insights listed below:
-
•
CARER’s incorporation demonstrably improves performance. As evidenced by the 2nd and 3rd rows of the table, CARER-BERT achieves a statistically significant 0.9% F1 score improvement over vanilla BERT.
-
•
Data augmentation strategies further boost gains. CARER-BERT augmented with data for underperforming categories exhibits a remarkable 4% F1 score increase, highlighting the efficacy of this targeted approach.
-
•
PROT augmentation emerges as the most effective strategy. Among the three augmentation methods employed, PROT consistently delivers the best results, similar to the last section.
-
•
On PROT augmented dataset, CARER-BERT works better than BERT. The 3rd and last rows showcase CARER-BERT’s, though slightly, better performance on PROT-augmented data, demonstrating Transfer Learning’s positive impact.
Note that, to our analysis, F1 score is the main metric that we use to compare the models’ performance because it reflects the correctness of model predictions most correctly and comprehensively. Overall, we have successfully added CARER to our base models and it proves to be helpful to our model’s classification performance.
6 Conclusion and Future Work
In this project, the study embarked on an exploratory journey to enhance the classification performance on the fine-grained GoEmotions dataset. Through meticulous experimentation, we have validated the efficacy of data augmentation and transfer learning as viable strategies to improve emotion detection in text. Notably, our findings indicate that the integration of the CARER dataset via transfer learning resulted in a measurable performance boost, as demonstrated by the improved F1 scores across multiple configurations.
Data augmentation, particularly when applied to under-performing categories, has proven to be a potent tool in balancing the dataset Dong et al. (2021) and enhancing model accuracy. Among the augmentation techniques, PROT augmented dataset has emerged as the superior strategy, outperforming other methods in improving the classification results of our models.
On top of that, our study also highlights the complexity and sensitivity of machine learning tasks to their respective datasets. The initially hypothesized superiority of the RoBERTa model was not realized, underscoring the need for task-specific model selection and configuration. Furthermore, we observed that while data augmentation can indeed propel performance forward, it requires a nuanced application to prevent exacerbating existing data imbalances.
Our research contributes to the broader understanding of emotion detection in NLP, offering insights that extend beyond the confines of our dataset.
Future work, on the one hand, could explore the application of these strategies to other NLP tasks and datasets, potentially contributing to the development of more robust, accurate, and fair machine learning models. On the other hand, we found that there are not very many of interests received in the emotion detection domain comparing to the current trend of Large Language Models (LLMs). Thus we think contributing a survey that collectively introduces and analyses different methods’ performance on various datasets in this domain would be of great help to the researchers, and we are drawn to the possibility of publishing a survey paper.
References
- Bostan and Klinger (2018) Laura-Ana-Maria Bostan and Roman Klinger. 2018. An analysis of annotated corpora for emotion classification in text. In Proceedings of the 27th International Conference on Computational Linguistics, pages 2104–2119, Santa Fe, New Mexico, USA. Association for Computational Linguistics.
- Demszky et al. (2020) Dorottya Demszky, Dana Movshovitz-Attias, Jeongwoo Ko, Alan Cowen, Gaurav Nemade, and Sujith Ravi. 2020. GoEmotions: A dataset of fine-grained emotions. In Proceedings of the 58th Annual Meeting of the Association for Computational Linguistics, pages 4040–4054, Online. Association for Computational Linguistics.
- Devlin et al. (2019) Jacob Devlin, Ming-Wei Chang, Kenton Lee, and Kristina Toutanova. 2019. BERT: Pre-training of deep bidirectional transformers for language understanding. In Proceedings of the 2019 Conference of the North American Chapter of the Association for Computational Linguistics: Human Language Technologies, Volume 1 (Long and Short Papers), pages 4171–4186, Minneapolis, Minnesota. Association for Computational Linguistics.
- Dong et al. (2021) Hongyuan Dong, Jiaqing Xie, Zhi Jing, and Dexin Ren. 2021. Variational autoencoder for anti-cancer drug response prediction.
- Dopierre et al. (2021) Thomas Dopierre, Christophe Gravier, and Wilfried Logerais. 2021. Protaugment: Unsupervised diverse short-texts paraphrasing for intent detection meta-learning. arXiv preprint arXiv:2105.12995.
- Ekman (1992) Paul Ekman. 1992. An argument for basic emotions. Cognition & emotion, 6(3-4):169–200.
- Gugger et al. (2022) Sylvain Gugger, Lysandre Debut, Thomas Wolf, Philipp Schmid, Zachary Mueller, Sourab Mangrulkar, Marc Sun, and Benjamin Bossan. 2022. Accelerate: Training and inference at scale made simple, efficient and adaptable. https://github.com/huggingface/accelerate.
- Jing et al. (2024) Zhi Jing, Yongye Su, Yikun Han, Bo Yuan, Haiyun Xu, Chunjiang Liu, Kehai Chen, and Min Zhang. 2024. When large language models meet vector databases: A survey.
- Kim et al. (2023) Hyunwoo Kim, Jack Hessel, Liwei Jiang, Peter West, Ximing Lu, Youngjae Yu, Pei Zhou, Ronan Le Bras, Malihe Alikhani, Gunhee Kim, Maarten Sap, and Yejin Choi. 2023. Soda: Million-scale dialogue distillation with social commonsense contextualization.
- Lewis et al. (2019) Mike Lewis, Yinhan Liu, Naman Goyal, Marjan Ghazvininejad, Abdelrahman Mohamed, Omer Levy, Ves Stoyanov, and Luke Zettlemoyer. 2019. Bart: Denoising sequence-to-sequence pre-training for natural language generation, translation, and comprehension. arXiv preprint arXiv:1910.13461.
- Li et al. (2023) Jiazheng Li, Zhaoyue Sun, Bin Liang, Lin Gui, and Yulan He. 2023. Cue: An uncertainty interpretation framework for text classifiers built on pre-trained language models.
- Liu et al. (2019) Yinhan Liu, Myle Ott, Naman Goyal, Jingfei Du, Mandar Joshi, Danqi Chen, Omer Levy, Mike Lewis, Luke Zettlemoyer, and Veselin Stoyanov. 2019. Roberta: A robustly optimized bert pretraining approach. arXiv preprint arXiv:1907.11692.
- Loshchilov and Hutter (2017) Ilya Loshchilov and Frank Hutter. 2017. Decoupled weight decay regularization. arXiv preprint arXiv:1711.05101.
- Mallinson et al. (2017) Jonathan Mallinson, Rico Sennrich, and Mirella Lapata. 2017. Paraphrasing revisited with neural machine translation. In Proceedings of the 15th Conference of the European Chapter of the Association for Computational Linguistics: Volume 1, Long Papers, pages 881–893.
- Marrese-Taylor and Matsuo (2017) Edison Marrese-Taylor and Yutaka Matsuo. 2017. Emoatt at emoint-2017: Inner attention sentence embedding for emotion intensity.
- Miller (1995) George A Miller. 1995. Wordnet: a lexical database for english. Communications of the ACM, 38(11):39–41.
- Mohammad et al. (2018) Saif Mohammad, Felipe Bravo-Marquez, Mohammad Salameh, and Svetlana Kiritchenko. 2018. SemEval-2018 task 1: Affect in tweets. In Proceedings of the 12th International Workshop on Semantic Evaluation, pages 1–17, New Orleans, Louisiana. Association for Computational Linguistics.
- R and Wallbott (1994) Scherer K R and H G Wallbott. 1994. Evidence for universality and cultural variation of differential emotion response patterning. Journal of personality and social psychology vol. 66,2 (1994): 310-28. doi:10.1037//0022-3514.66.2.310.
- Saravia et al. (2018) Elvis Saravia, Hsien-Chi Toby Liu, Yen-Hao Huang, Junlin Wu, and Yi-Shin Chen. 2018. CARER: Contextualized affect representations for emotion recognition. In Proceedings of the 2018 Conference on Empirical Methods in Natural Language Processing, pages 3687–3697, Brussels, Belgium. Association for Computational Linguistics.
- Su et al. (2024) Jing Su, Chufeng Jiang, Xin Jin, Yuxin Qiao, Tingsong Xiao, Hongda Ma, Rong Wei, Zhi Jing, Jiajun Xu, and Junhong Lin. 2024. Large language models for forecasting and anomaly detection: A systematic literature review.
- Su et al. (2022) Yongye Su, Qian Liu, Wentao Xie, and Pingzhao Hu. 2022. Yolo-logo: A transformer-based yolo segmentation model for breast mass detection and segmentation in digital mammograms. Computer Methods and Programs in Biomedicine, 221:106903.
- Vijayakumar et al. (2018) Ashwin Vijayakumar, Michael Cogswell, Ramprasaath Selvaraju, Qing Sun, Stefan Lee, David Crandall, and Dhruv Batra. 2018. Diverse beam search for improved description of complex scenes. In Proceedings of the AAAI Conference on Artificial Intelligence, volume 32.
- Wei and Zou (2019) Jason Wei and Kai Zou. 2019. Eda: Easy data augmentation techniques for boosting performance on text classification tasks. arXiv preprint arXiv:1901.11196.
- West et al. (2022) Peter West, Chandra Bhagavatula, Jack Hessel, Jena D. Hwang, Liwei Jiang, Ronan Le Bras, Ximing Lu, Sean Welleck, and Yejin Choi. 2022. Symbolic knowledge distillation: from general language models to commonsense models.
- Wolf et al. (2020) Thomas Wolf, Lysandre Debut, Victor Sanh, Julien Chaumond, Clement Delangue, Anthony Moi, Pierric Cistac, Tim Rault, Rémi Louf, Morgan Funtowicz, Joe Davison, Sam Shleifer, Patrick von Platen, Clara Ma, Yacine Jernite, Julien Plu, Canwen Xu, Teven Le Scao, Sylvain Gugger, Mariama Drame, Quentin Lhoest, and Alexander M. Rush. 2020. Transformers: State-of-the-art natural language processing. In Proceedings of the 2020 Conference on Empirical Methods in Natural Language Processing: System Demonstrations, pages 38–45, Online. Association for Computational Linguistics.