Efficiency of Non-Thermal Pulsed Emission from Eight MeV Pulsars
Abstract
We report on the properties of pulsed X-ray emission from eight MeV pulsars using XMM-Newton, NICER, NuSTAR and HXMT data. For the five among eight MeV pulsars, the X-ray spectra can be fitted by a broken-power law model with a break energy of keV. The photon index below and above break energy are and , respectively. In comparison with the X-ray emission of the -LAT pulsars, the MeV pulsars have a harder spectrum and a higher radiation efficiency in 0.3-10 keV energy bands. By assuming the isotropic emission, the emission efficiency in the keV-MeV bands is estimated to be , and it is similar to the efficiency of GeV emission of the -LAT pulsars that have similar spin-down power. To explain the observed efficiency of the MeV pulsars, we estimate the required pair multiplicity as that depends on the emission process (curvature radiation or synchrotron radiation) and the location in the magnetosphere. The large multiplicity indicates that the secondary pairs that are created by a pair-creation process of the GeV photons produce the X-ray/soft gamma-ray emissions of the MeV pulsars. We speculate that the difference between the MeV pulsars and -LAT pulsars is attributed to the difference in viewing angle measured from the spin-axis, if the emission originates from a region inside the light cylinder (canonical gap model) or the difference in the inclination angle of the magnetic axis, if the emission is produced from equatorial current sheet outside the light cylinder.
1 Introduction
Since the launch of -Large Area Telescope (hereafter -LAT) in 2008, more than 300 gamma-ray emitting rotation-powered pulsars have been identified (Smith et al., 2023). The -LAT observations have revealed that the typical spectral energy distribution of the energetic pulsars shows a peak in the GeV bands. Moreover, the GeV/TeV observations also show that the observed pulsed gamma-rays from the pulsars are produced in the outer magnetosphere, because the gamma-ray photons produced near the stellar surface cannot avoid the pair-creation process with the strong magnetic field (Aliu et al., 2008; MAGIC Collaboration et al., 2020). The discovery of TeV pulsed emission from the Vela pulsar also supports this hypothesis (H. E. S. S. Collaboration et al., 2023). Either canonical gap model (Cheng et al., 1986; Arons, 1981) or the equatorial current sheet model (Lyubarskii, 1996; Cerutti et al., 2015; Chernoglazov et al., 2023) has been considered as the possible acceleration region in the outer magnetosphere.
The so-called MeV pulsars form a distinct group from the -LAT pulsars, based on their observed emission properties (Wang et al., 2014; Kuiper & Hermsen, 2015; Harding & Kalapotharakos, 2017; Kuiper et al., 2018). PSR B1509-58 located in the supernova remnant MSH 15-52 has been known as an energetic young pulsar since the high-energy observation in the Energetic Gamma-Ray Experiment Telescope era (Thompson et al., 1999). The -LAT observation confirms the pulsed emission from PSR B1509-58 in 0.1-1 GeV bands, but the spectrum from X-ray to GeV bands has a peaking at MeV, which is about three orders of magnitude smaller than that of the typical -LAT pulsars (Kuiper et al., 1999; Abdo et al., 2010). Kuiper et al. (2018) report the -LAT detection of PSR J1846-0258 and reveal that the spectral shape in the X-ray to GeV bands is similar to that of PSR B1509-58. Based on the spectral properties reported in Wang et al. (2014) and Kuiper & Hermsen (2015), we select the eight sources as the MeV pulsars. Table 1 summaries the spin-period , dipole magnetic field , the spin-down power , and the distance of the eight pulsars.
It has been revealed that the X-ray emission of the MeV pulsars has a distinct property from that of the -LAT pulsars. The X-ray emission of the -LAT pulsars is in general described by the thermal component from the neutron star surface and/or the non-thermal component that has a photon index of (Abdo et al., 2013; Hsiang & Chang, 2021). It has been discussed that the non-thermal X-ray emission is produced by the synchrotron radiation from the secondary electron/positron pairs that are produced by the pair-creation process of the GeV gamma-rays (Kisaka & Tanaka, 2017). For the MeV pulsars, on the other hand, the previous X-ray studies have collected evidences that the broadband X-ray spectrum is described by a single power law with a photon index of or a power law with a turnover in keV bands [see e.g. Chen et al. (2016), Hu et al. (2017) and references therein for PSR B1509-58, Kargaltsev et al. (2009) for PSR J1617-5055, Madsen et al. (2020) for PSR J1811-1925, Kuiper & Hermsen (2015) for PSR J1813-1749, Lin et al. (2009) and references therein for PSR J1838-0655, Gotthelf et al. (2021) for PSR J1846-0258, Gotthelf et al. (2011) and Kim et al. (2024) for PSR J1849-0001, and Lu et al. (2007) for PSR J1930+1852]. We also refer Kuiper & Hermsen (2015) for a comprehensive observational study of the hard X-ray/soft gamma-ray emissions of the young pulsars. Although several emission models have been proposed (Wang et al., 2013, 2014; Harding & Kalapotharakos, 2017), the emission process and even the emission region of the MeV pulsars are still not clearly understood.
In this paper, we revisit the X-ray analysis for the eight MeV pulsars using the data taken by XMM-Newton telescope, the Neutron Star Interior Composition Explorer (NICER), Nuclear Spectroscopic Telescope Array (NuSTAR), and Hard X-ray Modulation Telescope (HXMT). Main purpose of this study is (i) to estimate the efficiency of the non-thermal emission of the MeV pulsars (), which is the ratio of the luminosity in X-ray/soft gamma-ray bands to the spin-down power, and (ii) to compare it with the efficiency of the “GeV emission” () of the -LAT pulsars. The emission efficiency can be used to constrain the particle acceleration and emission processes. For the -LAT pulsars, for example, the efficiency of the GeV emission is correlated with the spin-down power () as and the origin of the correlation has been investigated with the emission model (Takata et al., 2010; Kalapotharakos et al., 2019). The emission efficiency can be linked with so-called multiplicity () that is the ratio of the number density of the emitting electrons/positrons over the Goldreich-Julian value, , where is the spin angular frequency, is the local magnetic field strength, is the speed of light and is the elementary charge (Goldreich & Julian, 1969). The required multiplicity to explain the observed efficiency can be used to investigate the emission process, too.
The paper is organized as follows. In section 2, we describe the data reduction of each telescope. In section 3, we estimate the efficiency of the non-thermal emission of the MeV pulsars by fitting the observed spectra. In section 4, we compare the efficiency of the MeV pulsars with that of the -LAT pulsars and we discuss the required multiplicity for different emission processes. Then we summarize our results in section 5. In this paper, we apply Gaussian-cgs units system to express the physical quantities.
| PSR | (ms) | (G) | (kpc) | |
|---|---|---|---|---|
| B1509-58 | 152 | 15 | 17 | 4.4 |
| J1617-5055 | 69.4 | 3.1 | 16 | 4.7 |
| J1811-1925 | 64.7 | 1.7 | 6.4 | 5.0 |
| J1813-1749 | 44.7 | 2.4 | 56 | 6.1 |
| J1838-0655 | 70.5 | 1.9 | 5.5 | 6.6 |
| J1846-0258 | 327 | 49 | 8.1 | 5.8 |
| J1849-0001 | 38.5 | 0.75 | 9.8 | 7.0a |
| J1930+1852 | 137 | 10 | 12 | 7.0 |
2 Data reduction
We download archival X-ray data from High Energy Astrophysics Science Archive Research Center111https://heasarc.gsfc.nasa.gov/cgi-bin/W3Browse/w3browse.pl and XMM-Newton Science Archive222http://nxsa.esac.esa.int/nxsa-web/. For PSR B1509-58, we also analyze the HXMT data, which is downloaded from the HXMT web333http://hxmten.ihep.ac.cn/. We use HEASoft version 6.32.1, FTOOL (Nasa High Energy Astrophysics Science Archive Research Center (Heasarc), 2014), XMM-Newton SAS version 21.0.0, and HXMTDAS. The information of the observations is summarized in Table A1-A3.
2.1 XMM-Newton
Because the MeV pulsars are usually located in their pulsar wind nebulae, it is required to carry out
a spin-phase resolved spectroscopy to extract the pulsed spectrum. For the XMM-Newton, therefore, we
analyze the data taken by PN-CCD (hereafter PN), because the timing resolution data taken by MOS-CCD is
insufficient for the MeV pulsars. We use the SAS task444https://www.cosmos.esa.int/web/xmm-newton/sas-threads epproc
to obtain the cleaned event file and then we apply the task barycen
to carry out barycentric correction for the arrival time of the each event (ephemeris DE 405). We remove epochs with background flaring by limiting the count rate above 10 keV to .
For each event file analyzed in this
study, we create -periodogram (Buccheri et al., 1983) and identify the periodic signal at the spin-frequency of the pulsar.
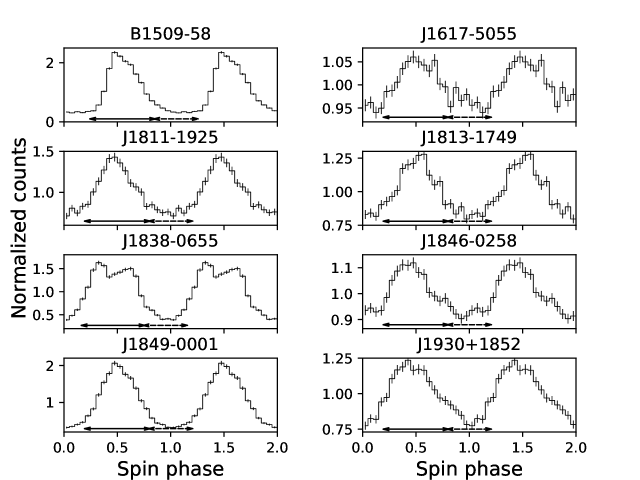
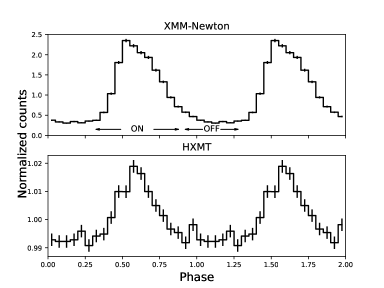
We fold each event file using the best frequency in each periodogram, and create the light curve to determine the on-pulse and off-pulse phases. For all pulsars in this study, the folded light curve is described by a single broad peak, such as the pulse profile of PSR B1509-58 in Figure 1 (Figure 8 for eight MeV pulsars).
We therefore define the on-pulse phase covering
60% of the single spin phase and
the off-pulse phase with other 40%, as indicated in Figures 1 and 8. We create the spectra of the on-pulse phase and the off-pulse phase, and obtained the spectrum of the pulsed component by subtracting the spectrum of the off-pulse phase from the spectrum of the on-pulse phase. For XMM-Newton data, we group the source spectrum such that each spectral bin has a minimum signal-to-noise ration of 3. We use the standard tasks of the SAS to generate the spectral file, response matrix file (rmf) and auxiliary response file (arf). We confirm with SAS command epatplot555https://www.cosmos.esa.int/web/xmm-newton/sas-thread-epatplot that the effect of the pile-up on the spectrum is negligible for the eight MeV pulsars.
2.2 NICER
NICER observed our targets except for PSRs J1617-5055 and J1930+1852. We apply nicerl2 to each data set to obtain the cleaned event file and we apply a
barycentric time correction to the created event file using the barycorr task of HEASoft. NICER repeatedly observes one target and the exposure of each observation is usually several kilo-seconds.
For each pulsar, we create a local ephemeris by combining several data sets; all ephemerides and obs. IDs
of the NICER data used in this study are summarized in Table A3. We also refer the ephemerides reported in Ho et al. (2020) for J1831-1749 and Hu et al. (2023) for J1846-0258
We merge the multiple observations using
the task niobsmerge666https://heasarc.gsfc.nasa.gov/docs/nicer/analysis_threads/combine-obs/. We create the good time interval files for on-pulse and off-pulse phases, and extract the events using extractor. We use niextspect to extract the spectrum from the event files, and create the rmf and arf from the merged event file using the task nicerl3-spect. We group the events so that each spectral bin contains a count of , since each channel before binning records a few
hundred events. We checked the different threshold of the photon counts for the binning and confirmed
that results of the fitting is insensitive to how we bin the data.
2.3 NuSTAR
First, we carry out the tasks nupipeline and nuproducts of HEASoft to obtain the clean event list after
barycentric time correction. In -periodogram, we can confirm the strong spin signal in the data extracted from the source region. We fold each data set with the best
frequency in -periodogram and create the good time interval files for on-pulse phase and off-pulse phase.
We rerun to the task nuproducts with the option usrgtifile and obtain the spectra of the on-pulse/off-pulse phases and response files (rmf and arf). Using the pipeline nuproducts, we group the on-pulsed spectra to ensure at least 100 counts per spectral bin, since each channel before binning records a few ten events.
2.4 HXMT
HXMT has three payloads [high-energy (20-250 keV), medium-energy (8-35 keV) and low-energy (1-12 keV) X-ray telescopes] and can cover a wide energy range in X-ray bands.
In this study, we use the data of the high-energy X-ray telescope of PSR B1509-58 taken in 2017 July (Obs. ID. P0101324001); we cannot find a significant pulsation in the data taken by medium- and low-energy telescopes. We apply the task hepical to remove spike events caused by electronic systems
and hegtigen to select good time interval file with the conditions that (i)
the pointing offset angle is smaller than , (ii) the pointing direction is
above Earth, (iii) the geomagnetic cut-off rigidity is bigger than GeV,
and (iv) the South Atlantic Anomaly does not occur within 300 s.
We use hxbary for the barycentric correction of the HXMT data, and we confirm a significant periodic signal in the data of the high-energy X-ray telescopes (Figure 1). We use the hspec-merge to merge the spectra and the response files extracted from the different data sets. For HXMT data, we group the on-pulsed spectra to ensure at least 1000 counts per spectral bin.
3 Results
In this section, we present the results of the spectral fitting for the pulsed components of the eight MeV pulsars.
We carry out a joint fit of the spectra taken by the four telescopes. Using Xspec,
we fit the spectra with a single power law model constant*tbabs*powerlaw (hereafter s-pl model) or a broken power law model constant*tbabs*bknpower (hereafter bk-pl model), where constant accounts for
cross-calibration mismatch among the telescopes. In previous studies (Cusumano et al., 2001; Chen et al., 2016; Hu et al., 2017), a
log-parabola (logpar) model, which is described by a function of with and being fitting parameters and the energy scale, is used to describe the curved X-ray spectrum of the MeV pulsars. In this study, the bk-pl model is preferred over the logpar model, because it is more intuitive to physically interpret. As we discussed in the following section 4.2.2, for example, we will use the fitting break energy of bk-pl model to constrain the multiplicity of the pairs.
In our analysis, we fix the constant factor
for the XMM-Newton observation at unity.
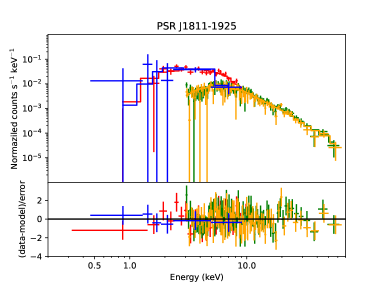
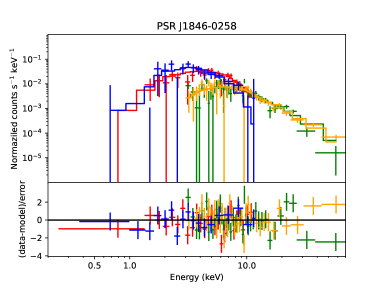
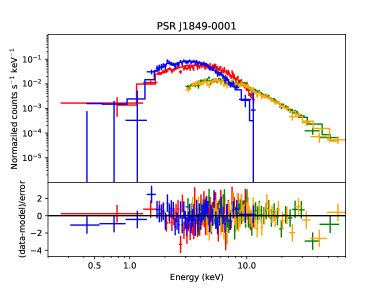
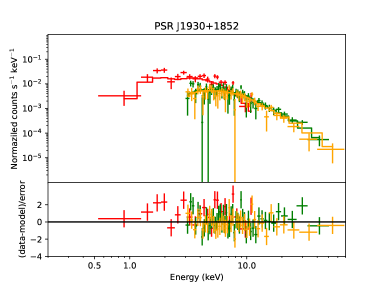
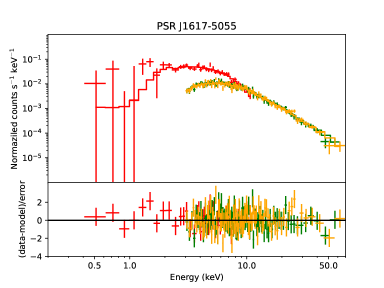
Figures 2 and 9-11 show the pulsed spectra for the eight pulsars.
Although we choose only one spectrum of each detector in the figure for the representation, we use more available data (as shown in Table A1-A3) for the spectral fitting and fit all spectra simultaneously; the Figures 2 and 9-11 represent the spectra taken by the earlier observation if there are multiple observations. Table 2 summarizes the results of the fitting spectral parameter, the estimated isotropic
luminosity, and its emission efficiency in 0.3-150 keV bands.
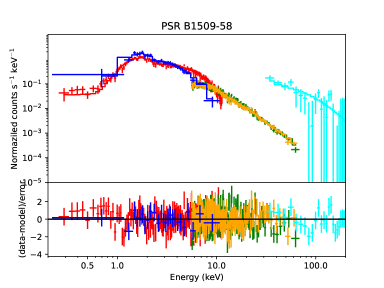
3.1 PSR B1509-58
For PSR B1509-58, there is one archival XMM-Newton data taken with the PN camera under the small widow mode, whose timing resolution ( ms777https://heasarc.gsfc.nasa.gov/docs/xmm/uhb/epicmode.html) is sufficient enough to carry out the phase-resolved spectroscopy. There are four data sets obtained by NuSTAR observations. NICER observed the target in 2017 July and August, for which we create local ephemerides to fold the data. The left panel of Figure 2 shows the extracted spectra of the pulsed component.
First we fit the spectrum with a s-pl model and obtain the hydrogen column density of and the photon index of with (Table 2).
We find that the predicted is higher than reported in the previous studies using Bepposax observation (Cusumano et al., 2001; Romani et al., 2023) (the previous studies used Phabs for the absorption model in Xspec, but we confirm that the fitting results are not sensitive to the absorption model and obtain a similar to current value).
Second, we fit the spectra with a bk-pl model. As Table 2 indicates, the improvement of the fitting from the s-pl model is significant with an static value of 32 (). The obtained hydrogen column density of is more consistent with the previous value. Our fitting indicates a spectral break at keV, and the photon index below and above the break are and , respectively. The photon index below the break energy is consistent with the previous Bepposax observation (Cusumano et al., 2001) and Chandra observation (Hu et al., 2017), in which a single power law model is applied to fit the observation data. The photon index above the break (), on the other hand, is larger than of the single power law fitting for NuSTAR data (Chen et al., 2016). If the hydrogen column density is fixed to of the previous value, the bk-pl fitting provides , keV and .
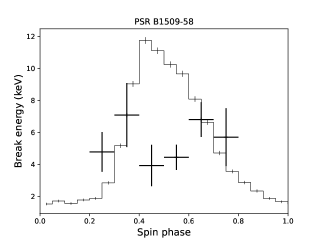
Because of enough count rate, we investigate the evolution of the break energy () in the bk-pl model with the spin-phase. We divide the on-pulsed phase (Figure 1) into six segments, and we fit each spectrum with a bk-pl model; during the fitting, we fix the hydrogen column density to . The left panel of Figure 3 shows the evolution of the break energy with the spin phase for PSR B1509-58. We can see that the break energy is almost constant with keV, although a small variation may exist.
We use cflux in Xspec to estimate the unabsorbed flux
in 0.3-10 keV bands for each fitting model and calculate the isotropic luminosity,
, where is the estimated flux and is the distance obtained from
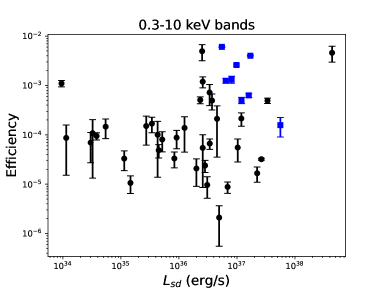
ATNF Pulsar Catalog (Manchester et al., 2005). Figure 4 compares the radiation
efficiency () in 0.3-10 keV bands of the MeV pulsar wind those of the -LAT pulsar
(see section 4.1.1 for a detailed discussion).
To evaluate the radiation efficiency in the wide energy bands, we also estimated
the efficiency in 0.3-150 keV using Xspec. We choose the maximum energy
of keV because there is no HXMT observations for other MeV pulsars and because Xspec extrapolates the flux up to 150 keV using the NuSTAR data and the assumed spectral shape.
The estimated luminosity and its efficiency () in 0.3-150 keV bands are summarized in Table 2. For PSR B1509-58, we obtain the
efficiency of in 0.3-150 keV bands.
| PSR | /D.O.F. | ||||||
|---|---|---|---|---|---|---|---|
| () | (keV) | ||||||
| B1509-58 | 1.32(5) | 1.41(1) | 2023.99/2023 | 6.1(2) | 3.8(1) | ||
| 1.0(2) | 1.1(2) | 5(2) | 1.43(3) | 1961.24/2021 | 5.7(4) | 3.3(2) | |
| J1617-5055 | 4.0(7) | 1.52(5) | 306.63/327 | 0.79(7) | 0.50(5) | ||
| J1811-1925 | 4.0(8) | 1.40(8) | 250.11/287 | 0.8(1) | 1.3(2) | ||
| J1813-1749 | 13(4) | 1.8(3) | 110.29/128 | 0.5(2) | 0.08(4) | ||
| J1838-0655 | 6.9(2) | 1.40(2) | 1201.15/1133 | 3.8(2) | 6.9(4) | ||
| 6.0(3) | 1.04(9) | 8.1(9) | 1.49(4) | 1151.75/1131 | 3.4(2) | 6.1(4) | |
| J1846-0258 | 6(2) | 1.4(1) | 569.09/560 | 1.3(4) | 1.6(4) | ||
| 5(2) | 1.0(3) | 10(5) | 1.5(1) | 565.53/558 | 0.7(2) | 0.9(2) | |
| J1849-0001 | 5.1(3) | 1.48(5) | 335.95/317 | 2.5(2) | 2.5(2)(f) | ||
| 4.0(9) | 0.8(4) | 4.9(8) | 1.50(6) | 319.16/315 | 2.3(3) | 2.3(2) | |
| J1930+1852 | 2.9(6) | 1.53(8) | 443.32/412 | 0.9(2) | 0.8(2) | ||
| 0.8(4) | 5(2) | 1.5(1) | 400.49/409 | 0.8(2) | 0.7(2) |
3.2 PSR J1657-5055
XMM-Newton observed the target with the timing-mode of the PN camera. The spin signal ms is confirmed in the -periodogram. Because of the one-dimensional imaging capability of the data taken by the timing mode, we select the pixels so that the extracted events maximize the power of the periodic signal. There is one archival data of the NuSTAR observation, but no observation has been carried out by the NICER. The right panel of Figure 2 shows the extracted spectrum of the pulsed component. The spectrum is well fitted by a s-pl model with and . We find that the best fitting hydrogen column density is slightly smaller than reported in Hare et al. (2021), in which only NuSTAR data is used. The photon index , on the other hand, is consistent with of the previous study. As the right panel of Figure 2 indicates, the quality of the data is insufficient to constrain the parameters of the bk-pl model.
The spectrum of the NuSTAR data covers the energy range up to keV, and no spectrum cut-off has been observed in 10-70 keV bands. By assuming that the spectrum above 70 keV extends with a single power law, we use to extrapolate the flux up to the energy 150 keV and obtain the efficiency of in 0.3-150 keV bands.
In the spectrum taken by NuSTAR in Figure 2, one may notice an absorption feature at keV, where the data points of both NuSTAR’s FPMA and FPMB detectors drop from the average of the residual. We will also observe a similar feature in the spectrum of PSR J1849-0001 with a higher significance level (section 3.7). In this study, we apply the Bayesian method to evaluate the absorption-line feature and utilize a python tool, Bayesian X-ray Analysis (BXA, Buchner et al., 2014). By grouping the NuSTAR’s spectra to ensure at least one count per spectral bin, a s-pl with Gaussian absorption model is compared with a pure s-pl model. For PSR J1617-5055, we find that
the inclusion of the absorption feature does not improve the fitting results and could not give an evidence of the absorption feature.
3.3 PSR J1811-1925
For PSR J1811-1925, there are one archival data taken by the XMM-Newton PN camera under the small window mode and one archival data by NuSTAR. We also use the NICER observations carried out in 2022 March to September. We fit the pulsed spectrum (Figure 9 and Table 2) with a s-pl model and obtains and , which is consistent with the previous study using Chandra and NuSTAR data (Madsen et al., 2020). Similar to PSR J1657-5055, the quality of the data is insufficient to constrain the parameters of the bk-pl model. The isotropic emission efficiency with the s-pl model is estimated to be in 0.3-150 keV bands.
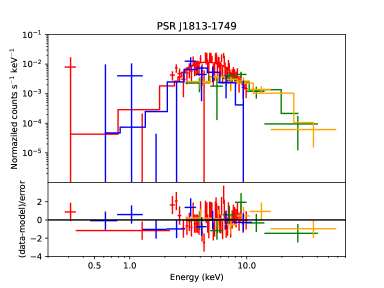
3.4 PSR J1813-1749
We use two archival data taken by the XMM-Newton PN camera under the small window mode and one archival data of NuSTAR. We also analyze the data of the NICER observation in 2019 June-August, and refer the ephemeris provided by Ho et al. (2020). The observed spectrum (Figure 9) is fitted by a s-pl model with a large column density of and photon index of . Because of the strong absorption, the observed spectrum cannot constrain the parameters of the bk-pl model. In order to compare with previous results, we fix the hydrogen column density to . The photon index of the s-pl model is , which is consistent with of the INTEGRAL observation reported in Kuiper & Hermsen (2015). The efficiency in 0.3-150 keV bands is estimated to be .
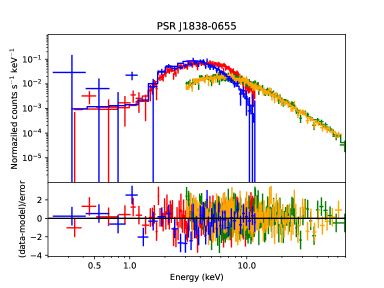
3.5 PSR J1838-0655
Both XMM-Newton and NuSTAR observed the source twice and the observations of the XMM-Newton PN were carried out under the small window mode. We also analyze the data of the NICER observations carried in 2019, 2020 and 2021. The observed spectrum (right panel in Figure 9) can be fitted by a s-pl model with hydrogen column density of and photon index of . We find in Table 2 that the bk-pl model significantly improves the fitting with an static value of 24 (). In the bk-pl model, we obtain a break energy of keV. The photon index below and above the energy break are and , respectively, which are consistent with the values reported in Lin et al. (2009), who analyze the Chandra, RXTE and the SUZAKU data. The current hydrogen column density, , is larger than obtained with Chandra observation (Gotthelf & Halpern, 2008), while it is consistent with obtained using SUZAKU data (Gotthelf & Halpern, 2008). We obtain the efficiency of in 0.3-150 keV bands, which is the highest among our targets.
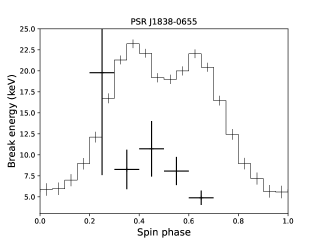
We perform the phase-resolved spectroscopy using the XMM-Newton and NuSTAR data. We extract the spectrum of 0.1 phase interval in the on-pulse phase and fit each spectrum with the bk-pl model by fixing the hydrogen column density to . The right panel of Figure 3 shows the evolution of the break energy with the spin phase. The break energy () in the wing of the pulsed shape ( and spin phase) cannot be constrained as the figure shows. With the large uncertainty, we cannot discuss the evolution of the break energy with the spin-phase. However, the break energy may be smaller at spin-phase of the right tip on the peak.
3.6 PSR J1846-0258
PSR J1846-0258 is known as a high-magnetic field pulsar and it experienced a magnetar-like X-ray outburst in 2006 (Gavriil et al., 2008) and in 2020 (Blumer et al., 2021b; Hu et al., 2023). The X-ray emission after the outburst is fitted by the thermal emission from the surface plus single power law tail in hard X-ray bands, and it shows the temporal evolution (Hu et al., 2023). Since we are interested in the emission in a quiescent state, we analyze the data taken before 2020 outburst. We use the data of the XMM-Newton observation (small window mode for PN) and NuSTAR observation carried out in 2017 September. We also generate the spectrum with the NICER data taken in 2018, 2019 and 2020, for which we refer to the ephemerides reported in Hu et al. (2023).
Our fitting parameters of the s-pl model ( and ) are consistent of previous study, (fixed) and (Gotthelf et al., 2021). The bk-pl model does not improve the fitting and its break energy, keV has a large error size. Because of the large uncertainty of the hydrogen column density, we fix it to determined by Chandra observation (Ng et al., 2008). For the bk-pl model, the results of the fitting are , , and , and hence the large uncertainty of the break energy remains. We estimate the emission efficiency as in 0.3-150 keV bands.
3.7 PSR J1849-0001
We use one archival data taken by the XMM-Newton PN camera under the small-window mode and one data taken by NuSTAR. For the NICER observation, we construct a local ephemeris for the 2018 data. Although Bogdanov et al. (2019) provide the ephemeris covering 2018 February to September, we extend the ephemeris to cover 2018 February to November. The right panel of Figure 11 shows the extracted spectrum of PSR J1849-0001.
The s-pl model provides an acceptable fitting result (Table 2), and its parameters are and . Although the obtained is smaller than reported in Kim et al. (2024), who use the same XMM-Newton and NuSTAR data as our study, the photon index is consistent with their within the error. The bk-pl model improves the fitting results with an -static value of 8.2 (), and the photon index () below the break energy ( keV) is consistent with in the previous studies (Gotthelf et al., 2011; Kuiper & Hermsen, 2015), in which XMM-Newton data is fitted by a s-pw model. The obtained is also consistent with of the previous study. Assuming the distance kpc to the source (Gotthelf et al., 2011), the efficiency in 0.3-150 keV bands is estimated to be .
Kim et al. (2024) suggest the existence of a peaking of the spectrum at keV, which is lower than MeV of PSRs B1509-58 and J1846-0258. As the left panel in Figure 11 shows, on the other hand, our extracted spectrum may indicate the feature of an absorption at around 40 keV rather than the peaking of the spectrum. In our study, we group the spectrum of the NuSTAR data at least 100 counts per spectral bin. The absorption-like feature in the spectrum becomes more obvious if we group the spectrum with smaller photon counts per spectral bin. Similar to the descriptions in section 3.2, we evaluate the absorption feature with BXA. We fit the NuSTAR spectra with a s-pl plus Gaussian absorption model, and obtain the energy () and width () of the Gaussian absorption line as and keV, respectively. We compare the s-pl with a Gaussian absorption line model with a pure s-pl model and obtain a Bayesian factor of , which is not large enough to claim the strong evidence of the absorption-line feature; a Bayesian factor of 10 is usually desired to confirm the absorption feature (Buchner et al., 2014). If the absorption future were real, the non-thermal emissions from PSR J1849-0001 would be likely produced in the region located near the neutron star surface. This is because such an absorption feature is possibly associated with a cyclotron absorption in a highly magnetized and dense region around the neutron star. Since the current data is not enough to draw any conclusion, it would be desired to investigate the absorption as well as peaking feature in the spectrum by a deeper observation.
3.8 PSR J1930+1852
XMM-Newton observed the target once under the large window mode and once under the full frame mode, for which the timing resolutions are still sufficient enough to carry out the phase-resolved spectroscopy for PSR J1930+1852. NuSTAR observed the target once, but NICER has not observed the target. As Table 2 shows, the observed spectrum (Figure 11) is fitted by a s-pl model with a photon index of . For the bk-pl model, the current data cannot constrain the hydrogen column density, and therefore we fix the value to determined by the Chandra observation (Temim et al., 2010). We obtain the parameters of , keV and . With the current large uncertainty, the photon index below the break energy is consistent with obtained by the Chandra observation (Lu et al., 2002; Temim et al., 2010). The estimated efficiency in 0.3-150 keV bands is .
4 Discussion
4.1 Comparison with -LAT pulsars
4.1.1 X-ray efficiency
Figure 4 compares the observed efficiency of the isotropic emission in 0.3-10 keV energy bands ) of the MeV pulsars with those of the -LAT pulsars, for which we refer the X-ray flux of the pulsars reported in the -LAT second pulsar catalog (Abdo et al., 2013); in our study, PSR B1509-58 is treated as a MeV pulsar, although it is listed in the LAT pulsar catalog. Since the -LAT catalog reports the phase-averaged value, we scale the pulsed flux of the MeV pulsars to the phase-average value by multiplying .
From Figure 4, we can see the tendency that currently known MeV pulsars are distributed in a narrower range of the spin-down power than the -LAT pulsars, and no MeV pulsars with is found. We find that the MeV pulsars have a larger efficiency than the averaged value () of the -LAT pulsars. There are six -LAT pulsars (Crab, PSRs J1119-6127, J1741-2054, J1747-2958, J1801-2451 and J2021+3651), who efficiency is greater than and has an efficiency similar to the MeV pulsars. We investigate the spectral properties of those -LAT pulsars in the literatures.
Among the -LAT pulsars, the Crab pulsar () has a unique broadband spectrum of the non-thermal emission. The spectrum has a photon index of in 0.1-10 keV bands, in 10-100 keV bands and in keV bands (Kuiper et al., 2001). The X-ray and soft -ray emissions of the Crab pulsars have been interpreted as a result of the synchrotron emission of the secondary pairs around the light cylinder (Takata & Chang, 2007; Harding & Kalapotharakos, 2015). The spectral evolution from X-ray to MeV bands of the Crab pulsar is different from those of the MeV pulsars (e.g. PSRs B1509-58. J1838-0655 and J1849-0001), in which the photon index below keV is and above (Table 2). Moreover, -LAT confirmed that the spectra of the two MeV pulsars, PSRs B1509-58 and J1846-0258, do not extend in the GeV energy band. These differences may suggest that the emission process and/or emission region of the MeV pulsars is different from that of the Crab pulsar.
For four -LAT pulsars (PSRs J1119-6127, J1741-2054, J1801-2451 and J2021+3651) with in 0.3-10 keV bands, the non-thermal X-ray spectrum is described with a photon index of (Van Etten et al., 2008; Ng et al., 2012; Karpova et al., 2014; Marelli et al., 2014; Coti Zelati et al., 2020; Blumer et al., 2021a; Woo et al., 2023), which is greater than of MeV pulsars. It may be worth to note that PSRs J1119-6127 of the -LAT pulsar and J1846-0258 of the MeV pulsar have been known as high-magnetic field pulsars, and they have experienced the magnetar-like X-ray outbursts (Gavriil et al., 2008; Göğüş et al., 2016; Archibald et al., 2017; Wang et al., 2020; Blumer et al., 2021b). Their spin-down properties are also resemble to each other; PSR J1119-6127 has ms, and . However, the X-ray emission properties in a quiescent state are different. The X-ray emission of PSR J1119-6127 is dominated by thermal component, of which the flux in 0.5-8 keV bands is a several factor more than that of the non-thermal component of (Ng et al., 2012). For PSR J1846-0258, on the other hand, the observed X-ray spectrum is described by a non-thermal emission, as we described in 3.6. The investigations of PSRs J1119-6127 and J1846-0258 will suggest that the pulsar spin-down parameter is not key parameters to differentiate between the -LAT pulsars and the MeV pulsars.
Finally, PSR J1747-2958 is the -LAT pulsar having the highest X-ray efficiency in Figure 4, and its pulsed X-ray emission is reported by Li et al. (2018). The X-ray emission from the pulsar region taken by the Chandra observation can be described by a non-thermal emission with a photon index of (Klingler et al., 2018; Li et al., 2018). The relatively hard X-ray spectrum with a high efficiency of PSR J1747-2958 is similar to the X-ray properties of the MeV pulsars. However, because PSR J1747-2958 is associated with bright pulsar wind nebula (so called Mouse), it cannot exclude the possibility that a phase-averaged spectrum reported in the previous studies is dominated by the nebula emission (Klingler et al., 2018); the phase-resolved spectroscopy is not carried out in the previous studies. We check the archival XMM-Newton PN data and NuSTAR data, but we could not confirm the pulsed emission in the periodogram. A deeper observation will be required to understand the X-ray emission properties of PSR J1747-2958.
4.1.2 Efficiency of total non-thermal pulsed emission
Multi-wavelength observations have revealed that the non-thermal pulsed emissions from the MeV pulsars and -LAT pulsars have in general the most radiation efficiency in MeV and 1-10 GeV bands, respectively. For PSR B1509-58 of the MeV pulsar, the observed flux in 100 keV-10 MeV bands (Kuiper et al., 1999) indicates that the isotropic efficiency increases by about factor of two to three from the value () reported in Table 2. By assuming that other MeV pulsars have a similar spectral behavior to PSR B1509-58, the typical efficiency of the MeV pulsar would be estimated to be ; the isotropic efficiency of PSR J1813-1749 could be still smaller than 0.01.
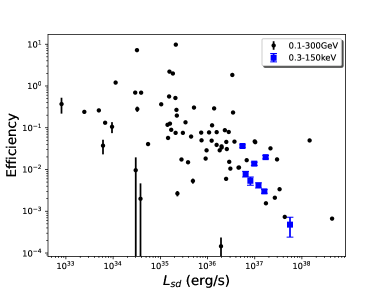
Since the efficiency () in the 0.3-150 keV bands in Table 2 represents, in order of magnitude, the total efficiency of the MeV pulsars, we compare the efficiencies of the eight MeV pulsars with the efficiencies in 0.1-300 GeV bands of the -LAT pulsars in Figure 5. We plot the efficiency mainly referred to the bk-pl model. If the spectra cannot be fitted by the bk-pl, we then derive the value from the s-pl model instead. We note that few -LAT pulsars appears with an efficiency greater than unity. This is likely due to over-estimated distance and/or the assumption of the isotropic radiation (Abdo et al., 2013).
Based on Figure 5, we may conclude that the efficiency of the total non-thermal pulsed emission of the MeV pulsars is similar to those of the -LAT pulsars having similar spin-down powers. Even though the total efficiency of the MeV pulsar could increase by a factor of two to three from the plotted values, it is still consistent with that of the -LAT pulsars. This similarity of the efficiency may suggest that the emission of the MeV pulsars is either (i) a primary emission but the maximum energy of the electrons/positrons is smaller than that of -LAT pulsars or (ii) a secondary emission from the electron/positron pairs, into which most of the primary GeV emission are converted.
4.2 Emission process
In the last section, we estimate that if the emission of the MeV pulsars are isotropic, the typical efficiency is . The actual radiation geometry will depend on various factors such as the emission process, inclination angle and the size of the emission region, and it is not trivial to determine the true efficiency from the observed flux. Since the observed pulsed width covers 60 % of the one rotation, the solid angle of the radiation may not be much smaller than the isotropic value of . Hence we assume the efficiency as a more conservative value. The actual efficiency could take an even smaller value, if the line of sight, the axis of the spin and axis of the radiation beam were almost aligned in the same direction. In this paper, however, we do not consider such a peculiar situation.
In the followings, we discuss either the possibility of the curvature radiation process or the synchrotron radiation process. The inverse-Compton process (IC process) can also produce the high-energy photons in the pulsar magnetosphere. For the young pulsars, however, it has been predicted that the energy of the scattered photons are in the TeV energy bands, which can explain the recent observation of the Vela pulsar (H. E. S. S. Collaboration et al., 2023). Ng et al. (2014) study non-thermal X-ray emission from the millisecond pulsars whose X-ray pulse is in phase with the gamma-ray pulse. They suggest that the IC process of the accelerated electrons (or positrons) off the radio wave produces the non-thermal X-ray emission. However, this model predicts an accompany of the GeV emission and is incompatible with the non-detection of the GeV emission of the MeV pulsars. We, therefore, will not discuss the IC process as the origin of the MeV pulsar’s emission in the following discussion.
4.2.1 Curvature radiation process
It is widely accepted that the GeV emission is produced in the region located near or beyond the light cylinder, because the GeV photons produced near the stellar surface cannot avoid the pair-creation process with the magnetic field. For canonical “gap” models of the pulsar magnetosphere (Cheng et al., 1986; Arons, 1981, eg.), the GeV emission is produced by the curvature radiation process, due to the bending of the magnetic field lines, of the primary electrons and/or positrons accelerated by the electric field along the magnetic field line. For this model, the number density in the acceleration region cannot be much bigger than the Goldreich-Julian value, . The characteristic energy and radiation power of the curvature radiation process from single electron (or positron) are provided by and , where is the Lorentz factor of the particles, is the Planck constant and is the curvature radius of the magnetic field line.
One can show that when the dynamical timescale is equal to the cooling timescale of the curvature radiation process, , the characteristic energy of the radiation is MeV, where the mass of an electron and is the fine structure constant. Hence, if the curvature radiation is the origin of the non-thermal emission in X-ray to soft -ray bands of the MeV pulsars, it will be taken place in a slow cooling regime.
In the slow cooling regime, the fraction of the energy of the particles that is released as the curvature radiation process during the dynamical timescale will be , which is for MeV of the MeV pulsars. If the emission efficiency of the non-thermal emission of the MeV pulsars is , it is necessary that % of the spin-down energy is converted into the particle energy within or near the light cylinder. Moreover, we can also show that the required multiplicity () and Lorentz factor to explain the observations ( MeV and ) are and , respectively. Such a high-multiplicity indicates that the emission originates from so-called “secondary” electrons/positrons that are created by the pair-creation process. To produce the population of the pairs with and , it will be required (i) the pair-creation process of most of an 0.1-1 TeV gamma-rays that are produced with an efficiency of or (ii) an acceleration of the secondary pairs if they are created by the GeV gamma-rays.
4.2.2 Synchrotron radiation
The GeV gamma-rays emitted in the magnetosphere could be converted into the electron and positron pairs by the photon-photon pair-creation process or magnetic pair-creation process. The created pairs can lose their energy via the synchrotron radiation, which is mainly taken place in the fast-cooling regime in the pulsar magnetosphere. In this section, we consider the possibility that the MeV emission originates from the synchrotron radiation from the created pairs. We will not discuss a detailed model of the pair-creation process, while we will estimate the required Lorentz factor (), pitch angle () and the multiplicity () of the pairs to explain the spectral properties if the magnetic field strength of the emission region is specified. Because of insignificant evolution of the pulse shape with the energy bands, we may make the following assumptions:
-
1.
Emission in X-ray to soft gamma-ray bands is produced by the same population of the pairs under the synchrotron cooling.
-
2.
The magnetic field strength and the pitch angle of the pairs do not vary in the emission region.
-
3.
The spectral break at keV bands is caused by either (3-i) the cooling timescale, , equaling to the dynamical timescale of or (3-ii) the pairs are already cooled down to the lowest Landau level before running .
For the case of (3-i), if the emission region is located at distance from the center of the neutron star, the required Lorentz factor () and pitch angle are
| (1) |
respectively, where is the magnetic field strength in the emission region. For the case of (3-ii), they are
| (2) |
respectively. The maximum Lorentz factor of the pairs, from which the synchrotron cooling starts, are estimated from
| (3) |
where is the peak energy in the spectral energy distribution, and MeV is assumed in this study. Because of the fast cooling regime, the luminosity of the synchrotron emission will be in the order of
| (4) |
where is the number of the pairs created per unit time. The “required” particle injection rate to explain the observed luminosity is
| (5) |
In this section, we calculate the required multiplicity, , from the ratio of to a particle injection rate from the polar cap of the Goldreich-Julian value, , where is the radius of the neutron star. By combining the equations (1) [or (2)], (3) and (5) and using the observed parameters of keV, MeV and , we can estimate , , and as a function of the magnetic field strength. We note that the required multiplicity is roughly proportional to if we apply the different values for and/or [see equation (6)].
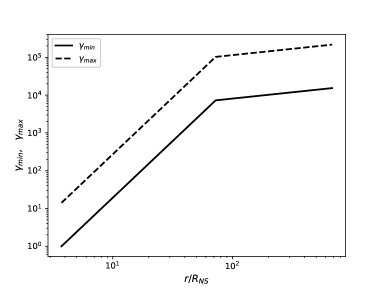
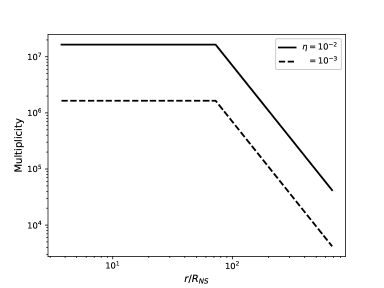
Figure 6 represents the expected (solid line) and (dashed line) for PSR B1509-58 as a function of the radial distance from the center of the neutron star, where we assume the dipole magnetic field of . Figure 7 shows the required multiplicity by assuming the emission efficiency of (solid line) and (dashed line), respectively; we do not plot for , since calculated with the dipole magnetic field for PSR B1509-58 becomes smaller than unity. In both figures, we can see a change in the slopes of the lines at about . This is because that the parameters are determined by the equation (1) for , while it is determined by the equation (2) for . As Figure 7 shows, we can find that the required multiplicity in for the case (3-ii) is independent on the magnetic field strength of the emission region, and it is expressed by
| (6) |
We can see in Figure 7 that the required multiplicity when the emission region is located at is . Such a large pair-multiplicity will be realized only by pair-creation cascade developed in a region near the stellar surface. For example, Timokhin & Harding (2019) theoretically investigate the cascade process of the polar cap accelerator and estimate the maximum possible multiplicity as , although the predicted multiplicity depends on the electric current structure of the acceleration region; for example, the polar cap model penetrated by a return electric current produces a multiplicity of one or two orders of magnitude smaller than (Timokhin & Harding, 2015). As indicated by Figure 7, therefore, if the efficiency of PSR B1509-58 is and the emission originates from , the multiplicity being comparable to or more than the predicted maximum possible value will be required. We note that the difference in the estimated multiplicities of the different MeV pulsars is by several factors, assuming the efficiency is a constant.
The pair-creation cascade near the stellar surface can be also initiated if the inward GeV emission produced in the outer magnetosphere irradiates the strong magnetic field region near the stellar surface (Zhang & Cheng, 1997; Lin et al., 2009). Such a cascade model can create the pairs with a rate of , where is the efficiency of the inward GeV emission and is the maximum photon energy that can escape from the cascade region. Assuming and MeV, the multiplicity can be of the order of . Uncertainty of the cascade model of the inward emission is the efficiency of the GeV emission and how fraction of the inward emission irradiates near the stellar surface; a detailed modeling will be necessary (Wang et al., 2014). This model predicts that the viewing angle for the MeV pulsar is closer to the spin axis to avoid the GeV emission from the outer magnetosphere.
For PSR B1509-58, the energy corresponding to the cyclotron frequency with G is keV. The current synchrotron emission model, therefore, expects that the emission region is located at , as indicated in Figure 6. It may be difficult to realize the multiplicity in the pair-creation cascade developed at due to the weaker magnetic field strength (Timokhin & Harding, 2019). Hence if the observed emission originates from with a multiplicity (), the emitting pairs must be created in the region located near the stellar surface. Moreover, the pairs created near the surface immediately lose the perpendicular momentum by the synchrotron radiation. Hence, an additional energy injection processed at the vicinity of the emission region is required to gain the perpendicular momentum. For example, Harding & Kalapotharakos (2015) argue that the pairs streaming from the polar cap region gains the pitch angles through the resonant cyclotron absorption of radio waves.
As Figures 6 and 7 show, the required particle multiplicity decreases as the emission region moves farther away from the neutron star, while the required Lorentz factor increases. For example, if the emission is produced near the light cylinder, the maximum Lorentz factor of the pairs is of the order of . To explain the MeV pulsar’s emission with the synchrotron emission of the pairs created outer magnetosphere, GeV of the photon energy with an emission efficiency will be required. Such an emission component has not been observationally and theoretically predicted. Hence, we still need to invoke an energy injection to the pairs that happen in the outer magnetosphere.
As we have seen that if the emission of the MeV pulsars originates from the synchrotron radiation from the region inside the light cylinder, the primary GeV emission, which is produced in either the polar cap region or outer magnetosphere, is necessary to create the electron/positron pairs. Within this framework of the scenario, therefore, it is not unexpected that the MeV pulsars also produce a GeV emission in the outer magnetosphere, which does not direct toward the Earth. Considering that the GeV emission in the outer magnetosphere will be more concentrated to the equatorial plane (Watters & Romani, 2011; Kalapotharakos et al., 2018), we speculate that the MeV pulsars have in general a smaller viewing angle than that of the -LAT pulsars, as suggested by Wang et al. (2014).
We note that the pulse profile of the non-thermal X-ray emission from the -LAT pulsars (e.g. the Vela pulsar and Crab pulsar) show, in general, narrow and multiple peaks (Kuiper & Hermsen, 2015; Kargaltsev et al., 2023). This feature of the pulse profile is different from the signal broad peak of the MeV pulsars. The difference in the pulse profile may also indicate that the viewing geometry and/or the emission region of the MeV pulsars is different from those of the -LAT pulsars.
4.2.3 Emission from the current sheet
It has been discussed that the current sheet in equatorial plane beyond the light cylinder is the origin of the high-energy emission from the pulsars (Cerutti et al., 2016; Hakobyan et al., 2023; Chernoglazov et al., 2023). In this section, therefore, we estimate the required multiplicity () of the MeV pulsars with a current sheet model for the MeV pulsars. For the particle acceleration due to the magnetic reconnection at the current sheet, the typical energy with the Lorentz factor of the particles may be obtained from the relation that (Lyubarskii, 1996; Chernoglazov et al., 2023)
| (7) |
where is the Lorentz factor of the the bulk flow of the electron/positron pairs, is the Lorentz factor of the pairs in the flow rest frame and is the magnetic field strength at the light cylinder. The characteristic energy of the synchrotron radiation from the current sheet is written as
| (8) |
Using the equations (7) and (8), the multiplicity is estimated from
| (9) | |||||
where we scale the value using the typical bulk Lorentz factor of (Lyubarskii, 1996) and the pulsar parameters of PSR B1509-58. For MeV pulsars, the multiplicity with will be required if the emission originates from the current sheet.
The rate of the energy injection to the particles from the current sheet may be written as (Lyubarskii, 1996)
| (10) |
where is the radial extent of the energy dissipation region and represents the sheet width that may be described by , where and is the classical electron radius and gyrofrequency, respectively. By anticipating that the energy injection rate of the equation (10) corresponds to the radiation luminosity, , the required radial size of the current sheet is estimated to be
| (11) | |||||
which will provide a reasonable size of .
For the current sheet model, the difference between -LAT and MeV pulsars will be attributed to the difference in the multiplicities of the pairs injected into the current sheet. The equation (9) implies that the multiplicity for the -LAT pulsar is of the order of with a photon energy of GeV, and it is more than one order of magnitude smaller than that of the MeV pulsar. A young pulsar may be observed as a MeV pulsar if the multiplicity of the current sheet is , while it becomes a GeV pulsar if . One possibility of such a difference in the injected multiplicity is the difference in the inclination angle of the magnetic axis from the spin axis. As we described in section 4.2.2, the large multiplicity of can be realized in the cascade process in the polar cap region. Although a detailed study is required, (i) the number of the created pairs in the polar cap region will depend on the magnetic field lines and (ii) how fraction of the created pairs injected into the current sheet depends on the magnetic inclination angle. Intuitively, since a pulsar with a larger magnetic inclination has a smaller angle between the magnetic axis and equatorial plane, it may inject more pairs to the equatorial current sheet. The typical inclination angle of the MeV pulsar, therefore, may be greater than that of the -LAT pulsars. It will be worth to carry out the study of the polar cap cascade process with the effect of the magnetic inclination angle to investigate this possibility.
5 Summary
We reported on the pulsed X-ray emission properties of the MeV pulsars, as measured by XMM-Newton, NICER, NuSTAR and HXMT. We fit the broadband X-ray spectra with the s-pl model and bk-pl model. For bk-pl model, the spectrum below the break energy ( keV) shows a hard spectrum with a photon index of , while it above the break energy is (Table 2). In comparison with the X-ray emission of the -LAT pulsars, the MeV pulsars have in general a harder spectrum and a higher efficiency in 0.3-10 keV energy bands. By assuming the isotropic emission, we found that total efficiency of the non-thermal emission of the MeV pulsars can reach to , which is similar to the GeV efficiency of the -LAT pulsars having a similar spin-down power.
We discussed the curvature radiation and synchrotron radiation as a possible emission process of the MeV pulsars. For the curvature radiation process, it was shown that % of the energy conversion efficiency from the spin-down power to the secondary pairs are required if the emission efficiency is . For the synchrotron radiation inside the right cylinder, if the emission region is , the required multiplicity is for , while for . Such a large pair-multiplicity will be realized only by the pair-creation cascade developed near the stellar surface. If the synchrotron emission in the outer magnetosphere is the origin of the emission of the MeV pulsars, an energy injection to the secondary pairs is necessary. We speculate that if the emission of the MeV pulsars originates from the region inside the magnetosphere, the observer’s viewing angle of the MeV pulsars is closer to the spin axis than that of the -LAT pulsars.
We also discussed the synchrotron emission of the pairs from the current sheet and estimated the required multiplicity as for the MeV pulsars. We argued that based on the current sheet model, the difference between the MeV pulsars and -LAT pulsars is attributed to the difference in the multiplicity of the pairs injected to the current sheet. We speculated that the MeV pulsars have a larger magnetic inclination angle, and inject more pairs to the current sheet than the -LAT pulsars.
We thank to referee for his/her useful comments and suggestions. We acknowledge discussion with Dr S. Shibata, K.S. Cheng, H.K. Chang, and C.P. Hu. We also thanks for Dr. Y.Tou’s help with the HXTM data analysis. This work has made use of the data from the Insight-HXMT mission, a project funded by China National Space Administration (CNSA) and the Chinese Academy of Sciences (CAS). J.T. is supported by the National Key Research and Development Program of China (grant No. 2020YFC2201400) and the National Natural Science Foundation of China (grant No. U1838102, 12173014). L.C.-C.L. is supported by NSTC through grants 110-2112-M-006-006-MY3 and 112-2811-M-006-019. H.H.W. is supported by the Scientific Research Foundation of Hunan Provincial Education Department (21C0343). S.K. was financially supported by Japan Society for the Promotion of Science Grants-in-Aid for Scientific Research (KAKENHI) Grant Numbers, JP21H01078, JP22H01267, and JP22K03681.
Data Availability
XMM-Newton, NICER and NuSTAR data can obtained from High Energy Astrophysics Science Archive Research Center (https://heasarc.gsfc.nasa.gov/)and HXMT data can be obtained from HXMT website (http://hxmten.ihep.ac.cn).
References
- Abdo et al. (2010) Abdo, A. A., Ackermann, M., Ajello, M., et al. 2010, ApJ, 714, 927
- Abdo et al. (2013) Abdo, A. A., Ajello, M., Allafort, A., et al. 2013, ApJS, 208, 17
- Aliu et al. (2008) Aliu, E., Anderhub, H., Antonelli, L. A., et al. 2008, Science, 322, 1221
- Archibald et al. (2017) Archibald, R. F., Burgay, M., Lyutikov, M., et al. 2017, ApJ, 849, L20
- Arons (1981) Arons, J. 1981, in Pulsars: 13 Years of Research on Neutron Stars, ed. W. Sieber & R. Wielebinski, Vol. 95, 69–85
- Blumer et al. (2021a) Blumer, H., Safi-Harb, S., Borghese, A., et al. 2021a, ApJ, 917, 56
- Blumer et al. (2021b) Blumer, H., Safi-Harb, S., McLaughlin, M. A., & Fiore, W. 2021b, ApJ, 911, L6
- Bogdanov et al. (2019) Bogdanov, S., Ho, W. C. G., Enoto, T., et al. 2019, ApJ, 877, 69
- Buccheri et al. (1983) Buccheri, R., Bennett, K., Bignami, G. F., et al. 1983, A&A, 128, 245
- Buchner et al. (2014) Buchner, J., Georgakakis, A., Nandra, K., et al. 2014, A&A, 564, A125
- Cerutti et al. (2015) Cerutti, B., Philippov, A., Parfrey, K., & Spitkovsky, A. 2015, MNRAS, 448, 606
- Cerutti et al. (2016) Cerutti, B., Philippov, A. A., & Spitkovsky, A. 2016, MNRAS, 457, 2401
- Chen et al. (2016) Chen, G., An, H., Kaspi, V. M., et al. 2016, ApJ, 817, 93
- Cheng et al. (1986) Cheng, K. S., Ho, C., & Ruderman, M. 1986, ApJ, 300, 500
- Chernoglazov et al. (2023) Chernoglazov, A., Hakobyan, H., & Philippov, A. 2023, ApJ, 959, 122
- Coti Zelati et al. (2020) Coti Zelati, F., Torres, D. F., Li, J., & Viganò, D. 2020, MNRAS, 492, 1025
- Cusumano et al. (2001) Cusumano, G., Mineo, T., Massaro, E., et al. 2001, A&A, 375, 397
- Gavriil et al. (2008) Gavriil, F. P., Gonzalez, M. E., Gotthelf, E. V., et al. 2008, Science, 319, 1802
- Goldreich & Julian (1969) Goldreich, P., & Julian, W. H. 1969, ApJ, 157, 869
- Gotthelf & Halpern (2008) Gotthelf, E. V., & Halpern, J. P. 2008, ApJ, 681, 515
- Gotthelf et al. (2011) Gotthelf, E. V., Halpern, J. P., Terrier, R., & Mattana, F. 2011, ApJ, 729, L16
- Gotthelf et al. (2021) Gotthelf, E. V., Safi-Harb, S., Straal, S. M., & Gelfand, J. D. 2021, ApJ, 908, 212
- Göğüş et al. (2016) Göğüş, E., Lin, L., Kaneko, Y., et al. 2016, ApJ, 829, L25
- H. E. S. S. Collaboration et al. (2023) H. E. S. S. Collaboration, Aharonian, F., Ait Benkhali, F., et al. 2023, Nature Astronomy, doi:10.1038/s41550-023-02151-1
- Hakobyan et al. (2023) Hakobyan, H., Philippov, A., & Spitkovsky, A. 2023, ApJ, 943, 105
- Harding & Kalapotharakos (2015) Harding, A. K., & Kalapotharakos, C. 2015, ApJ, 811, 63
- Harding & Kalapotharakos (2017) Harding, A. K., & Kalapotharakos, C. 2017, in Proceedings of the 7th International Fermi Symposium, 6
- Hare et al. (2021) Hare, J., Volkov, I., Pavlov, G. G., Kargaltsev, O., & Johnston, S. 2021, ApJ, 923, 249
- Ho et al. (2020) Ho, W. C. G., Guillot, S., Saz Parkinson, P. M., et al. 2020, MNRAS, 498, 4396
- Hsiang & Chang (2021) Hsiang, J.-Y., & Chang, H.-K. 2021, MNRAS, 502, 390
- Hu et al. (2017) Hu, C.-P., Ng, C. Y., Takata, J., Shannon, R. M., & Johnston, S. 2017, ApJ, 838, 156
- Hu et al. (2023) Hu, C.-P., Kuiper, L., Harding, A. K., et al. 2023, ApJ, 952, 120
- Kalapotharakos et al. (2018) Kalapotharakos, C., Brambilla, G., Timokhin, A., Harding, A. K., & Kazanas, D. 2018, ApJ, 857, 44
- Kalapotharakos et al. (2019) Kalapotharakos, C., Harding, A. K., Kazanas, D., & Wadiasingh, Z. 2019, ApJ, 883, L4
- Kargaltsev et al. (2023) Kargaltsev, O., Hare, J., & Lange, A. 2023, arXiv e-prints, arXiv:2312.03198
- Kargaltsev et al. (2009) Kargaltsev, O., Pavlov, G. G., & Wong, J. A. 2009, ApJ, 690, 891
- Karpova et al. (2014) Karpova, A., Danilenko, A., Shibanov, Y., Shternin, P., & Zyuzin, D. 2014, ApJ, 789, 97
- Kim et al. (2024) Kim, C., Park, J., Woo, J., et al. 2024, ApJ, 960, 78
- Kisaka & Tanaka (2017) Kisaka, S., & Tanaka, S. J. 2017, ApJ, 837, 76
- Klingler et al. (2018) Klingler, N., Kargaltsev, O., Pavlov, G. G., et al. 2018, ApJ, 861, 5
- Kuiper & Hermsen (2015) Kuiper, L., & Hermsen, W. 2015, MNRAS, 449, 3827
- Kuiper et al. (2001) Kuiper, L., Hermsen, W., Cusumano, G., et al. 2001, A&A, 378, 918
- Kuiper et al. (2018) Kuiper, L., Hermsen, W., & Dekker, A. 2018, MNRAS, 475, 1238
- Kuiper et al. (1999) Kuiper, L., Hermsen, W., Krijger, J. M., et al. 1999, A&A, 351, 119
- Li et al. (2018) Li, J., Torres, D. F., Coti Zelati, F., et al. 2018, ApJ, 868, L29
- Lin et al. (2009) Lin, L. C.-C., Takata, J., Hwang, C.-Y., & Liang, J.-S. 2009, MNRAS, 400, 168
- Lu et al. (2007) Lu, F., Wang, Q. D., Gotthelf, E. V., & Qu, J. 2007, ApJ, 663, 315
- Lu et al. (2002) Lu, F. J., Wang, Q. D., Aschenbach, B., Durouchoux, P., & Song, L. M. 2002, ApJ, 568, L49
- Lyubarskii (1996) Lyubarskii, Y. E. 1996, A&A, 311, 172
- Madsen et al. (2020) Madsen, K. K., Fryer, C. L., Grefenstette, B. W., et al. 2020, ApJ, 889, 23
- MAGIC Collaboration et al. (2020) MAGIC Collaboration, Acciari, V. A., Ansoldi, S., et al. 2020, A&A, 643, L14
- Manchester et al. (2005) Manchester, R. N., Hobbs, G. B., Teoh, A., & Hobbs, M. 2005, AJ, 129, 1993
- Marelli et al. (2014) Marelli, M., Belfiore, A., Saz Parkinson, P., et al. 2014, ApJ, 790, 51
- Nasa High Energy Astrophysics Science Archive Research Center (2014) (Heasarc) Nasa High Energy Astrophysics Science Archive Research Center (Heasarc). 2014, HEAsoft: Unified Release of FTOOLS and XANADU, Astrophysics Source Code Library, record ascl:1408.004, ascl:1408.004
- Ng et al. (2012) Ng, C. Y., Kaspi, V. M., Ho, W. C. G., et al. 2012, ApJ, 761, 65
- Ng et al. (2008) Ng, C. Y., Slane, P. O., Gaensler, B. M., & Hughes, J. P. 2008, ApJ, 686, 508
- Ng et al. (2014) Ng, C. Y., Takata, J., Leung, G. C. K., Cheng, K. S., & Philippopoulos, P. 2014, ApJ, 787, 167
- Romani et al. (2023) Romani, R. W., Wong, J., Di Lalla, N., et al. 2023, ApJ, 957, 23
- Smith et al. (2023) Smith, D. A., Abdollahi, S., Ajello, M., et al. 2023, ApJ, 958, 191
- Takata & Chang (2007) Takata, J., & Chang, H. K. 2007, ApJ, 670, 677
- Takata et al. (2010) Takata, J., Wang, Y., & Cheng, K. S. 2010, ApJ, 715, 1318
- Temim et al. (2010) Temim, T., Slane, P., Reynolds, S. P., Raymond, J. C., & Borkowski, K. J. 2010, ApJ, 710, 309
- Thompson et al. (1999) Thompson, D. J., Bailes, M., Bertsch, D. L., et al. 1999, ApJ, 516, 297
- Timokhin & Harding (2015) Timokhin, A. N., & Harding, A. K. 2015, ApJ, 810, 144
- Timokhin & Harding (2019) —. 2019, ApJ, 871, 12
- Van Etten et al. (2008) Van Etten, A., Romani, R. W., & Ng, C. Y. 2008, ApJ, 680, 1417
- Wang et al. (2020) Wang, H. H., Lin, L. C. C., Dai, S., et al. 2020, ApJ, 902, 96
- Wang et al. (2014) Wang, Y., Ng, C. W., Takata, J., Leung, G. C. K., & Cheng, K. S. 2014, MNRAS, 445, 604
- Wang et al. (2013) Wang, Y., Takata, J., & Cheng, K. S. 2013, ApJ, 764, 51
- Watters & Romani (2011) Watters, K. P., & Romani, R. W. 2011, ApJ, 727, 123
- Woo et al. (2023) Woo, J., An, H., Gelfand, J. D., et al. 2023, ApJ, 954, 9
- Zhang & Cheng (1997) Zhang, L., & Cheng, K. S. 1997, ApJ, 487, 370
Appendix A Information of observations
We summarize the information of the XMM-Newton observation in Table A1 and of the NuSTAR/HXMT observations in Table A2. Table A3 summarizes the NICER observations and the local ephemerides used in this study.
| PSR | Obs. ID | Mode | Date | Exposure (ks) |
|---|---|---|---|---|
| B1509-58 | 0128120401 | Small | 2000 Sep 7 | 25 |
| J1617-5055 | 0113050701 | Timing | 2001 Sep 3 | 19 |
| J1811-1925 | 0113050401 | Small | 2002 Mar 29 | 28 |
| J1813-1749 | 0552790101 | Small | 2009 Mar 27 | 99 |
| 0650310101 | Small | 2011 Mar 13 | 22 | |
| J1838-0655 | 0552950101 | Small | 2008 Oct 16 | 63 |
| 0852240101 | Small | 2019 Oct 18 | 91 | |
| J1846-0258 | 0795650101 | Small | 2017 Sep 20 | 53 |
| J1849-0001 | 0651930201 | Small | 2011 Mar 23 | 54 |
| J1930+1852 | 0406730101 | Large | 2006 Sep 26 | 54 |
| 0762980101 | Full Frame | 2016 Mar 27 | 110 |
| PSR | Obs. ID | Date | Exposure (ks) |
|---|---|---|---|
| NuSTAR | |||
| B1509-58 | 40024004002 | 2013 Jun 7 | 43 |
| 40024002001 | 2013 Jun 8 | 43 | |
| 40024003001 | 2013 Jun 9 | 44 | |
| 40024001002 | 2013 Aug 15 | 34 | |
| J1617-5055 | 30301013002 | 2018 Apr 29 | 133 |
| J1811-1925 | 90201027002 | 2016 Jun 22 | 91 |
| J1813-1749 | 30364003002 | 2018 Mar 25 | 26 |
| J1838-0655 | 3050101300 | 2019 Oct 17 | 114 |
| 30501013004 | 2019 Oct 21 | 53 | |
| J1846-0258 | 40301004002 | 2017 Sep 17 | 95 |
| J1849-0001 | 40660005001 | 2020 Nov 24 | 57 |
| J1930+1852 | 40101006002 | 2016 Mar 27 | 54 |
| 40201012002 | 2016-07-02 | 80 | |
| HXMT | |||
| B1509-58 | P0101324001 | 2017 Jul | 7 |
| PSR | Obs. IDsa | ||||
|---|---|---|---|---|---|
| MJD | |||||
| B1509-58 | 0020020[108-110] | 6.582208(4) | - | - | 57936.57452294 |
| 0020020[111, 112, 115] | 6.582218(1) | - | - | 57943.05156161 | |
| 0020020116, 1020020[101,102] | 6.5820573(9) | - | - | 57954.34843163 | |
| J1811-1925 | 550504[0401, 0601-0605, 0701-1202] | 15.45439494(6) | -1.1070(4) | 8.2(2) | 59769.19550730 |
| J1813-1749b | 2579030[102-306] | 22.351083818(17) | -6.4283(22) | 58681.04405093 | |
| J1838-0655 | 251602[0101-0301, 0501-1102] | 14.18127712(6) | -1.0092(3) | 28.9(2) | 58626.10906066 |
| 359802[0301, 0601, 0801, 1001] | 14.18092139(8) | -1.1032(6) | -344.3(5) | 59013.35265278 | |
| 460701[0801-1101] | 14.1806308(1) | -1.041(2) | -7(2) | 59399.79907331 | |
| J1846-0258c | 251601[0902-11601], 3598010[101-701] | 3.038892369(2) | -6.60460(3) | 5.72(9) | 58893.0 |
| J1849-0001 | 1020660[101-127, 132-134, 137-151, 155-178] | 25.95900556(4) | -0.9543(2) | 0.98(8) | 58254.80950424 |
Appendix B Pulse profiles and spectra of the pulsed emissions
Figure 8 represent the pulse profiles of eight MeV pulsars measured by the XMM-Newton observations. The sold and dashed arrows in the figures indicate the on-pulse and off-pulse phase intervals, respectively, to extract the phase-resolved spectra. Figures 9-11 present the spectra of the pulsed emission for PSRs J1811-1925, J1813-1749, J1838-0655, J1846-0258, J1849-0001 and J1930+1852, respectively.