The extreme coronal line emitter AT 2022fpx: Varying optical polarization properties and late-time X-ray flare
Abstract
Supermassive black holes have been known to disrupt passing stars, producing outbursts called tidal disruption events (TDEs). TDEs have recently gained attention due to their unique dynamics and emission processes, which are still not fully understood. Especially, the so-called optical TDEs, are of interest as they often exhibit delayed or obscured X-ray emission from the accretion disk, making the origin of the prompt emission unclear. In this paper, we present the optical photo-, spectro-, and polarimetry of a recent TDE candidate AT 2022fpx, in addition to accompanying monitoring observations in ultraviolet and X-rays. The optical spectra of AT 2022fpx show Bowen fluorescence as well as highly-ionized iron emission lines, which are characteristic of extreme coronal line emitters. Additionally, the source exhibits variable but low-polarized emission at the outburst peak, with a clear rotation of the polarization angle. X-ray emission observed later in the decay appear flare-like but is consistent with constant temperature black-body emission. The overall outburst decay is slower than for typical TDEs, and resembles more the ones seen from Bowen fluorescence flares. These observations suggest that AT 2022fpx could be a key source in linking different long-lived TDE scenarios. Its unique characteristics, such as the extreme coronal line emission, variable polarization, and the delayed X-ray flare, can be attributed to the outer shock scenario or a clumpy torus surrounding the supermassive black hole. Further studies, especially in the context of multi-wavelength observations, are crucial to fully understand the dynamics and emission mechanisms of these intriguing astrophysical events.
keywords:
black hole physics – galaxies: nuclei – polarization – shock waves – X-rays: galaxies1 Introduction
Tidal disruption events (TDEs), where a supermassive black hole (SMBH) disrupts structurally a passing star, are a recent and exciting addition to the population of mass-accreting astrophysical sources (Komossa & Bade, 1999; Donley et al., 2002). Recent optical monitoring programs, such as the Zwicky Transient Facility (ZTF), have significantly increased the number of known TDEs but, at the same time, challenged our understanding of their dynamics and emission processes (Gezari et al., 2012; van Velzen et al., 2021). Many of these ‘optical TDEs’ show X-ray emission only years after the optical peak indicating delayed or obscured emission from the accretion disk and leaving the origin of the prompt emission unclear (Gezari, 2021).
The most striking features in the TDE optical spectra are broad helium and/or hydrogen emission lines (e.g., Arcavi et al., 2014). However, it has become clear that higher ionization lines also exist in the spectra of some TDEs. Bowen fluorescence lines have been identified in hydrogen and helium-rich TDEs (e.g., Blagorodnova et al., 2019; Onori et al., 2019; van Velzen et al., 2021; Charalampopoulos et al., 2022; Wevers et al., 2022), and they are thought to originate from a hotter and more compact UV/optical photosphere (van Velzen et al., 2021). However, Bowen fluorescence lines are also observed in the case of ‘rejuvenated SMBHs’ (Trakhtenbrot et al., 2019). Subsequently, these events have been termed ‘Bowen Fluorescence Flares’ (BFFs; Makrygianni et al., 2023), encompassing several sources that exhibit long-lasting UV/optical emission persisting for several years, along with Bowen fluorescence lines (N III, O III), and broad hydrogen and helium emission lines with velocities of a few thousand kilometers per second.
In rare cases, even higher ionization lines than those of the Bowen lines have been observed from TDEs in the form of highly-ionized, or ‘coronal’, emission lines (Fe VII, Fe X, Fe XI, Fe XIII, and Fe XIV) (Onori et al., 2022; Short et al., 2023). The extreme ionization strength of these coronal lines suggests the presence of a strong extreme-UV or soft X-ray ionizing source within a gas-rich environment. Similar lines have been observed from the nuclear spectra of so-called extreme coronal line emitters (ECLEs; Komossa et al., 2008, 2009; Wang et al., 2011; Wang et al., 2012) – galactic nuclei that seem otherwise quiescent and not active. Recent comparisons of ECLE and TDE properties suggest that ECLEs are likely echoes of unobserved past TDEs in these galaxies (Hinkle et al., 2024; Clark et al., 2023; Callow et al., 2024).
Several scenarios have been proposed to explain the emission from optical TDEs. The prevailing ones include reprocessed X-ray emission by the obscuring, surrounding gas from the stellar debris (e.g., Roth et al., 2016) or radiatively driven wind (e.g., Metzger & Stone, 2016; Parkinson et al., 2022), and tidal stream shock powered emission (Shiokawa et al., 2015). In the latter scenario, intersecting stellar streams near the pericenter of the stellar orbit form a nozzle shock that dissipates orbital energy (Bonnerot & Lu, 2022). However, this energy loss is likely not enough to produce rapid circularization of the flow and the subsequent formation of the accretion disk (Piran et al., 2015; Steinberg & Stone, 2024). Instead, the stellar flow collides with itself further away from the black hole, producing strong shocks that can produce emission in the optical band.
Polarization observations of optical TDEs are scarce, with only a few significant detections available in the literature (Wiersema et al., 2012, 2020; Lee et al., 2020; Leloudas et al., 2022; Patra et al., 2022; Liodakis et al., 2023). Nevertheless, these observations hold the potential to distinguish between different accretion disk formation scenarios. In the reprocessing scenario, the polarization degree from an electron-scattering photosphere is low (a maximum of 6% in the most favorable conditions; Leloudas et al., 2022). Conversely, in the outer shock scenario, synchrotron emission arising from strong shocks can lead to a much higher polarization degree (up to 25%; Liodakis et al., 2023). Hybrid scenarios, based on collision-induced outflows, have also been proposed to explain the observed polarization behavior (Charalampopoulos et al., 2023a). However, the diverse polarization signatures found even in the limited number of TDEs studied so far present a challenge for current models to comprehensively explain.
1.1 AT 2022fpx
The transient AT 2022fpx (ATLAS22kjn, ZTF22aadesap, Gaia22cwy) was discovered on March 31, 2022 (MJD 59669) by the Asteroid Terrestrial-impact Last Alert System (ATLAS) with a discovery magnitude of 18.54 in the ATLAS/orange filter (Tonry et al., 2022). It was subsequently classified as a TDE candidate at a redshift of (Perez-Fournon et al., 2022). The event is associated with the nuclear region of the galaxy SDSS J153103.70532419.3. The peak r- and g-band magnitudes of 17.2 and 17.6, respectively, were reached on July 24, 2022 (MJD 59784), approximately 115 days after the discovery. Prior to the transient event, the long-term magnitude level has remained constant at around 20.1 mag in the Gaia g-band.
Based on optical monitoring of the event by several optical transient facilities, e.g., the Zwicky Transient Facility111https://lasair-ztf.lsst.ac.uk/objects/ZTF22aadesap/ (ZTF) and Gaia222http://gsaweb.ast.cam.ac.uk/alerts/alert/Gaia22cwy/, AT 2022fpx has remained relatively bright since the peak emission, showing a slow decay currently at 18.9 mag (r-band, 2024-01-18). The classification optical spectrum of AT 2022fpx presented by Perez-Fournon et al. (2022) in the Transient Name Server (TNS) exhibits strong but moderately broad hydrogen and ionized helium emission lines with maximum velocities of a few thousand km/s. The optical/UV spectrum appears also quite red, possibly indicating effects from reprocessing or obscuration.
The light curve behavior and spectral properties of AT 2022fpx deviate from the typical optical TDE light curve evolution, which exhibit faster decays, blue optical continua, and higher optical line velocities around 104 km/s (e.g., van Velzen et al., 2021; Charalampopoulos et al., 2022). However, it is noteworthy that the TNS spectrum was obtained relatively late in the event, approximately 85 days after the first detection of the transient. Consequently, it remains uncertain whether AT 2022fpx exhibited broader emission lines at early times. Also, at comparable times to the first spectrum for AT 2022fpx, there are TDEs that display similar line widths, such as ASASSN-14li (Brown et al., 2017). Overall, the observational characteristics of AT 2022fpx align more closely with the ’rejuvenated SMBH’ scenarios (Trakhtenbrot et al., 2019), and thus, AGN contribution cannot be ruled out.
In this paper, we present an optical spectrum obtained from the Nordic Optical Telescope (NOT), optical polarization observations from both the NOT and the Liverpool Telescope, and UV/X-ray observations from the Neil Gehrels Swift Observatory and XMM-Newton, taken during the transient event AT 2022fpx, along with publicly available optical photometric data from ZTF. Section 2 provides details on the observations and data reduction. In Section 3, we present the optical spectrum of AT 2022fpx, showing highly-ionized emission lines, in addition to Bowen, hydrogen, and helium lines, which indicate the source being an extreme coronal line emitter. We also derive and discuss the host galaxy properties. Further, we present the optical polarization properties of AT 2022fpx, demonstrating clear variability, along with optical/UV monitoring throughout the event. Additionally, we discuss the X-ray monitoring results, which indicate a late-time flare and spectral properties consistent with black-body emission. Section 4 delves into the discussion of the variable polarization, in addition to drawing comparisons with recent well-sampled TDEs sharing similar properties to AT 2022fpx. Finally, Section 5 concludes the paper. We utilize a flat cosmology with km s-1 Mpc-1 for our calculations.
2 Observations
2.1 Optical spectroscopy
In order to confirm the classification of AT 2022fpx we obtained an optical spectrum with the NOT+ALFOSC using the grism Gr4. The spectrum was reduced using the pypeit package (Prochaska et al., 2020b, a) and included overscan, bias and flat-field corrections, cosmic ray removal, spectral extaction, wavelength calibration using arc lamps; creation of a sensitivity function using a standard star observed on the same night; flux calibration with this sensitivity function; and telluric correction via fitting to a grid of atmospheric models.
2.2 Optical polarization
We observed AT 2022fpx using the Alhambra Faint Object Spectrograph and Camera (ALFOSC) at the NOT in 13 epochs during the transient event from MJD 59772.5 to MJD 60173 with irregular cadence. Observations were conducted in the Johnson R-, V-, and/or B-bands, employing the standard setup for linear polarization observations (lambda/2 retarder followed by a calcite).
The data were analyzed using the semi-automatic pipeline developed at the Tuorla Observatory (Hovatta et al., 2016; Nilsson et al., 2018). This pipeline follows standard procedures, where sky-subtracted target counts were measured in the ordinary and extraordinary beams using aperture photometry (with aperture radius sizes of 1.5” or 2.5” depending on the seeing). Normalized Stokes parameters, polarization degree (), and polarization angle () were calculated from intensity ratios of the two beams using standard formulas (e.g. Landi Degl’Innocenti et al., 2007).
Given the low level of polarization (see below), we conducted a set of simulations to validate our error estimates and identify any potential systematic effects that may not have been considered in our analysis chain. The standard dual-beam sequence should, in principle, be capable of canceling out any effects caused by the gain difference between the ordinary and extraordinary beams. However, some of our observations were made during a full moon, resulting in a relatively high and sometimes variable background.
Our flat-fielding procedure does not completely eliminate dust features, which could potentially be problematic during bright sky conditions. Therefore, we generated mock images with zero polarization degree for those epochs where significant polarization was detected. We analyzed these mock images exactly as the observed data. The mock data consisted of images whose number, size, noise parameters, background level, rate of background level change, and signal-to-noise ratio per beam accurately corresponded to the conditions of that particular epoch. The images were also multiplied by an image containing the residual dust features.
We created a hundred sets of images per epoch and computed the polarization degree as a function of the measurement aperture radius. The distribution of the polarization degree was then compared to the error bars returned by our analysis chain at each aperture radius. We found the distribution to be fully compatible with our error estimates and detected no systematic effects, even for the full moon data.
In addition to our observations, we supplemented our dataset with data from the Multicolour OPTimised Optical Polarimeter (MOPTOP), mounted at the 2-m Liverpool Telescope. MOPTOP features a dual-beam polarimeter with a continuously rotating half-wave plate, enabling quasi-simultaneous B-, V-, and R-band observations with a 77 arcsec2 field of view (Shrestha et al., 2020). MOPTOP observations were conducted from MJD 59816.9 to MJD 59868.8.
To enhance measurement accuracy, we combined adjacent observations by calculating a weighted average (with uncertainty) in Stokes-q and -u space. Subsequently, we converted these values to polarization degree and angle. If a 3 detection was not achieved, we increased the number of combined data points. This process allowed us to establish more robust 99.7% () confidence interval (C.I.) upper limits overall. The detected values were then corrected for the depolarizing effect of the host-galaxy light (Andruchow et al., 2008).
To estimate the brightness of the host, we converted the Panoramic Survey Telescope & Rapid Response System (Pan-STARRS) catalogue (DR2) mean PSF magnitudes of the galaxy to the Johnson B-, V-, and R-band magnitudes using the formulae from Tonry et al. (2012), determining pre-event mean values of 20.290.04, 19.330.02 mag, and 18.780.02 mag, respectively. The PSF magnitudes were selected, as the aperture radii used for NOT and MOPTOP observations were small; 1”–2”, that do not include the whole galaxy. In this case, we observed only a slightly higher intrinsic polarization degree compared to the observed values.
We also estimated the effect of strong Balmer emission lines in the Johnson B- and V-filters on the measured polarization degree using the NOT/ALFOSC spectrum described above. The line fluxes of H and H are approximately 3% and 8% of the total flux, respectively, in the B- and V-bands. Thus, they present only a minor modification to the obtained polarization parameters, which we neglect in this paper.
2.3 Optical/UV photometry
We analyzed 61 Swift UltraViolet and Optical Telescope (UVOT) observations taken during the event between MJD 59768 and MJD 60355. All UVOT filters were utilized only during the peak emission phase, with a predominant use of the UV filters (W1/M2/W2). Source count rates, AB magnitudes, and fluxes were measured using the uvotsource v4.3 task, which is part of the High Energy Astrophysics Software (HEASoft). When more than one exposure was taken during the telescope pointing, we combined the images using the uvotimsum task. Additionally, we ensured that the measured count rates were not affected by the source falling in a low-throughput area of the detector.
We also used ZTF g- and r-band data from the transient broker LASAIR (Smith et al., 2019).
2.4 X-ray observations
2.4.1 Swift/XRT
We conducted a search for X-ray sources in the vicinity of AT 2022fpx by stacking 61 archival Swift X-ray Telescope (XRT) photon counting mode images from the same set of Swift observations mentioned above. This stacking procedure was performed using xselect v2.5 and ximage v4.5.1. A 14- source was identified at the coordinates RA 15:31:03.77, DEC +53:24:17.1 (position error of 3.7”), matching the location of AT 2022fpx. The mean source count rate of this source is 0.00310.0002 counts/s in the 0.3–1 keV band (corrected for the point spread function, sampling dead time, and vignetting). No higher energy photons were detected from the source. We further iteratively adjusted the time ranges of the stacking procedure for progressively shorter times maintaining the source at the location of AT 2022fpx with a signal-to-noise ratio larger than two at a minimum. This resulted in 24 epochs, with count rates ranging from 0.001 counts/s to 0.015 counts/s.
We also extracted a spectrum using all the XRT observations from MJD 59768 to MJD 60355, resulting in a total exposure of 124 ksec and a total of 37125 source counts from AT 2022fpx. The spectral bins in the 0.3 to 1 keV range were grouped to a minimum signal-to-noise ratio of three, resulting in 19 spectral bins.
2.4.2 XMM-Newton
We observed the source with XMM-Newton on May 7th, 2023 (MJD 60071), 287 days after the optical peak emission. Unfortunately, the pointing was heavily affected by soft proton radiation from Earth’s magnetosphere, rendering the EPIC-pn camera data unusable. Nevertheless, we were able to utilize the EPIC-MOS camera data to some extent. We extracted the source products using SAS version 20.0.0 following standard procedures. Background flares were filtered by excluding times when the 1012 keV count rate exceeded 0.35 cps for MOS. This resulted in 8.5 ksec of usable exposure time. A source at the location of AT 2022fpx was detected with a significance of 14-, exhibiting a countrate of 0.0320.002 cps and a total of 618 source counts. We further combined the MOS spectra using the epicspeccombine routine in SAS. For spectral fitting, we considered the same spectral range as for Swift/XRT data, i.e., from 0.3 to 1 keV, grouping it similarly to a minimum S/N=3, resulting in 28 spectral bins. We performed spectral fitting using the Interactive Spectral Interpretation System (ISIS; Houck, 2002) and estimated the errors on the best-fit parameter values via Monte Carlo analysis. In the modeling, we added a constant factor to account for the flux difference between the two X-ray detectors used.
3 Results
3.1 Spectral reclassification of AT 2022fpx as an extreme coronal line emitter
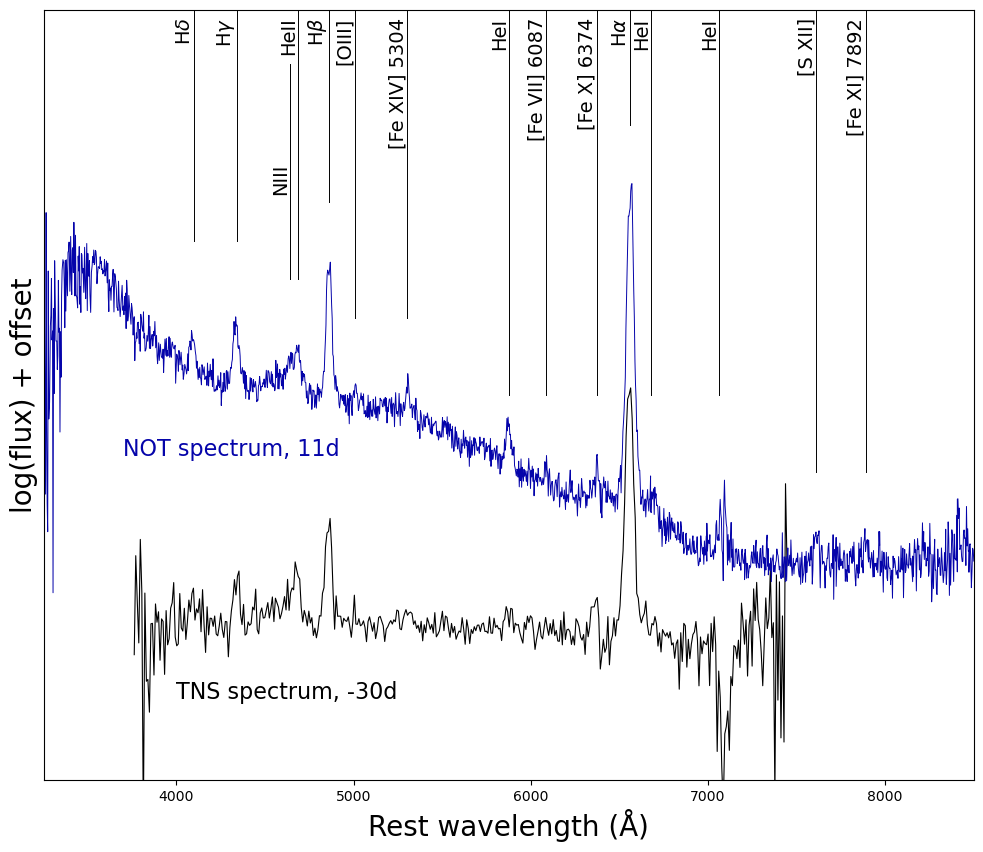
Fig. 1 displays the spectrum of AT 2022fpx from our NOT/ALFOSC observations. The TNS spectrum was taken 85.5 days after the initial detection, while the NOT observation occurred 126.5 days after the discovery. The line strengths and widths of the hydrogen, He I, and He II lines are consistent in both spectra, with maximum velocities of approximately 3000 km/s. Additionally, the NOT spectrum reveals emission lines from Bowen fluorescence (N III) and high-ionization state ‘coronal’ lines (S VII, and Fe X – Fe XIV), although the Fe X emission line can be also seen in the TNS spectrum as well. Thus, these suggest that AT 2022fpx falls into the classification of both Bowen fluorescence TDEs and ECLEs. We have additionally obtained comprehensive spectroscopic follow-up of AT 2022fpx, which will be presented in a future publication (Reynolds et al., in prep).
3.2 Host galaxy properties
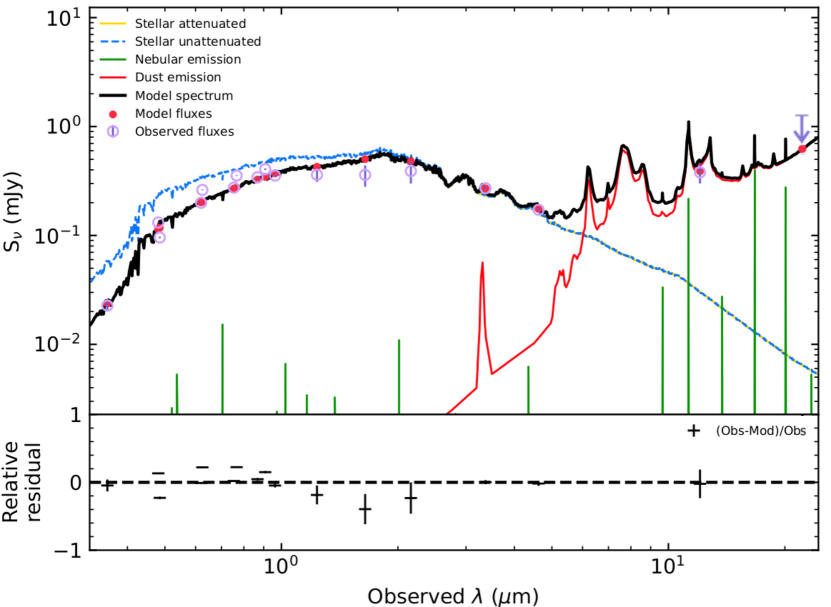
No spectra were available before the transient detection, so in order to to estimate the host galaxy properties, we employed SED fitting with the Code Investigating GALaxy Emission (CIGALE;333https://cigale.lam.fr Burgarella et al., 2005; Noll et al., 2009; Boquien et al., 2019). Host galaxy photometry was collected from archival observations to construct its SED. The photometry included -, -, -, and -band data (cmodel mags) from the Sloan Digital Sky Survey Data Release 17444https://www.sdss4.org/dr17/ (Abdurro’uf et al., 2022), -, -, -, -, and -band data (Kron mags) from the Pan-STARRS survey catalog555https://catalogs.mast.stsci.edu/panstarrs/ (Chambers et al., 2016), J-, H-, and K-band data from the Two Micron All Sky Survey666https://www.ipac.caltech.edu/2mass/releases/allsky/ (2MASS), and the -, -, -, and -band data from AllWISE Source Catalogue777https://wise2.ipac.caltech.edu/docs/release/allwise/ (Wright et al., 2010; Mainzer et al., 2011). The best-fitting model SED is shown in Fig. 2. The galaxy SED is dominated by an old stellar population with an average age of 5.6 Gyr, with a more recent star formation burst with a best-fit age of 1.0 Gyr. The resulting galactic stellar mass value is . The current star formation rate indicated by the model is very low, at /yr but non-negligible dust emission is required in the SED fit (EB-V = 0.4 mag), indicating dust heated by low recent star formation, post-AGB stars, or low-level AGN activity. These properties could be explained if the galaxy underwent a merger with a dwarf star-forming galaxy which align well with typical E+A galaxies that are over-represented in TDE hosts (Arcavi et al., 2014; French et al., 2016; Law-Smith et al., 2017; Hammerstein et al., 2021).
The AllWISE colors (W1 - W2 = 0.1470.063, W2 - W3 = 2.520.22) do not support AGN host based on the classifications of Jarrett et al. (2011); Stern et al. (2012); Mateos et al. (2012). However, more recently, the infrared colors have been found not to be very accurate classifiers (e.g. Radcliffe et al., 2021), and combining the infrared colors with optical photometry may provide more accurate results (Daoutis et al., 2023). Using their method, we estimate the following probabilities for the host galaxy: 53.8% for AGN, 30.3% for a ‘composite’ (e.g., Ho et al., 1997), 8.2% for LINER, 4.3% for a passive, and 3.4% for a star-forming host galaxy. The results imply a high probability of the host galaxy being an AGN or composite and quite small for being purely star-forming or passive. This is probably because the galaxy appears very red in the optical (passive) but also red in the infrared (active), which is contradicting for a purely star-forming or passive galaxy. We note that the accuracy for obtaining a correct classification for AGN is nevertheless quite low, at 56% (Daoutis et al., 2023). Based on the WISE infrared colors of a sample of E+A galaxies, the rising infrared emission could be explained by the presence of post-AGB stars or a low-luminosity and/or obscured AGN (Alatalo et al., 2017). However, we note that the host galaxy of AT 2022fpx is not detected in the lowest frequency WISE band (W4; 22 m). In any case, while we cannot rule out AGN host, it is safe to assume that in the case of AGN host, the nucleus has a low luminosity and it is not radiatively dominant in the system.
3.3 The multiwavelength outburst evolution of AT 2022fpx
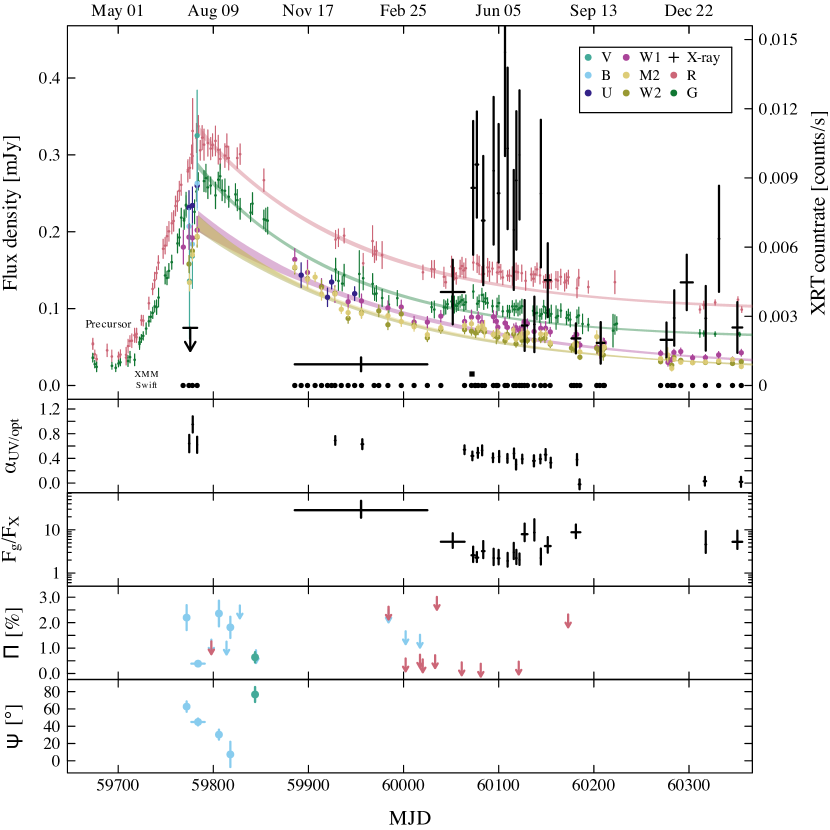
Fig. 3 displays the multiwavelength dataset described above for AT 2022fpx, covering the transient event from the optical rise in May 2022 to the end of 2023. We note that AT 2022fpx has not yet returned to pre-flare flux levels, and the event is still ongoing. In the top panel, we present the ZTF g- and r-band light curves, along with the Swift/UVOT light curves and the Swift/XRT count rate, showing variable emission. The decaying optical/UV fluxes were fitted with an exponential function in all filters. This fitting was executed using UltraNest888https://johannesbuchner.github.io/UltraNest/ (Buchner, 2021), which utilizes the nested sampling Monte Carlo algorithm MLFriends (Buchner, 2014, 2019) to derive posterior probability distributions and Bayesian evidence. In Fig. 3 (top panel), we display the best-fit exponential functions, , with decay timescales = 18117 days (r-band), = 15512 days (g-band), = 24830 days (UVOT W1-band), = 20220 days (UVOT W2-band), and = 21318 days (UVOT M2-band). These timescales are more than two times longer than typical optical TDE decay rates (e.g., Liodakis et al., 2023).
Another interesting aspect of the optical light curve is a precursor event before the rise to the peak (see Fig. 3). Precursor events in TDEs have not been commonly observed, with the exception of AT 2020wey (Charalampopoulos et al., 2023b), where a flattening of the rise was observed for approximately eight days, and AT 2019azh (Faris et al., 2023) with a similar flattening from 10 to 30 days before the light curve peak. Similar to the slow timescale of the decay, the precursor event in AT 2022fpx is taking place much earlier at 70 days before the light curve peak.
We also fitted the six-band Swift/UVOT SEDs, or in cases where only UV bands are available, the quasi-simultaneous (2 days) UVOT + ZTF SEDs, with black body and power law models. In general, the power law model fits the SEDs better. In Fig. 3 (2nd panel), we show the spectral index of the power law model, , which decreases steadily over the decay from to , indicating spectral flattening. A black body model at the peak gives a rest-frame bolometric luminosity of erg/s and a temperature of K.
We also calculated the optical-to-X-ray flux ratio () by converting the Swift/XRT count rate to X-ray flux in the 0.1–1 keV band using the best-fit X-ray model fitted to the XMM-Newton and Swift/XRT data (see Section 3.5). The flux ratio evolution plotted in Fig. 3 (3rd panel) shows that the ratio reached a value of about 2 at the phase of peak X-ray emission, which is a typical ratio for an optical TDE with late-time X-ray brightening (Gezari et al., 2017).
3.4 Optical polarization results
The bottom two panels in Fig. 3 shows the polarization results from our NOT and Liverpool Telescope observations. The source consistently exhibits a low polarization degree (%) throughout our observations. During the peak optical emission, we successfully detected polarization in the B-band in both ALFOSC and MOPTOP observations and additionally in the V-band for ALFOSC. At later times, we constrain the polarization degree to at the 99.7% C.I. (R-band), suggesting that the source became unpolarized. The polarization degree in the B-band detections varied from 0.4% to 2.7%, while for the V-band detection it was .
We observed significant variability in both the polarization degree and angle from AT 2022fpx. Previous optical polarization observations of TDEs have typically shown polarized emission after the peak with decreasing polarization degree as the event progresses (e.g., Lee et al., 2020; Liodakis et al., 2023). Although the overall trend seems to match previous results, this is the first time we observe short-term variability. The first B-band polarization detection () takes place just before the peak of the optical light curve, the second B-band observation () at the peak, and the remaining detections in B- and V-bands occur after the peak (). At the same time, we observe a change in the B-band polarization angle from to in the form of a continuous smooth rotation. The V-band detection yields a polarization angle , consistent within uncertainties with the first B-band detection, but not part of the B-band rotation trend.
After the decay has progressed more than 200 days, we observe a brightening in X-rays (see details in Section 3.5). The polarization degree in the R-band remains undetected at the level. Lowering the detection threshold to 2.6 (99% C.I.), we find two ‘significant detections’ with polarization degree around (from MJD 60061 to MJD 60081). Interestingly, these ‘detections’ occur around the time the source starts to brighten in X-rays, after which the polarization degree drops to (99% C.I.). We discuss further the possible scenarios for the polarization variability in Section 4.1.
3.5 Late-time X-ray brightening
The X-rays started to rise around MJD 60050 with possible low X-ray activity before that at a level of counts/s (Fig. 3), corresponding to an unabsorbed flux of erg s-1 cm-2 in the 0.3–1.0 keV band. This assumes a black body spectrum with a temperature of 95 eV and a hydrogen column density of 1.251020 atoms cm-2 along the line of sight (see below). The rise in X-rays appear to occur simultaneously with the small rise in UV/optical fluxes during the decay, as indicated by their deviation from the exponential decay profile in Fig. 3. At the UV/optical peak, the X-rays are not detected, with a 3 upper limit of counts/s ( erg s-1 cm-2). The X-ray emission lasted about 100 days at a more or less constant level, but dimmed down after that. However, recent observations show that the X-ray emission is recovering again, possibly indicating the start of another ‘flare’ or a periodic behavior.
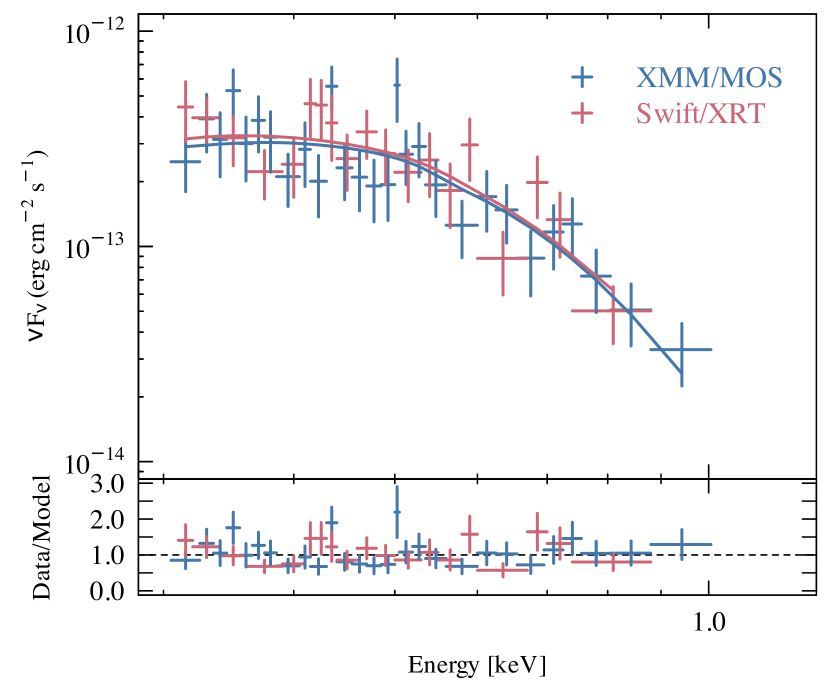
We fitted both the XMM-Newton/MOS and the time-integrated Swift/XRT spectra with an absorbed and redshifted black body model using Cash statistics and subplex optimization in ISIS. The agreement of the time-integrated Swift/XRT spectrum spanning 400 days and the XMM-Newton snapshot spectrum indicates that the shape of the spectrum remains constant throughout the X-ray brightening (Fig. 4). We fixed the interstellar absorption at atoms/cm2 (HI4PI Collaboration et al., 2016) by adding a tbabs component to the model, using abundances from Wilms et al. (2000). The best-fit model has Cash statistics of 49.5 with 44 degrees of freedom and indicates a temperature of 95 eV. The rest-frame bolometric black body luminosity during the XMM-Newton observation at the source distance of 311 Mpc is (8.71.2) erg s-1. While the temperature is a reasonable value for a TDE (e.g. Kajava et al., 2020), the luminosity is relatively low, corresponding to the Eddington luminosity of a black hole or an Eddington fraction of 0.007 for a black hole.
3.6 Black hole mass estimates
We estimated the mass of the black hole through various methods, including fitting the observed light curves with The Modular Open Source Fitter for Transients (MOSFiT;999https://github.com/guillochon/MOSFiT Guillochon et al., 2018) resulting in , and using the code TDEmass101010https://github.com/taehoryu/TDEmass (Ryu et al., 2020), yielding . We utilized the TDE model (Mockler et al., 2019) within MOSFiT and the observed light curves in different bands, including Swift/UVOT W1-, M2-, and W2-bands, as well as ZTF - and -bands, as input. The code assumes that the optical-to-UV emission is reprocessed accretion disk emission in the surrounding gas. TDEmass solves two non-linear algebraic equations derived in Ryu et al. (2020) that arise from the outer shock model, where the optical/UV emission is generated by dissipation in shocks near the debris’ orbital apocenter. The parameters required for solving the equations are the observed peak UV/optical luminosity and the observed temperature at peak luminosity, which we derive from a black body model fit to the Swift/UVOT data taken at MJD 59783 coinciding with the ZTF light curve peak.
We also used empirical relations with the black hole mass involving peak luminosity and radiated energy (Mummery et al., 2024), which resulted in and , respectively. The relation of the black hole mass with the plateau luminosity in Mummery et al. (2024) yielded a much higher value, , which is not surprising, as AT 2022fpx has not yet reached the plateau phase and remains quite luminous. We also utilized an empirical relation of the black hole mass with the host galaxy mass (Greene et al., 2020; Mummery et al., 2024), resulting in using the host galaxy mass derived in Section 3.2. If the above estimates for the black hole mass are independent, the global mean would be .
4 Discussion
4.1 On the variable polarization
The low optical polarization degree observed in optical TDEs has often been interpreted as arising from scattering from free electrons in a reprocessing layer surrounding the black hole (Leloudas et al., 2022; Charalampopoulos et al., 2023a). While our results would indeed be consistent with such a scenario, the erratic variability in the polarization degree and rotation in the polarization angle observed in AT 2022fpx cannot easily fit into the reprocessing picture. In this scenario, the X-ray brightening after the peak is attributed to the reprocessing layer becoming optically thin to X-rays. Using the global mean estimate for the black hole mass, we find the necessary time for the transition to the optically thin regime to be days (Metzger & Stone, 2016), which is 20 times shorter than the observed time lag between the optical and X-ray peak emissions.
Previously, we interpreted changes in the polarization angle as arising from the shift in shock dominance within the outer shock scenario (Liodakis et al., 2023). In this scenario, intersecting stellar streams near the pericenter of the stellar orbit form a nozzle shock that dissipates orbital energy (Bonnerot & Lu, 2022). However, this energy loss is likely insufficient to rapidly circularize the flow and lead to the formation of the accretion disk (Piran et al., 2015; Steinberg & Stone, 2024). Instead, the stellar flow collides with itself further away from the black hole, producing strong shocks that emit in the optical. According to this scenario, we expect the pericenter shock to form and dominate the emission during the rising phase of the outburst (Steinberg & Stone, 2024). The pre-peak polarized emission would then correspond to emission from the pericenter shock. The subsequent drop in the polarization degree at the optical peak could result from the formation of the outer shocks, as emission from multiple polarized components with different polarization angles could lead to depolarization (e.g., Liodakis et al., 2020). The change in the polarization angle coincides with the drop in the polarization degree. However, the polarization angle continues to change while the polarization degree recovers back to pre-peak level. After the optical peak, the polarization degree drops again, but now the polarization angle returns to the pre-peak values (although in a different optical band). This erratic variability and changes in the optical polarization angle could be interpreted as contributions from different shocks at different times. However, without dedicated simulations to evaluate the relative contribution of the different shocks to their composite emission, we cannot reach firm conclusions. Using the black hole mass estimate from TDEmass, we can estimate the return time of the most-bound material to be days (following Piran et al. 2015). Thus, the phase of the outer shock emission is expected to take place around (Shiokawa et al., 2015), precisely the time interval of the observed polarization variability. In addition, the expected time from the disruption to the optical peak () is days, matching the outburst rise time well. In this scenario, the brightening in X-rays can be interpreted as the delayed formation of the accretion disk (e.g., Kajava et al., 2020). The accretion disk is expected to form between (Shiokawa et al., 2015), i.e., 150–520 days, consistent with the observed behavior.
We observe a potential (2.6) increase in the polarization degree coinciding with the rise of the X-ray emission. Interestingly, the X-ray emission lasts for only 100 days at a high level, accompanied by only a mild increase in the optical flux and a flattening of the optical/UV spectrum during the same period. The observed low degree () of polarization during the X-ray flare is typical of values found for the polarization from X-ray binary accretion disks (e.g., Krawczynski et al., 2022) and AGN (e.g., Marin et al., 2023).
Another scenario that could possibly explain the observed polarization behavior is scattering from a compact, clumpy torus (Marin et al., 2015; Marin & Stalevski, 2015). In this scenario, the degree of optical polarization is expected to be low. However, both the polarization degree and angle depend on the inclination of the system to the line of sight which should not vary unless the accretion disk undergoes precessing motion (which could be the case if the orbital plane of the disrupted star and the spin axis of the black hole are misaligned; Teboul & Metzger 2023). In that case, the intrinsic emission changes angle to the scatterer leading to erratic variability of the polarization degree and both smooth and sudden changes of the polarization angle (see Fig. 1 in Marin & Stalevski, 2015). The observed polarization angle rotation rate of change in the B-band is = (1.20.3)∘/day. Assuming polarization angle variations are achromatic, the rate of change of the polarization angle from the last B-band detection to the V-band is twice as fast = (2.60.6)∘/day, although it is still within 2 from the B-band rotation rate and could imply that the polarization angle rate of change remained the same. The lack of detectable polarization at late times could be attributed to the end of the disk precession. That bounds the alignment timescale of the disk to between 140–284 days. Following Teboul & Metzger (2023), we can estimate the allowed parameter space for the mass and spin of the black hole for the disruption of a solar mass star. We find black hole mass values consistent with the estimates above; however, they require a fairly low black hole spin; . While the value of the spin is low, similar results were found for AT2020ocn that showed quasi-periodic X-ray eruptions attributed to Lense-Thirring precession of the accretion disk (Pasham et al., 2024). Under this scenario, the brightening of X-rays can be interpreted as the central source becoming temporarily unobscured from the clumpy torus material. This could also explain both the flare profile of the observed X-rays (and the recurrence of the X-ray emission) as well as the very low levels of polarization degree. One might expect the polarization degree to rise again after the central source becomes obscured. Unfortunately, our optical polarization observations did not continue after the first X-ray flare, so we cannot confirm the possibility of this scenario.
4.2 The nature of AT 2022fpx
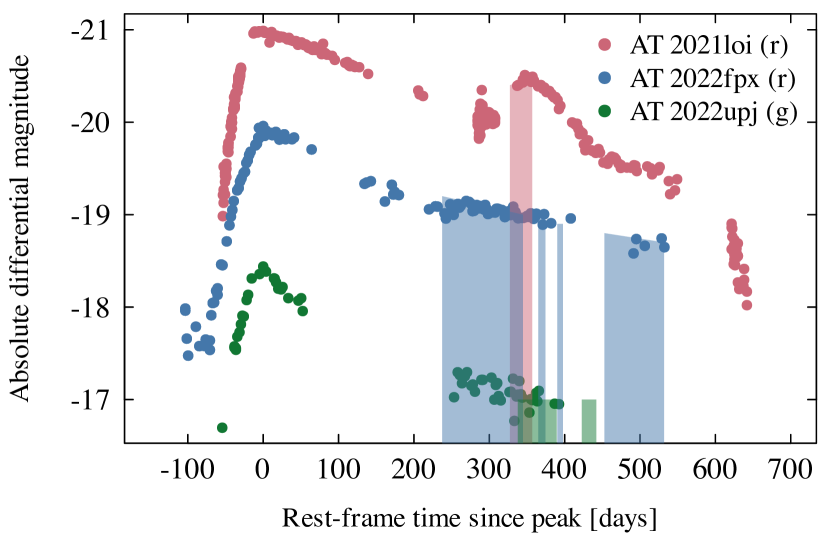
AT 2022fpx is among the few optical TDEs exhibiting coronal line emission during the flare decay, alongside AT 2017gge (Onori et al., 2022), AT 2019qiz (Short et al., 2023), and AT 2022upj (Newsome et al., 2022). The appearance of coronal lines varies from source to source, with AT 2017gge and AT 2019qiz showing the lines at later times, approximately 200 and 400 days after the optical peak, respectively, while AT 2022upj and AT 2022fpx exhibit the lines earlier, at approximately 41 and 86 days after the optical peak, respectively.
Additionally, the appearance of X-rays differs; AT 2017gge (Onori et al., 2022), and AT 2022fpx exhibit late-time emission, whereas AT 2019qiz (Nicholl et al., 2020) show X-ray emission already at the optical peak. For AT 2022upj, we examined the available Swift/XRT data, and found clear detections starting from 350 days from the optical peak (see Fig. 5) aligning with the late-time detections of X-rays from AT 2017gge and AT 2022fpx. Thus, the relationship between the ionizing X-ray emission and the coronal lines appears complex. However, AT 2019qiz is one of the closest TDEs, which could explain the earlier X-ray detection.
In addition to the coronal lines, AT 2022fpx shares several properties with BFF events, including the clear identification of Bowen lines, a slow decay of optical fluxes, and a rebrightening phase occurring approximately a year after the initial decline (Makrygianni et al., 2023). While for other BFFs, it has appeared clearer that the observed events could arise from some form of reactivation or flare of an already identified AGN (Trakhtenbrot et al., 2019; Makrygianni et al., 2023), in the case of AT 2022fpx, the AGN nature of the galaxy is uncertain, and several pieces of evidence point against it, including the ECLE nature (see Section 3.1), host galaxy SED, and the mid-infrared colors (see Section 3.2). Therefore, AT 2022fpx could serve as a crucial source to link at least some BFFs to TDEs.
The resemblance of the optical light curve of AT 2022fpx to a well-sampled BFF, AT 2021loi (Makrygianni et al., 2023), is striking (Fig. 5). The light curves have similar shapes, with only the rise being faster and the rebrightening more pronounced in AT 2021loi compared to AT 2022fpx. Additionally, the timing of the rebrightening is almost identical. This similarity could suggest potentially similar black hole masses in these systems, around . The difference in rebrightening amplitudes might be attributed to AT 2021loi being more obscured, leading to X-rays being reprocessed to the optical regime (although not suggested by Makrygianni et al. 2023 due to the prominently blue continuum of the source), while AT 2022fpx is either less obscured or has more clumpy blocking matter, allowing more X-rays to propagate without reprocessing. To explore this further, we examined the Swift/XRT data of AT 2021loi up to date and found a 3 source at the correct location by stacking all available photon counting mode data. Notably, most of the X-ray counts coincide with the time of the rebrightening (Fig. 5). The combined Swift/XRT countrate of the two pointings taken between MJD 59754 and MJD 59786 (corresponding to 327–357 days after peak) is 0.00250.00095 (2.6). Whether or not this is a true detection, it potentially indicates that the onset or increase of the accretion disk emission can occur later in BFFs, similar to other optical TDEs.
The comparable light curve profiles of AT 2022fpx and AT 2021loi argue against the origin from AGN variability, as one would expect AGN flares to be stochastic events and not follow a similar trend. This lends more weight to the TDE classification; however, the long-term light curve and the lower velocities of the Balmer lines still need clarification in this context. If some BFFs are TDEs occurring in low-luminosity or quiet AGN, our line-of-sight to the central source could be obstructed by a dusty torus, and the longer time scales might be influenced by the more complex surroundings and a potentially low-luminosity accretion flow already in place. This scenario aligns well with the observed polarization properties and the late-time X-ray emission seen in AT 2022fpx.
5 Conclusions
In this paper, we presented the optical polarization monitoring observations of AT 2022fpx together with accompanying UV/optical photo- and spectrometry, and X-ray observations. The optical spectra taken around 100 days after the optical peak shows highly-ionized (‘coronal’) lines making AT 2022fpx one of the few TDEs showing these lines during the optical decay. The source exhibited also peculiar, variable but low-polarized emission at the optical peak of the transient event including a clear rotation of 50 degrees of the polarization angle. In addition, X-ray emission was observed later on in the decay coinciding with a small rise in the optical/UV fluxes, but displaying more flare-like emission profile that potentially is re-emerging currently.
We attribute the polarization behavior and late-time X-rays either to the outer shock scenario, which has been established to explain the observed behavior of optical TDEs, or perhaps more plausibly, to a clumpy torus surrounding the supermassive black hole. AT 2022fpx is the first source showing properties from both ECLEs and BFFs, characterized by coronal and Bowen lines, slowly decaying optical/UV light curve, and a rebrightening event (more prominent in X-rays than optical). The relation to possible dormant or obscured AGN remains an interesting and intriguing aspect of the BFF sources. However, the AGN nature in the case of AT 2022fpx is not clear, and the presence of coronal lines suggests a TDE classification. Thus, AT 2022fpx could be a key source in linking BFF sources and ECLEs to long-lived TDEs.
Acknowledgements
K.I.I.K. has received funding from the European Research Council (ERC) under the European Union’s Horizon 2020 research and innovation programme (grant agreement No. 101002352, PI: M. Linares). K.I.I.K. acknowledges the financial support from the visitor and mobility program of the Finnish Centre for Astronomy with ESO (FINCA), funded by the Academy of Finland grant No. 306531.
I.L was funded by the European Union ERC-2022-STG - BOOTES - 101076343. Views and opinions expressed are however those of the author(s) only and do not necessarily reflect those of the European Union or the European Research Council Executive Agency. Neither the European Union nor the granting authority can be held responsible for them. I.L. was supported by the NASA Postdoctoral Program at the Marshall Space Flight Center, administered by Oak Ridge Associated Universities under contract with NASA.
E.L. was supported by Academy of Finland project Nos. 317636, 320045 and 346071.
P.C. acknowledges support via Research Council of Finland (grant 340613)
K.K. was supported by the Czech Science Foundation project No.22-22643S.
LASAIR is supported by the UKRI Science and Technology Facilities Council and is a collaboration between the University of Edinburgh (grant ST/N002512/1) and Queen’s University Belfast (grant ST/N002520/1) within the LSST:UK Science Consortium.
ZTF is supported by National Science Foundation grant AST-1440341 and a collaboration including Caltech, IPAC, the Weizmann Institute for Science, the Oskar Klein Center at Stockholm University, the University of Maryland, the University of Washington, Deutsches Elektronen-Synchrotron and Humboldt University, Los Alamos National Laboratories, the TANGO Consortium of Taiwan, the University of Wisconsin at Milwaukee, and Lawrence Berkeley National Laboratories. Operations are conducted by COO, IPAC, and UW.
Based on observations made with the Nordic Optical Telescope, owned in collaboration by the University of Turku and Aarhus University, and operated jointly by Aarhus University, the University of Turku and the University of Oslo, representing Denmark, Finland and Norway, the University of Iceland and Stockholm University at the Observatorio del Roque de los Muchachos, La Palma, Spain, of the Instituto de Astrofisica de Canarias.
This research has made use of data and/or software provided by the High Energy Astrophysics Science Archive Research Center (HEASARC), which is a service of the Astrophysics Science Division at NASA/GSFC.
Based on observations obtained with XMM-Newton, an ESA science mission with instruments and contributions directly funded by ESA Member States and NASA.
The Liverpool Telescope is operated on the island of La Palma by Liverpool John Moores University in the Spanish Observatorio del Roque de los Muchachos of the Instituto de Astrofisica de Canarias with financial support from the UKRI Science and Technology Facilities Council (STFC) (ST/T00147X/1)
The Pan-STARRS1 Surveys (PS1) and the PS1 public science archive have been made possible through contributions by the Institute for Astronomy, the University of Hawaii, the Pan-STARRS Project Office, the Max-Planck Society and its participating institutes, the Max Planck Institute for Astronomy, Heidelberg and the Max Planck Institute for Extraterrestrial Physics, Garching, The Johns Hopkins University, Durham University, the University of Edinburgh, the Queen’s University Belfast, the Harvard-Smithsonian Center for Astrophysics, the Las Cumbres Observatory Global Telescope Network Incorporated, the National Central University of Taiwan, the Space Telescope Science Institute, the National Aeronautics and Space Administration under Grant No. NNX08AR22G issued through the Planetary Science Division of the NASA Science Mission Directorate, the National Science Foundation Grant No. AST-1238877, the University of Maryland, Eotvos Lorand University (ELTE), the Los Alamos National Laboratory, and the Gordon and Betty Moore Foundation.
This publication makes use of data products from the Two Micron All Sky Survey, which is a joint project of the University of Massachusetts and the Infrared Processing and Analysis Center/California Institute of Technology, funded by the National Aeronautics and Space Administration and the National Science Foundation.
Funding for the Sloan Digital Sky Survey IV has been provided by the Alfred P. Sloan Foundation, the U.S. Department of Energy Office of Science, and the Participating Institutions. SDSS-IV acknowledges support and resources from the Center for High Performance Computing at the University of Utah. SDSS-IV is managed by the Astrophysical Research Consortium for the Participating Institutions of the SDSS Collaboration including the Brazilian Participation Group, the Carnegie Institution for Science, Carnegie Mellon University, Center for Astrophysics | Harvard & Smithsonian, the Chilean Participation Group, the French Participation Group, Instituto de Astrofísica de Canarias, The Johns Hopkins University, Kavli Institute for the Physics and Mathematics of the Universe (IPMU) / University of Tokyo, the Korean Participation Group, Lawrence Berkeley National Laboratory, Leibniz Institut für Astrophysik Potsdam (AIP), Max-Planck-Institut für Astronomie (MPIA Heidelberg), Max-Planck-Institut für Astrophysik (MPA Garching), Max-Planck-Institut für Extraterrestrische Physik (MPE), National Astronomical Observatories of China, New Mexico State University, New York University, University of Notre Dame, Observatário Nacional / MCTI, The Ohio State University, Pennsylvania State University, Shanghai Astronomical Observatory, United Kingdom Participation Group, Universidad Nacional Autónoma de México, University of Arizona, University of Colorado Boulder, University of Oxford, University of Portsmouth, University of Utah, University of Virginia, University of Washington, University of Wisconsin, Vanderbilt University, and Yale University.
This publication makes use of data products from the Wide-field Infrared Survey Explorer, which is a joint project of the University of California, Los Angeles, and the Jet Propulsion Laboratory/California Institute of Technology, funded by the National Aeronautics and Space Administration.
This work was supported by the MINECO (Spanish Ministry of Economy, Industry and Competitiveness) through grant ESP2016-80079-C2-1-R (MINECO/FEDER, UE) and by the Spanish MICIN/AEI/10.13039/501100011033 and by "ERDF A way of making Europe" by the “European Union” through grants RTI2018-095076-B-C21 and PID2021-122842OB-C21, and the Institute of Cosmos Sciences University of Barcelona (ICCUB, Unidad de Excelencia ’María de Maeztu’) through grant CEX2019-000918-M.
Data Availability
The Liverpool and NOT data are available on demand. ZTF data is available at LASAIR website. XMM-Newton/Swift data is available at HEASARC.
References
- Abdurro’uf et al. (2022) Abdurro’uf et al., 2022, ApJS, 259, 35
- Alatalo et al. (2017) Alatalo K., et al., 2017, ApJ, 843, 9
- Andruchow et al. (2008) Andruchow I., Cellone S. A., Romero G. E., 2008, MNRAS, 388, 1766
- Arcavi et al. (2014) Arcavi I., et al., 2014, ApJ, 793, 38
- Blagorodnova et al. (2019) Blagorodnova N., et al., 2019, ApJ, 873, 92
- Bonnerot & Lu (2022) Bonnerot C., Lu W., 2022, MNRAS, 511, 2147
- Boquien et al. (2019) Boquien M., Burgarella D., Roehlly Y., Buat V., Ciesla L., Corre D., Inoue A. K., Salas H., 2019, A&A, 622, A103
- Brown et al. (2017) Brown J. S., Holoien T. W. S., Auchettl K., Stanek K. Z., Kochanek C. S., Shappee B. J., Prieto J. L., Grupe D., 2017, MNRAS, 466, 4904
- Buchner (2014) Buchner J., 2014, arXiv e-prints, p. arXiv:1407.5459
- Buchner (2019) Buchner J., 2019, PASP, 131, 108005
- Buchner (2021) Buchner J., 2021, The Journal of Open Source Software, 6, 3001
- Burgarella et al. (2005) Burgarella D., Buat V., Iglesias-Páramo J., 2005, MNRAS, 360, 1413
- Callow et al. (2024) Callow J., et al., 2024, arXiv e-prints, p. arXiv:2402.16951
- Chambers et al. (2016) Chambers K. C., et al., 2016, arXiv e-prints, p. arXiv:1612.05560
- Charalampopoulos et al. (2022) Charalampopoulos P., et al., 2022, A&A, 659, A34
- Charalampopoulos et al. (2023a) Charalampopoulos P., Bulla M., Bonnerot C., Leloudas G., 2023a, A&A, 670, A150
- Charalampopoulos et al. (2023b) Charalampopoulos P., Pursiainen M., Leloudas G., Arcavi I., Newsome M., Schulze S., Burke J., Nicholl M., 2023b, A&A, 673, A95
- Clark et al. (2023) Clark P., et al., 2023, arXiv e-prints, p. arXiv:2307.03182
- Daoutis et al. (2023) Daoutis C., Kyritsis E., Kouroumpatzakis K., Zezas A., 2023, A&A, 679, A76
- Donley et al. (2002) Donley J. L., Brandt W. N., Eracleous M., Boller T., 2002, AJ, 124, 1308
- Faris et al. (2023) Faris S., et al., 2023, arXiv e-prints, p. arXiv:2312.03842
- French et al. (2016) French K. D., Arcavi I., Zabludoff A., 2016, ApJ, 818, L21
- Gezari (2021) Gezari S., 2021, ARA&A, 59, 21
- Gezari et al. (2012) Gezari S., et al., 2012, Nature, 485, 217
- Gezari et al. (2017) Gezari S., Cenko S. B., Arcavi I., 2017, ApJ, 851, L47
- Greene et al. (2020) Greene J. E., Strader J., Ho L. C., 2020, ARA&A, 58, 257
- Guillochon et al. (2018) Guillochon J., Nicholl M., Villar V. A., Mockler B., Narayan G., Mandel K. S., Berger E., Williams P. K. G., 2018, ApJS, 236, 6
- HI4PI Collaboration et al. (2016) HI4PI Collaboration et al., 2016, A&A, 594, A116
- Hammerstein et al. (2021) Hammerstein E., et al., 2021, ApJ, 908, L20
- Hinkle et al. (2024) Hinkle J. T., Shappee B. J., Holoien T. W. S., 2024, MNRAS,
- Ho et al. (1997) Ho L. C., Filippenko A. V., Sargent W. L. W., 1997, ApJ, 487, 568
- Houck (2002) Houck J. C., 2002, in Branduardi-Raymont G., ed., High Resolution X-ray Spectroscopy with XMM-Newton and Chandra. p. 17
- Hovatta et al. (2016) Hovatta T., et al., 2016, A&A, 596, A78
- Jarrett et al. (2011) Jarrett T. H., et al., 2011, ApJ, 735, 112
- Kajava et al. (2020) Kajava J. J. E., Giustini M., Saxton R. D., Miniutti G., 2020, A&A, 639, A100
- Komossa & Bade (1999) Komossa S., Bade N., 1999, A&A, 343, 775
- Komossa et al. (2008) Komossa S., et al., 2008, ApJ, 678, L13
- Komossa et al. (2009) Komossa S., et al., 2009, ApJ, 701, 105
- Krawczynski et al. (2022) Krawczynski H., et al., 2022, Science, 378, 650
- Landi Degl’Innocenti et al. (2007) Landi Degl’Innocenti E., Bagnulo S., Fossati L., 2007, in Sterken C., ed., Astronomical Society of the Pacific Conference Series Vol. 364, The Future of Photometric, Spectrophotometric and Polarimetric Standardization. p. 495 (arXiv:astro-ph/0610262)
- Law-Smith et al. (2017) Law-Smith J., Ramirez-Ruiz E., Ellison S. L., Foley R. J., 2017, ApJ, 850, 22
- Lee et al. (2020) Lee C.-H., Hung T., Matheson T., Soraisam M., Narayan G., Saha A., Stubens C., Wolf N., 2020, ApJ, 892, L1
- Leloudas et al. (2022) Leloudas G., et al., 2022, Nature Astronomy, 6, 1193
- Liodakis et al. (2020) Liodakis I., et al., 2020, ApJ, 902, 61
- Liodakis et al. (2023) Liodakis I., et al., 2023, Science, 380, 656
- Mainzer et al. (2011) Mainzer A., et al., 2011, ApJ, 731, 53
- Makrygianni et al. (2023) Makrygianni L., et al., 2023, ApJ, 953, 32
- Marin & Stalevski (2015) Marin F., Stalevski M., 2015, in SF2A-2015: Proceedings of the Annual meeting of the French Society of Astronomy and Astrophysics. pp 167–170 (arXiv:1510.01059), doi:10.48550/arXiv.1510.01059
- Marin et al. (2015) Marin F., Goosmann R. W., Gaskell C. M., 2015, A&A, 577, A66
- Marin et al. (2023) Marin F., et al., 2023, A&A, 673, A126
- Mateos et al. (2012) Mateos S., et al., 2012, MNRAS, 426, 3271
- Metzger & Stone (2016) Metzger B. D., Stone N. C., 2016, MNRAS, 461, 948
- Mockler et al. (2019) Mockler B., Guillochon J., Ramirez-Ruiz E., 2019, ApJ, 872, 151
- Mummery et al. (2024) Mummery A., van Velzen S., Nathan E., Ingram A., Hammerstein E., Fraser-Taliente L., Balbus S., 2024, MNRAS, 527, 2452
- Newsome et al. (2022) Newsome M., Arcavi I., Dgany Y., Pellegrino C., 2022, Transient Name Server AstroNote, 236, 1
- Nicholl et al. (2020) Nicholl M., et al., 2020, MNRAS, 499, 482
- Nilsson et al. (2018) Nilsson K., et al., 2018, A&A, 620, A185
- Noll et al. (2009) Noll S., Burgarella D., Giovannoli E., Buat V., Marcillac D., Muñoz-Mateos J. C., 2009, A&A, 507, 1793
- Onori et al. (2019) Onori F., et al., 2019, MNRAS, 489, 1463
- Onori et al. (2022) Onori F., et al., 2022, MNRAS, 517, 76
- Parkinson et al. (2022) Parkinson E. J., Knigge C., Matthews J. H., Long K. S., Higginbottom N., Sim S. A., Mangham S. W., 2022, MNRAS, 510, 5426
- Pasham et al. (2024) Pasham D. R., et al., 2024, arXiv e-prints, p. arXiv:2402.09689
- Patra et al. (2022) Patra K. C., Lu W., Brink T. G., Yang Y., Filippenko A. V., Vasylyev S. S., 2022, MNRAS, 515, 138
- Perez-Fournon et al. (2022) Perez-Fournon I., et al., 2022, Transient Name Server Classification Report, 2022-1771, 1
- Piran et al. (2015) Piran T., Svirski G., Krolik J., Cheng R. M., Shiokawa H., 2015, ApJ, 806, 164
- Prochaska et al. (2020a) Prochaska J. X., et al., 2020a, pypeit/PypeIt: Release 1.0.0, doi:10.5281/zenodo.3743493
- Prochaska et al. (2020b) Prochaska J. X., et al., 2020b, Journal of Open Source Software, 5, 2308
- Radcliffe et al. (2021) Radcliffe J. F., Barthel P. D., Thomson A. P., Garrett M. A., Beswick R. J., Muxlow T. W. B., 2021, A&A, 649, A27
- Roth et al. (2016) Roth N., Kasen D., Guillochon J., Ramirez-Ruiz E., 2016, ApJ, 827, 3
- Ryu et al. (2020) Ryu T., Krolik J., Piran T., 2020, ApJ, 904, 73
- Shiokawa et al. (2015) Shiokawa H., Krolik J. H., Cheng R. M., Piran T., Noble S. C., 2015, ApJ, 804, 85
- Short et al. (2023) Short P., et al., 2023, MNRAS, 525, 1568
- Shrestha et al. (2020) Shrestha M., Steele I. A., Piascik A. S., Jermak H., Smith R. J., Copperwheat C. M., 2020, MNRAS, 494, 4676
- Smith et al. (2019) Smith K. W., et al., 2019, Research Notes of the AAS, 3, 26
- Steinberg & Stone (2024) Steinberg E., Stone N. C., 2024, Nature, 625, 463
- Stern et al. (2012) Stern D., et al., 2012, ApJ, 753, 30
- Teboul & Metzger (2023) Teboul O., Metzger B. D., 2023, ApJ, 957, L9
- Tonry et al. (2012) Tonry J. L., et al., 2012, ApJ, 750, 99
- Tonry et al. (2022) Tonry J., et al., 2022, Transient Name Server Discovery Report, 2022-836, 1
- Trakhtenbrot et al. (2019) Trakhtenbrot B., et al., 2019, Nature Astronomy, 3, 242
- Wang et al. (2011) Wang T.-G., Zhou H.-Y., Wang L.-F., Lu H.-L., Xu D., 2011, ApJ, 740, 85
- Wang et al. (2012) Wang T.-G., Zhou H.-Y., Komossa S., Wang H.-Y., Yuan W., Yang C., 2012, ApJ, 749, 115
- Wevers et al. (2022) Wevers T., et al., 2022, A&A, 666, A6
- Wiersema et al. (2012) Wiersema K., et al., 2012, MNRAS, 421, 1942
- Wiersema et al. (2020) Wiersema K., et al., 2020, MNRAS, 491, 1771
- Wilms et al. (2000) Wilms J., Allen A., McCray R., 2000, ApJ, 542, 914
- Wright et al. (2010) Wright E. L., et al., 2010, AJ, 140, 1868
- van Velzen et al. (2021) van Velzen S., et al., 2021, ApJ, 908, 4