11email: valentin.christiaens@kuleuven.be 22institutetext: STAR Institute, Université de Liège, Allée du Six Août 19c, 4000 Liège, Belgium 33institutetext: Max-Planck-Institut für Astronomie (MPIA), Königstuhl 17, 69117 Heidelberg, Germany 44institutetext: Kapteyn Astronomical Institute, Rijksuniversiteit Groningen, Postbus 800, 9700AV Groningen, The Netherlands 55institutetext: LESIA, Observatoire de Paris, Université PSL, CNRS, Sorbonne Université, Université de Paris, 5 place Jules Janssen, 92195 Meudon, France 66institutetext: Université Paris-Saclay, CNRS, Institut d’Astrophysique Spatiale, 91405, Orsay, France 77institutetext: Fakultät für Physik, Universität Duisburg-Essen, Lotharstraße 1, 47057 Duisburg, Germany 88institutetext: Institut für Astronomie und Astrophysik, Universität Tübingen, Auf der Morgenstelle 10, 72076 Tübingen, Germany 99institutetext: Physikalisches Institut, Universität Bern, Gesellschaftsstr. 6, 3012 Bern, Switzerland 1010institutetext: Leiden Sterrewacht, Leiden University, 2300 RA Leiden, The Netherlands 1111institutetext: Max-Planck Institut für Extraterrestrische Physik (MPE), Giessenbachstr. 1, 85748, Garching, Germany 1212institutetext: Institut für Astrophysik, Universität Wien, Türkenschanzstr. 17, A-1180 Vienna, Austria 1313institutetext: ETH Zürich, Institute for Particle Physics and Astrophysics, Wolfgang-Pauli-Str. 27, 8093 Zürich, Switzerland 1414institutetext: Université Paris-Saclay, Université Paris Cité, CEA, CNRS, AIM, F-91191 Gif-sur-Yvette, France 1515institutetext: Centro de Astrobiología (CAB), CSIC-INTA, ESAC Campus, Camino Bajo del Castillo s/n, 28692 Villanueva de la Cañada, Madrid, Spain 1616institutetext: INAF – Osservatorio Astronomico di Capodimonte, Salita Moiariello 16, 80131 Napoli, Italy 1717institutetext: Dublin Institute for Advanced Studies, 31 Fitzwilliam Place, D02 XF86 Dublin, Ireland 1818institutetext: Institutionen för Astronomi, Stockholms Universitet, AlbaNova Universitetscentrum, 10691 Stockholm, Sweden 1919institutetext: Department of Astrophysics/IMAPP, Radboud University, PO Box 9010, 6500 GL Nijmegen, The Netherlands 2020institutetext: SRON Netherlands Institute for Space Research, Niels Bohrweg 4, NL-2333 CA Leiden, The Netherlands 2121institutetext: Institut für Weltraumforschung, Austrian Academy of Sciences, Schmiedlstr. 6, A-8042, Graz, Austria 2222institutetext: TU Graz, Fakultät für Mathematik, Physik und Geodäsie, Petersgasse 16 8010 Graz, Austria
MINDS: JWST/NIRCam imaging of the protoplanetary disk PDS 70
Abstract
Context. Two protoplanets have recently been discovered within the PDS 70 protoplanetary disk. JWST/NIRCam offers a unique opportunity to characterize them and their birth environment at wavelengths difficult to access from the ground.
Aims. We aim to image the circumstellar environment of PDS 70 at 1.87 m and 4.83 m, assess the presence of Pa- emission due to accretion onto the protoplanets, and probe any IR excess indicative of heated circumplanetary material.
Methods. We obtain non-coronagraphic JWST/NIRCam images of PDS 70 within the MINDS (MIRI mid-INfrared Disk Survey) program. We leverage the Vortex Image Processing (VIP) package for data reduction, and develop dedicated routines for optimal stellar PSF subtraction, unbiased imaging of the disk, and protoplanet flux measurement in this type of dataset. A radiative transfer model of the disk is used to disentangle the contributions from the disk and the protoplanets.
Results. We re-detect both protoplanets and identify extended emission after subtracting a disk model, including a large-scale spiral-like feature. We interpret its signal in the direct vicinity of planet as tracing the accretion stream feeding its circumplanetary disk, while the outer part of the feature may rather reflect asymmetric illumination of the outer disk. We also report a bright signal consistent with a previously proposed protoplanet candidate enshrouded in dust, near the 1:2:4 mean-motion resonance with planets and . The 1.87 m flux of planet is consistent with atmospheric model predictions, but not that of planet . We discuss potential origins for this discrepancy, including significant Pa- line emission. The 4.83 m fluxes of planets and suggest enshrouding dust or heated CO emission from their circumplanetary environment.
Conclusions. The use of image-processing methods optimized for extended disk signals on high-sensitivity and high-stability JWST images can uniquely identify signatures of planet–disk interactions and enable accurate photometry of protoplanets at wavelengths difficultly probed from the ground. Our results point towards the prospect of identifying and characterizing more protoplanets in other JWST datasets.
Key Words.:
protoplanetary disks – planet-disk interactions – stars: individual: PDS 70 – techniques: image processing1 Introduction
The direct detection and characterization of protoplanets is an emerging research field enabled by the latest generations of high-contrast and high-angular resolution instruments available on the largest ground-based facilities (e.g., Keppler et al. 2018; Hammond et al. 2023). While the application of post-processing algorithms designed for point-source detection to bright protoplanetary disks has led to a number of unconfirmed protoplanet candidates, the recent development of both iterative and inverse-problem image-processing approaches (IIPAs) is opening the way to unbiased high-contrast IR imaging of the birth environment of planets (e.g., Pairet et al. 2021; Flasseur et al. 2021; Juillard et al. 2023). JWST now offers the opportunity to use these optimized tools to deepen the search and characterization of protoplanets at wavelengths inaccessible or difficult to observe from the ground. This Letter demonstrates the combined potential of JWST and IIPAs, using as a testbed the PDS 70 system.
PDS 70 is a young ( Myr) K7IV star located at a distance of pc (Müller et al. 2018; Gaia Collaboration et al. 2021). It is surrounded by a protoplanetary disk composed of a water-rich inner disk (Dong et al. 2012; Perotti et al. 2023), separated from the outer disk by an annular gap extending up to a radius of 54 au (Long et al. 2018; Keppler et al. 2019). Two nascent planets were imaged and confirmed independently in this large gap, at multiple NIR and sub-mm wavelengths, as well as in the H line filter (e.g., Keppler et al. 2018; Müller et al. 2018; Christiaens et al. 2019b; Haffert et al. 2019; Isella et al. 2019; Benisty et al. 2021). A third protoplanet candidate was also reported on a potential 13.5 au orbit (Mesa et al. 2019, hereafter M19). As such, the system is an ideal laboratory to study planet-disk interactions and search for accretion signatures. Hydro-dynamical simulations suggest that the large gap is dynamically carved by both planets, with the (near) 2:1 mean-motion resonance observed by GRAVITY (Wang et al. 2021b) explained as the outcome of planet migration followed by resonance capture (Bae et al. 2019; Toci et al. 2020). Constraints on the distribution and depletion of dust and gas in the disk were recently inferred through radiative transfer and thermo-chemical forward modeling of the NIR and sub-mm observations (Portilla-Revelo et al. 2022, 2023). Both sub-mm continuum and NIR observations have also identified an arm-like structure hypothesized to trace either an asymmetric outer ring or a gap-induced vortex (Isella et al. 2019; Juillard et al. 2022).
Spectral characterization of protoplanets and favors dust-enshrouded atmospheres combined with a potential IR excess (Müller et al. 2018; Christiaens et al. 2019a; Wang et al. 2020; Stolker et al. 2020; Wang et al. 2021b). Yet, cross-correlation of either these best-fit models or molecular templates with medium-resolution spectra did not detect the planets (Cugno et al. 2021). This suggests that either significantly more extinction affects both protoplanets than SED fitting implies, or that self-consistent atmospheric models used to characterize adolescent sub-stellar objects do not describe embedded protoplanets. Either hybrid models with surface accretion shock contributions (e.g., Aoyama et al. 2020, 2021), or circumplanetary disk models, may more accurately account for the measured SED (e.g., Chen & Szulágyi 2022). In this context, observations at additional wavelengths are key to disentangle the different models.
| Parameter | F187N | F480M |
| PDS 70 | ||
| Flux (mJy) | ||
| PDS 70 | ||
| Sep. (mas)(a) | ||
| PA ()(b) | ||
| Contrast(c) | ||
| Flux (Jy) | ||
| PDS 70 | ||
| Sep. (mas)(a) | ||
| PA ()(b) | ||
| Contrast(c) | ||
| Flux (Jy) | ||
| PDS 70 ? | ||
| Sep. (mas)(a) | – | |
| PA ()(b) | – | |
| Contrast(c) | – | |
| Flux (Jy) | – | |
Notes: (a)Radial separation. (b)Position angle measured east of north. (c)Contrast ratio with respect to the star and unresolved inner disk.
2 Observations and image processing
We observed PDS 70 with JWST/NIRCam (Rieke et al. 2005) as part of the MIRI Guaranteed Time Observations on protoplanetary disks MINDS survey (PI: Th. Henning, PID: 1282) on 8 March 2023. Images were acquired simultaneously in the F187N ( m, m) and F480M ( m, m) filters without coronagraph, with pixel scales of 31 and 63 mas/pixel, respectively. We used the smallest subarray (SUB64P), with an effective integration time of 0.35112 s, 7 groups per integration, 142 integrations per exposure, and 5 dithered exposures, each at two roll angles separated by 5.0°. The total effective integration time was thus 8.3 min.
We calibrated the data with stages 1 and 2 (Detector1 and Image2) of the JWST pipeline (v1.10.2; Bushouse et al. 2023), using Calibration Reference Data System context jwst_1166.pmap. The calibration yielded two sets of five dithered images, each set corresponding to a different roll angle. We then relied on routines from the Vortex Image Processing (VIP; Gomez Gonzalez et al. 2017; Christiaens et al. 2023) package for image pre-processing (details in Appendix A.1), stellar PSF subtraction, and forward modeling of circumstellar signals. As the star did not saturate the detector, we performed aperture photometry directly on the pre-processed images. We set the largest aperture radius fitting within the SUB64P field of view. Table 1 reports the integrated photometry of the system. We conservatively consider 1% absolute flux calibration uncertainties.
We investigated different approaches for PSF modeling and subtraction (details in Appendix A.2). The best-quality images of the system were obtained with our implementation of Iterative Principal Component Analysis (IPCA; e.g., Pairet et al. 2021; Stapper & Ginski 2022) leveraging roll angle diversity. Its principle relies on estimating circumstellar signals in the processed image obtained at each iteration, and removing them from the images used to create a PSF model (i.e., for each image, the ones obtained at the other roll angle) in the next iteration. We applied IPCA to a test dataset to illustrate its reliability at recovering point-like and extended circumstellar signals (Appendix A.3).
Before extracting the photometry of the protoplanets, one needs to remove the expected contribution of the disk. This is particularly relevant for planet c, located near the bright edge of the outer disk. We rely on the latest radiative transfer models of the disk detailed in Portilla-Revelo et al. (2022, 2023), and followed a procedure which we refer to as the Negative Fake Disk technique (NEGFD; details in Appendix B). After removing the disk contribution, we used the Negative Fake Companion (NEGFC; e.g., Lagrange et al. 2010) technique to extract the exact astrometry and photometry of the protoplanets in both datasets (details in Appendix C). Our final retrieved astrometry and photometry for the protoplanets are presented in Table 1.
3 Results and discussion
3.1 Spiral accretion stream or variable illumination?
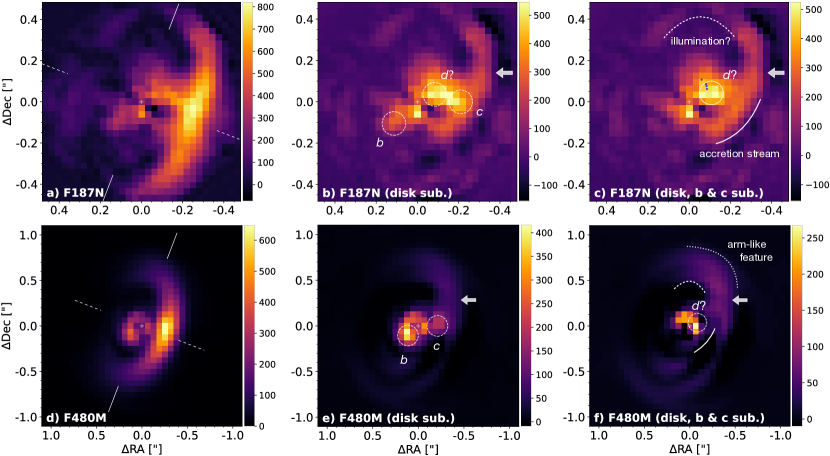
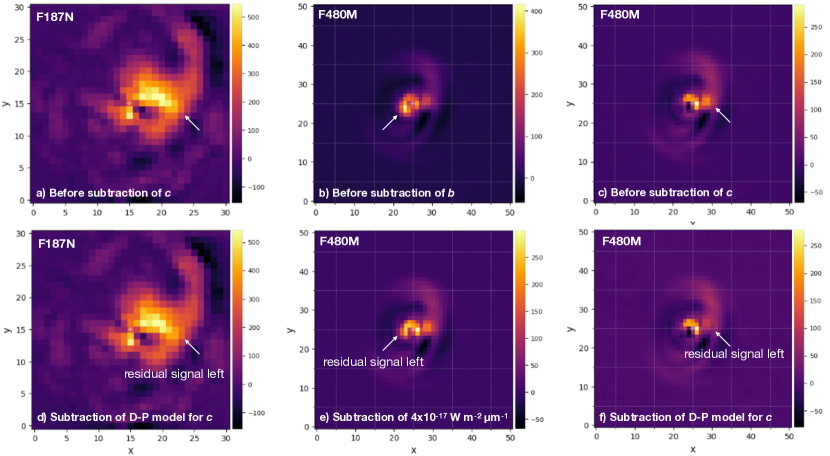
Figure 1a and d show our F187N and F480M images obtained with IPCA, respectively. IPCA recovered faint circumstellar signals originally hidden in the wings of the stellar PSF, while iteratively correcting for geometric biases affecting extended signals in roll-subtracted images (Fig. 4a and e; Juillard et al. 2022). The IPCA images reveal inner and outer disk signals, signals at the expected location of the protoplanets, and a shift of the maximum intensity of the outer disk to the north of the semi-minor axis on the near side of the disk (located at a position angle east of north PAβ). In the absence of disk asymmetry or protoplanets, the maximum in total intensity is otherwise expected to be located along PAβ, based on the scattering phase function of sub-m size dust grains (e.g., Milli et al. 2017). To highlight the protoplanets and any disk asymmetry, we subtracted the disk model found with NEGFD from the IPCA images (Fig. 1c and f). Doing so reveals residual extended signals in addition to protoplanets and c, the predicted locations of which are indicated for the epoch of the observations. These predictions are based on the orbital fits presented in Wang et al. (2021b), and available through the platform whereistheplanet (Wang et al. 2021a). We do not detect any significant counterpart for the proposed sub-mm continuum signal at the L5 Lagrangian point associated with planet (Balsalobre-Ruza et al. 2023). We note however an outstanding extended spiral-like signal connected with the position of planet , indicated with a thick arrow in Fig. 1b and e.
Dynamical interaction between a protoplanet and the disk in which it is embedded has long been known to cause spiral density waves (Goldreich & Tremaine 1979; Ogilvie & Lubow 2002) and angular momentum transport (Lin & Papaloizou 1979; Rafikov 2002). In the vicinity of the planet, the latter is expected to lead to a spiral-shaped accretion stream (Lubow et al. 1999; Ayliffe & Bate 2009). The accretion stream associated to PDS 70 was predicted in a dedicated 3D hydro-dynamical simulation in Toci et al. (2020). Figure 10 compares it to the spiral-like signal identified in our observations. Although the agreement is remarkable, we note that the accretion stream is mostly delimiting the edge of the cavity. An asymmetric illumination of the outer disk edge, not captured by our radiative transfer disk model, could equally lead to excess signal in our images after disk model subtraction. Multi-epoch polarised intensity images of the system show varying illumination and shadowing effects on the northwest and southeast parts of the outer disk (e.g., Fig. A2 in Juillard et al. 2022), suggesting this is likely the dominant cause for the observed excess. This interpretation is consistent with the significant mid-IR SED variability measured for the system, also suggesting variable shadowing effects from the inner parts onto the outer parts of the disk (Perotti et al. 2023).
While illumination effects are the most likely culprit for excess signals at the edge of the outer disk (upper arc in Fig. 1c), such effects alone cannot account for the part of the spiral-like signal located inside the cavity, given the level of dust depletion therein (e.g., Dong et al. 2012; Keppler et al. 2018). In the direct vicinity of planet (lower arc), a genuine dust density enhancement appears thus necessary. Given the clear visual connection to the location of protoplanet , a spiral accretion stream feeding the circumplanetary disk of planet c, detected in sub-mm continuum observations (Isella et al. 2019; Benisty et al. 2021; Casassus & Cárcamo 2022), is the most straightforward explanation for this signal. Excess signal has tentatively been observed there in IIPA-processed VLT/SPHERE images (Flasseur et al. 2021; Juillard et al. 2022), although the non-removal of an outer disk model complicates its unambiguous identification in those images. Moreover, the location of the accretion stream is coincident with a gap-crossing spur found in ALMA CO observations of the disk (Keppler et al. 2019), further strengthening the accretion stream interpretation. This result suggests that some of the observed spiral features in less inclined disks than PDS 70 could also be associated with embedded protoplanets (e.g., Dong et al. 2018; Ren et al. 2024). A similar spiral-shaped signal was recently identified as connected to HD 169142 (Hammond et al. 2023). Likewise, a gap-crossing filament coincident with a twist in one of the spirals of HD 135344 B may also be caused by an embedded protoplanet (Casassus et al. 2021).
An arm-like feature was identified and characterized in the outer disk of PDS 70 using multi-epoch SPHERE images of the system obtained with IIPAs (Pairet et al. 2021; Juillard et al. 2022). The trace of this arm in a 2021 SPHERE dataset is compared to our IPCA image in Fig. 10c. It is unclear whether it is associated with the spiral accretion stream, or whether it traces a separate feature, such as a vortex or an asymmetric second ring (Juillard et al. 2022). The inner part of the arm, at the edge of the cavity, appears consistent with the part of the spiral-like signal seen in the F187N image which may trace varying illumination of the outer disk edge. The outer part of the arm appears consistent with the arm-like feature identified in previous SPHERE images. This feature is the only signal detected at a SNR in our F480M images besides the protoplanets (Fig. 11), and was also observed in Keck/NIRC2 images of the system after a similar NEGFD procedure as ours (Fig. 1 in Wang et al. 2020). Since an alternative origin for the arm-like signal is the presence of a yet undetected planet in the outer disk exciting an inner spiral wake, we investigated the sensitivity of our data to additional planets (Appendix E). Our F480M contrast and corresponding mass sensitivity curves (Fig. 12) constrain any planets in the outer disk to have a mass below 1–2 , neglecting extinction.
3.2 Astrometry and photometry of protoplanets b and c
The astrometry and contrast of planets and with respect to the star are inferred by using our NEGFC approach (Appendix C), after subtraction of our optimal disk model (Appendix B). These contrast values are then multiplied by the integrated stellar flux values reported in Table 1 to obtain the flux of the protoplanets. We note that the stellar fluxes in the F187N and F480M filters are 25% and 7% brighter than estimated based on the SpeX spectrum presented in Long et al. (2018) and the best-fit SED model to the extracted MIRI-MRS spectrum (Perotti et al. 2023), respectively. These differences are compatible with the significant IR variability of the star and inner disk rim (e.g., 25% variation at 5 m between Spitzer and JWST observations; Perotti et al. 2023). These considerations inspire caution regarding protoplanet photometry derived in contrast of the star but based on non-concurrent absolute star photometry measurements.
For each planet, the astrometric values found for the two filters are consistent with each other. The F187N astrometry of planet and candidate is affected by large uncertainties owing to neighbouring disk signals and the overlapping spiral accretion stream. For the F480M images, the large uncertainties also reflect the coarser angular resolution. All estimates are consistent with the expected astrometry of both protoplanets at the date of our observations (given in the last column of Table 2), based on the orbital fits presented in Wang et al. (2021b). Considering our large uncertainties compared to ground-based measurements, we do not attempt new orbital fits in this work.
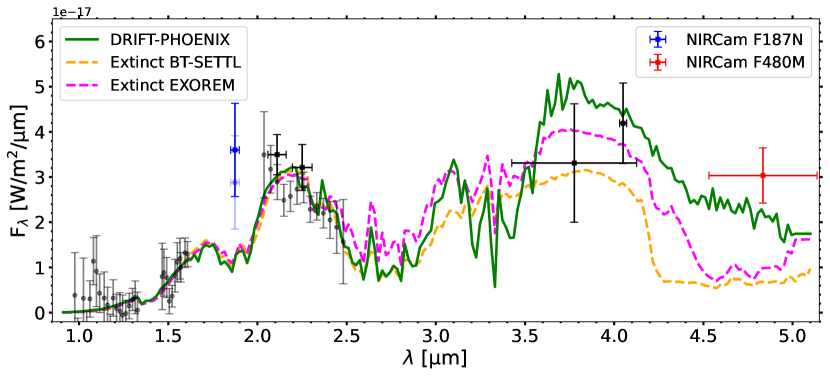
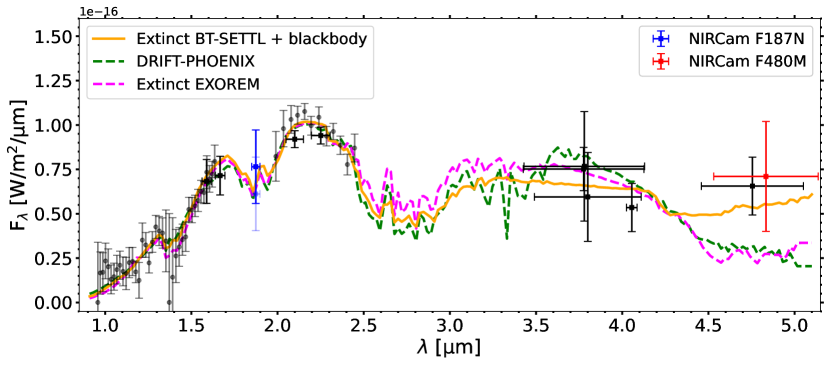
Figures 2 and 3 show the SED of PDS 70 and , respectively, including our NIRCam data at 1.87 and 4.83 m. The F187N measurement for planet is consistent with predictions from the best-fit atmospheric models obtained with the BT-SETTL, DRIFT-PHOENIX and EXOREM grids (details in Wang et al. 2021b). This does not hold for planet . This discrepancy can have various (non-mutually exclusive) causes, discussed in Appendix F. Here we discuss the hypothesis of significant Pa- line emission from the protoplanet, not captured in the atmospheric model. If the excess signal above the model atmospheric contribution comes only from Pa- emission, the line flux is W m-2. Given the unknown amplitude of other biases discussed in Appendix F, this estimate is a conservative upper limit. Considering mag (Uyama et al. 2021) and the distance of the system, our constraint on the Pa- luminosity is , where is the solar luminosity. Assuming a planet mass of (Wang et al. 2021b), the models in Aoyama et al. (2021) suggest the mass accretion rate would be yr. The same assumptions for the model and the planet applied to the H flux reported in Haffert et al. (2019) yield an accretion rate yr. If the Aoyama et al. (2021) models are an accurate representation of the accretion process onto giant planets, our results suggest that either additional sources of bias may have a non-negligible effect (e.g., stellar variability or underestimated SPHERE/IFS measurements; Appendix F), or that protoplanets undergo significant accretion variability (e.g. Szulágyi & Ercolano 2020; Casassus & Cárcamo 2022). With a similar reasoning as above, but using the 3- uncertainty on the F187N flux measured for planet and an assumed extinction of (Uyama et al. 2021), we constrain the Pa- luminosity to . Based on the planet accretion models in Aoyama et al. (2021), this translates into an upper mass accretion rate limit of yr for a planet mass (Wang et al. 2021b). This constraint is in line with the accretion rates inferred from the H flux measured for (Haffert et al. 2019), which leads, for the same model and assumptions, to yr. In summary, both measurement uncertainties and additional sources of bias prevent the confirmation of significant Pa- line emission for both protoplanets.
Our new F480M measurement for PDS 70 is consistent with the NACO -band measurement presented in Stolker et al. (2020). Wang et al. (2021b) found that this point was driving the inclusion of an extra blackbody contribution, representative of heated circumplanetary dust, in the atmospheric model with the most support (solid line in Fig. 2). For PDS 70 , our 4.8 m photometry is roughly compatible with the best-fit DRIFT-PHOENIX model, but significantly higher than the best-fit models from the other two grids, which are known to better reproduce the spectra of old L-T dwarfs (e.g., Witte et al. 2011). For both planets, the tentative excess may be attributable to either a warm dusty environment, or ro-vibrational CO line emission from a heated circumplanetary disk (e.g., Oberg et al. 2023). We defer a detailed spectroscopic analysis for a later study including NIRSpec measurements, as the latter have the highest potential to confirm the tentative 4.8 m excesses and constrain their origin.
3.3 A third protoplanet, a dust clump, or an inner spiral?
The brightest signals in our disk-subtracted F187N image (Fig. 1b) are found near the predicted location of a protoplanet candidate proposed in M19 at the outer edge of the inner disk (referred to as point-like feature therein). The candidate was found in SPHERE/IFS datasets acquired between May 2015 and April 2019. Its reported astrometry, indicated with blue dots in Fig. 1, is consistent with an 13.5 au circular Keplerian orbit in a similar plane as the outer disk, which is assumed for the predicted location shown with dashed circles in Fig. 1. For clarity, we also show the images obtained after also subtracting the estimated flux of protoplanets and (Fig. 1c and f). While inner disk signals are present near the predicted location, there appears to be a significant excess compared to disk signals alone, considering the inner disk emission at a symmetric location with respect to the minor axis to the south-east of the star. While a signal at separation from the star should be considered with caution, the recovery of the inner disk with a geometry close to expected suggests that PSF subtraction residuals are lower than the inner disk signals, hence that the observed excess is likely of circumstellar origin, rather than an artefact. We thus hereafter refer to it as “”, be it tracing a dusty feature or a third protoplanet.
Table 1 reports the astrometry and photometry extracted for in the F187N image. While the F480M image also shows a bright pixel near the expected location, its separation from the star is too small for a reliable contrast estimate. The contrast of derived in the F187N image is about a factor two larger than the median contrast reported in bands in M19. Our estimate is affected by large uncertainties due to the unknown amount of contamination from the inner disk, such that this excess is only marginally significant. Nonetheless, we argue that such excess is expected. The source spectrum is dominated by scattered stellar light at NIR wavelengths (M19), consistent with a very dusty object. In such case, the total intensity scattering phase function should also modulate its brightness along its orbit. Compared to prior epochs, the object is now closer to PAβ, hence one expects a brighter signal. We estimate a factor 1.6 enhancement in reflected light for between April 2019 and March 2023 based on the variation in outer disk flux measured at PA=PAβ-PAd,2019 and PA=PAβ-PAd,2023, where we considered the southwest part of the outer disk for this estimate to avoid any bias from the accretion stream towards the northwest. Within uncertainties, our measured contrast is thus consistent with tracing the same object as M19. This new measurement adds 4 years to the existing 4-year time baseline for orbital coverage, significantly reducing the chance of tracing either a moving illumination effect or the filtered northwestern tip of the inner disk (in M19).
Our independent re-detection of a signal compatible with candidate does not unambiguously confirm its protoplanet nature, but it raises the question of what other physical processes could give rise to a bright and compact NIR signal moving at local Keplerian speed. Given that the spectrum measured in M19 is consistent with tracing scattered stellar light, the authors suggested that it may trace either a transient dust clump or a protoplanet enshrouded in dust. Radiative hydro-dynamical simulations of embedded giant planets suggest they get enshrouded in a dusty circumplanetary disk or envelope which can display a scattered-light dominated spectrum at NIR wavelengths (e.g., Szulágyi et al. 2019). If traces indeed a protoplanet enshrouded in dust, its semi-major axis of 13.5 au would place it near the 1:2:4 mean-motion resonance with planets and ( au and au; Wang et al. 2021b), making especially exciting to follow up. Disentangling the dust clump from the circumplanetary disk or envelope hypothesis will require mid-IR flux measurements (e.g., Chen & Szulágyi 2022). Given the angular separation, this may need the advent of mid-infrared imagers and spectrographs on Extremely Large Telescopes (e.g., ELT/METIS; Brandl et al. 2018). Figure 13 summarizes our proposed interpretation for the main features detected in our NIRCam observations of PDS 70.
Acknowledgements.
We thank Jason Wang for sharing atmospheric models and GRAVITY spectra of the protoplanets. We also thank Yuhiko Aoyama, Faustine Cantalloube and Julien Girard for useful discussions. VC and OA thank the Belgian F.R.S.-FNRS, and the Belgian Federal Science Policy Office (BELSPO) for the provision of financial support in the framework of the PRODEX Programme of the European Space Agency (ESA) under contract number 4000142531. This project has received funding from the European Research Council (ERC) under the European Union’s Horizon 2020 research and innovation programme (grant agreement No 819155), and from the Wallonia–Brussels Federation (grant for Concerted Research Actions). G-DM acknowledges the support of the DFG priority program SPP 1992 “Exploring the Diversity of Extrasolar Planets” (MA 9185/1) and from the Swiss National Science Foundation under grant 200021_204847 “PlanetsInTime”. Parts of this work have been carried out within the framework of the NCCR PlanetS supported by the Swiss National Science Foundation. TPR acknowledges support from the ERC under grant 743029 (EASY). This work is based on observations made with the NASA/ESA/CSA James Webb Space Telescope. The data were obtained from the Mikulski Archive for Space Telescopes at the Space Telescope Science Institute, which is operated by the Association of Universities for Research in Astronomy, Inc., under NASA contract NAS 5-03127 for JWST. This work has made use of data from the European Space Agency (ESA) mission Gaia (https://www.cosmos.esa.int/gaia), processed by the Gaia Data Processing and Analysis Consortium (DPAC, https://www.cosmos.esa.int/web/gaia/dpac/consortium). Funding for the DPAC has been provided by national institutions, in particular the institutions participating in the Gaia Multilateral Agreement. This work benefited from the 2022 Exoplanet Summer Program in the Other Worlds Laboratory (OWL) at the University of California, Santa Cruz, a program funded by the Heising-Simons Foundation.References
- Absil et al. (2013) Absil, O., Milli, J., Mawet, D., et al. 2013, A&A, 559, L12
- Amara & Quanz (2012) Amara, A. & Quanz, S. P. 2012, MNRAS, 427, 948
- Aoyama et al. (2021) Aoyama, Y., Marleau, G.-D., Ikoma, M., & Mordasini, C. 2021, ApJ, 917, L30
- Aoyama et al. (2020) Aoyama, Y., Marleau, G.-D., Mordasini, C., & Ikoma, M. 2020, arXiv e-prints, arXiv:2011.06608
- Augereau et al. (1999) Augereau, J. C., Lagrange, A. M., Mouillet, D., Papaloizou, J. C. B., & Grorod, P. A. 1999, A&A, 348, 557
- Ayliffe & Bate (2009) Ayliffe, B. A. & Bate, M. R. 2009, MNRAS, 393, 49
- Bae et al. (2019) Bae, J., Zhu, Z., Baruteau, C., et al. 2019, ApJ, 884, L41
- Balsalobre-Ruza et al. (2023) Balsalobre-Ruza, O., de Gregorio-Monsalvo, I., Lillo-Box, J., et al. 2023, A&A, 675, A172
- Benisty et al. (2021) Benisty, M., Bae, J., Facchini, S., et al. 2021, ApJ, 916, L2
- Brandl et al. (2018) Brandl, B. R., Absil, O., Agócs, T., et al. 2018, in Society of Photo-Optical Instrumentation Engineers (SPIE) Conference Series, Vol. 10702, Ground-based and Airborne Instrumentation for Astronomy VII, ed. C. J. Evans, L. Simard, & H. Takami, 107021U
- Bushouse et al. (2023) Bushouse, H., Eisenhamer, J., Dencheva, N., et al. 2023, JWST Calibration Pipeline, Zenodo
- Casassus & Cárcamo (2022) Casassus, S. & Cárcamo, M. 2022, MNRAS, 513, 5790
- Casassus et al. (2021) Casassus, S., Christiaens, V., Cárcamo, M., et al. 2021, MNRAS, 507, 3789
- Chen & Szulágyi (2022) Chen, X. & Szulágyi, J. 2022, MNRAS, 516, 506
- Christiaens et al. (2019a) Christiaens, V., Cantalloube, F., Casassus, S., et al. 2019a, ApJ, 877, L33
- Christiaens et al. (2019b) Christiaens, V., Casassus, S., Absil, O., et al. 2019b, MNRAS, 486, 5819
- Christiaens et al. (2023) Christiaens, V., Gonzalez, C., Farkas, R., et al. 2023, The Journal of Open Source Software, 8, 4774
- Cugno et al. (2021) Cugno, G., Patapis, P., Stolker, T., et al. 2021, A&A, 653, A12
- Dong et al. (2012) Dong, R., Hashimoto, J., Rafikov, R., et al. 2012, ApJ, 760, 111
- Dong et al. (2018) Dong, R., Najita, J. R., & Brittain, S. 2018, ApJ, 862, 103
- Flasseur et al. (2021) Flasseur, O., Thé, S., Denis, L., Thiébaut, É., & Langlois, M. 2021, A&A, 651, A62
- Gaia Collaboration et al. (2021) Gaia Collaboration, Brown, A. G. A., Vallenari, A., et al. 2021, A&A, 649, A1
- Goldreich & Tremaine (1979) Goldreich, P. & Tremaine, S. 1979, ApJ, 233, 857
- Gomez Gonzalez et al. (2017) Gomez Gonzalez, C. A., Wertz, O., Absil, O., et al. 2017, AJ, 154, 7
- Guizar-Sicairos et al. (2008) Guizar-Sicairos, M., Thurman, S. T., & Fienup, J. R. 2008, Optics Letters, 33, 156
- Haffert et al. (2019) Haffert, S. Y., Bohn, A. J., de Boer, J., et al. 2019, Nature Astronomy, 3, 749
- Hammond et al. (2023) Hammond, I., Christiaens, V., Price, D. J., et al. 2023, MNRAS, 522, L51
- Heap et al. (2000) Heap, S. R., Lindler, D. J., Lanz, T. M., et al. 2000, ApJ, 539, 435
- Isella et al. (2019) Isella, A., Benisty, M., Teague, R., et al. 2019, ApJ, 879, L25
- Juillard et al. (2022) Juillard, S., Christiaens, V., & Absil, O. 2022, A&A, 668, A125
- Juillard et al. (2023) Juillard, S., Christiaens, V., & Absil, O. 2023, A&A, 679, A52
- Keppler et al. (2018) Keppler, M., Benisty, M., Müller, A., et al. 2018, A&A, 617, A44
- Keppler et al. (2019) Keppler, M., Teague, R., Bae, J., et al. 2019, A&A, 625, A118
- Lagrange et al. (2010) Lagrange, A.-M., Bonnefoy, M., Chauvin, G., et al. 2010, Science, 329, 57
- Larkin et al. (1997) Larkin, K. G., Oldfield, M. A., & Klemm, H. 1997, Optics Communications, 139, 99
- Lin & Papaloizou (1979) Lin, D. N. C. & Papaloizou, J. 1979, MNRAS, 186, 799
- Linder et al. (2019) Linder, E. F., Mordasini, C., Mollière, P., et al. 2019, A&A, 623, A85
- Long et al. (2018) Long, Z. C., Akiyama, E., Sitko, M., et al. 2018, ApJ, 858, 112
- Lubow et al. (1999) Lubow, S. H., Seibert, M., & Artymowicz, P. 1999, ApJ, 526, 1001
- Marois et al. (2006) Marois, C., Lafrenière, D., Doyon, R., Macintosh, B., & Nadeau, D. 2006, ApJ, 641, 556
- Mawet et al. (2012) Mawet, D., Absil, O., Montagnier, G., et al. 2012, A&A, 544, A131
- Mesa et al. (2019) Mesa, D., Keppler, M., Cantalloube, F., et al. 2019, A&A, 632, A25
- Milli et al. (2019) Milli, J., Engler, N., Schmid, H. M., et al. 2019, A&A, 626, A54
- Milli et al. (2017) Milli, J., Vigan, A., Mouillet, D., et al. 2017, A&A, 599, A108
- Min et al. (2009) Min, M., Dullemond, C. P., Dominik, C., de Koter, A., & Hovenier, J. W. 2009, A&A, 497, 155
- Müller et al. (2018) Müller, A., Keppler, M., Henning, T., et al. 2018, A&A, 617, L2
- Oberg et al. (2023) Oberg, N., Kamp, I., Cazaux, S., Rab, C., & Czoske, O. 2023, A&A, 670, A74
- Ogilvie & Lubow (2002) Ogilvie, G. I. & Lubow, S. H. 2002, MNRAS, 330, 950
- Pairet et al. (2021) Pairet, B., Cantalloube, F., & Jacques, L. 2021, MNRAS, 503, 3724
- Perotti et al. (2023) Perotti, G., Christiaens, V., Henning, T., et al. 2023, Nature, 620, 516
- Perrin et al. (2014) Perrin, M. D., Sivaramakrishnan, A., Lajoie, C.-P., et al. 2014, in Society of Photo-Optical Instrumentation Engineers (SPIE) Conference Series, Vol. 9143, Space Telescopes and Instrumentation 2014: Optical, Infrared, and Millimeter Wave, ed. J. Oschmann, Jacobus M., M. Clampin, G. G. Fazio, & H. A. MacEwen, 91433X
- Phillips et al. (2020) Phillips, M. W., Tremblin, P., Baraffe, I., et al. 2020, A&A, 637, A38
- Pinte et al. (2006) Pinte, C., Ménard, F., Duchêne, G., & Bastien, P. 2006, A&A, 459, 797
- Portilla-Revelo et al. (2023) Portilla-Revelo, B., Kamp, I., Facchini, S., et al. 2023, A&A, 677, A76
- Portilla-Revelo et al. (2022) Portilla-Revelo, B., Kamp, I., Rab, C., et al. 2022, A&A, 658, A89
- Price et al. (2018) Price, D. J., Wurster, J., Tricco, T. S., et al. 2018, PASA, 35, e031
- Quanz et al. (2015) Quanz, S. P., Amara, A., Meyer, M. R., et al. 2015, ApJ, 807, 64
- Rafikov (2002) Rafikov, R. R. 2002, ApJ, 569, 997
- Ren et al. (2024) Ren, B. B., Xie, C., Benisty, M., et al. 2024, A&A, 681, L2
- Rieke et al. (2005) Rieke, M. J., Kelly, D., & Horner, S. 2005, in Society of Photo-Optical Instrumentation Engineers (SPIE) Conference Series, Vol. 5904, Cryogenic Optical Systems and Instruments XI, ed. J. B. Heaney & L. G. Burriesci, 1–8
- Samland et al. (2021) Samland, M., Bouwman, J., Hogg, D. W., et al. 2021, A&A, 646, A24
- Schneider et al. (2003) Schneider, G., Wood, K., Silverstone, M. D., et al. 2003, AJ, 125, 1467
- Soummer et al. (2012) Soummer, R., Pueyo, L., & Larkin, J. 2012, ApJ, 755, L28
- Stapper & Ginski (2022) Stapper, L. M. & Ginski, C. 2022, A&A, 668, A50
- Stolker et al. (2020) Stolker, T., Quanz, S. P., Todorov, K. O., et al. 2020, A&A, 635, A182
- Szulágyi et al. (2019) Szulágyi, J., Dullemond, C. P., Pohl, A., & Quanz, S. P. 2019, MNRAS, 487, 1248
- Szulágyi & Ercolano (2020) Szulágyi, J. & Ercolano, B. 2020, ApJ, 902, 126
- Toci et al. (2020) Toci, C., Lodato, G., Christiaens, V., et al. 2020, MNRAS, 499, 2015
- Uyama et al. (2021) Uyama, T., Xie, C., Aoyama, Y., et al. 2021, AJ, 162, 214
- Wang et al. (2020) Wang, J. J., Ginzburg, S., Ren, B., et al. 2020, AJ, 159, 263
- Wang et al. (2021a) Wang, J. J., Kulikauskas, M., & Blunt, S. 2021a, whereistheplanet: Predicting positions of directly imaged companions, Astrophysics Source Code Library, record ascl:2101.003
- Wang et al. (2021b) Wang, J. J., Vigan, A., Lacour, S., et al. 2021b, AJ, 161, 148
- Wertz et al. (2017) Wertz, O., Absil, O., Gómez González, C. A., et al. 2017, A&A, 598, A83
- Witte et al. (2011) Witte, S., Helling, C., Barman, T., Heidrich, N., & Hauschildt, P. H. 2011, A&A, 529, A44
Appendix A Image processing
A.1 Pre-processing
We first identified remaining bad pixels in the calibrated images through sigma-clipping, using the cube_fix_badpix_clump function of VIP, and corrected them using Gaussian kernel interpolation. We subsequently corrected the imperfect background subtraction performed by the JWST pipeline, which led to negative values, by subtracting the residual background level estimated far from the star. We then found the stellar centroid coordinates using the cube_recenter_dft_upsampling routine in VIP. This routine first leverages the single-step discrete Fourier Transform algorithm presented in Guizar-Sicairos et al. (2008) to find shifts that optimize image cross-correlation throughout the sequence, and then fits a 2D Gaussian model to the mean image of the aligned cube to find the centroid coordinates. Throughout all stages of image processing, all shift and rotation operations were performed in the Fourier plane, the default behavior in VIP111https://github.com/vortex-exoplanet/VIP, as this better preserves pixel intensities (e.g., Larkin et al. 1997).
A.2 PSF subtraction
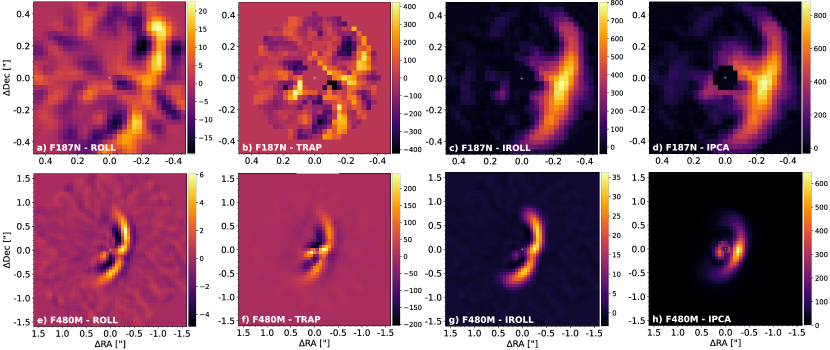
We investigated different approaches for PSF modeling and subtraction. We first considered pair-wise roll-subtraction (e.g. Schneider et al. 2003) between individual dithered images acquired with each of the two roll angles. We also considered the pair-wise subtraction of the mean image of each of the two sets. We noticed a minor improvement in the residuals near the star which could be due to the spatial undersampling of the images limiting the efficacy of individual pair-wise image subtractions. Both the ‘mean’ and ‘individual’ options are implemented in the roll_sub function of VIP, available as of version 1.6.0. Images are smoothed with a Gaussian kernel the FWHM of which is set to 60% of the observed width of the instrumental PSF. This helps mitigating the undersampling which affects the F187N data and the pixel-to-pixel noise induced by the roll-subtraction approach. In Fig. 4a and e, we show the images obtained with mean roll subtraction on the F187N and F480M data, respectively. Low residuals are achieved owing to the stability of the observed PSF, but significant self-subtraction and geometric distortion of circumstellar signals can also be noted (e.g., by comparison with the IPCA images). Compared to the F480M images shown in Fig. 1, the F480M images in Fig. 4 correspond to the largest common field covered by all dither positions.
In addition to direct roll subtraction, we investigated alternative post-processing methods designed to work in combination with angular differential imaging, namely Principal Component Analysis (PCA; Soummer et al. 2012; Amara & Quanz 2012) and Temporal Reference Analysis for Planets (TRAP; Samland et al. 2021). We used the PCA algorithm implemented in VIP, using as input PCA library for each image, the images obtained at the other roll angle, akin to smartPCA proposed for angular differential imaging (Absil et al. 2013). This yielded very similar results to roll angle subtraction. The TRAP algorithm computes a contrast map. A contrast is computed for each off-axis (RA, DEC)-pair on-sky by simultaneously modeling the pixel lightcurves created by an off-axis PSF at the sky position and the temporal systematics of the pixels affected by this off-axis PSF. For our JWST data there are measurements at two roll angles, such that the off-axis PSF model for each (RA, DEC)-pair results in a step-function with varying jump heights depending on each pixel’s location relative to the off-axis PSF. In practice the contrast map resulting from the forward modeling is a form of local deconvolution with a PSF model that takes into account the field-of-view rotation. This approach is optimized for detecting point sources, but nevertheless works out-of-the-box. However, due to the complex disk structure surrounding the host star it is difficult to locate uncontaminated reference pixels of the host star PSF to model the temporal systematics in the data. For our results, each off-axis PSF pixel lightcurve (step function) is fit simultaneously with only a constant factor. Given the stability of the instrument, this provides good results. However, higher-order noise models or models informed by temporal trends seen in the guide star observations may provide better results in the future. Especially when fitting a forward model that explicitly models the entire scene including disks and planets, overfitting becomes less of a concern. The TRAP analysis is extremely computationally efficient, requiring less than 5 seconds on a laptop. The TRAP images obtained for the F187N and F480M data are shown in Fig. 4b and f, respectively.
As a less aggressive alternative, we performed Reference star Differential Imaging (RDI; e.g., Mawet et al. 2012) using the PCA algorithm implemented in VIP. We tested RDI using observed non-coronagraphic PSFs from the MAST archive as reference library, however this led to strong PSF residuals after subtraction. It is unclear whether this is due to the field dependence of the PSF, undersampling effects, a different spectral slope for the source (for the F480M filter), or a combination of these factors. We therefore also tested creating reference stars using the webbpsf package (v1.1.1; Perrin et al. 2014) as reference PSFs to test RDI. In the latter case, we considered the PSF distortion dependency with location in the field. We built the synthetic PSFs considering a 3972 K black body (Müller et al. 2018) as the stellar spectrum model, anticipating a potential impact of the spectral slope on the PSF for the F480M filter. We also used the optical path differences from the day following the observations, which appear identical to those measured 3 days before the observations. Upon carefully checking the radial profile of the webbpsf synthetic PSFs and the observed PSF of PDS 70, we noticed a broader core for the observed PSF of PDS 70, and residual diffuse hexagonal-shape stellar wings after subtraction. This may suggest a non-negligible contribution from marginally resolved inner disk signals. We also tested PCA-RDI with a library of synthetic PSFs. These were produced separately for each observed dither position on the detector, and considered a range of subpixel shifts around those dither locations (within 0.5px, with steps of 0.05px). Here we attempted to emulate the broader core and undersampling effects. This marginally improved the results, but still yielded strong PSF wing residuals, hence poor-quality final images.
As our RDI attempts were unfruitful, we focused instead on iterative approaches leveraging roll angle diversity. We implemented an iterative roll (IROLL) subtraction algorithm akin to the one presented in Heap et al. (2000), and an Iterative Principal Component Analysis algorithm (IPCA; e.g., Pairet et al. 2021). In either case, circumstellar signals estimated in the processed image obtained at each iteration (e.g., positive residuals above a certain threshold) are removed from the pre-processed images used to create a PSF model (i.e., for each image, the ones obtained at the other roll angle) in the subsequent iteration. IROLL directly uses the images obtained at roll angle as PSF model for images obtained at roll angle (and vice-versa for the roles of and ), and iteratively removes the estimated circumstellar component directly from the roll images. The difference, in the IPCA algorithm, is that for images , principal components are learned from images , and then projected onto the images to produce PSF models for subtraction (and vice-versa). In practice, we used the first principal component with a cube reduced to two images corresponding to the mean image of each roll angle observation. Thus, the only difference between IPCA and IROLL resided in the projection of a normalized mean PSF (i.e., the projected first principal component) in the former case.
While previous IPCA implementations considered all strictly positive residuals (e.g., Pairet et al. 2021; Juillard et al. 2023), here we set an absolute threshold slightly above the noise level achieved in the roll subtraction image, namely 10 MJy/sr and 1 MJy/sr in the F187N and F480M data, respectively. Such absolute threshold should be used with care as it may not be appropriate for all datasets (e.g., images with a strong radial dependency of the residual noise level). Here we noticed it to be relevant given the relatively constant (self-subtracted) noise level in the image. Hence it was particularly efficient at mitigating the propagation of ring-like artefacts (observed in Pairet et al. 2021; Juillard et al. 2023).
The estimated circumstellar signal map at each iteration is smoothed using a thin 2D-Gaussian kernel set to a 1-pixel FWHM before its removal from the roll images used to produce the PSF model images at the subsequent iteration. This intends to capture the spatial correlation of neighbouring pixels, and leads to better recovery of faint signals, originally drowned under the noise level of the roll subtraction image. Our IPCA algorithm iteratively corrects not only for self-subtraction, since circumstellar signals are iteratively removed from the image library used to calculate the principal components, but also for over-subtraction. This is because the model PSF image that is subtracted is built from the projection of principal components onto the original images minus the estimated circumstellar signal map obtained at the previous iteration.
We implemented an automatic convergence criterion based on a user-defined relative tolerance (default 1e-4). If all pixel intensities in the image obtained at the subsequent iteration vary by less than this relative tolerance, the algorithm stops and considers to have converged onto a final image. While this criterion worked for our data, likely helped by the high stability of the PSF, we highlight that there is no mathematical guarantee that this fix-point algorithm will systematically converge in general (see also Juillard et al. 2023). Both IROLL and IPCA converged to a final image within 1000 iterations. While IROLL recovers a significant fraction of the self-subtracted signals, and yields a similar final image as IPCA in the F187N image, this is not the case for the F480M filter image. In the latter case, it does not appear to converge onto an image free of geometric biases (see e.g., Juillard et al. 2022).
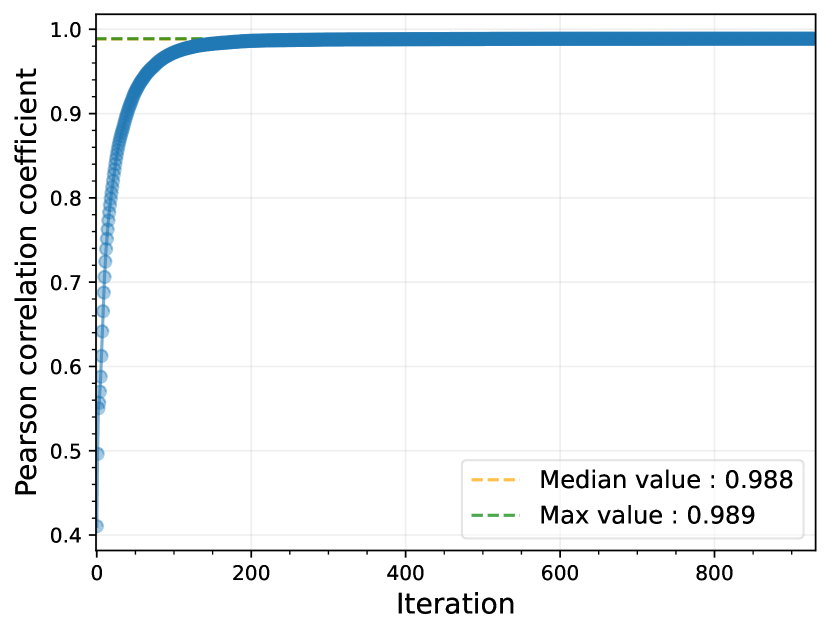
As a safety check that the algorithm properly recovers the outer disk, we show in Fig. 5 the Pearson cross-correlation calculated between the F187N image obtained at each iteration of IPCA and our corresponding radiative transfer model of the outer disk, in a mask encompassing the south part of the outer disk (i.e., all the signals to the south of the peak intensity in Fig. 7a; see Sec. B for more details about the disk model). We highlight that this disk model is not used by IPCA, which functions in an agnostic and automated manner. We see that most of the geometric biases are corrected within 200 iterations. Most of the flux is also recovered within a similar number of iterations, with only marginal gains beyond 200 iterations.
The individual and mean roll subtraction, iterative roll subtraction, and iterative PCA algorithms were all implemented in VIP and available as of version 1.6.0. The images obtained with roll subtraction, TRAP, iterative roll subtraction and iterative PCA are shown in Fig. 4.
A.3 Reliability of IPCA
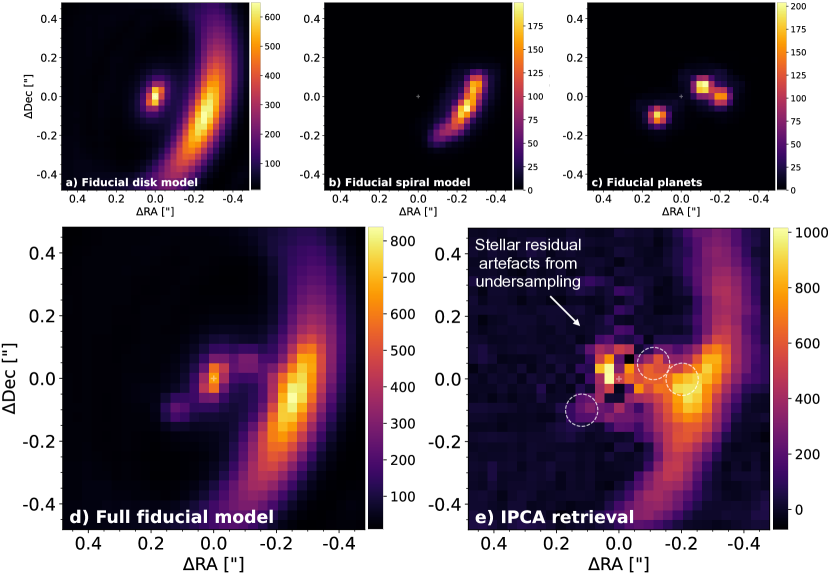
We tested the IPCA method on a fiducial dataset in order to illustrate its effectiveness at producing unbiased images of extended circumstellar signals, hence validate all our conclusions regarding the flux and morphology of circumstellar signals recovered in our IPCA images of PDS 70. For this test, we considered the only other JWST/NIRCam dataset obtained in the F187N filter with the NRCB1 detector and SUB64P subarray publicly available at the time of this study: an observation of reference star HD 135067 obtained on 2 February 2023 (Program 1902). This source does not have any known resolved circumstellar emission. We downloaded the calibrated i2d images directly from the MAST archive. While the number of integrations and the number of groups per integration were similar to the PDS 70 observation, the main difference was the adoption of a 3-point dither pattern strategy, instead of a 5-point dither pattern for the observation of PDS 70. This results in a larger sensitivity to spatial undersampling effects, expected to be particularly prominent near the core of the PSF. As a consequence, the results of the test presented in this section should be considered as a conservative lower limit on the actual expected performance of IPCA on the PDS 70 dataset.
We designed a toy model for the circumstellar signals of PDS 70 composed of an outer disk, an inner disk, a spiral-like signal, and three point source injections corresponding to protoplanets and , and candidate . For the outer disk, we considered the optimal model found in Appendix B. For the inner disk, we considered similar parameters as presented in Keppler et al. (2018), with the peak of the emission concentrated within 5 au. The two disk components are shown in Fig. 6a. For the spiral-like signal, we considered a similar trace as observed in our F187N images of PDS 70 after subtraction of the optimal outer disk model (Fig. 6b). For the protoplanets, we considered similar positions and contrasts as inferred with NEGFC in Appendix C (Fig. 6c). The sum of all components of the model is shown in Fig. 6d. To create and inject the fiducial model into the reference cube, we relied on routines from the fm (forward modeling) subpackage of VIP, in particular its implementation of the Grenoble RAdiative TransfER tool (Augereau et al. 1999; Milli et al. 2019) for the inner disk model, its trace and fake companion injection routines. Before injection in the reference cube data, the model was scaled to a similar contrast with respect to the reference star as the circumstellar signals with respect to PDS 70. The signals were injected at two different angles separated by 5.0 deg in the two sets of 3 dithered images (i.e., the same roll angle difference as in the PDS 70 observation).
Finally, we ran IPCA on this fiducial dataset using the same reduction parameters as used to produce the F187N images of PDS 70. The algorithm converged within 400 iterations, resulting in the image shown in Fig. 6e. To facilitate the comparison with the ground truth injected model, we highlight the location of the injected protoplanets with dashed circles. Apart from stellar residual artefacts, which can likely be assigned to small differences in the core of the PSF due to undersampling effects, we note a satisfactory recovery of both the morphology and flux level of the injected circumstellar signals. This casts confidence on the results obtained with IPCA on the PDS 70 dataset reported in this paper.
Appendix B Optimal disk model found with NEGFD
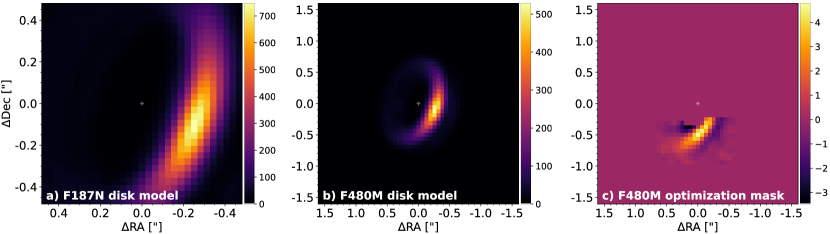
To be able to extract unbiased photometry for the protoplanets, one needs to remove the expected contribution of the disk. Our goal in this work is not a full modeling of the disk, as this would involve a combined SED and disk image fit (e.g., Keppler et al. 2018; Portilla-Revelo et al. 2022, 2023). Therefore, we decided to rely on the latest radiative transfer models of the disk produced with MCMax3D (Min et al. 2009) and presented in Portilla-Revelo et al. (2022, 2023), as they match these combined constraints, and only allow these models to vary to a small extent – for them to still be compatible with ALMA and SPHERE polarized intensity constraints. Namely, we allow (i) the minimum grain size in the grain size distribution to vary between 0.001 and 0.05 m; (ii) the settling parameter to vary between 0.001 m and 0.01 m; (iii) spatial and flux scaling of the model image to vary within a small range around unity; and (iv) small linear (sub-pixel) and azimuthal (sub-degree) shifts with respect to the center of the image, as these parameters are essentially constrained by imaging. Small variations of these parameters can lead to noticeable changes in the model images, hence to significant residuals after subtraction of the model. We produced a grid of 10 disk models in (two explored values) and (five explored values), and searched for the optimal model with a Nelder-Mead algorithm, by interpolating model images in log-space and including free parameters for scaling and shifts. The model images were produced at the same pixel scale as the F187N and F480M images, and smoothed by convolution with the observed PSF. The optimal model was then found by minimizing absolute residuals after subtraction of the model to the observed images. This procedure, which we refer to as the Negative Fake Disk technique (NEGFD) is implemented in VIP, as of version 1.6.0.
The optimal disk model was found by minimizing the sum of absolute intensity residuals in a binary mask which encompasses the location of the outer disk, while excluding the location of both planets (2-FWHM aperture exclusion masks). We considered two potential masks. The first one includes the whole forward scattering (i.e., brighter) side of the disk, and the second one only includes the southwest part of the disk, anticipating excess signals towards the west (near planet c) and northwest part of the disk (spiral-like feature) based on previous images of the disk (Wang et al. 2020; Juillard et al. 2022). As our tests using the first mask led to a mix of strong positive and negative residuals, we only consider the results obtained by minimizing residuals in the second mask, shown in Fig. 7c, in the rest of this work. In practice, we identified the optimal radiative transfer disk model using the F480M data because of the higher signal-to-noise ratio of the disk in these data. The optimal and values were found to be 0.001 m and 0.01, respectively, meaning that the optimal is in-between the radiative transfer models considered in Portilla-Revelo et al. (2022) and Portilla-Revelo et al. (2023). These parameters were then used to make a disk model prediction at 1.87 m. The best F187N and F480M models are shown in Fig. 7a and b, respectively.
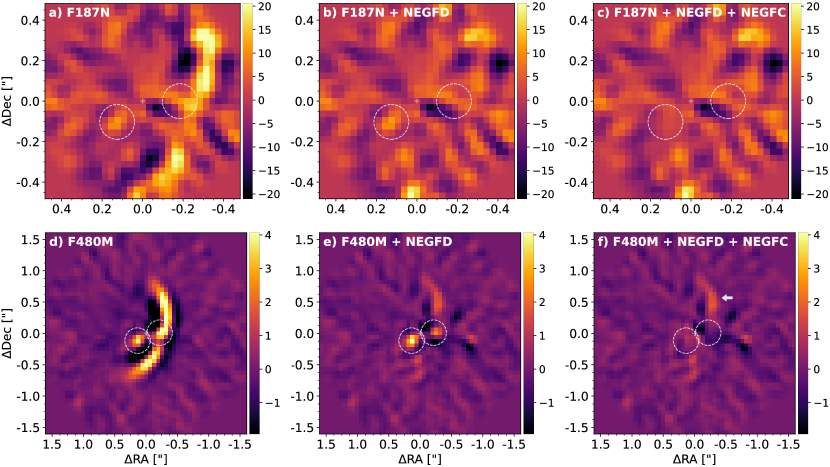
Figs. 8b and e show the roll subtraction images obtained after subtraction of the optimal disk model found by NEGFD from the original images (i.e., before PSF subtraction), for the F187N and F480M datasets, respectively. These are compared to the original roll subtraction images (Figs. 8a and d) using the same intensity scale. The disk subtraction performs well, in particular for the southwest part of the disk, where the residuals reach a similar level as the residual noise level in the image. Subtraction of the optimal disk model clearly highlights the presence in the F480M image of the arm-like feature characterized in Juillard et al. (2022) in VLT/SPHERE images. This feature is indicated with a thick arrow. We also checked how a similar NEGFD procedure performed on the IPCA images obtained with both filters, fixing the and to the optimal values found by NEGFC+roll subtraction. The results are shown in Fig. 1b and e, and discussed in Sec. 3.1.
Appendix C NEGFC retrieval of planet parameters
The Negative Fake Companion (NEGFC) technique consists in finding the optimal parameters (radial separation, position angle and contrast with respect to the star) of a directly imaged companion through the injection of fake companions with a negative flux in the input image cube (i.e., before post-processing), such that residuals are minimized in the post-processed image around the location of the planet. This forward modeling approach is necessary to avoid the parameter estimates for the companion to be affected by self- and over-subtraction effects inherent to the post-processing algorithm used.
We used the Nelder-Mead minimization algorithm implemented in VIP, and described in Wertz et al. (2017) to estimate the parameters for the protoplanets. This NEGFC implementation offers different options in terms of figure of merit to be used in the processed image after injection of negative fake companions to identify the optimal radial separation , position angle PAp and contrast of a given planet, namely minimizing (i) the sum of absolute intensity residuals in an aperture encompassing the companion, (ii) the standard deviation of intensity residuals in an aperture encompassing the companion, or (iii) the sum of absolute determinant values of the Hessian matrix calculated for each of the pixels surrounding the planet location. The latter option is equivalent to minimizing the local absolute curvature, and is more appropriate for the extraction of point source astrometry and photometry in the presence of underlying extended signals (e.g., Quanz et al. 2015). We implemented it for this work, and made it available in VIP as of version 1.6.0. Hereafter, we detail two different approaches involving NEGFC which we tested and compared to retrieve optimal astrometry and photometry for the protoplanets.
C.1 Classical forward-modeling NEGFC
We first considered the classical forward-modeling NEGFC approach, as described in Lagrange et al. (2010) or Wertz et al. (2017), combined with roll subtraction, hereafter referred to as NEGFC+roll. We applied NEGFC+roll to the image cube where the optimal disk model found by NEGFD was removed (Appendix B). Regarding the choice of figure of merit, we note that different figures of merit lead to more or less reliable retrieved planet parameters depending on the SNR of the companion, the nature of the local noise, and contamination by residual extended signals (e.g., inner disk or spiral accretion stream signal). We therefore determined the optimal figure of merit on a case by case basis for each planet in each of our two datasets, as follows. We used NEGFC to derive first estimates on the parameters of the companion with each of the three figures of merit, considering two subcases for the sum and standard deviation, corresponding to their calculation in either 1-FWHM or 2-FWHM size apertures, and three subcases for the Hessian-matrix determinant figure of merit, corresponding to its calculation with set to 1, 2 or 3. Then we injected 360 fake (positive) companions with the radial separation and contrast inferred by NEGFC, 1 apart from each other, in separate copies of the original datasets, and retrieved individually their parameters for each NEGFC subcase. Finally, we considered the subcase which led to the smallest deviations between the retrieved and injected fake companion parameters. These deviations were also used as residual noise uncertainty on the retrieved parameters.
We did not retrieve the parameters for neither planet nor candidate in the F187N data, as it is not detected at a significant level in the F187N roll subtracted image. For all other cases, namely planet in the F187N and F480M datasets, and planet in the F480M dataset, we noted that the Hessian figure of merit outperformed the other two figures of merit in terms of accuracy of the inferred astrometry. It also retrieved better the contrast of the injected companions, compared to the sum figure of merit which tended to overestimate their flux, likely due to residual extended signals. For planet in the F480M data, the Hessian figure of merit is the only metric which did not significantly underestimate the radial separation of the planet compared to its expected location from the orbital fits presented in Wang et al. (2021b). The poorer performance of other metrics may be assigned to diffuse inner disk emission (see e.g. the IPCA images in Fig. 1), pushing the inferred centroid towards the center. Minimizing the determinant of the Hessian matrix is also particularly appropriate for planet c, as it involves a lesser sensitivity to the exactitude of the disk model inferred with NEGFD, that is subtracted from the cube before inferring the parameters of the planet. Using set to 2 or 3 led to consistent results for the Hessian figure of merit, while was more prone to yielding outlier values.
Final uncertainties combine the residual noise uncertainties estimated with the positive fake companion injection test in quadrature with systematic uncertainties for and PAp, and with photon noise uncertainties for . We considered systematic astrometric uncertainties of 6 mas and 2 mas, for the F187N and F480M data, respectively, based on the JWST user manual. The uncertainties associated to the stellar flux are negligible in comparison to the other contributions. Results are reported in the ‘Roll subtraction’ column of Table 2.
As a cross check, we looked at the roll-subtracted images obtained after subtraction of both the disk model (NEGFD) and of the planet signals using the values retrieved by NEGFC. This is shown in the last column of Fig. 8. We see that the residuals at the expected (circled) location of the planets is consistent with the local noise level.
| Parameter | Roll subtraction | IPCA | Final | Prediction(a) |
| F187N | ||||
| PDS 70 | ||||
| Separation(b) | ||||
| PA(c) | ||||
| Contrast(d) | ||||
| Flux(e) | ||||
| PDS 70 | ||||
| Separation(b) | – | |||
| PA(c) | – | |||
| Contrast(d) | – | |||
| Flux(e) | – | |||
| PDS 70 d? | ||||
| Separation(b) | – | |||
| PA(c) | – | |||
| Contrast(d) | – | |||
| Flux(e) | – | |||
| F480M | ||||
| PDS 70 | ||||
| Separation(b) | ||||
| PA(c) | ||||
| Contrast(d) | ||||
| Flux(e) | ||||
| PDS 70 | ||||
| Separation(b) | ||||
| PA(b) | ||||
| Contrast(c) | ||||
| Flux(e) | ||||
Notes: (a)Astrometric and contrast/flux predictions based on orbital fits and best-fit atmospheric models presented in Wang et al. (2021b) and M19. The contrast value reported for in M19 is corrected from the expected change in total intensity scattering efficiency based on the difference in PA with respect to the 2019 epoch. (b)Radial separation in mas. (c)Position angle measured east of north in . (d)Contrast ratio with respect to the star and unresolved inner disk. (e)Spectral flux density in Wmm-1.
C.2 Direct NEGFC on the IPCA images
We also considered NEGFC performed directly in the IPCA images, hereafter NEGFC+IPCA, assuming self- and over-subtraction effects are (close to) fully corrected in those images. Since the IPCA images also recovered significant extended signals. It is unclear what the optimal figure of merit should be for protoplanet signals from close to, or overlapping with, complex extended signals, such as an inclined inner disk or a spiral accretion stream. Thus the major source of uncertainty for the parameters of the protoplanets for NEGFC+IPCA is rather associated to the correct assumption to be made in terms of the contribution from underlying extended signals at the location of the protoplanets. We therefore considered a range of figures of merit and associated parameters, corresponding to using either the sum, standard deviation or Hessian-matrix determinant figures of merit, for a source position corresponding to either the predicted location based on Wang et al. (2021b) and M19 orbital fits, or the visual location of a local maximum in intensity in the image. We considered two subcases corresponding to using either 1-FWHM or 2-FWHM apertures for the sum and standard deviation figures of merit, and three subcases for using either = 1, 2 or 3 for the Hessian-based figure of merit. We thus retrieved planet parameters for 14 cases in total, for each protoplanet in each dataset.
Among the 14 cases, the ones considered in our estimate of final planet parameters were vetted visually upon inspection of the IPCA image after subtraction of a negative planet model with parameters found by the different figures of merit. We only considered visually pleasing results after subtraction of the estimated protoplanet parameters from the image, considering our prior knowledge of the disk (e.g., inner and outer disk geometry) such that valid estimates were typically the ones removing the local intensity peak while not creating a significant hole within the surrounding extended signal distribution. The selection of different cases depended on the considered protoplanet and filter, as each image and protoplanet location are affected by more or less surrounding circumstellar signals. We then considered the median of the results obtained for the cases validated visually, and adopted the standard deviation of these results as the uncertainty associated to the contamination by surrounding extended signals. As for the classical NEGFC approach, we added in quadrature systematic astrometric uncertainties and photon noise uncertainties to the uncertainties associated to contamination by surrounding extended signals. Our results are reported in the ‘IPCA’ column of Table 2.
Given the overlap between the signals of planet , candidate , the spiral accretion stream and inner disk signals, we adopted an iterative joint-fitting strategy to estimate the parameters for planet and candidate d. We started by estimating the parameters from , as it is more easily dissociated from surrounding extended signals, estimated the parameters for d in the image without the signal of (similar to Fig. 1c), then re-estimated the parameters for this time in an image where the estimated contribution from d was removed, and so on. This procedure converged to stable estimated parameters for both sources within five iterations. We conservatively adopted for both sources the astrometric uncertainties corresponding to the largest uncertainty found among the two sources.
As a safety check, we inspected the IPCA images after subtraction of the optimal parameters found for the protoplanets with the direct NEGFC procedure, using the image cube where the optimal outer disk model was subtracted (NEGFD), to ensure that the estimates did not over- nor underestimated the flux.
C.3 Final NEGFC results
Table 2 shows that the astrometry and photometry extractions using NEGFC+roll and NEGFC+IPCA are consistent in all cases where retrieval of planet parameters could be made in both the roll-subtracted and IPCA images (i.e., planet with both filters, and planet in the F480M data). This suggests that IPCA recovered most of the self- and over-subtracted flux affecting roll-subtracted images. Nonetheless, neither approach is devoid of weakness for parameter estimation. It is unclear whether IPCA did recover all the self-/over-subtracted flux for cirumstellar signals, including the protoplanets, while on the other hand, it is unclear how much residual extended signals filtered by roll subtraction may lead to a mis-estimation of the NEGFC+roll planet fluxes. We therefore conservatively consider as final results (presented in Table 1) the mean of the results obtained with NEGFC+roll and NEGFC+IPCA, in cases where both estimates are available, and adopt the largest uncertainties among the two approaches.
In general, the visual vetting of NEGFC+IPCA results rejected the results obtained with the sum figure of merit as it systematically led to a ‘hole’ within the surrounding patch of pixels, which we interpret as likely overestimating the flux of the protoplanet alone. Only in the case of planet in the F187N data, did the results appear visually satisfactory as the protoplanet is located just outward of the inner disk (although signals from both components appear connected at the resolution of our observations). In that case, it was fair to consider the possibilities that either most of the flux at the location of within our flux uncertainties is due to the protoplanet itself, or that there is non-zero contributing signal from the inner disk. These possibilities are well captured with the sum and standard deviation figures of merit, respectively. We therefore considered the median and standard deviation of the parameters retrieved for all corresponding subcases as our reported NEGFC+IPCA results. We also note that this case (planet in F187N) was the only one where the Hessian-based figure of merit did not work properly for NEGFC+IPCA, due to similar flux levels for and the adjacent inner disk signals. On the contrary, this figure of merit worked the best in the NEGFC+roll approach, compared to sum or standard deviation figures of merit, based on our positive fake companion injection tests, which we interpret as due to the stronger self-subtraction of (the closer-in) inner disk signals, which makes the planet signal stand out from it. Similar remarks can be made for planet in the F480M images, where the IPCA images better recover inner disk signals, hence tend to provide slightly closer radial separation estimates for the protoplanet due to the bias from the inner disk.
For planet in the F187N data, the estimated parameters are affected by large uncertainties as a lot of additional signals is recovered by IPCA around the planet, including the spiral accretion stream and candidate , which makes the estimate of the contribution from the planet alone difficult. For planet in the F480M data, the NEGFC+roll and NEGFC+IPCA results are very similar, both approaches leading to visually satisfactory results in the images obtained after subtraction of the respective optimal planet parameters. We note nevertheless a potential shift to a larger estimated PA in the F480M data than expected from orbital fits, which may reflect either contamination by the spiral accretion stream in this lower angular resolution image, or a mis-estimation of the orbit from earlier astrometric measurements.
C.4 Additional tests
Regarding the presence of excess signals compared to atmospheric model predictions for the protoplanets (Sec. 3.2), we subtracted a scaled version of the observed PSF with the appropriate contrast ratio to match the flux predicted by the best-fit DRIFT-PHOENIX model for the SED of planet presented in Wang et al. (2021b), at the predicted location for the planet based on the orbital fits presented in Wang et al. (2021b). Using the position inferred by NEGFC in the previous sections, instead of the predicted location, does not change the conclusion. The results of this safety check are shown in the left and right columns of Fig. 9 for PDS 70 c, in the F187N and F480M filter images, respectively. The residual signals observed at the location of the protoplanet suggest indeed the presence of excess emission compared to predictions from the best-fit atmospheric models alone.
We performed a similar test for planet in the F480M data, shown in the middle column of Fig. 9. In this case, we subtracted the flux corresponding to the lower uncertainty of the estimate found with NEGFC (reported in Table 1) which is roughly midway between the best-fit BT-SETTL model with blackbody excess, and both the DRIFT-PHOENIX and extinct EXOREM models without blackbody excess. This test suggests that our reported uncertainty is sound, and that there is thus tentative excess compared to predictions from atmospheric models without an extra blackbody contribution representative of circumplanetary disk emission.
For comparison, the images obtained after subtraction of the optimal parameters found by NEGFC for protoplanets and are shown in Fig. 1c and f for the F187N and F480M images, respectively.
Appendix D Predicted and observed spirals

Figure 10 compares our disk-subtracted F187N and F480M images (panels b and c) to a simulated IR image predicting the spiral accretion stream associated with protoplanet (panel a). The latter is based on dedicated 3D hydro-dynamical simulations made with smoothed-particle hydrodynamics code PHANTOM (Price et al. 2018), presented in Toci et al. (2020). The simulated image corresponds to a radiative-transfer prediction at 2.11 m of the PHANTOM simulation made with Monte-Carlo radiative transfer code MCFOST (Pinte et al. 2006), where a proxy for the outer disk signal has been subtracted. This proxy consists in another radiative-transfer prediction for a different snapshot of the same hydro-dynamical simulation corresponding to planet being located at 180 from its observed position angle. We therefore mask the bottom part of the image, as it is affected by strong residuals associated to the spiral accretion stream being subtracted from that part of the image. We measured the trace of the spiral accretion stream in the simulated image, through the identification of local radial maxima in the image, in steps of 1 . The trace, shown with white dots, is then also plotted on top of the F187N and F480M images. We notice a remarkable correspondence with the observed spiral-like signal in the F187N image, and with the inner arm of the tentative fork seen in the F480M image (better seen in Fig. 1e and f)
The arm-like signal identified and characterized in Juillard et al. (2022) is also shown with orange dots in Fig. 10c. This corresponds to the trace inferred from a 2021 H-band VLT/SPHERE dataset (ESO Program 60.A-9801; see more details in Juillard et al. 2022). We also note a good agreement with the outer arm observed in the F480M image, suggesting it traces the same feature as observed in VLT/SPHERE images. The coarse angular resolution of the image and the different wavelength of the observation (compared to prior ground-based images where the feature is seen) prevent however a meaningful proper motion analysis of the spiral feature similar to what was done in Juillard et al. (2022).
Appendix E Constraints on additional planets
E.1 Signal-to-Noise Ratio maps
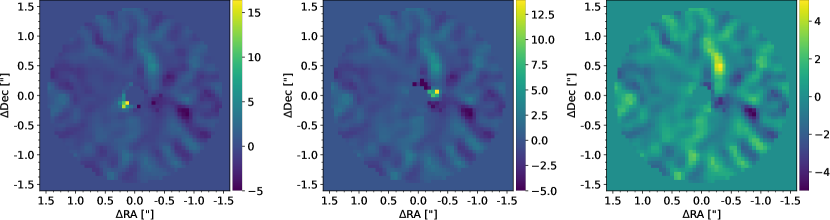
Figure 11 shows the Signal-to-Noise Ratio (SNR) maps obtained with roll subtraction on the image cube where the optimal radiative disk model, and protoplanets and c, were all subtracted with their optimal parameters found with NEGFD (Appendix B) and NEGFC (Appendix C), respectively. Since both protoplanets share similar projected radii, the SNR maps are shown with planet (resp. ) removed to evaluate the significance of planet (resp. ) in the left (resp. middle) panel. Both planets are removed in the right panel, to assess the SNR of residual signals apart from the planets. We do not detect any additional planet candidate in the outer disk. Only the spiral-like feature located in the outer wake of planet stands out at SNR.
E.2 Mass sensitivity curves
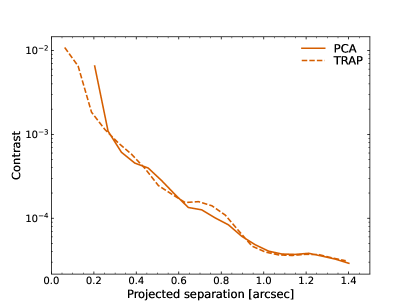
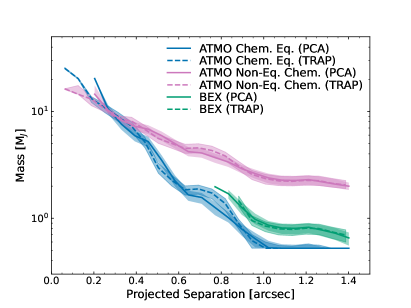
Fig. 12 (left) shows the contrast curves achieved with PCA-roll (Appendix A.2) and TRAP (Samland et al. 2021) on the image cube obtained after subtraction of the optimal disk and planet models, determined with NEGFD and NEGFC, respectively. A wedge was defined to encompass PA values between 10 and 160 when calculating the contrast curves, to avoid any significant disk residuals, including the arm-like feature, to bias the contrast estimation.
We converted the achieved contrasts to mass sensitivities using the ATMO2020 models (Phillips et al. 2020), with both equilibrium and non-equilibrium chemistry, and the BEX models (Linder et al. 2019), assuming an age of 5.41 Myr (Müller et al. 2018). These mass limits are shown in Fig. 12 (right), with the shaded region representing the 1 uncertainty on mass limits due to the uncertainty in target age. The ATMO2020 evolutionary models cover masses above 0.524, while the BEX models cover masses below 2. There is some scatter in the calculated mass sensitivity based on the different spectra for each model assumption; models at this young age are also finely sensitive to initial conditions. The curves show that we would have been sensitive to planets with a mass (resp. 0.8) at 0.6 (resp. 1) separation from the star, according to the BEX and ATMO (in chemical equilibrium) models – noting that we hit the bottom of the ATMO grid of models (in chemical equilibrium) in terms of planet mass. In case of non-equilibrium chemistry in the atmosphere, planets as massive as 2-4 may still be present, yet unseen, in the outer disk. Even larger mass giant planets may be hidden in the outer disk if their signal is extinct. Nonetheless, multi-Jovian mass giant planets would likely also have affected the gas density profile, which ALMA reveals to extend beyond (i.e., beyond 170 au) in radius without any additional gaps than the one carved by protoplanets and (Keppler et al. 2019).
Appendix F The F187N excess for planet c
All flux estimates shown in Figs. 2 and 3, but the NIRCam ones rely on either a model of the star plus inner disk or absolute (spectro-)photometry of the star measured at a different epoch than the epoch of the observation which allowed the contrast measurement of the planet with respect to the star, for the scaling of contrasts to absolute fluxes. Variability of the star plus unresolved inner disk flux (Casassus & Cárcamo 2022; Perotti et al. 2023) can thus result in significant differences between the actual photometry and the assumed one for the star, hence affect accordingly the protoplanet flux. To illustrate the amplitude of this bias, we multiplied our measured contrasts for and to the F187N stellar flux inferred based on the 0.7-2.7m SpeX spectrum of PDS 70 (Long et al. 2018) used in other works, and show the results with light blue error bars in Figs. 2 and 3. This may thus partly account for the observed discrepancy.
Another source of misestimation for the flux of planet is the bright outer disk edge, for measurements leveraging angular differential imaging (Marois et al. 2006), and done without prior disk model subtraction from the images. Bright disk signals captured in the model stellar PSF lead to a pair of negative traces encasing the positive trace of the disk in PSF-subtracted images, similar to what can be seen in the roll-subtraction images (Fig. 4a and e), significantly dampening any other signal in the negative trace (e.g., planet and the accretion stream in Fig. 4a). Classical NEGFC (with the ‘sum’ figure of merit) or other point-source forward-modeling approaches are not tailored to properly account for self- and over-subtraction effects associated to the bright disk, and may underestimate the point source flux if located in such very negative disk trace. The exact amplitude of this bias is difficult to assess as it depends on the disk scattering phase function (stronger effect close to PAb where the disk is the brightest), the number of principal components used for PCA-based reductions (see e.g., Fig. 2 in Juillard et al. 2022), and the wavelength of the observation, as the disk is brighter, hence the effect stronger, at shorter wavelengths. If the SPHERE/IFS measurements (0.9–1.6 m) are underestimated, the best-fit models presented in Wang et al. (2021b) may also underpredict the F187N flux, hence inflate our reported 1.87m excess.
Another possibility is the inclusion of bright circumplanetary signals that are resolved in ground-based observations, but unresolved in the lower angular resolution images of our observations, hence contributing only to our NIRCam measurements. However, the difference in angular resolution between the longest wavelengths of the SPHERE/IFS observations and our JWST/NIRCam images is minor, with an estimated FWHM about 70% smaller for the former compared to the latter. This hypothesis appears thus unlikely to account on its own for the factor excess measured in the F187N compared to atmospheric model predictions.
Alternatively, part of the measured F187N excess may be assigned to the presence of significant Pa- line emission, an hypothesis discussed in more details in the main text (Sec. 3.2).
Appendix G Schematic representation of the system
In Figure 13, we summarize our knowledge about and interpretation of the different features of the PDS 70 system, drawing on Keppler et al. (2018, 2019), Mesa et al. (2019), Isella et al. (2019), Benisty et al. (2021), Casassus & Cárcamo (2022), Wang et al. (2021b), and this work.
