Violent starbursts and quiescence induced by FUV radiation feedback in metal-poor galaxies at high-redshift
Abstract
JWST observations of galaxies at suggest that they are more luminous and clumpier than predicted by most models, prompting several proposals on the physics of star formation and feedback in the first galaxies. In this paper, we focus on the role of ultraviolet (UV) radiation in regulating star formation by performing a set of cosmological radiation hydrodynamics simulations of one galaxy at sub-pc resolution with different radiative feedback models. We find that the suppression of cooling by far UV (FUV) radiation (i.e., dissociating radiation) from Pop II stars is the main physical process triggering the formation of compact and massive star clusters and is responsible for the bursty star formation observed in metal-poor galaxies at . Indeed, artificially suppressing FUV radiation leads to a less intense continuous mode of star formation distributed into numerous, but low-mass open star clusters. Due to the intense FUV field, low-metallicity clouds remain warm () until they reach a relatively high density (), before becoming self-shielded and transitioning to a colder (), partially molecular phase. As a result, star formation is delayed until the clouds accumulate enough mass to become gravitationally unstable. At this point, the clouds undergo rapid star formation converting gas into stars with high efficiency. We, therefore, observe exceptionally bright galaxies (ten times brighter than for continuous star formation) and subsequent quenched ”dead” galaxies that did not form stars for tens of Myrs.
1 Introduction
The rise of the first generation of galaxies, also referred to as ”the first galaxies,” marks a significant milestone in the history of the Universe (see, Bromm & Yoshida, 2011; Stark, 2016; Dayal & Ferrara, 2018, for reviews). These early galaxies, which are precursors to present-day galaxies such as our Milky Way, form after the formation of massive first-generation stars, also known as Pop III stars (e.g., Sugimura et al., 2020, 2023, and references therein). It is widely believed that the first galaxies are the primary, if not the sole, sources of ultraviolet (UV) ionizing photons that lead to the reionization of the intergalactic medium (IGM), a process that is completed around a redshift of approximately (e.g., Fan et al., 2006).
Recently, the James Webb Space Telescope (JWST) opened up a new era for observations of high-redshift galaxies. One of the most intriguing discoveries made by JWST is the unexpectedly high abundance of luminous galaxies at high redshifts (e.g., Harikane et al., 2023a, 2024; Robertson et al., 2023; Hainline et al., 2023). Several mechanisms have been proposed to account for such high abundance, including bursty star formation (Mason et al., 2023; Shen et al., 2023; Sun et al., 2023, but also see Pallottini & Ferrara 2023), feedback-free star formation (Dekel et al., 2023), radiation-driven dust outflow (Ferrara, 2023; Ferrara et al., 2023), and positive active galactic nuclei (AGN) feedback (Silk et al., 2024). However, at this moment there is no consensus on the dominant mechanism, or combination of mechanisms, that regulates star formation in the first galaxies.
Supernovae (SNe) of both Pop III stars and subsequently formed metal-poor Pop II stars, is generally believed to have a significant impact on the formation and evolution of the first galaxies. Additionally, the observational evidence of low-mass AGNs in the high-redshift Universe suggests that their feedback may also play an important role (Kocevski et al., 2023; Harikane et al., 2023b; Maiolino et al., 2023). UV radiation from Pop III and Pop II stars can also be important in regulating star formation in the first galaxies, especially at the low-mass end of the galaxy mass distribution. Specifically, the photoionization of neutral hydrogen by extreme UV (EUV) photons (, where is the Planck constant and is the photon frequency) can produce galaxy outflows and is responsible for the reionization of IGM (e.g., Pawlik et al., 2017; Rosdahl et al., 2018; Lovell et al., 2021; Ocvirk et al., 2020; Kannan et al., 2022), leading to the suppression of star formation in low-mass galaxies after the epoch of reionization (e.g., Efstathiou, 1992; Barkana & Loeb, 1999; Gnedin, 2000; Okamoto et al., 2008). On the other hand, photodissociation of molecular hydrogen by far UV (FUV) photons (; Lyman-Werner bands) delays the formation of Pop III stars (e.g., Haiman et al., 2000; O’Shea & Norman, 2008; Johnson et al., 2013; Park et al., 2021a, b, 2023) and, in extreme cases, induces the formation of direct collapse black holes (BHs) in atomic cooling halos (e.g., Omukai, 2001; Bromm & Loeb, 2003; Shang et al., 2010; Hosokawa et al., 2013; Sugimura et al., 2014, 2017a; Chon et al., 2016, 2018; Chiaki et al., 2023; Kimura et al., 2023).
Radiation hydrodynamics (RHD) simulations have been a powerful tool for advancing our understanding of the formation of the first galaxies under UV feedback (e.g., Ricotti et al., 2002a, b, 2008, 2016; Wise & Abel, 2008; Wise et al., 2012a, b, 2014; O’Shea et al., 2015; Jeon & Bromm, 2019; Abe et al., 2021; Pallottini et al., 2022; Yajima et al., 2023). Thanks to advances in computational power and numerical algorithms, RHD simulations with sub-pc resolution have recently become feasible and succeeded in following the formation of bound star clusters in high-redshift galaxies (Ma et al., 2020; Garcia et al., 2023, hearafter G23). However, the effects of UV feedback have not been thoroughly investigated using such sub-pc resolution RHD simulations.
In this paper, we investigate the importance of different types of UV feedback in the early stages of galaxy formation, focusing on the time evolution until the cosmic age or . The simulation suite used in this study is the same as the one used in G23, which examined the formation and evolution of star clusters during the formation of the first galaxies. To better understand the contribution of each feedback effect, we perform control runs where certain feedback processes are artificially turned off, in addition to the fiducial run including all feedback mechanisms.
The structure of this paper is as follows. In Sec. 2, we provide an explanation of our numerical methods and simulation runs. In Sec. 3, we describe our findings on the formation history of a first galaxy, with specific emphasis on the starburst induced by FUV radiation. In Sec. 4, we discuss the other roles of UV feedback and briefly examine the formation and growth of BHs in our simulations. Lastly, in Sec. 5, we provide a summary and conclusion of our work.
2 Methods
2.1 Numerical methods
Our simulations use an extended version of the cosmological adaptive mesh refinement (AMR) RHD code, ramses-rt (Teyssier, 2002; Rosdahl et al., 2013). This version of the code has been specifically developed for simulating the formation of the first galaxies. It incorporates newly implemented realistic subgrid-scale physics models and was first used in G23. Various physics modules in the code have been developed and described in previously published works on galaxy formation (Kimm et al., 2017; Katz et al., 2017), star formation in molecular clouds (He et al., 2019, 2020), and Pop III star formation (Park et al., 2021a, b, 2023, 2024). In this section, we provide only an explanation of the code components directly relevant to this study. A comprehensive description will be provided in the upcoming paper (Sugimura et al., in prep.). The numerical model is identical to the one described in G23 unless otherwise specified, and additional details can be found there.
We perform cosmological zoom-in simulations around a dark matter (DM) halo, which is the same as in G23. The initial condition is generated at with music (Hahn & Abel, 2011). This halo reaches a mass of by and evolves into an analog of dwarf galaxies in the Local Group by (Ricotti et al., 2022). The simulations are performed within a larger box of size on each side, where is the Hubble parameter. The zoom-in region with a side length in each direction has an initial spatial resolution of and a DM mass resolution of at the refinement level . In analyzing the simulation results, we identify DM halos using the rockstar halo finder (Behroozi et al., 2013a, b), which provides information on their merger history.
To achieve high resolution within targeted galaxies at a reasonable computational cost, we employ the AMR technique and refine cells based on both Lagrangian and Jeans refinement criteria. While we use a Lagrangian refinement criterion for DM and gas, we do not apply it to stars, unlike G23. Specifically, we refine a cell if it contains more than eight DM particles or if the gas mass exceeds eight times the initial mean value in the zoom-in region (approximately ). Furthermore, we refine cells to resolve the Jeans length with at least cells. We set for cells with (), and for cells with (), where denotes the cell size. The smallest cells at the highest level have a physical size of .
In our simulations, we follow the dynamics of DM, gas, and stars in the expanding universe. We also follow the evolution of radiation fields in four frequency bins: FUV (; dissociation of ), EUV (; ionization of ), -ionizing (), and -ionizing () photons. To solve the radiation transfer equations, we employ a moment-based method with M1 closure (Rosdahl et al., 2013). We consider the non-equilibrium chemistry of primordial species (, , , , , ), assuming that is in chemical equilibrium with other species. We do not adopt a subgrid clumping factor for the formation of on dust. Thermal evolution is determined by the cooling and heating processes of primordial species (Park et al., 2021a) and metals (Kimm et al., 2017; Katz et al., 2017). For this work, we newly incorporate FUV absorption in highly self-shielded cells (Park et al., 2021a) and photoelectric heating of dust (Kimm et al., 2017), in addition to the model used in G23.
We treat star formation using a subgrid model. Stars are formed if the density of a cell, , in the maximum level exceeds the critical value:
| (1) |
where is temperature and is the fiducial parameter taken in our simulations. This criterion ensures that the Jeans length is resolved with at least cells at the highest level (G23). By setting a density threshold of approximately , we can safely assume that star formation is occurring there. However, directly simulating the process of star formation is computationally infeasible. Instead, we create stars using models that depend on metallicity, as explained in the following.
If the metallicity is less than the critical metallicity , with the solar metallicity , we create a binary system consisting of two Pop III stars with masses of 40 and , respectively. This system is represented by a single Pop III star particle with a mass of (G23). Of course, this simplified model does not capture the variety of Pop III systems, as is evident in previous simulations of Pop III star formation (Hosokawa et al., 2011, 2016; Hirano et al., 2014, 2015; Susa et al., 2014; Stacy et al., 2016; Sugimura et al., 2020, 2023; Latif et al., 2022; Park et al., 2021a, b, 2023). Therefore, we intend to update the model in light of the latest understanding of Pop III star formation in future simulations.
After emitting UV radiation for the lifetime of (Schaerer, 2002), the star undergoes a powerful SN, also known as a hypernova. This SN releases of the ejecta, which contains of metal and of thermal energy, into the cell and leaves a BH. On the other hand, the star directly collapses into a black hole (BH) without explosion (Woosley et al., 2002; Wise et al., 2012b). For simplicity, here we assume that the binary BHs with masses of and merge to form a single BH with a mass of , although our numerical treatment does not differentiate between binary and single BHs. As a result, one Pop III star particle is transformed into one BH particle with a mass of . We track the growth of BHs using the Bondi-Hoyle-Lyttleton rate, , where is Newton’s gravitational constant, is the locally evaluated gas density, is the sound velocity, and is the relative velocity between the BH and gas. Previous studies have shown that the actual accretion rate can be either suppressed or enhanced due to radiation from BH accretion disks (Park & Ricotti, 2013; Sugimura & Ricotti, 2020). However here, for the sake of simplicity, we do not take into account any mechanical or radiative feedback from the BHs.
If , we create Pop II star clusters consisting of multiple Pop II star particles with . These star particles represent a group of unresolved stars, and their mass distribution is assumed to follow the Salpeter initial mass function (IMF) ranging from 1 to 100 (Salpeter, 1955). Around the density peak where the density exceeds the star formation threshold , we calculate the spherically averaged one-dimensional (1D) density profile and define the radius of a dense cloud, , at which the 1D profile reaches . This cloud is a high-redshift analog of molecular clouds but not necessarily molecular if the metallicity is much smaller than the solar value. Using the radius , we determine the mass (), average density (), and average metallicity () of the cloud. Within the cloud, we create stars with a total mass of , where the efficiency is suggested by star cluster formation simulations (He et al., 2019, see also G23):
| (2) |
Pop II star particles () are randomly distributed in a density-weighted manner within , but only in dense regions of the cloud where the density exceeds . Instead of assuming fixed values of as in G23, we use that increases with the density and mass of the cloud (e.g., He et al., 2019). In addition to modifying the form of , we have chosen parameters related to Pop II star formation different from those of G23, to reduce computational expenses by increasing the particle mass. For reference, they adopted , , and .
Pop II star particles emit UV radiation depending on their age and metallicity (Bruzual & Charlot, 2003; Katz et al., 2017). According to the Salpeter IMF, we expect approximately one massive star () per every of stars. Therefore, we assume that each Pop II star particle with undergoes one supernova explosion. The explosion occurs in a random and uniform manner between and (Leitherer et al., 1999), with an ejecta mass , a thermal energy and a metal mass (Kimm et al., 2015).
2.2 Simulation runs
| Run | Pop III | Pop II | ||
|---|---|---|---|---|
| EUV | FUV | EUV | FUV | |
| fiducial | ||||
| pop2noFUV | — | |||
| noFUV | — | — | ||
| pop2noEUV | — | |||
| noEUV | — | — | ||
We perform simulations using various UV feedback models to better understand the role of each feedback mechanism. Specifically, we investigate cases where either FUV or EUV feedback is artificially disabled, in addition to the fiducial run with full feedback. When disabling each feedback mechanism, we further consider two cases in which the feedback from Pop II stars alone or from both Pop II and Pop III stars is turned off. The summary of the simulation runs performed in this work is provided in Table 1.
3 Results
3.1 Overall formation history of the first galaxy in the fiducial run
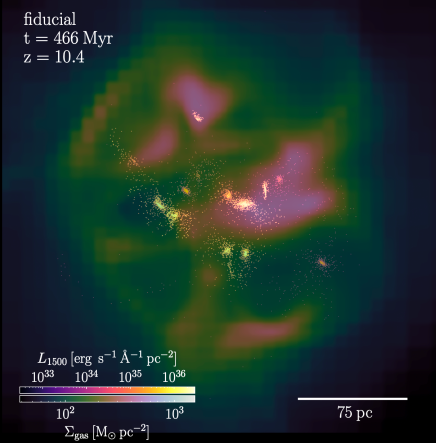
In this section, we describe the formation history of the first galaxy for the initial of the Universe (until ) in our fiducial run with full feedback. Before going into detail, we present the 3D rendering of the first galaxy during the period of the most intensive star formation at in Fig. 1. The galaxy exhibits an irregular morphology in terms of gas and stars, with a highly clustered distribution of stars.
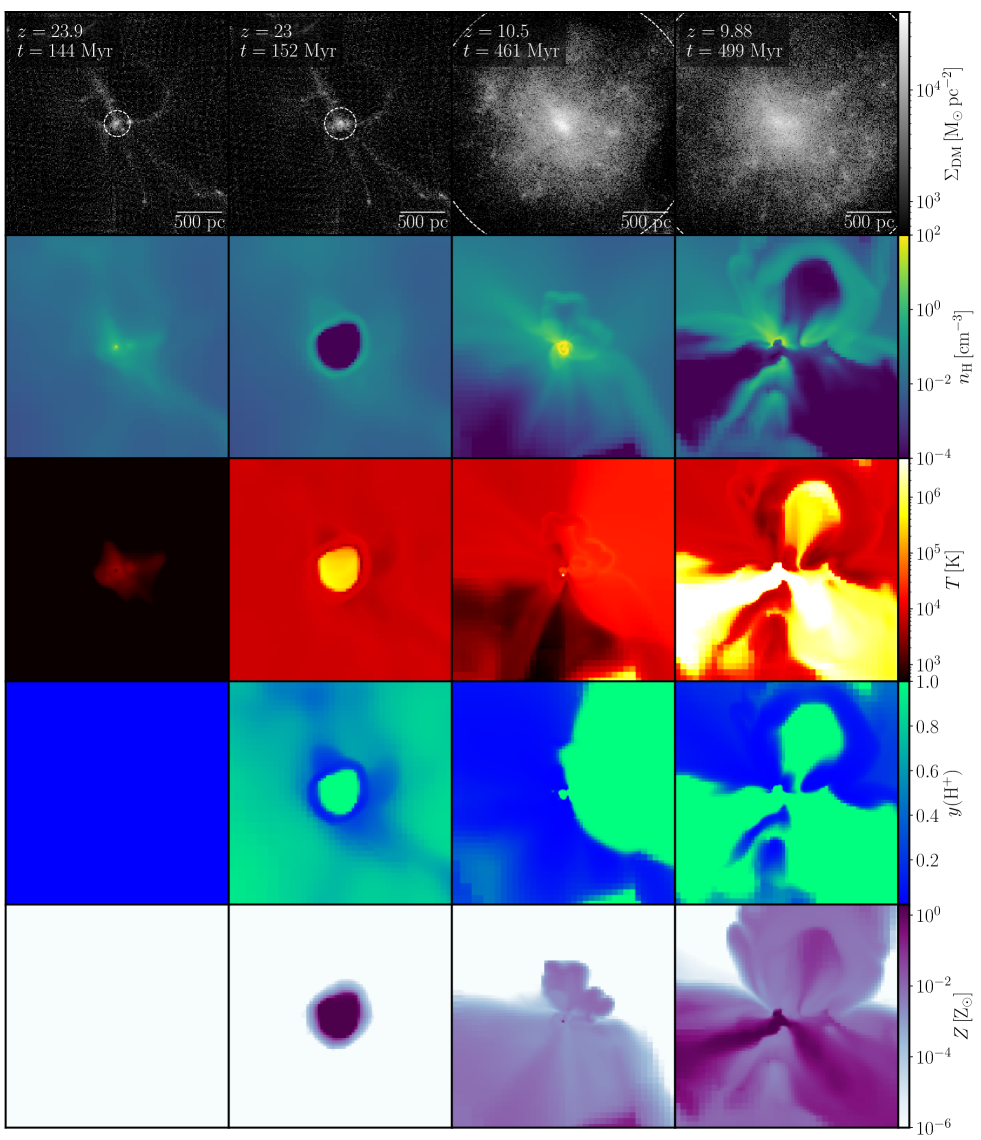
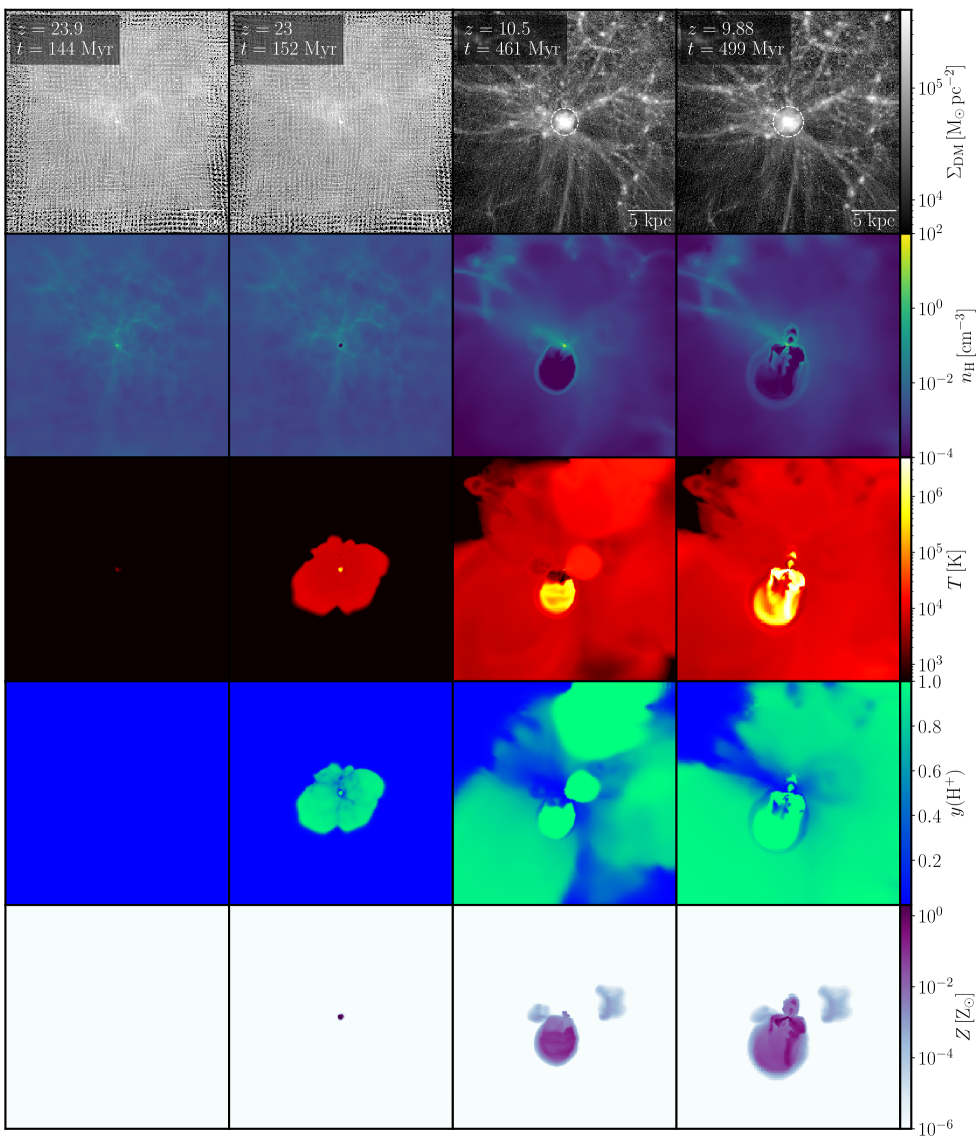
The time evolution of the first galaxy and its progenitor is depicted in Figs. 2 and 3. These figures display small-scale views with dimensions of 2.5 on each side and large-scale views with dimensions of 25 on each side, respectively. The variables shown in the figure include the DM surface density, gas density, temperature, ionization degree, and metallicity. These variables are plotted for the four distinct periods: formation of a Pop III star (), expansion of a Pop III SN (), burst of Pop II star formation (), and quenching of Pop II star formation ().
The DM snapshots (first rows) illustrate the growth of the host DM halo of the first galaxy in the cosmic large-scale structures. An initially small mini-halo, which serves as the host for the formation of Pop III stars at , undergoes significant growth. It eventually becomes a much larger halo and hosts the first galaxy, where a Pop II starburst event occurs at (see also Fig. 5 below for the time evolution of the halo mass and radius).
The gas density snapshots (second rows) clearly depict the various stages involved in the formation of the first galaxy. At , pristine gas condenses at the center of the minihalo, leading to the formation of a Pop III star. This star emits UV radiation throughout its lifetime of and eventually explodes as a hypernova, resulting in the creation of a large cavity around it, as displayed at . Later, at , the gas accumulates once again as the host DM halo grows, leading to a starburst that generates the majority of stars composing the first galaxy. As a result of the SN and radiative feedback from the Pop II stars formed during the starburst, the gas is expelled from the first galaxy at .
The temperature snapshots (third rows), ionization degree snapshots (fourth rows), and metallicity snapshots (fifth rows) are consistent with the time evolution of the density snapshots mentioned above. Although their morphologies are correlated, they are not exactly the same. The temperature rises to due to photoinoization heating by EUV photons from Pop III and Pop II stars, but decreases to relatively quickly as a result of gas cooling. Gas temperatures higher than that of the photoionized regions can be achieved by SN explosions, where the temperature initially reaches . Ionization occurs both in the photoionized regions and collisionally-ionized SN bubbles, but the recombination time is usually longer than the cooling time, resulting in long-lived partially ionized regions (see, Hartley & Ricotti, 2016). Metal pollution is limited to the regions where the SN ejecta reach, but persists for a long time. It is worth noting that the distribution of these three quantities is highly anisotropic.
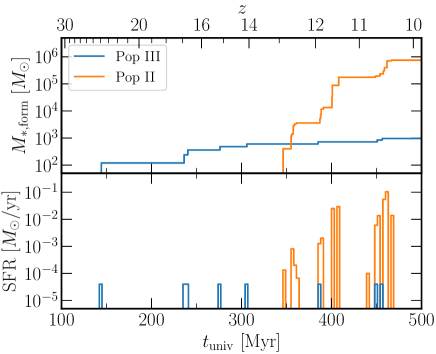
Next, we analyze the star formation history in more detail. Fig. 4 shows the time evolution of the total stellar mass (top) and star formation rate (SFR) averaged over a period of (bottom) in the zoom-in region (). The formation of Pop III stars occurs in various locations within the zoom-in region, whereas Pop II star formation is restricted to the main halo, as we will see below. The formation of Pop III stars begins at and continues until the end of the simulation at . The transition from Pop III to Pop II stars occurs at due to the metals produced by Pop III SNe. The formation of Pop II stars is not continuous, but rather intermittent. There are roughly three episodes of star formation bursts, the first around , the second around , and the last one, providing the majority of the stellar mass, around .
Fig. 5 provides information regarding the main progenitor of the first galaxy, rather than the entire zoom-in region, as depicted in Fig. 4. The top panel of Fig. 5 shows the time evolution of the virial radius of the progenitor halo, while the bottom panel shows the masses of DM, gas, Pop II stars, and (Pop III remnant) BHs within at a function of time (and redshift). To determine the main progenitor, we trace the merger tree from the first galaxy at the final timestep and select the larger progenitor in cases where the merger tree splits into two progenitors.
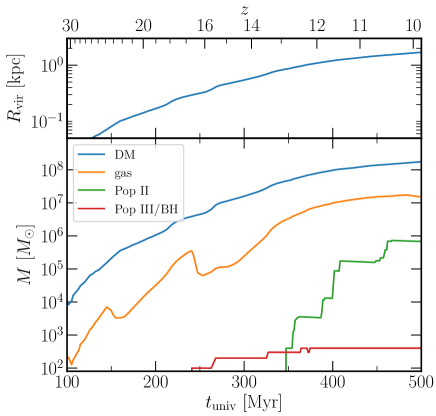
In Fig. 5, we see that the host DM halo grows over time: it starts from a small minihalo with and the virial mass at and evolves into a larger halo with and by the end of the simulation at . The slopes of both and exhibit slight steepening around , , , indicating the occurrence of major merger events with other DM halos. The mass of Pop II stars increases intermittently, exactly following the star formation history of Pop II stars in the zoom-in region (Fig. 4), indicating that the Pop II stars form only near the center of the main galaxy, as mentioned above. The BH mass increases only discretely, suggesting that the BH growth by gas accretion is negligible and that the increase in total BH mass is due to the addition of new BHs resulting from mergers with other halos containing BHs. A more detailed analysis of BH growth will be presented in Sec. 4.2. Since the growth of BHs through gas accretion is negligible and each BH retains an initial mass of , the number of BH particles, or equivalently Pop III progenitors, can be estimated as . At the end of the simulation, the galaxy contains BHs. The gas mass roughly follows the DM mass with the proportionality coefficient given by , where denotes the cosmic baryon fraction. During the early stages, when the halo is small and the escape velocity is low, it is relatively easy for the gas to be expelled from the halo. The initial decrease in gas mass at is caused by EUV feedback from a binary Pop III system that formed in a different halo than the main one. The second decrease at is attributed to the feedback from EUV photons emitted by the Pop III binary system formed in the main halo and a subsequent hypernova explosion. In the later stages, when the halo becomes more massive and the escape velocity increases, it becomes more challenging to expel the gas from the halo, even though star formation is still quenched by feedback as a result of the evacuation of gas from the central region where star formation is active.
In this simulation, Pop II stars form in star clusters within dense gas clouds (Sec. 2.1). The distribution of stellar clusters and dense clouds in the time-metallicity plane is shown in Fig. 6, where the masses of star clusters and gas clouds are represented by color and symbol size, respectively. The star formation bursts at , , and , observed in Fig. 4, can also be identified in this figure. The last and largest burst at is primarily caused by the formation of a few massive star clusters. Fig. 6 also reveals that the metallicity of the clouds, and consequently star clusters, roughly follows the average gas metallicity of the galaxy within the virial radius, with the scatter being attributed to the inhomogeneous metallicity distribution within the galaxy. In the following paragraphs, we introduce a simple analytical model that reproduces the observed evolution of gas metallicity resulting from the SNe of Pop III and Pop II stars.
To start, we examine the metal enrichment by Pop III stars. The metal mass present in a halo due to Pop III SNe can be expressed as , where represents the number of Pop III systems formed by that time and is the fraction of metals retained in the halo (see Sec. 2.1 for the value of metal mass produced per Pop III SN, ). Additionally, the gas mass in a halo can be written as , where represents the fraction of baryons contained within the halo as gas. With these definitions, the metallicity evolution resulting from Pop III SNe can be modeled as
| (3) |
Here, the model depends on the combination of free parameters , which we set to the constant value from fitting the data, while and are directly from the simulation. As shown in Fig. 6, our model of metal enrichment by Pop III stars (Eq. 3, green line) exhibits reasonable agreement with the simulated gas metallicity (blue line) until metal enrichment by Pop II stars becomes significant ().
Metal enrichment by Pop II stars can be modeled in a similar manner. Each Pop II star particle with , representing unresolved individual stars whose mass spectrum follows a Salpeter IMF between , explodes as a SN once. Thus, the metal mass in a halo resulting from Pop II SNe can be expressed as , where represents the cumulative mass of formed Pop II stars and denotes the fraction of metals retained in the halo (see again Sec. 2.1 for the value of metal mass produced per Pop II SN, ). Consequently, the metallicity evolution caused by Pop II stars can be modeled as
| (4) |
where is the Pop II stellar-to-halo mass ratio. For we use the value from the simulated galaxy. Although and are not necessarily the same, we find that the value of fits the data well again. In Fig. 6, our model of metal enrichment by Pop II stars (Eq. 4, orange line) shows fair agreement with the late-time gas metallicity evolution in the simulation (). We observe that the rise of the metallicity in the model occurs about earlier than that of the simulated gas metallicity, which we attribute to the delay time of SNe from star formation. It is worth recalling that in our simulation, Pop II star particles undergo SN explosions stochastically within the time interval from their birth (Sec. 2.1).
Another aspect to note is that, at the time of their formation, the star cluster metallicities are typically higher than (or equal to) the mean gas metallicity. This is because star formation happens in the densest, most metal-enriched regions of the interstellar medium (ISM), while the mean gas metallicity also includes the more pristine gas accreting from the IGM into the galaxy. Accretion of pristine gas from the IGM also explains the decreasing mean metallicity from redshift to . On the other hand, if we observed this galaxy at any random time after the formation of the first significant episode of Pop II star formation (), we would observe that the gas metallicity (as measured in nebular lines) is higher than (or equal to) the mean metallicity of the stellar populations. This is a direct consequence of the bursty mode of star formation in this first galaxy: during the quiescent periods between starbursts the gas metallicity keeps increasing while the stellar metallicity remains the same until the next burst of star formation. A caveat is that if the accretion rate of pristine gas from the IGM is faster than metal production in the galaxy, the mean metallicity may decrease or stay constant as a function of time, as observed in our simulation at when metal enrichment is from Pop III stars.
To summarize, at (), the first galaxy in our fiducial run has a stellar mass of within a DM halo of . The distribution of gas and stars in this galaxy is classified as irregular, as shown in Fig. 1. The majority of stars are formed through burst star formation around . In the following section, we will examine this bursty mode of star formation in detail.
3.2 Starburst induced by FUV feedback
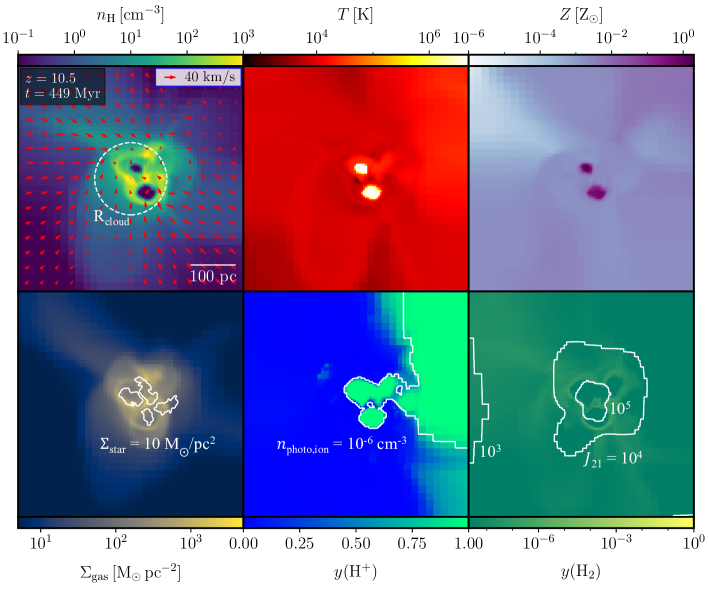
In this section, we investigate the mechanisms leading to the bursty mode of star formation in the first galaxies, examining, in particular, the burst of star formation at in the fiducial run. We start by presenting snapshots of various physical quantities in the central region of the galaxy during the burst in Fig. 7.
In the upper-left panel, we display the density of the gas along with the velocity field. Additionally, we provide information on the size of a dense cloud that will soon be transformed into a star cluster based on our star formation model (Sec. 2.1). Within this star-forming cloud, we observe several subclumps with cavities resulting from SNe. Note that star-forming clouds in our simulations are not the smallest units of star formation, e.g., individual globular cluster progenitors or, more generally, star clusters, but often a collection of them. The cloud as a whole is gravitationally unstable and undergoes collapse, leading to star formation (see Fig. 8 below) that is fragmented into multiple sub-clumps of stars. Moreover, the cloud accretes gas from its surroundings, as depicted by the inward velocity field.
The bottom-left panel shows that the gas coexists with previous generation Pop II stars, as shown by the surface density plot for the gas (color) and for the stars (shown as an isocontour at M⊙/pc2). The UV radiation emitted by these stars creates ionized regions that are highly anisotropic and inhomogeneous, as shown by the ionization fraction and the EUV photon number density (white contour plot) in the bottom-center panel. It also creates rather isotropic and homogeneous dissociation regions around the stars, as indicated by the molecular fraction and the FUV specific intensity (white contour plot) in the bottom-right panel. Here, is the FUV specific intensity in units of , and it is related to the FUV number density through the equation , with the average energy of the FUV photons and the width of the frequency bin for FUV photons .
Due to the combination of an extremely high FUV field strength of (bottom-right) and an extremely low gas metallicity of (top-right), the neutral gas is maintained at a warm temperature of (top-middle) due to the complete suppression of cooling, as previously predicted by one-zone calculations in Omukai et al. (2008). The temperature is around for both the ionized and neutral phases of the ISM, except for within the SN bubbles (where it exceeds ) and in the high-density cores of gas clumps within the cloud that later will form a star cluster (where it drops below ). The overall gas temperature of the dense cloud is significantly higher than that of the local molecular clouds, which typically have temperatures around . A similar correlation between cloud temperatures (and mean cloud densities) with their metallicities was also found in G23.
This high temperature of the dense cloud is responsible for the starburst observed in our simulation. The cloud grows by accumulating surrounding gas, while star formation is delayed until the cloud reaches a sufficient mass to become gravitationally unstable against the high pressure of the relatively hot gas. Once the cloud becomes gravitationally unstable, it undergoes rapid and efficient star formation, resulting in a large starburst. In conclusion, our analysis has revealed a mechanism of starburst that is induced by the intense FUV radiation from the preceding Pop II stars in an extremely low metallicity environment in the first galaxies. This mechanism is different from other mechanisms of starburst considered in the literature, such as merger-induced starburst (e.g., Hopkins et al., 2008) or bursty star formation due to quick gas depletion by SNe (e.g., Yajima et al., 2017a; Sun et al., 2023).
According to the current Pop II formation model, we observe the formation of a large stellar cluster from a cloud. However, the condition of the cloud is also similar to that assumed for the formation of direct collapse BHs in slightly metal-enriched gas (Chon & Omukai, 2020; Chiaki et al., 2023). Therefore, in future studies, we plan to further investigate this possibility.
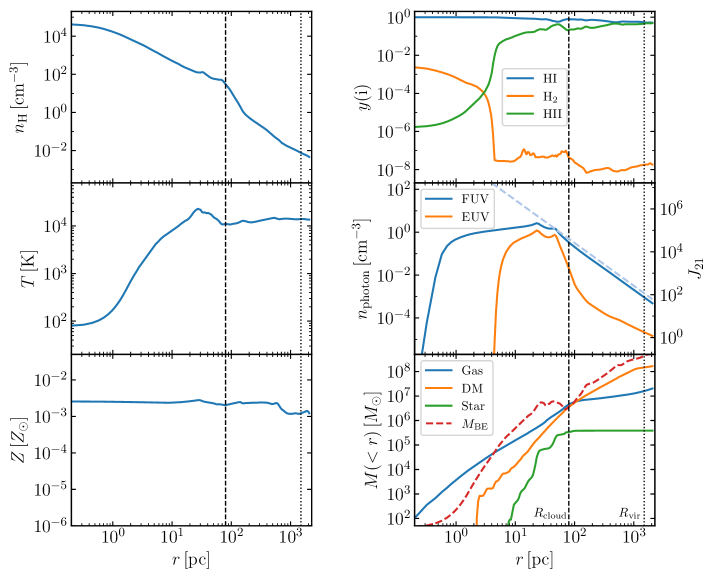
Next, to quantitatively analyze the observed starburst, we present in Fig. 8 the 1D radial profiles of various quantities as a function of the radial distance from the center of the dense cloud, which will soon be transformed into a star cluster (see Sec. 2.1). These profiles confirm the previous qualitative description based on the snapshots shown in Fig. 7. Within the cloud radius , which is determined by the radius at which the density is times smaller than the peak value (density plot, top-left), but outside the central region of a clump, the gas is warm with (temperature plot, middle-left); it has extremely low metallicity with (metallicity plot, left-bottom); it is neutral and almost completely dissociated with (abundance plot, top-right); and it is irradiated by an intense FUV field with (radiation-field plot, middle-right).
This high FUV intensity can be explained as follows. At this epoch, the main source of FUV radiation is young Pop II stars with a typical age of , which emit FUV radiation at a specific emissivity of about (Bruzual & Charlot, 2003; Katz et al., 2017). Assuming a spherical propagation from a point source with mass , we can calculate the FUV photon number density at a distance from the source as . This relation can also be written in terms of as
| (5) |
Assuming a value of for the FUV photon production rate of Pop II stars at an age of (Bruzual & Charlot, 2003), and an enclosed stellar mass of within a radius of (bottom-right), this estimation accurately predicts the radial dependence of at distances , as shown by the dashed line in the middle-right panel of Fig. 8.
In the enclosed mass plot (bottom right), the Bonor-Ebert mass, (see, e.g., Stahler & Palla, 2004), is also presented. If the enclosed gas mass exceeds this critical mass, the gas is gravitationally unstable. At this time, the enclosed gas mass at is larger than , indicating that the cloud is gravitationally unstable and collapsing. This aligns with our treatment of converting the cloud into stellar clusters based on our star formation model. Note that the gas mass exceeds the DM mass within the cloud radius, justifying our assumption of ignoring the DM potential in the star formation process on the cloud scale. However, outside the cloud radius, the gravity of DM becomes the dominant force in attracting gas toward the central region of the galaxy.
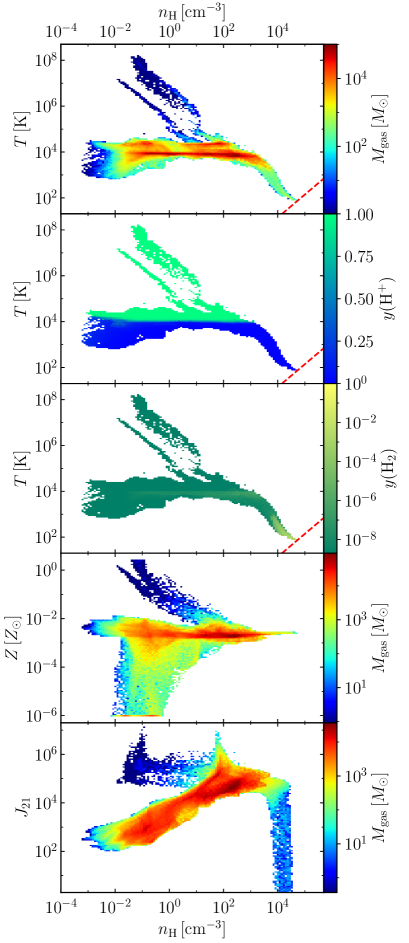
Finally, to further investigate the state of gas during the starburst, in Fig. 9 we present phase plots for the gas within the central from the center of the galaxy. In the top panel, each bin is color-coded according to the mass in the density-temperature plane, revealing several distinct states of the gas. Firstly, there is a small mass of gas located in the high-temperature region ( ), which corresponds to SN bubbles. The maximum temperature reaches approximately . Secondly, there is a concentration of gas at , indicating photoionized gas. Thirdly, there is another concentration of gas at , representing the neutral gas phase where the primary cooling mechanism is Lyman-alpha emission of . Due to the strong FUV radiation, cooling is strongly suppressed and the gas cannot cool below this temperature range unless it becomes self-shielded to FUV radiation. This happens only at very high densities, where the gas reaches . Lastly, there is a component that approaches the threshold density for star formation, , indicated by the red dotted line (Eq. 1), which corresponds to the densest cores within the dense cloud (see Fig. 7, top-left). At high density (), the FUV radiation is shielded (see below), and cooling becomes effective (Omukai et al., 2008).
In the second and third panels, instead of mass, we color the bins based on the hydrogen ionization and molecular fractions. The second panel clearly shows that the ionized and neutral gas are distinctly separated between the two aforementioned ISM phases: warm/cold neutral medium (WNM/CNM) and warm ionized medium (WIM). The third panel confirms that the fraction is extremely small due to dissociation by FUV radiation except for the densest part of the cloud shielded from the FUV radiation.
In the fourth panel, we present the gas mass in the density-metallicity plane. The gas in the cloud () has an average metallicity of , with a scatter of approximately 0.5 dex above and below the average value. The metallicity of the SN bubbles is significantly higher and, in some regions, even reaches super-solar values. Additionally, the first galaxy contains primordial gas, which is represented as a concentration of gas with in the figure, where we artificially apply a metallicity floor for visualization purposes (given the logarithmic scale in the plot).
As depicted by the fifth panel, showing the gas mass in the density-FUV intensity plane, the gas within the cloud is significantly influenced by strong FUV fields with . This intense FUV radiation greatly hampers the cooling by within the cloud, as mentioned above. However, in the densest regions (), which correspond to the centers of subclumps, the value of decreases. This decrease is due to the FUV shielding effect, which is taken into account in our numerical model (Sec. 2.1).
In summary, Figs. 7, 8, and 9 indicate that the starburst is caused by rapid and efficient star formation from a massive cloud that has a relatively high temperature of due to the presence of a strong FUV background () in an environment with very low metallicity (). The high temperature prevents fragmentation in smaller mass clouds. According to our sub-grid star formation recipe, massive clouds can form stars with higher efficiency than low-mass clouds of similar density, producing stronger bursts of star formation and gravitationally bound star clusters as found in our previous simulations (G23). This theoretical result has been recently corroborated by JWST observations showing, thanks to the power of strong gravitational lensing, several bound star clusters with a size of about a parsec, forming in a small mass galaxy at redshift (Adamo et al., 2024). In the next section, we compare the simulations with and without Pop II FUV feedback to clarify the impact of FUV radiation on the starburst.

3.3 Comparison of runs with and without Pop II FUV feedback
To clarify the role of FUV in causing the bursty star formation observed in the fiducial run, here we compare runs with and without FUV feedback from Pop II stars, namely the fiducial and pop2noFUV runs. The two runs are exactly the same until the formation of Pop II stars, but their subsequent evolution deviates due to the presence or absence of FUV feedback by Pop II stars.
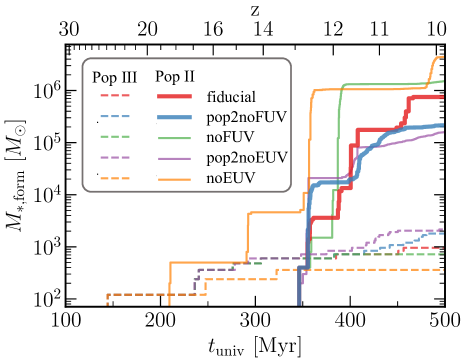
Fig. 10 presents an overview of the star formation history (or the cumulative mass in stars as a function of time) in simulations with various feedback models, while the corresponding Pop II star formation rates are shown in Fig. 11 for the same set of models. This section focuses on the comparison of the fiducial and pop2noFUV runs, deferring the examination of the other runs until Sec. 4.1. In Fig. 10, the pop2noFUV run exhibits a more gradual increase in stellar mass compared to the bursty increase in the fiducial run. In other words, the star formation rate in the fiducial run is more bursty with short-lived peaks of star formation reaching followed by long ( Myr) quiescent periods (Fig. 11, top panel), in contrast to a nearly continuous mode of star formation with only modest fluctuations with respect to the mean that has a value about 10 times lower (below ) observed in the pop2noFUV run (Fig. 11, second panel). We attribute this difference to the influence of FUV feedback on the manner in which star formation occurs.
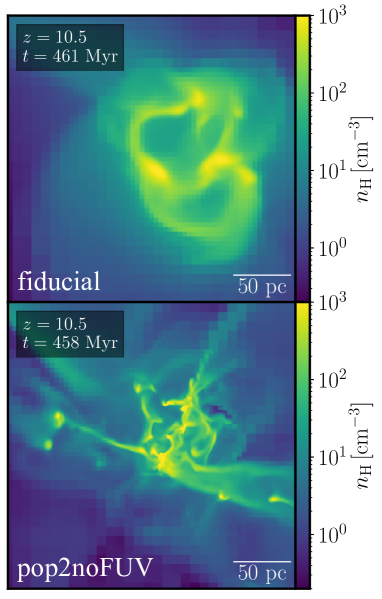
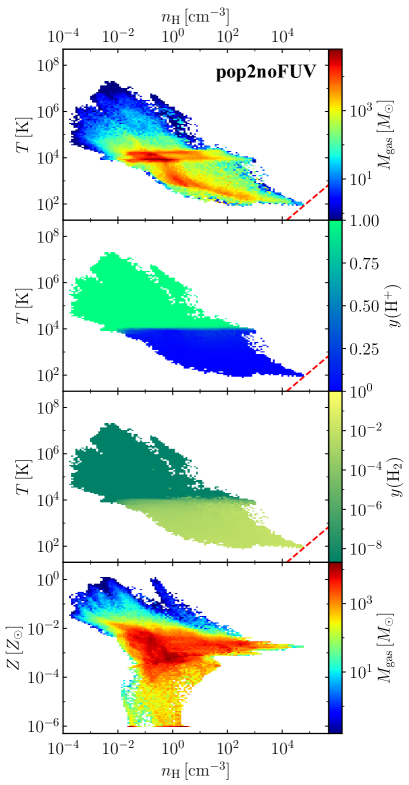
The effect of FUV feedback on the star formation process can be observed in Fig. 12, where we compare the density distribution at the same epoch in the fiducial and pop2noFUV runs. It is evident that the case without FUV feedback exhibits strong fragmentation compared to the case with FUV feedback. The tendency of stronger fragmentation in the pop2noFUV run can be understood by inspecting the gas phase plots in Fig. 13. We recall that in the fiducial run, except for gas at very high density (), the gas cannot cool below because the dissociation of by FUV radiation strongly suppresses the cooling (Fig. 9). Instead, in the pop2noFUV run, even gas at moderate density has relatively large molecular fraction (although the gas is far from fully molecular) that is able to cool the gas at densities to (Fig. 13), hence reducing the Jeans mass in the ISM and facilitating fragmentation into numerous small mass clumps.
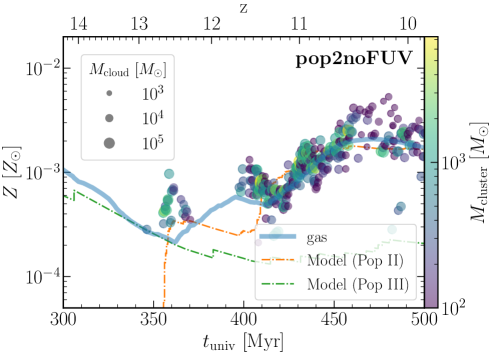
In the case without FUV feedback, the strong fragmentation results in the formation of numerous smaller mass clouds. This is illustrated in Fig. 14, where the formation history of stellar clusters and their progenitor clouds is depicted in a similar manner as in Fig. 6 for the fiducial run. In this case, small mass stellar clusters are continuously formed, leading to continuous rather than intermittent star formation. We also plot the analytical model of metallicity evolution given by Eqs. (3) and (4), which once again reasonably matches the simulated gas metallicity evolution, further validating the analytical model.
The FUV feedback not only makes star formation intermittent, but also increases the efficiency of star formation. In Fig. 10, the final stellar mass at of in the fiducial run is significantly larger than that in the pop2noFUV run. However, it is important to note that this result should be interpreted with caution because the star formation in the fiducial run is bursty, leading to significant temporal fluctuations of star formation efficiency. Further investigation incorporating statistical analysis is required to ascertain the impact of FUV feedback on the efficiency of star formation. Nevertheless, we can understand the origin of the different galactic star-formation efficiencies in the two runs by examining the star-formation efficiency at cloud-to-cluster conversions.
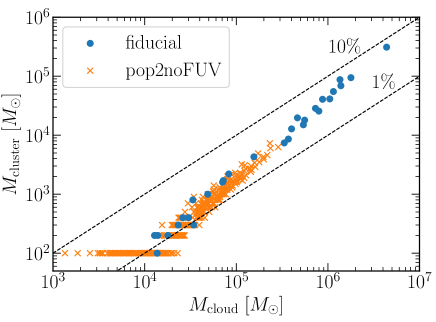
Fig. 15 illustrates the relations between the masses of clouds and clusters in the two simulations. We see that the star formation efficiency defined as the ratio of cluster mass to cloud mass () tends to be higher for more massive clouds, resulting from our Pop II star formation model based on cloud-scale simulations of cluster formation (Sec. 2.1; e.g., He et al., 2019). Additionally, we find that the population of massive gas clouds () in the fiducial run disappears in the pop2noFUV run due to strong fragmentation. Consequently, although the cumulative cloud masses formed by the end of the simulations, obtained by summing the cloud masses in each simulation, are almost the same in the fiducial and pop2noFUV runs, the final stellar mass is a few times higher in the former run compared to the latter (see also the caption of Fig. 15). Therefore, the difference in star formation efficiency originates from the higher star formation efficiency of high-mass clouds formed only in the fiducial run, due to the suppression of fragmentation by FUV feedback.
Up to this point, we have focused on the impact of FUV feedback on the formation of the first galaxies that causes intermittent star formation bursts and potentially increases the star formation efficiency. In Sec. 4.1, we also explore other roles of UV feedback in the formation of the first galaxies.
4 Discussion
4.1 Other roles of FUV and EUV feedback
In this section, we examine the roles of FUV and EUV feedback in the formation of the first galaxies, in addition to the role of FUV feedback in triggering starbursts, which was explained in previous sections. For this purpose, we perform simulations in which we disable FUV or EUV feedback from Pop II stars, or from both Pop II and Pop III stars (see Table 1). The star formation history for all the simulations carried out in this study is summarized in Fig. 10, together with the associated Pop II star formation rates in Fig. 11. In the following, we describe the roles of FUV and EUV feedback in this order.
4.1.1 FUV
First, we investigate the FUV feedback from Pop III and Pop II stars by comparing the simulations with FUV from both populations (fiducial run), without FUV from either population (noFUV run), and with FUV from Pop III stars only (pop2noFUV run). In the previous section, we have investigated the role of FUV feedback from Pop II stars in triggering starbursts, thus our focus in this section is on the roles of FUV feedback from Pop III stars and the effects of FUV radiation in regulating Pop III star formation.
The role of FUV feedback on Pop III star formation can be understood by comparing the fiducial run and the pop2noFUV run. In Fig. 10, the fiducial run exhibits a lower number of Pop III systems, specifically , compared to the pop2noFUV run forming about twice as many Pop III stars. This decrease can be attributed to FUV radiation from Pop II stars that suppresses or delays cooling, and consequently the formation of Pop III stars, in nearby minihalos through photodissociation of . Previous studies have shown that such a delay leads to the growth of the minihalo prior to Pop III star formation, resulting in higher inflow rates and a larger Pop III stellar mass (e.g., Park et al., 2021a).
On the other hand, the comparison between the fiducial and noFUV runs in Fig. 10 shows that the difference between these runs is insignificant prior to the Pop III-to-Pop II transition at , implying that the FUV radiation from Pop III stars is too weak to affect Pop III star formation in other minihalos. This can be attributed to the low intensity and short duration of the FUV emission from Pop III stars. A caveat is that our zoom-in simulations do not include the FUV cosmological background from distant sources, which can be dominant over the local contribution from the few Pop III stars in the simulation box (e.g., Ricotti et al., 2002b). After the transition to Pop II star formation, the star formation histories for the run without FUV radiation (noFUV run) and run pop2noFUV, which includes only FUV from Pop III stars, are qualitatively indistinguishable, suggesting that FUV radiation from Pop III stars does not have a strong impact on Pop II stars. In detail, the two runs do not have identical star formation histories, but the variation may be attributed to the stochastic nature of Pop II star formation. To assess the magnitude of the statistical effects, we intend to perform similar simulations for numerous samples in future studies.
4.1.2 EUV
Next, we examine the EUV feedback from Pop III and Pop II stars. In the following, we make comparisons of the simulations with EUV from both populations (fiducial run), without EUV from either population (noEUV run), and without EUV from Pop II stars but with EUV from Pop III stars (pop2noEUV run).
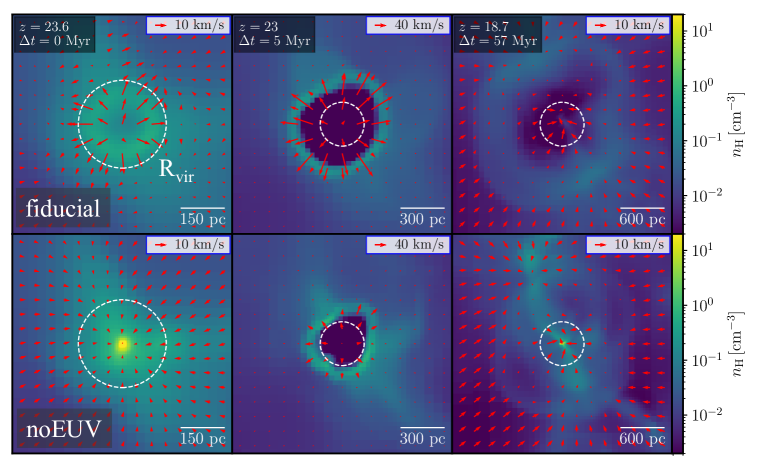
Let us begin by investigating the impact of EUV feedback from Pop III stars through the comparison of the star formation history in the fiducial and noEUV runs in Fig. 10. We observe that EUV feedback from Pop III stars delays the Pop III-to-Pop II transition. To understand the cause of this delay, we present the evolution of Pop III SN bubbles in the two runs in Fig. 16. The figure illustrates the evolution in the fiducial (top) and noEUV (bottom) runs at three different time points: right before the SN explosion (, with representing the time since the explosion; left), when the SN bubble reaches the virial radius (; center), and when the gas returns to the center in the case without EUV feedback (; right). In the fiducial run, the EUV radiation from the central Pop III system photoevaporates the gas from the halo before the SN explosion. Consequently, the SN bubble can expand efficiently without losing much energy through cooling, resulting in a shock velocity that exceeds the escape velocity when the shock reaches the virial radius of the host halo. In contrast, in the noEUV run, the presence of dense gas around the center of the halo significantly weakens the expansion of the SN bubble, leading to a slightly lower shock velocity compared to the escape velocity at the virial radius. As a result, the gas readily returns to the center in the noEUV run, whereas in the fiducial run, it only returns after the gas accumulates again along with the growth of the host DM halo in the cosmic timescale. The EUV feedback from Pop III stars influences the star formation history by enhancing the effect of the SN feedback (Kitayama et al., 2004; Kitayama & Yoshida, 2005; Chiaki et al., 2018).
Our simulations also suggest that the aforementioned mechanism for the EUV feedback from Pop III stars also works for the EUV feedback from Pop II stars. In Fig. 10, we observe that the fiducial run demonstrates a smaller Pop II stellar mass at the end of the simulation () compared to the runs without EUV feedback, by a factor of two (pop2noEUV run) or four (noEUV run). We attribute this suppression of Pop II star formation in the presence of EUV feedback to the enhancement of SN feedback. In contrast to minihalos, the escape velocity of the halo at is , which is greater than the sound velocity of photoionized gas . Consequently, EUV radiation cannot directly photoevaporate gas from the halo. However, it reduces the density through photoevaporation on a cloud scale, thereby amplifying the effect of Pop II SN feedback. The discrepancies between the pop2noEUV and noEUV runs may arise from stochasticity. As mentioned in Sec. 4.1.1, it is crucial to perform similar simulations for numerous samples in future studies to assess the influence of statistical effects.
4.2 Intermediate Mass Black Holes from Pop III Stars
In this section, we provide a brief overview of our findings on the formation and growth of intermediate-mass BHs (IMBHs) from Pop III stars in our simulations. The main motivation for considering the growth of IMBHs in our models is related to estimating their contribution to the heating of the metal-poor ISM in the first galaxies (e.g., Bialy & Sternberg, 2019). We have seen that the suppression of cooling in a metal-poor environment by FUV radiation is responsible for the increase of the Jeans mass in the ISM, which induces a clumpy/bursty star formation mode. Similarly, X-ray heating can trigger a similar star formation mode. In this paper we present a partial implementation of this effect, following the accretion rate and growth of IMBHs but not their X-ray emission.
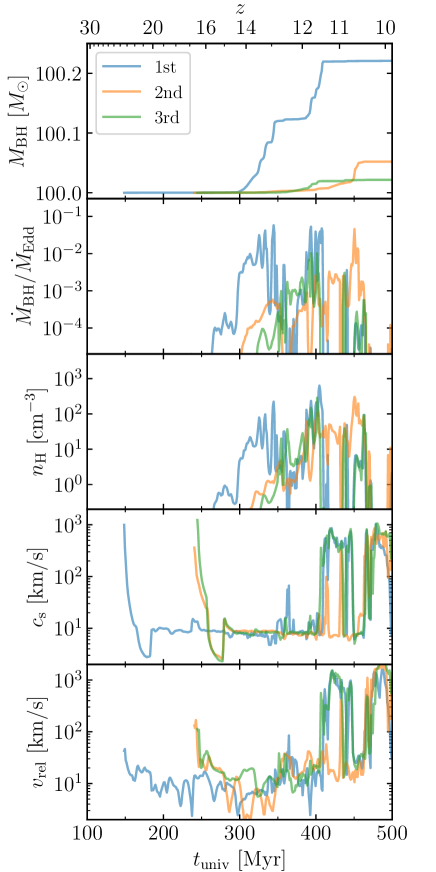
Fig. 17 illustrates the growth of BHs in the fiducial run and the environment in which they evolve. Although we only present the results for the fiducial run, we have also examined the growth of BHs in other runs and found that their properties are qualitatively the same. To improve clarity, we present only data for the three most massive BHs based on the masses measured at the end of the simulation.
The top panel of Fig. 17 shows that BHs grow very inefficiently, with a mere 0.2% increase in mass even in the most grown case. Similarly, the second panel indicates that the accretion rate is very low, with the peak accretion rate of only occasionally achieved. Here, represents the (radiative efficiency independent) Eddington rate, where is the proton mass and is the speed of light. If the accretion rate is normalized by the radiative efficiency dependent Eddington rate, , with the radiative efficiency , the normalized accretion rate is ten times smaller.
In our simulations, we assume that the accretion rate is determined by the Bondi-Hoyle-Lyttleton rate, (Sec. 2.1). Therefore, the growth of the black hole depends on the density , sound velocity , and relative velocity , which are shown in the third, fourth, and fifth panels, respectively. Former Bondi-scale simulations of BH accretion with radiative feedback have suggested that the accretion rate onto moving BHs is modified (suppressed or enhanced) by feedback effects (Park & Ricotti, 2013; Sugimura & Ricotti, 2020). However, for simplicity, we adopt the Bondi-Hoyle-Lyttleton rate in this work. The density is moderate () and does not reach an extremely high value, as assumed in previous simulations of rapid growth (e.g., Milosavljević et al., 2009; Park & Ricotti, 2011; Inayoshi et al., 2016; Sugimura et al., 2017b, 2018; Yajima et al., 2017b; Toyouchi et al., 2019; Ogata et al., 2024; see also Inayoshi et al., 2020 for review). The sound velocity and relative velocity also have moderate values around , and are not able to significantly boost the Bondi-Hoyle-Lyttleton rate due to their low values. The high temperature and relative velocity at the beginning of each curve are due to the SN explosion associated with the formation of the BH, and the intermittent increase to is due to Pop II SNe.
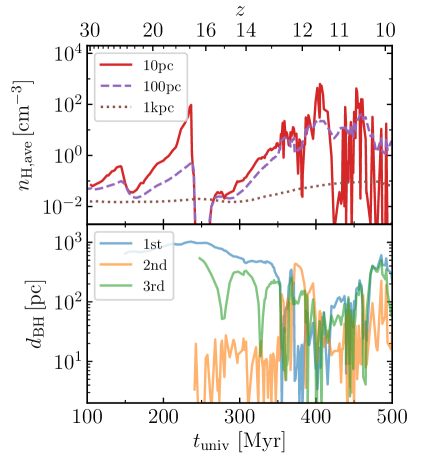
The reason for the relatively low density around the BHs, as shown in Fig. 17 (third), can be understood as follows. Fig. 18 presents the average gas density within specified radii around the galactic center (top) and the distance of BHs from the center (bottom). The average density within shows significant variability and occasionally reaches , but this high density is short-lived. High-density regions are not sustainable, as they quickly transform into stars. The suppression of fragmentation by FUV feedback from Pop II stars, as explained in Sec. 3.2, is insufficient to facilitate BH growth by accumulating dense gas around the galactic center. The average densities within larger radii are smoother, with a maximum value of for and for . Some BHs orbit within a radius of about , but they occasionally move away from the center due to host halo mergers, reaching scales of . As a result of the combination of the not very high density near the galactic center and the BHs’ position not being exactly at the center, the density around the BHs is generally not high.
If taken at face value, it is rare for the first galaxies at to contain massive BHs. However, it should be noted that the result is based on the assumption of a seed BH mass of and ignorance of the BH feedback. It is possible that more massive seed BHs with shorter growth timescales could form and grow into massive BHs. The growth timescale through Bondi-Hoyle-Lyttleton accretion is proportional to , and thus seed BHs larger than could experience nonlinear growth if the surrounding gas conditions are the same, provided that BHs grow by . Additionally, BH feedback not only affects the accretion rate at the Bondi scale but also impacts the galactic environment by suppressing star formation through the injection of thermal or kinetic energy, or by enhancing star formation through increased ionization fraction through X-ray emission (see Ricotti, 2016). In the former case, BH feedback may have a positive effect on BH growth by preventing gas from being converted into stars. We intend to investigate the co-evolution of BHs and the first galaxies with BH feedback in future work.
5 Summary and Conclusion
In this study, we have performed zoom-in simulations of a first galaxy at sub-pc resolution until with various feedback models, to investigate the roles of FUV and EUV feedback from Pop III and Pop II stars in the formation of the first galaxies. Our main findings are summarized as follows:
-
•
The impact of FUV radiation from Pop II stars on star formation in the first galaxies is actually positive, rather than negative. Due to the intense FUV field, extremely low-metallicity clouds in the first galaxies are warmed to a relatively high temperature (). As a result, star formation is delayed until the clouds accumulate enough mass to become gravitationally unstable against the high pressure of the relatively hot gas. At this point, the clouds undergo rapid star formation, which is observed as starbursts. Additionally, we observe that the FUV feedback increases the mass in stars formed due to the high efficiency of stellar cluster formation from massive clouds.
-
•
FUV radiation from Pop II stars suppresses Pop III star formation in nearby minihalos by photodissociating , the main coolant in these halos. However, FUV radiation from nearby Pop III stars (found in the proximity of the galaxy) is insufficient to have an impact on the formation of Pop III stars in other minihalos.
-
•
EUV radiation from Pop III stars photoevaporates gas from their host minihalos and enhances the impact of their SN explosion, delaying the fallback of metal-enriched gas, and consequently the Pop III-to-Pop II transition.
-
•
EUV radiation from Pop II stars cannot photoevaporate gas from the first galaxy, whose escape velocity is larger than the sound velocity of photoionized gas. However, we still observe that it suppresses Pop II star formation, as cloud-scale photoevaporation enhances the effect of Pop II SN feedback.
-
•
We follow the formation and subsequent accretion growth of Pop III remnant BHs with an initial mass of using a simplified model. Their growth is extremely inefficient because the surrounding gas does not have a high density, unlike what is assumed in a scenario of massive BH formation with rapid growth. Future simulations incorporating more realistic models of BH-related physics are needed.
Our simulations have observed bursty star formation caused by positive feedback from FUV radiation (see also G23). This phenomenon may partially explain the unexpectedly large abundance of luminous galaxies observed at high redshifts. Although we have found that FUV-induced starbursts occur through the photodissociation of in extremely low-metallicity environments () in the very early stage of galaxy formation, it is crucial to investigate whether a similar mechanism operates in galaxies with higher metallicity, as these galaxies are the main target of ongoing and future observations.
JWST spectroscopic observations of high-z galaxies can be used to test our hypothesis of bursty star formation induced by strong FUV irradiation in a low-metallicity ISM. In addition to the low gas metallicity, we expect high ISM temperatures () in gas at relatively high density ( and similarly large electron densities in the photoionized medium). On the other hand, most of the ISM mass should be in the atomic phase rather than the molecular phase. Hence, and CO observations of the molecular phase of the ISM with ALMA are expected to be challenging, while C+ is likely the main coolant even if the gas has low-metallicity (e.g., Wolfire et al., 1995; Omukai et al., 2005, 2008). In the future we are planning to make detailed calculations to produce synthetic spectra from our simulations to compare quantitatively our simulations to JWST and ALMA observations.
Our current simulations have several caveats, while we believe that our qualitative conclusion regarding the roles of FUV and EUV feedback remains unchanged. Although we have achieved a high spatial resolution of , we adopt a mass resolution for Pop II stellar particles not as high as in G23, to run various simulations with different feedback models. Furthermore, the models we have used for Pop III formation, Pop II formation, and BH-related physics are simplified and have room for improvement, as described in Sec. 2.1. Actually, we have already implemented more realistic physics models in our code and plan to use them in future simulations. Additionally, it is important to note that our analysis is based on a single sample of a first galaxy, and it is crucial to perform similar simulations on a larger sample to obtain a more general and robust conclusion.
With the recent success of the JWST, a new era of observational exploration for the first galaxies has begun, and the theoretical understanding of these galaxies has become more crucial than ever. To establish a synergy between observation and theory, we plan to advance our understanding of the first galaxies through high-resolution cosmological simulations incorporating more realistic physics models.
Acknowledgments
The authors thank Takashi Hosokawa, Takashi Okamoto, Kazuyuki Omukai, Kengo Tomida, Chong-chong He for fruitful discussions and comments. This work was supported in part by MEXT/JSPS KAKENHI Grant Number 21K20373, 22KK0043 (KS), and 21H04489 (HY) and JST FOREST Program Grant Number JP-MJFR202Z (HY). The numerical simulations were performed on the Cray XC50 at Center for Computational Astrophysics at National Astronomical Observatory of Japan, Yukawa-21 at Yukawa Institute for Theoretical Physics at Kyoto University, and the University of Maryland supercomputing resources. This work was also supported by the Hakubi Project Funding of Kyoto University and the JSPS Overseas Research Fellowship (KS).
References
- Abe et al. (2021) Abe, M., Yajima, H., Khochfar, S., Dalla Vecchia, C., & Omukai, K. 2021, MNRAS, 508, 3226, doi: 10.1093/mnras/stab2637
- Adamo et al. (2024) Adamo, A., Bradley, L. D., Vanzella, E., et al. 2024, arXiv e-prints, arXiv:2401.03224, doi: 10.48550/arXiv.2401.03224
- Barkana & Loeb (1999) Barkana, R., & Loeb, A. 1999, ApJ, 523, 54, doi: 10.1086/307724
- Behroozi et al. (2013a) Behroozi, P. S., Wechsler, R. H., & Wu, H.-Y. 2013a, ApJ, 762, 109, doi: 10.1088/0004-637X/762/2/109
- Behroozi et al. (2013b) Behroozi, P. S., Wechsler, R. H., Wu, H.-Y., et al. 2013b, ApJ, 763, 18, doi: 10.1088/0004-637X/763/1/18
- Bialy & Sternberg (2019) Bialy, S., & Sternberg, A. 2019, ApJ, 881, 160, doi: 10.3847/1538-4357/ab2fd1
- Bromm & Loeb (2003) Bromm, V., & Loeb, A. 2003, ApJ, 596, 34
- Bromm & Yoshida (2011) Bromm, V., & Yoshida, N. 2011, ARA&A, 49, 373, doi: 10.1146/annurev-astro-081710-102608
- Bruzual & Charlot (2003) Bruzual, G., & Charlot, S. 2003, MNRAS, 344, 1000, doi: 10.1046/j.1365-8711.2003.06897.x
- Chiaki et al. (2023) Chiaki, G., Chon, S., Omukai, K., et al. 2023, MNRAS, 521, 2845, doi: 10.1093/mnras/stad689
- Chiaki et al. (2018) Chiaki, G., Susa, H., & Hirano, S. 2018, MNRAS, 475, 4378, doi: 10.1093/mnras/sty040
- Chon et al. (2016) Chon, S., Hirano, S., Hosokawa, T., & Yoshida, N. 2016, ApJ, 832, 134, doi: 10.3847/0004-637X/832/2/134
- Chon et al. (2018) Chon, S., Hosokawa, T., & Yoshida, N. 2018, MNRAS, 475, 4104, doi: 10.1093/mnras/sty086
- Chon & Omukai (2020) Chon, S., & Omukai, K. 2020, MNRAS, 494, 2851, doi: 10.1093/mnras/staa863
- Dayal & Ferrara (2018) Dayal, P., & Ferrara, A. 2018, Phys. Rep., 780, 1, doi: 10.1016/j.physrep.2018.10.002
- Dekel et al. (2023) Dekel, A., Sarkar, K. C., Birnboim, Y., Mandelker, N., & Li, Z. 2023, MNRAS, 523, 3201, doi: 10.1093/mnras/stad1557
- Efstathiou (1992) Efstathiou, G. 1992, MNRAS, 256, 43P, doi: 10.1093/mnras/256.1.43P
- Fan et al. (2006) Fan, X., Carilli, C. L., & Keating, B. 2006, ARA&A, 44, 415, doi: 10.1146/annurev.astro.44.051905.092514
- Ferrara (2023) Ferrara, A. 2023, arXiv e-prints, arXiv:2310.12197, doi: 10.48550/arXiv.2310.12197
- Ferrara et al. (2023) Ferrara, A., Pallottini, A., & Dayal, P. 2023, MNRAS, 522, 3986, doi: 10.1093/mnras/stad1095
- Garcia et al. (2023) Garcia, F. A. B., Ricotti, M., Sugimura, K., & Park, J. 2023, MNRAS, 522, 2495, doi: 10.1093/mnras/stad1092
- Gnedin (2000) Gnedin, N. Y. 2000, ApJ, 542, 535, doi: 10.1086/317042
- Hahn & Abel (2011) Hahn, O., & Abel, T. 2011, MNRAS, 415, 2101, doi: 10.1111/j.1365-2966.2011.18820.x
- Haiman et al. (2000) Haiman, Z., Abel, T., & Rees, M. J. 2000, ApJ, 534, 11, doi: 10.1086/308723
- Hainline et al. (2023) Hainline, K. N., Johnson, B. D., Robertson, B., et al. 2023, arXiv e-prints, arXiv:2306.02468, doi: 10.48550/arXiv.2306.02468
- Harikane et al. (2024) Harikane, Y., Nakajima, K., Ouchi, M., et al. 2024, ApJ, 960, 56, doi: 10.3847/1538-4357/ad0b7e
- Harikane et al. (2023a) Harikane, Y., Ouchi, M., Oguri, M., et al. 2023a, ApJS, 265, 5, doi: 10.3847/1538-4365/acaaa9
- Harikane et al. (2023b) Harikane, Y., Zhang, Y., Nakajima, K., et al. 2023b, ApJ, 959, 39, doi: 10.3847/1538-4357/ad029e
- Hartley & Ricotti (2016) Hartley, B., & Ricotti, M. 2016, MNRAS, 462, 1164, doi: 10.1093/mnras/stw1562
- He et al. (2019) He, C.-C., Ricotti, M., & Geen, S. 2019, MNRAS, 489, 1880, doi: 10.1093/mnras/stz2239
- He et al. (2020) —. 2020, MNRAS, 492, 4858, doi: 10.1093/mnras/staa165
- Hirano et al. (2015) Hirano, S., Hosokawa, T., Yoshida, N., Omukai, K., & Yorke, H. W. 2015, MNRAS, 448, 568. https://arxiv.org/abs/1501.01630
- Hirano et al. (2014) Hirano, S., Hosokawa, T., Yoshida, N., et al. 2014, ApJ, 781, 60, doi: 10.1088/0004-637X/781/2/60
- Hopkins et al. (2008) Hopkins, P. F., Hernquist, L., Cox, T. J., & Kereš, D. 2008, ApJS, 175, 356, doi: 10.1086/524362
- Hosokawa et al. (2016) Hosokawa, T., Hirano, S., Kuiper, R., et al. 2016, ApJ, 824, 119, doi: 10.3847/0004-637X/824/2/119
- Hosokawa et al. (2011) Hosokawa, T., Omukai, K., Yoshida, N., & Yorke, H. W. 2011, Science, 334, 1250, doi: 10.1126/science.1207433
- Hosokawa et al. (2013) Hosokawa, T., Yorke, H. W., Inayoshi, K., Omukai, K., & Yoshida, N. 2013, ApJ, 778, 178. https://arxiv.org/abs/1308.4457
- Inayoshi et al. (2016) Inayoshi, K., Haiman, Z., & Ostriker, J. P. 2016, MNRAS, 459, 3738, doi: 10.1093/mnras/stw836
- Inayoshi et al. (2020) Inayoshi, K., Visbal, E., & Haiman, Z. 2020, ARA&A, 58, 27, doi: 10.1146/annurev-astro-120419-014455
- Jeon & Bromm (2019) Jeon, M., & Bromm, V. 2019, MNRAS, 485, 5939, doi: 10.1093/mnras/stz863
- Johnson et al. (2013) Johnson, J. L., Dalla Vecchia, C., & Khochfar, S. 2013, MNRAS, 428, 1857. https://arxiv.org/abs/1206.5824
- Kannan et al. (2022) Kannan, R., Garaldi, E., Smith, A., et al. 2022, MNRAS, 511, 4005, doi: 10.1093/mnras/stab3710
- Katz et al. (2017) Katz, H., Kimm, T., Sijacki, D., & Haehnelt, M. G. 2017, MNRAS, 468, 4831, doi: 10.1093/mnras/stx608
- Kimm et al. (2015) Kimm, T., Cen, R., Devriendt, J., Dubois, Y., & Slyz, A. 2015, MNRAS, 451, 2900, doi: 10.1093/mnras/stv1211
- Kimm et al. (2017) Kimm, T., Katz, H., Haehnelt, M., et al. 2017, MNRAS, 466, 4826, doi: 10.1093/mnras/stx052
- Kimura et al. (2023) Kimura, K., Hosokawa, T., Sugimura, K., & Fukushima, H. 2023, ApJ, 950, 184, doi: 10.3847/1538-4357/acda8e
- Kitayama & Yoshida (2005) Kitayama, T., & Yoshida, N. 2005, ApJ, 630, 675, doi: 10.1086/432114
- Kitayama et al. (2004) Kitayama, T., Yoshida, N., Susa, H., & Umemura, M. 2004, ApJ, 613, 631, doi: 10.1086/423313
- Kocevski et al. (2023) Kocevski, D. D., Onoue, M., Inayoshi, K., et al. 2023, ApJ, 954, L4, doi: 10.3847/2041-8213/ace5a0
- Latif et al. (2022) Latif, M. A., Whalen, D., & Khochfar, S. 2022, ApJ, 925, 28, doi: 10.3847/1538-4357/ac3916
- Leitherer et al. (1999) Leitherer, C., Schaerer, D., Goldader, J. D., et al. 1999, ApJS, 123, 3
- Lovell et al. (2021) Lovell, C. C., Vijayan, A. P., Thomas, P. A., et al. 2021, MNRAS, 500, 2127, doi: 10.1093/mnras/staa3360
- Ma et al. (2020) Ma, X., Grudić, M. Y., Quataert, E., et al. 2020, MNRAS, 493, 4315, doi: 10.1093/mnras/staa527
- Maiolino et al. (2023) Maiolino, R., Scholtz, J., Curtis-Lake, E., et al. 2023, arXiv e-prints, arXiv:2308.01230, doi: 10.48550/arXiv.2308.01230
- Mason et al. (2023) Mason, C. A., Trenti, M., & Treu, T. 2023, MNRAS, 521, 497, doi: 10.1093/mnras/stad035
- Milosavljević et al. (2009) Milosavljević, M., Couch, S. M., & Bromm, V. 2009, ApJ, 696, L146. https://arxiv.org/abs/0812.2516
- Ocvirk et al. (2020) Ocvirk, P., Aubert, D., Sorce, J. G., et al. 2020, MNRAS, 496, 4087, doi: 10.1093/mnras/staa1266
- Ogata et al. (2024) Ogata, E., Ohsuga, K., Fukushima, H., & Yajima, H. 2024, MNRAS, 528, 2588, doi: 10.1093/mnras/stae195
- Okamoto et al. (2008) Okamoto, T., Gao, L., & Theuns, T. 2008, MNRAS, 390, 920, doi: 10.1111/j.1365-2966.2008.13830.x
- Omukai (2001) Omukai, K. 2001, ApJ, 546, 635
- Omukai et al. (2008) Omukai, K., Schneider, R., & Haiman, Z. 2008, ApJ, 686, 801. https://arxiv.org/abs/0804.3141
- Omukai et al. (2005) Omukai, K., Tsuribe, T., Schneider, R., & Ferrara, A. 2005, ApJ, 626, 627
- O’Shea & Norman (2008) O’Shea, B. W., & Norman, M. L. 2008, ApJ, 673, 14. https://arxiv.org/abs/0706.4416
- O’Shea et al. (2015) O’Shea, B. W., Wise, J. H., Xu, H., & Norman, M. L. 2015, ApJ, 807, L12, doi: 10.1088/2041-8205/807/1/L12
- Pallottini & Ferrara (2023) Pallottini, A., & Ferrara, A. 2023, A&A, 677, L4, doi: 10.1051/0004-6361/202347384
- Pallottini et al. (2022) Pallottini, A., Ferrara, A., Gallerani, S., et al. 2022, MNRAS, 513, 5621, doi: 10.1093/mnras/stac1281
- Park et al. (2021a) Park, J., Ricotti, M., & Sugimura, K. 2021a, MNRAS, 508, 6176, doi: 10.1093/mnras/stab2999
- Park et al. (2021b) —. 2021b, MNRAS, 508, 6193, doi: 10.1093/mnras/stab3000
- Park et al. (2023) —. 2023, MNRAS, 521, 5334, doi: 10.1093/mnras/stad895
- Park et al. (2024) —. 2024, MNRAS, 528, 6895, doi: 10.1093/mnras/stae518
- Park & Ricotti (2011) Park, K., & Ricotti, M. 2011, ApJ, 739, 2, doi: 10.1088/0004-637X/739/1/2
- Park & Ricotti (2013) —. 2013, ApJ, 767, 163. https://arxiv.org/abs/1211.0542
- Pawlik et al. (2017) Pawlik, A. H., Rahmati, A., Schaye, J., Jeon, M., & Dalla Vecchia, C. 2017, MNRAS, 466, 960, doi: 10.1093/mnras/stw2869
- Ricotti (2016) Ricotti, M. 2016, MNRAS, 462, 601, doi: 10.1093/mnras/stw1672
- Ricotti et al. (2002a) Ricotti, M., Gnedin, N. Y., & Shull, J. M. 2002a, ApJ, 575, 33
- Ricotti et al. (2002b) —. 2002b, ApJ, 575, 49
- Ricotti et al. (2008) Ricotti, M., Ostriker, J. P., & Mack, K. J. 2008, ApJ, 680, 829, doi: 10.1086/587831
- Ricotti et al. (2016) Ricotti, M., Parry, O. H., & Gnedin, N. Y. 2016, ApJ, 831, 204, doi: 10.3847/0004-637X/831/2/204
- Ricotti et al. (2022) Ricotti, M., Polisensky, E., & Cleland, E. 2022, MNRAS, 515, 302, doi: 10.1093/mnras/stac1485
- Robertson et al. (2023) Robertson, B. E., Tacchella, S., Johnson, B. D., et al. 2023, Nature Astronomy, 7, 611, doi: 10.1038/s41550-023-01921-1
- Rosdahl et al. (2013) Rosdahl, J., Blaizot, J., Aubert, D., Stranex, T., & Teyssier, R. 2013, MNRAS, 436, 2188, doi: 10.1093/mnras/stt1722
- Rosdahl et al. (2018) Rosdahl, J., Katz, H., Blaizot, J., et al. 2018, MNRAS, 479, 994, doi: 10.1093/mnras/sty1655
- Salpeter (1955) Salpeter, E. E. 1955, ApJ, 121, 161
- Schaerer (2002) Schaerer, D. 2002, A&A, 382, 28, doi: 10.1051/0004-6361:20011619
- Shang et al. (2010) Shang, C., Bryan, G. L., & Haiman, Z. 2010, MNRAS, 402, 1249. https://arxiv.org/abs/0906.4773
- Shen et al. (2023) Shen, X., Vogelsberger, M., Boylan-Kolchin, M., Tacchella, S., & Kannan, R. 2023, MNRAS, 525, 3254, doi: 10.1093/mnras/stad2508
- Silk et al. (2024) Silk, J., Begelman, M., Norman, C., Nusser, A., & Wyse, R. 2024, arXiv e-prints, arXiv:2401.02482. https://arxiv.org/abs/2401.02482
- Stacy et al. (2016) Stacy, A., Bromm, V., & Lee, A. T. 2016, MNRAS, 462, 1307, doi: 10.1093/mnras/stw1728
- Stahler & Palla (2004) Stahler, S. W., & Palla, F. 2004, The Formation of Stars (Wiley)
- Stark (2016) Stark, D. P. 2016, ARA&A, 54, 761, doi: 10.1146/annurev-astro-081915-023417
- Sugimura et al. (2017a) Sugimura, K., Coppola, C. M., Omukai, K., Galli, D., & Palla, F. 2017a, Mem. Soc. Astron. Italiana, 88, 860
- Sugimura et al. (2018) Sugimura, K., Hosokawa, T., Yajima, H., Inayoshi, K., & Omukai, K. 2018, MNRAS, 478, 3961, doi: 10.1093/mnras/sty1298
- Sugimura et al. (2017b) Sugimura, K., Hosokawa, T., Yajima, H., & Omukai, K. 2017b, MNRAS, 469, 62, doi: 10.1093/mnras/stx769
- Sugimura et al. (2020) Sugimura, K., Matsumoto, T., Hosokawa, T., Hirano, S., & Omukai, K. 2020, ApJ, 892, L14, doi: 10.3847/2041-8213/ab7d37
- Sugimura et al. (2023) —. 2023, ApJ, 959, 17, doi: 10.3847/1538-4357/ad02fc
- Sugimura et al. (2014) Sugimura, K., Omukai, K., & Inoue, A. K. 2014, MNRAS, 445, 544, doi: 10.1093/mnras/stu1778
- Sugimura & Ricotti (2020) Sugimura, K., & Ricotti, M. 2020, MNRAS, 495, 2966, doi: 10.1093/mnras/staa1394
- Sun et al. (2023) Sun, G., Faucher-Giguère, C.-A., Hayward, C. C., et al. 2023, ApJ, 955, L35, doi: 10.3847/2041-8213/acf85a
- Susa et al. (2014) Susa, H., Hasegawa, K., & Tominaga, N. 2014, ApJ, 792, 32. https://arxiv.org/abs/1407.1374
- Teyssier (2002) Teyssier, R. 2002, A&A, 385, 337, doi: 10.1051/0004-6361:20011817
- Toyouchi et al. (2019) Toyouchi, D., Hosokawa, T., Sugimura, K., Nakatani, R., & Kuiper, R. 2019, MNRAS, 483, 2031, doi: 10.1093/mnras/sty3012
- Wise & Abel (2008) Wise, J. H., & Abel, T. 2008, ApJ, 685, 40. https://arxiv.org/abs/0710.3160
- Wise et al. (2012a) Wise, J. H., Abel, T., Turk, M. J., Norman, M. L., & Smith, B. D. 2012a, MNRAS, 427, 311, doi: 10.1111/j.1365-2966.2012.21809.x
- Wise et al. (2014) Wise, J. H., Demchenko, V. G., Halicek, M. T., et al. 2014, MNRAS, 442, 2560, doi: 10.1093/mnras/stu979
- Wise et al. (2012b) Wise, J. H., Turk, M. J., Norman, M. L., & Abel, T. 2012b, ApJ, 745, 50, doi: 10.1088/0004-637X/745/1/50
- Wolfire et al. (1995) Wolfire, M. G., Hollenbach, D., McKee, C. F., Tielens, A. G. G. M., & Bakes, E. L. O. 1995, ApJ, 443, 152
- Woosley et al. (2002) Woosley, S. E., Heger, A., & Weaver, T. A. 2002, Reviews of Modern Physics, 74, 1015, doi: 10.1103/RevModPhys.74.1015
- Yajima et al. (2023) Yajima, H., Abe, M., Fukushima, H., et al. 2023, MNRAS, 525, 4832, doi: 10.1093/mnras/stad2497
- Yajima et al. (2017a) Yajima, H., Nagamine, K., Zhu, Q., Khochfar, S., & Dalla Vecchia, C. 2017a, ApJ, 846, 30, doi: 10.3847/1538-4357/aa82b5
- Yajima et al. (2017b) Yajima, H., Ricotti, M., Park, K., & Sugimura, K. 2017b, ApJ, 846, 3, doi: 10.3847/1538-4357/aa8269