UniTable: Towards a Unified Framework for Table Structure Recognition
via Self-Supervised Pretraining
Abstract
Tables convey factual and quantitative data with implicit conventions created by humans that are often challenging for machines to parse. Prior work on table structure recognition (TSR) has mainly centered around complex task-specific combinations of available inputs and tools. We present UniTable, a training framework that unifies both the training paradigm and training objective of TSR. Its training paradigm combines the simplicity of purely pixel-level inputs with the effectiveness and scalability empowered by self-supervised pretraining (SSP) from diverse unannotated tabular images. Our framework unifies the training objectives of all three TSR tasks — extracting table structure, cell content, and cell bounding box (bbox) — into a unified task-agnostic training objective: language modeling. Extensive quantitative and qualitative analyses highlight UniTable’s state-of-the-art (SOTA) performance on four of the largest TSR datasets To promote reproducible research, enhance transparency, and SOTA innovations, we open-source our code at https://github.com/poloclub/unitable and release the first-of-its-kind Jupyter Notebook of the whole inference pipeline, fine-tuned across multiple TSR datasets, supporting all three TSR tasks.
1 Introduction
Tables are ubiquitous in documents, as they serve to summarize factual and quantitative data — information that is cumbersome to describe in text but nevertheless crucial (Göbel et al., 2013; Gao et al., 2019). Due to the implicit conventions used by humans in creating tables, the representations within tables are often challenging for machines to parse. Even the milestone vision-language models (VLM), GPT-4V(vision) (Yang et al., 2023), still struggles with various document-related tasks including TSR (Cui et al., 2023). GPT-4V tends to omit content in large tables and performs worse when faced with complex tables, e.g., spanning or empty cells and uneven text distributions (Shi et al., 2023).
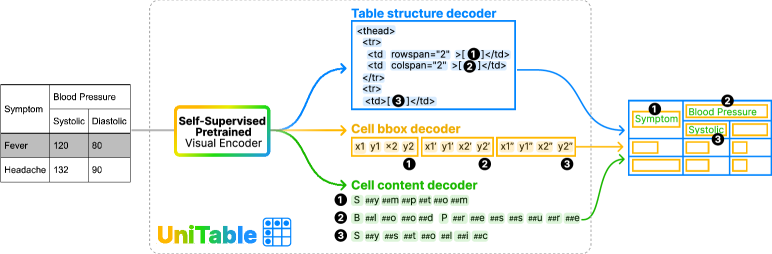
Prior work on TSR has mainly centered around complex task-specific combinations of available inputs and tools. Typically, table structure was predicted by an image-to-text pipeline (Zhong et al., 2020) and cell bbox was predicted by a detection head, e.g., Faster R-CNN (Smock et al., 2022) or DETR (Nassar et al., 2022). The assumption regarding predicting cell content varies: some studies assume the presence of a portable document format (PDF) accompanying the tabular image (Nassar et al., 2022), while others rely on external text line detection and text recognition models (Ye et al., 2021; Huang et al., 2023). However, training generic Transformers under a single language modeling objective, i.e., predicting the next token, for diverse tasks has achieved remarkable success across diverse tasks in language (Radford et al., 2019; Brown et al., 2020), vision (Chen et al., 2021, 2022), and vision-and-language domains (Achiam et al., 2023). We wonder whether understanding visual language in tables, i.e., extracting table structure, cell content, and cell bbox from tabular images, can be seamlessly integrated into the language modeling training framework. This integration is challenging because: (1) the fusion of vision and language in tabular images demands high-fidelity reading and rich high-level representations (Lee et al., 2023); (2) the large amount of unannotated tabular images in practice cannot be leveraged by existing supervised learning approaches (Nassar et al., 2022; Ma et al., 2023); (3) the diverse output of table-related tasks are typically addressed by task-specific models (Huang et al., 2023); and (4) direct application of a linear projection Transformer results in the significant performance drop (Peng et al., 2023), leading prior work to exclusively employ a hybrid convolutional neural network (CNN)-Transformer architecture. We resolve the above challenges by proposing UniTable, a training framework that unifies both training paradigm and training objective of TSR and make the following major contributions (Fig. 1):
-
1.
UniTable’s training paradigm combines the simplicity of purely pixel-level inputs with the effectiveness and scalability empowered by SSP from diverse unannotated tabular images. Specifically, UniTable unifies the training paradigm for TSR: pretraining the visual encoder by predicting the masked tabular images in a self-supervised manner and finetuning the visual encoder along with the task decoder on supervised datasets. With UniTable, the table structure prediction on SynthTabNet (Nassar et al., 2022), a comprehensive dataset with 600k tables across finance, marketing, and academia in both dense and sparse format, achieves the SOTA 99.18% when self-supervised pretrained on 2M images, significantly lifting the original accuracy of 84.04% when trained from scratch using a linear projection Transformer. Owing to the powerful SSP, UniTable has also successfully mitigated the performance drop caused by replacing the CNN backbone with the linear projection.
-
2.
UniTable unifies the training objectives of all three TSR tasks — extracting table structure, cell content, and cell bbox — into a unified task-agnostic training objective: language modeling. Specifically, the input to our model is an image in the form of raw pixels only and the output is text in the form of token sequences, and the training objective is language modeling. UniTable’s SOTA performance on the FinTabNet dataset (Zheng et al., 2021) demonstrates our approach’s generalizability to the PDF input modality as we can simply convert PDF to images. Our framework also enables us to leverage the power of SSP on large-scale unannotated tabular images as all models are finetuned from SSP. UniTable’s unified training objective applies to both linear projection Transformer and hybrid CNN-Transformer architectures conventionally used in TSR.
-
3.
Extensive quantitative and qualitative analyses highlight UniTable’s SOTA performance on four of the largest TSR datasets: ICDAR 2019 B2 Modern (Gao et al., 2019), PubTabNet (Zhong et al., 2020), FinTabNet (Zheng et al., 2021), and SynthTabNet (Nassar et al., 2022). Our visualization of the visual tokens reveals the key reason for why SSP works — the visual semantics captured by the visual codebook show a fine-grained categorization to represent the implicit human conventions used when creating the tables.
-
4.
Open-source code and UniTable in practice. To promote reproducible research, enhance transparency, SOTA innovations, and facilitate fair comparisons in our domain as tables are a promising modality for representation learning, we open-source our code at https://github.com/poloclub/unitable. We provide all the details regarding training, validation, testing, and ablation studies. To enable users to easily try UniTable on their own tabular images and obtain fully digitized HTML tables, we release the first-of-its-kind Jupyter Notebook of the whole inference pipeline, fine-tuned across multiple TSR datasets, supporting all three TSR tasks.
2 Background
2.1 Task Definition
The goal of TSR is to translate the input tabular image into a machine-readable sequence , which typically consists of table structure , table cell bbox , and table cell content . Structure is a sequence of tokenized HTML table tags , cell bbox is a sequence of bboxes defined by , and cell content comprises the content within each cell in reading order. Note that the sequence length of and are the same, but shorter than as the HTML tags contain both empty and non-empty cells. Since each cell is defined by a single bbox, can have either single or multiple text lines.
2.2 Model Architecture
tsr model architecture has two modules: visual encoder and task decoder. The visual encoder extracts features from input , and the task decoder predicts . For the visual encoder, prior work employed either an off-the-shelf CNN backbone, e.g., ResNets and ResNet variants (He et al., 2016), or hybrid CNN-Transformer architecture. EDD (Zhong et al., 2020) explored five different ResNet-18 variants, TableMaster (Lu et al., 2021) combined residual blocks with multi-aspect global context attention, TableFormer (Nassar et al., 2022) connected a ResNet-18 with Transformer encoder layers, and VAST (Huang et al., 2023) adopted the first four stages of a ResNet-31. These convolution layers cannot be replaced because a direct employment of a vanilla Transformer with linear projection leads to a significant performance drop (Peng et al., 2023). However, linear projection, that divides image into patches, is a widely used input image processor in SOTA vision Transformers (Dosovitskiy et al., 2020; Liu et al., 2021b), VLMs (Li et al., 2022; Liu et al., 2023) and multi-modal models (Mizrahi et al., 2023). Recent work on visual language understanding has also successfully adopted the linear projection (Kim et al., 2022; Lee et al., 2023). Thus, to avoid having a separate architecture design solely for the table domain, we aim to keep the linear projection Transformer, and mitigate the performance gap by SSP. Sec. 3 shows that pretraining the visual encoder in a self-supervised manner significantly helps the model learn how to parse the table structure and achieves performance even higher than architectures with convolutions.
3 A Unified Framework for Pretraining and Finetuning TSR Models
We pretrain the visual encoder by predicting the masked tabular images in a self-supervised manner and finetune the visual encoder along with the task decoder using the supervised dataset for each task, as shown in Fig. 1. Sec. 3.1 introduces the SSP of the visual encoder, and Sec. 3.2 details how we unify all TSR tasks and finetune with the pretrained visual encoder.
3.1 Self-Supervised Pretraining of the Visual Encoder
Before pretraining, each tabular image is tokenized into discrete visual tokens. During pretraining, is divided into patches, and a portion of the image patches are masked so that the visual encoder predicts which visual token is chosen to replace the masked regions.
Image tokens. Define a visual codebook in the latent space , representing entries of visual tokens . The visual codebook is trained in such a way that an input image, once it is embedded into an image grid, each pixel on the embedded image grid can be substituted with a visual token from the codebook. Decoding this modified image grid will then reconstruct the input image. We use Vector Quantized-Variational AutoEncoder (VQ-VAE) (Van Den Oord et al., 2017) to train the visual codebook. Specifically, the tabular image is tokenized into discrete tokens after passing through the encoder , and the decoder takes these discrete tokens and rebuilds the original image. The training objective of VQ-VAE is to maximize the with respect to and . The training is non-differentialble due to the categorical distribution in selecting visual tokens. Thus, we use Gumbel-Softmax (Jang et al., 2016) as a reparameterization trick following DALL-E (Ramesh et al., 2021). We have trained the VQ-VAE on 1M and 2M tabular images, where for 1M, and for 2M.
Image patches. Given an input tabular image , the linear projection divides into a sequence of flattened 2D patches , where is the number of channels, is the size of each image patch, and is the number of patches. It is implemented by a kernel , stride convolution. We set and , thus the sequence length of the image patches is . Approximately 40% of the sequence is replaced with a masked token and the pretraining objective is to maximize the log-likelihood of the visual tokens of the masked region given the unmasked region. The groundtruth visual tokens are provided by the codebook of image tokenizer.
The pretraining task is inspired by the success of masked language (Devlin et al., 2018) and natural image (Bao et al., 2021) modeling, but our work differs in the following ways:
(1) Table incorporates both vision and language representation of data, presenting concise human language with implicit conventions. Models for visual language understanding are required to read with high fidelity while also building rich high-level representation, relying on signals from both vision and language. In contrast, our work first explores the feasibility of self-supervised learning only on images for visual language tasks, using tables as an example.
(2) A domain shift from semantic-rich natural images to predominantly black texts on white background tabular images poses a difficult optimization problem. It appears that tabular images are mainly text and lines separating rows and columns, so the visual codebook can quickly exhaust the table patterns with minimal tokens. Contrarily, the training of VQ-VAE can easily diverge. We discover that training stability is achieved by increasing the total number of tokens or introducing tabular images with colorful backgrounds. Sec. 5.3 visualizes the semantics of the trained visual codebook and provides an explanation for the substantial number of tokens required.
3.2 Unified Finetuning Framework
Prior work employed a task-specific decoder for each task, where was predicted by an image-to-text pipeline and was predicted by a detection head, e.g., Faster R-CNN (Smock et al., 2022) or DETR (Nassar et al., 2022). The assumption on predicting varies: some assume a PDF is always accompanying the tabular image (Nassar et al., 2022), others rely on external text line detection and text recognition models (Ye et al., 2021; Huang et al., 2023). We aim to provide a unified task-agnostic training framework, where the input to our model is an image in the form of raw pixels only and the output is text in the form of token sequences. This setting is also generalizable to PDF input modality as we can simply take a screenshot of the PDF. The framework also enables us to leverage the visual encoder pretrained on the unannotated tabular images.
Table structure . Predicting the table structure already fits our training framework as is defined by discrete HTML table tags. For non-spanning cells, we use <td></td> and <td>[]</td> to denote empty and non-empty cells. For spanning cells, <td marks the beginning, and ></td> and >[]</td> marks the ending of empty and non-empty cells. The specific tokens for spanning cells are rowspan="n" and colspan="n". We use as that covers most of the tables in practice. Apart from the data cell tags, the vocabulary also contains the following tags that define a table: <thead>, <tbody>, <tr>, and their corresponding closing tags.
Table cell bbox . Each cell bbox are four continuous coordinates, which are not naturally expressed as discrete tokens. Inspired by Pix2Seq (Chen et al., 2021), we discretize the coordinate into an integer between 0 and image size. The two directions of an image share the same vocabulary. Since we need to predict all bboxes within a tabular image, each quantized bbox is concatenated together in reading order: from left to right and top to bottom. This formulation completes the quantization and serialization of all bboxes into a sequence of discrete tokens. At inference time, we de-serialize the predicted sequence into groups of four tokens.
Table cell content . After predicting all bbox coordinates, we only need to perform optical character recognition (OCR) on the image region within each bbox. Note that each cell is defined by a single bbox, thus the cell content can have single or multiple lines of text. In the training stage, the model is trained on a mixture of single line and multi-line dataset. At inference time, we parse all text simultaneously as each cell bbox is independent. Finally, we insert the cell content back into the non-empty cells <td>[]</td> or >[]</td> as the reading order is already preserved in both S and B. We use WordPiece tokenizer (Wu et al., 2016) with charater-level granularity since OCR requires the model to read instead of understanding the semantics, which significantly reduces the total vocabulary size to less than 6k.
Up till now, we have completely digitalized a tabular image into HTML with a unified image-to-text framework. Note that all visual encoders are initialized from SSP. For cell content and cell bbox, there is an alternative solution that we first generate all the cell content within a table, and then predict the cell bbox via prompting the model with cell content. However, we find it hard for the model to predict all the cell content first as all tabular images are rescaled to a fixed size during augmentation, and such rescaling leads to texts in various aspect ratios. Thus, we do not use this solution and instead generate all cell bbox first.
Training Objective. Since all task outputs have been formulated into a sequence of discrete tokens, the objective function is simply the maximum likelihood of tokens conditioned on pixel inputs and the preceding tokens. Denote the probability of the th step prediction , we directly maximize the correct structure prediction by using the following formulation:
| (1) |
where are model parameters.
| IC19B2M | PubTabNet | FinTabNet | SynthTabNet | PubTables-1M | ||||||
| IoU 0.6 | WAvg. F1 | S-TEDS | TEDS | S-TEDS | S-TEDS | |||||
| SOTA | GTE | GTE | VAST | VAST | VAST | VAST | TableFormer | DRCC | DETR | DETR |
| 38.50 | 24.80 | 94.50 | 97.23 | 96.31 | 98.63 | 87.70 | 98.70 | 97.10 | 94.80 | |
| UniTable | ||||||||||
| Base | 54.97 | 40.15 | 97.94 | 95.63 | 94.78 | 97.19 | 98.99 | 98.97 | 94.48 | 88.64 |
| Large | 58.10 | 42.62 | 98.43 | 97.89 | 96.50 | 98.89 | 99.00 | 99.39 | 95.68 | 93.28 |
4 Experiments
4.1 Implementation Details
Architecture. We have trained two model variants: (1) a base model with 30M parameters including 4 encoder layers, 8 attention heads with a hidden size of 512, (2) a large model with 125M parameters including 12 encoder layers, 12 attention heads with a hidden size of 768. Both base and large models have a task decoder of 4 decoder layers. The maximum token sequence length is 512 for table structure, 1024 for cell bbox, and 200 for cell content, as we find such settings satisfy most of the tables.
Training and inference We have pretrained the VQ-VAE on 1M and 2M tabular images. The 1M VQ-VAE is trained on PubTabNet (Zhong et al., 2020) and SynthTabNet (Nassar et al., 2022), and the extra 1M datasets for training 2M VQ-VAE are PubTables-1M (Smock et al., 2022) and TableBank (Li et al., 2020). In Sec. 4.3, we present the finetuning results of 2M VQ-VAE for comparing with SOTA methods. In Sec. 5.1, we ablate the effectiveness and scalability of SSP on both 1M and 2M VQ-VAE. All models are trained with the AdamW optimizer (Loshchilov & Hutter, 2017). We employ a cosine learning rate scheduler with a linear warmup. All models are trained for 24 epochs for a fair comparison. We apply teacher forcing during training and employ greedy decoding at inference time.
4.2 Evaluation Metrics
car was first proposed in ICDAR2013 competition (Göbel et al., 2013) and improved by ICDAR2019 competition (Gao et al., 2019). It aligns the the predicted bbox with the groundtruth bbox for each table cell based on intersection over union (IoU) and generates a list of adjacency relations between a non-empty cell and its nearest horizontal and vertical neighbors. The precision, recall, and F1 score are computed based on this converted 1-D adjacency relation list.
COCO average prevision (AP) (Lin et al., 2014) is a widely used metric for generic object detection, which has been reported in other work for evaluating table cell detection. We use the COCO evaluation toolkit111https://github.com/cocodataset/cocoapi and report mean (mAP), , and .
teds was created by PubTabNet (Zhong et al., 2020) to robustify the cell adjacency relations (CAR) metric against cell shift perturbation and cell content perturbation. \Acteds converts the table HTML code into a tree structure and measures the edit distance between the prediction and the groundtruth . A shorter edit distance indicates a higher degree of similarity, leading to a higher tree-edit-distance-based similarity (TEDS) score. \Acteds measures both the table structure and table cell content, and we use S-TEDS (Huang et al., 2023) when only the table structure is considered.
4.3 Datasets and Results
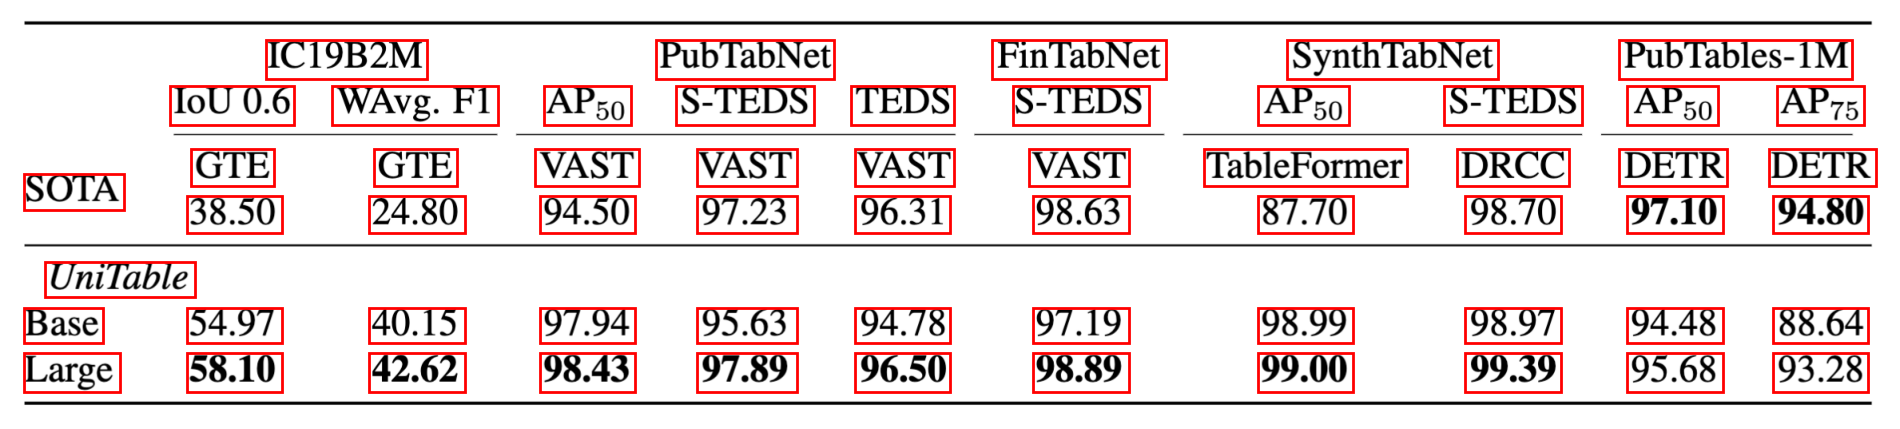
We evaluate UniTable on five of the largest publicly available TSR datasets as shown in Table 1. Comparing UniTable with the prior SOTA on each dataset across all available tasks, we achieve new SOTA on four out of the five datasets even without training with task-specific loss (Huang et al., 2023) or relying on external PDF for text extraction and bbox post-processing (Nassar et al., 2022). Below is an introduction of each dataset and comparisons with previous methods.
ICDAR 2019 B2 Modern (IC19B2M) (Gao et al., 2019) was originated from ICDAR 2019 table competition. The dataset has two subsets for TSR, archival and modern, and only the modern subset has table cell content bbox annotations. The competition computes CAR F1 score at and ranks method by weighted average F1 (WAvg. F1):
| (2) |
We evalute on all 100 test tables from the modern subset and report both WAvg. F1 and IoU 0.6 as in other work. Our method significantly improves the previous SOTA GTE (Zheng et al., 2021) by a large margin.
PubTabNet (Zhong et al., 2020) contains 509k images of heterogeneous tables extracted from the medical scientific articles. It is the first large-scale TSR dataset that provides annotations (in HTML format) of table cell bbox, table structure, and table cell content. PubTabNet measures the table cell bbox by COCO , table structure by S-TEDS, and full table including both structure and cell content by TEDS. The authors of PubTabNet also developed the EDD model, which consisted of a CNN encoder and dual recurrent neural network (RNN) decoders for predicting table structure and cell content, respectively. TableFormer (Nassar et al., 2022) improved EDD by replacing the cell content decoder with a cell bbox decoder and extracted all contents from the PDF corresponding to the tabular image. VAST (Huang et al., 2023) added an auxiliary visual-alignment loss while training the cell bbox decoder and achieved previous SOTA on all three metrics. Our unified training framework with SSP achieves the new SOTA on all tasks even without leveraging any external PDF as PDF corresponding to the tabular image may not always exist. Specifically, both UniTable-base and UniTable-large outperform VAST on by more than 3 percentage points (pp), which confirms the effectiveness of converting the cell bbox detection to language modeling.
FinTabNet (Zheng et al., 2021) is a dataset containing 113k tables from the annual reports of the S&P 500 companies in PDF format. The major challenge of this dataset is that financial tables largely differ from scientific and government document tables in that the former has fewer graphical lines, larger gaps within each table, and more color variations. Thus, FinTabNet mainly evaluates table structure prediction accuracy, i.e., S-TEDS. VAST trained the model with an auxiliary supervised signal and achieved the previous SOTA. We achieve the new SOTA by leveraging SSP and finetuning without a task-specific loss objective. The performance gain from base to large shows that our method scales with model parameters.
SynthTabNet (Nassar et al., 2022) is a large-scale synthetically generated dataset that offers control over 1) dataset size, 2) table structure, 3) table style, and 4) content type. The dataset aims to overcome the limitations of PubTabNet and FinTabNet, which are skewed table distributions towards simpler tables, limited variance in appearance styles, and restricted cell content domains. Thus, SynthTabNet is organized into 4 subsets of 150k tables (600k in total), namely Finance, PubTabNet, Marketing, and Sparse. The first two mimic the appearance of FinTabNet and PubTabNet but encompass more complex table structures. Marketing adopts a colorful appearance with high contrast that resembles real-world marketing tables, and Sparse contains tables with sparse content. The authors of SynthTabNet propose TableFormer as a baseline. TableFormer predicts table structure and cell bbox and relies on external PDF to extract cell content, so and S-TEDS are the evaluation metrics. Both our base and large models outperform previous SOTA on and S-TEDS. Since SynthTabNet is a comprehensive dataset that can thoroughly evaluate the model under different table configurations, we use it for ablations and present results on four subsets separately in Sec. 5.
PubTables-1M (Smock et al., 2022) aims to overcome the groundtruth inconsistency observed in prior datasets using a new canonicalization procedure. The dataset has 947k tables annotated with bbox and text within each bbox. The dataset differs from previous datasets that the bbox is word-wise instead of cell-wise, thus each cell can have more than one bbox. Besides, since all annotations are in bbox format and no table structure labels, e.g., HTML, are provided, the baseline DETR trained by the dataset creators report their performance in detection metrics, e.g., and . UniTable also achieves competitive results compared with the baseline DETR. After visualizing our predicted bbox, we find our model normally predicts more bboxes (longer sequence) than the groundtruth. We delve deep into the dataset annotations and discover previously unacknowledged inconsistencies in table annotations. We conjecture the SOTA performance of DETR model on PubTables-1M may be due to overfitting to the training set.
4.4 Using UniTable in Practice
We have also finetuned our UniTable-large across multiple datasets and released a Jupyter Notebook as a demo of our inference pipeline. A user can simply pass a table screenshot through our notebook and obtain a fully digitalized HTML table. The table structure is trained across PubTabNet, FinTabNet, and SynthTabNet, the cell bbox is trained across PubTabNet and SynthTabNet, and the cell content is trained across PubTabNet, SynthTabNet, and PubTables-1M. Appendix A visualizes several table examples in practice.
5 Deeper Dive into UniTable: Ablation and Analysis
5.1 Effectiveness and Scalability of SSP
| Finance | PubTabNet | Marketing | Sparse | |||||
|---|---|---|---|---|---|---|---|---|
| Base | Large | Base | Large | Base | Large | Base | Large | |
| No SSP | 88.95 | 90.75 | 89.10 | 91.67 | 68.05 | 70.60 | 85.50 | 87.72 |
| SSP 1M | 98.73 | 99.56 | 99.02 | 99.55 | 95.14 | 99.05 | 97.20 | 99.29 |
| SSP 2M | 99.41 | 99.58 | 99.44 | 99.56 | 98.35 | 99.08 | 98.69 | 99.34 |
We ablate the effectiveness and scalability of SSP on all four subsets of SynthTabNet since SynthTabNet is a large-scale dataset that can comprehensively evaluate the model under different table configurations. Table 2 presents the table structure task, and the same trend also applies to other tasks as elaborated in Appendix B. Comparing row “No SSP” and “SSP 1M” or “SSP 2M”, both the base and the large models have benefited significantly from the SSP. Specifically, Marketing and Sparse are two of the most challenging subsets. Marketing has a colorful background with high-contrast texts, and Sparse contains tables with sparse content. These variations make it challenging to accurately predict the HTML table structure tags and bbox surrounding the cell content. Without SSP, the model performance suffers, and increasing the model complexity from base to large barely improves the performance. Instead, after pretraining the visual encoder on 1M tabular images, both the base and the large models have an average increase of 14.40 pp. Note the performance also scales along with the pretraining dataset size. When the pretraining dataset increases from 1M to 2M, the average performance continues to increase by 0.74 pp. Finally, all large models have an average performance gain of 1.51 pp over the base models.
5.2 Generalization of the Unified Training Objective
| Model | Finance | PubTabNet | Marketing | Sparse |
|---|---|---|---|---|
| Base | 98.63 | 98.80 | 97.16 | 95.30 |
| Large | 99.44 | 99.44 | 98.71 | 98.64 |
We showcase that our unified training objective, language modeling, not only works on models with linear projection Transformer, but also works with the hybrid CNN-Transformer architecture used in the TSR literature. Table 3 presents the results on all four subsets of the SynthTabNet similar to the settings in Sec. 5.1. The main difference is that the linear projection in the visual encoder is replaced by a ResNet-18 CNN backbone. Such a modification leads to an increase of 12M parameters. The performance of this hybrid CNN-Transformer architecture is roughly on par with the linear projection model initialized from the SSP 1M tabular images, which shows that our training objective is agnostic to the choice of architecture. The significant performance gap between hybrid CNN-Transformer and linear projection Transformer trained from scratch verifies the observation identified in the previous literature (Peng et al., 2023). Though hybrid CNN-Transformer has also achieved competitive results, we still recommend using the linear projection Transformer because of 1) capability of leveraging the power of SSP, 2) architectural compliance with VLM in natural image domain, and 3) the performance of hybrid CNN-Transformer is still worse than the SSP on 2M tabular images even with more total parameters. Though prior work has started to propose SSP for hybrid CNN-Transformer, this direction is still in its early stage as it is challenging in heavy computational cost and pretraining-finetuning discrepancy (Gao et al., 2022). Moreover, most work only demonstrates the capability in discriminative tasks rather than the generative tasks used in the TSR domain. Besides, existing SOTA VLMs, e.g., BLIP-2 (Li et al., 2023) and LLaVA (Liu et al., 2023), still employ the linear projection and leave the Transformer to learn the interactions between different patches. As we believe the compliance of architecture is an important step towards generic VLMs, our success in replacing the CNN backbone with linear projection and leveraging a task-agnostic language modeling loss is a cornerstone of incorporating TSR in modern VLM training.
5.3 Why does SSP work?
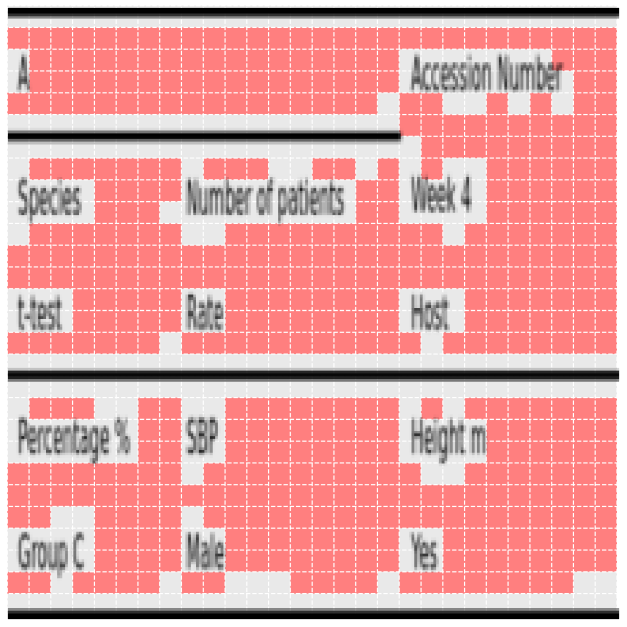
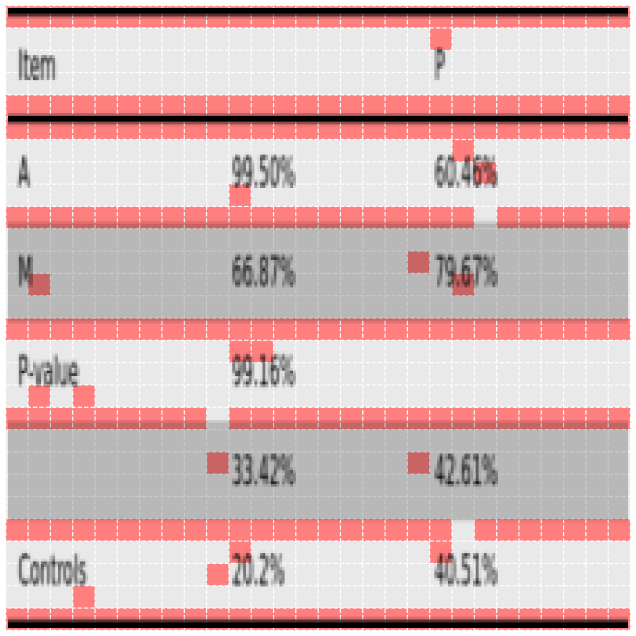
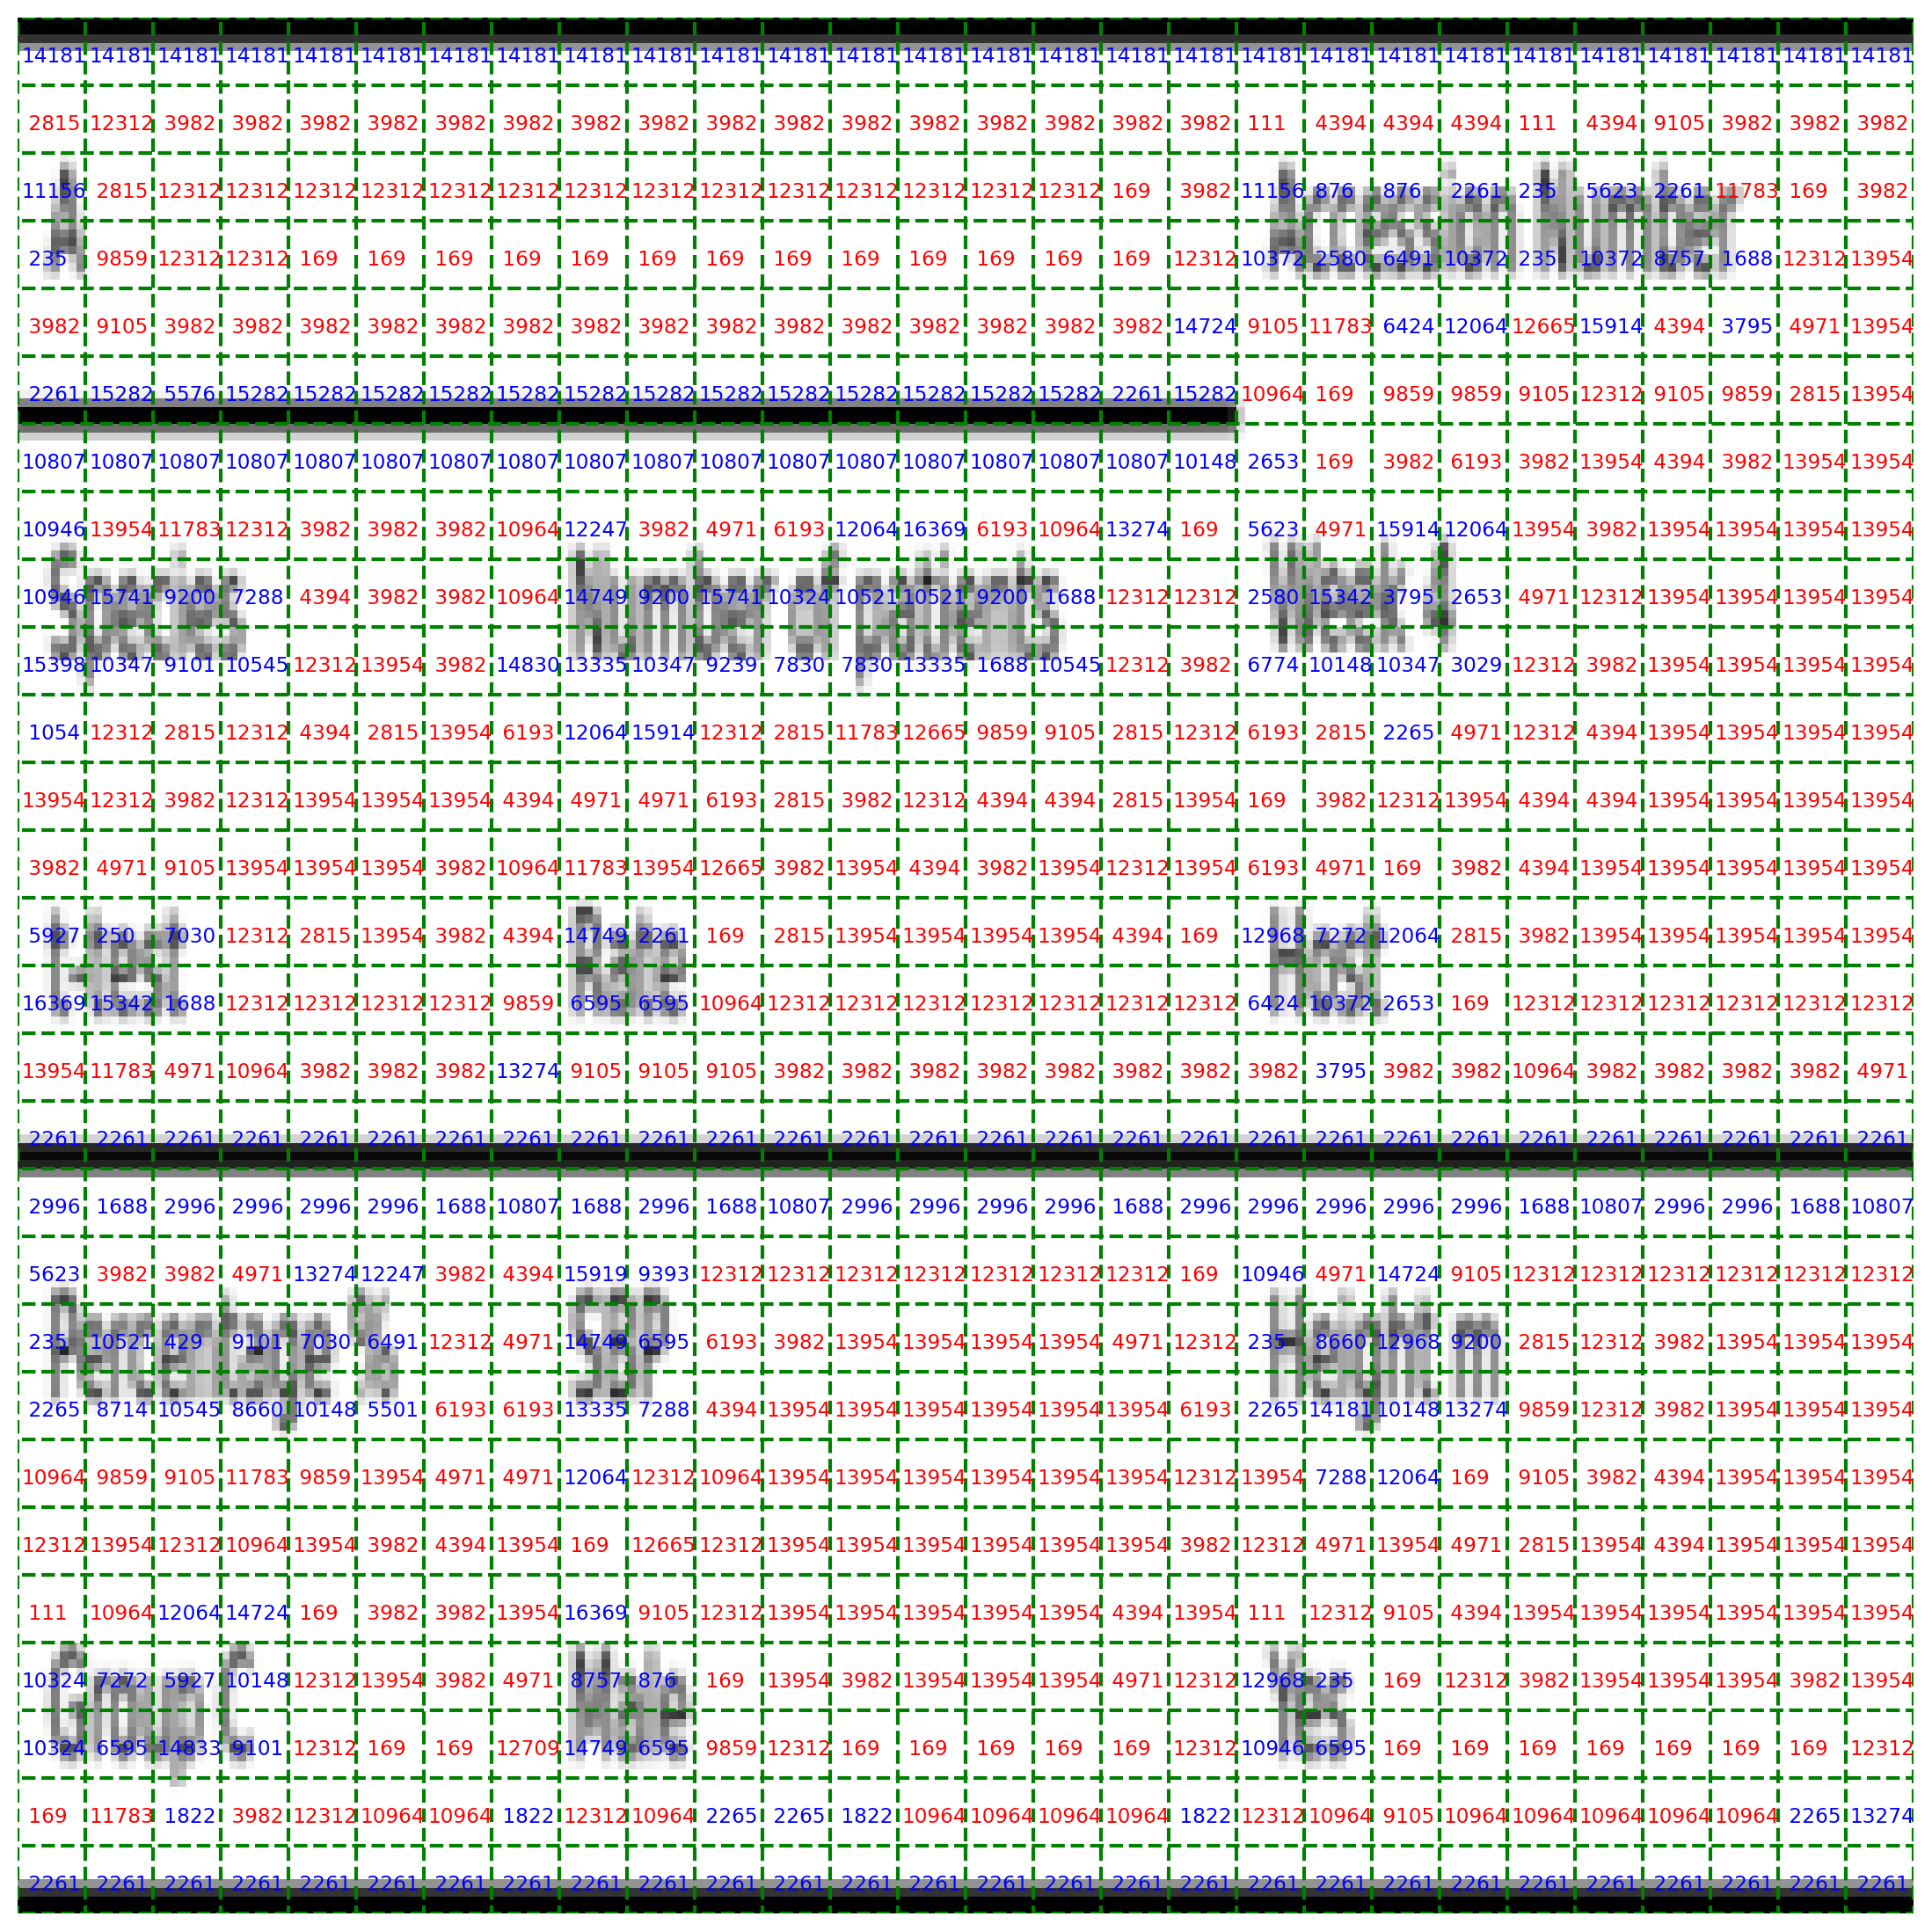
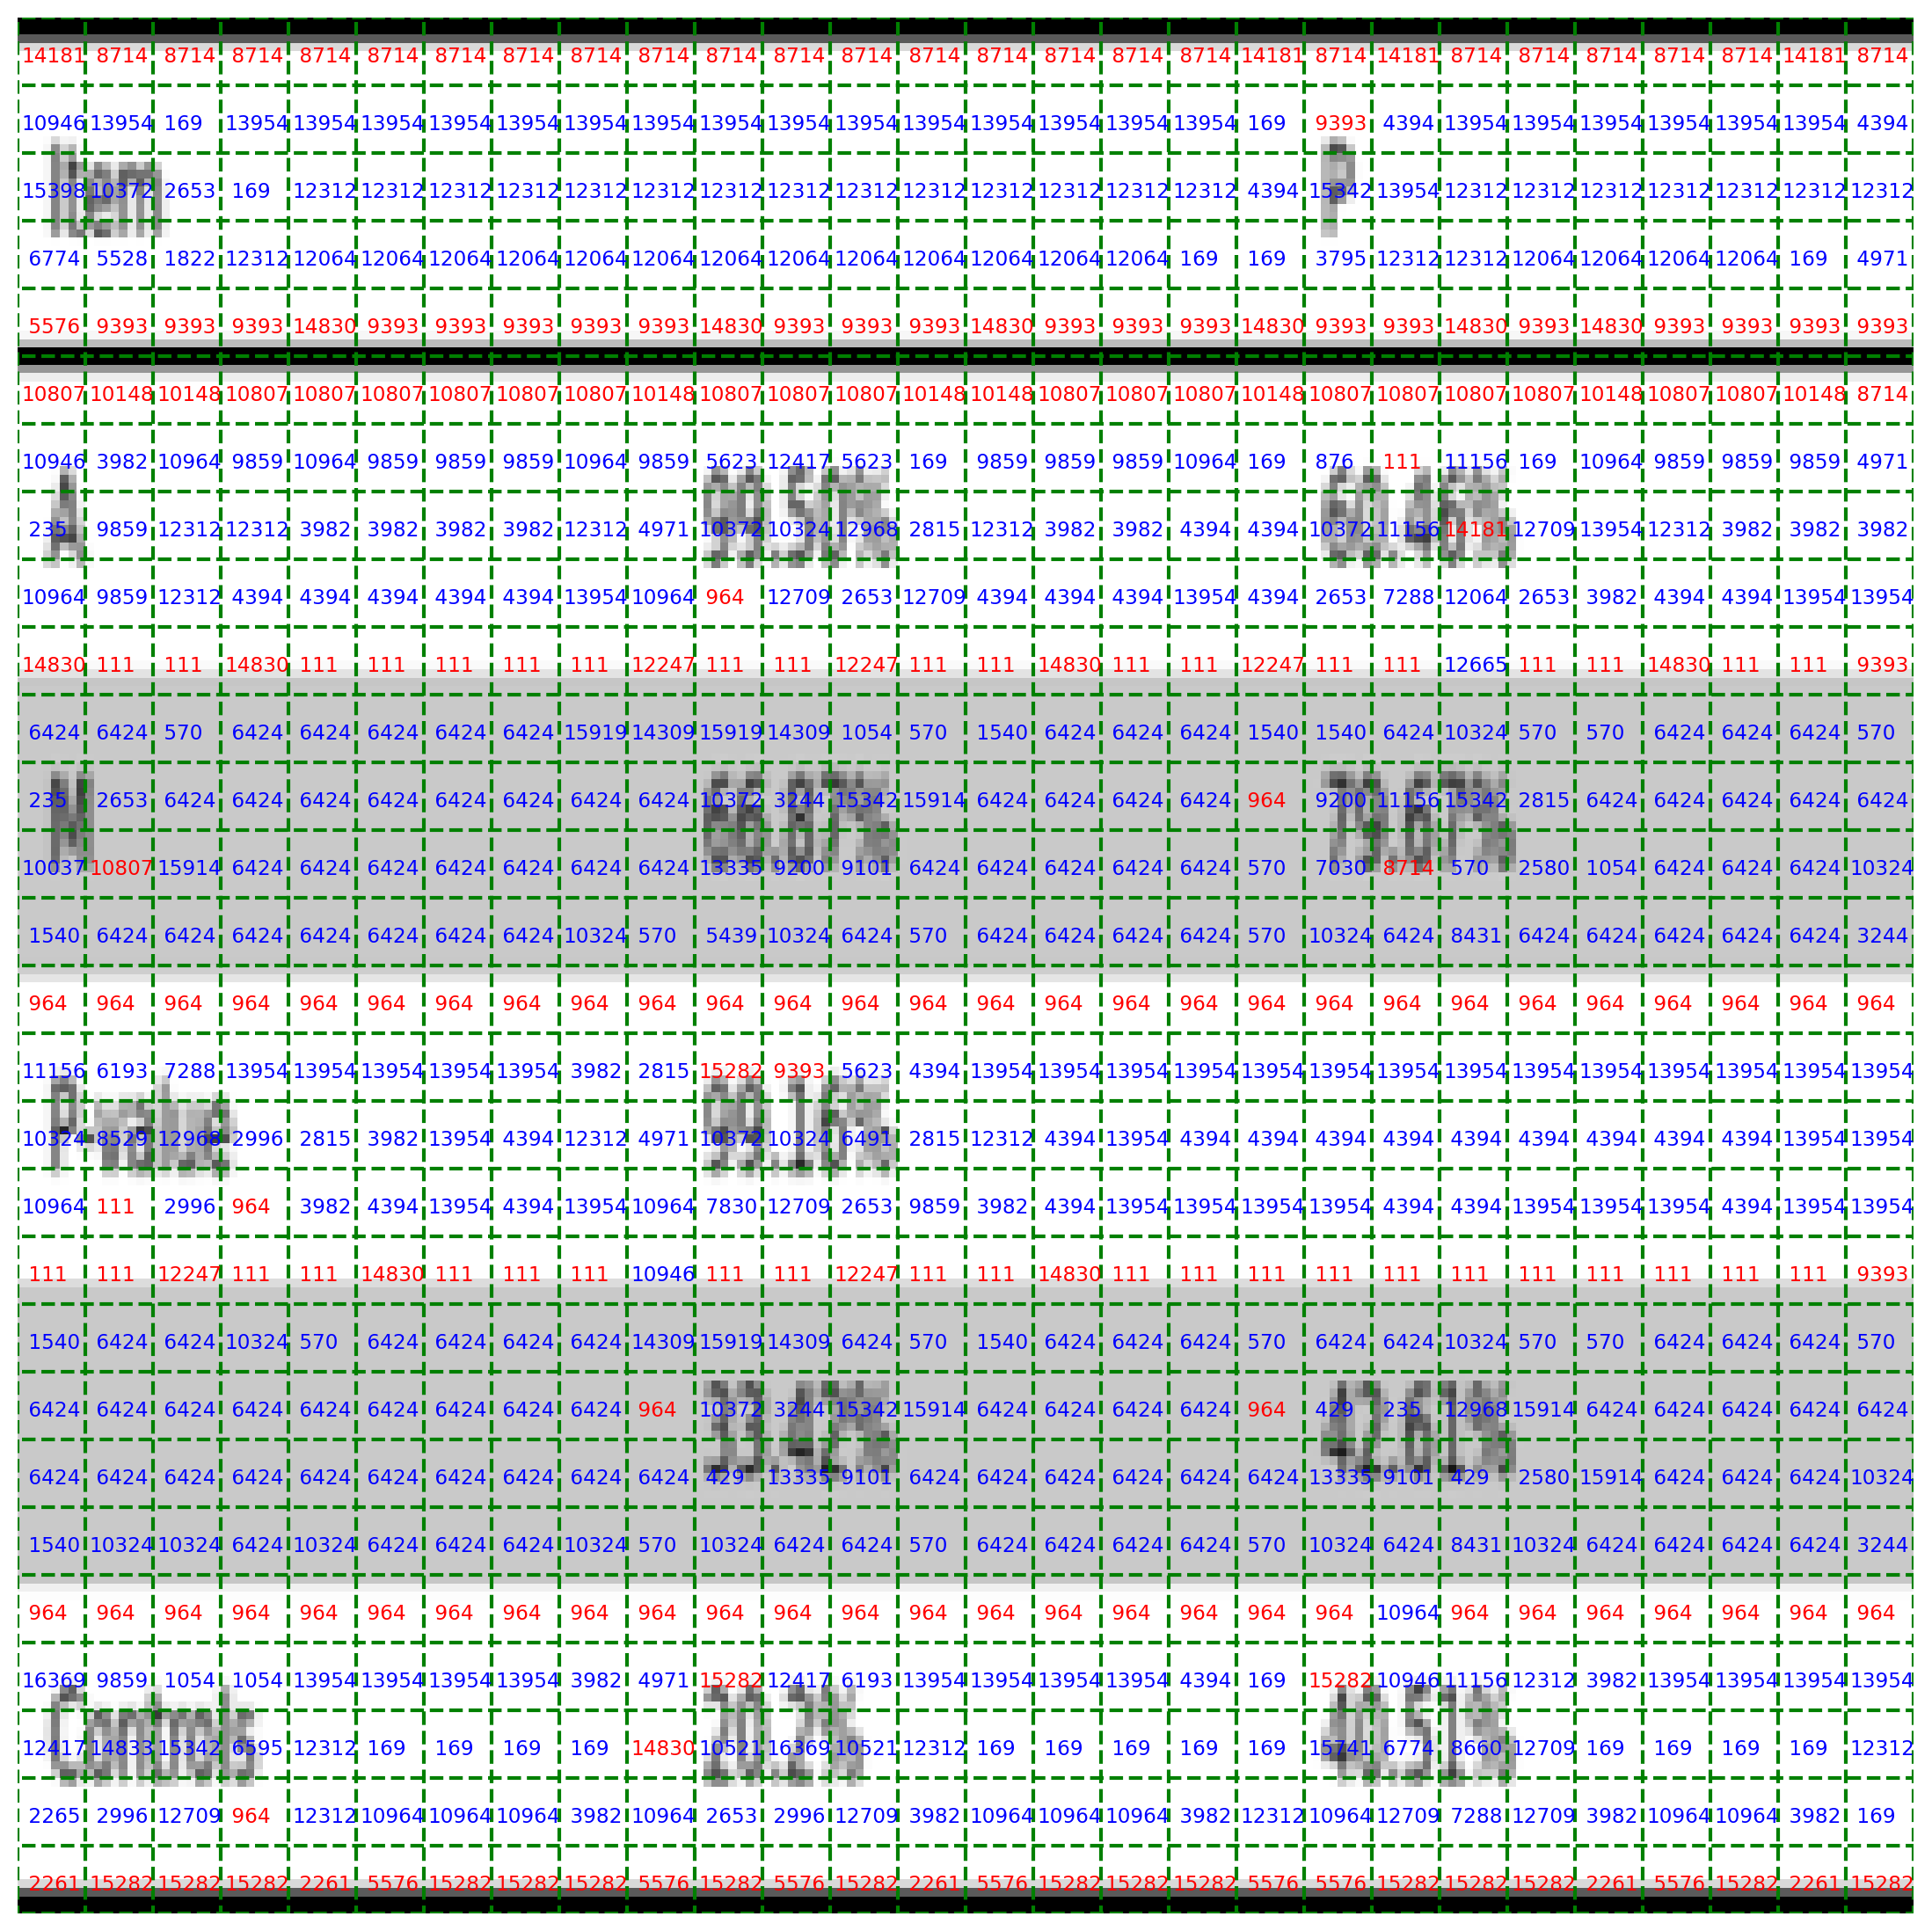
During SSP, the visual encoder is trained to fill in the masked tabular image by selecting visual tokens from the VQ-VAE codebook. Thus, we visualize the selected token indices and analyze whether the tokens have visual semantics. Fig. 2 presents the original table overlaid by the selected token indices from the 2M VQ-VAE codebook. We highlight the token indices under investigation with red patches. Appendix D provides a zoomed-in version of these images labeled with token indices. The input image size is and the patch size is , so each image has tokens chosen from the 16384 entries in the codebook. First, we highlight the tokens representing the blank white background. Comparing the highlighted (red) and not-highlighted regions, we observe that the highlighted region has covered most of the blank space inside the table, and the not-highlighted region has formulated a convex hull tightly surrounding either the texts or separation lines. Next, we highlight the tokens representing the separation lines. Comparing the highlighted (red) and not-highlighted regions, we observe that the red regions align with all the separations within the table, e.g., line separations and color shading separations. Taking a closer look at the indices in Fig. 4 and 5, we find the codebook has learned to represent an abstract concept by assigning multiple tokens, where each reflects a different scenario. For example, token “111” represents the separation above the gray color shading and token “964” represents the one below, and token “15282” represents the separation above a bold horizontal line and “10807” represents the one below. A certain type of separation also has multiple choices depending on the portion of the line within the patch, e.g., token “14181”, “8714”, and “10807” all representing the “below a bold horizontal line”, but the differences lie in the line thickness and amount of black inside the image patch. Such a fine-grained categorization also explains why the codebook needs so many tokens to represent the implicit conventions created by humans in the table.
6 Related Work
Prior work on TSR is scattered and has mainly centered around complex task-specific combinations of available inputs and tools. The earliest methods were based on splitting and merging, where the first stage detected rows, columns, and text blocks, and the second stage merged text blocks to restore the structure, e.g., DeepDeSRT (Schreiber et al., 2017) and TableNet (Paliwal et al., 2019). Another line of methods first detects the cells and then classifies the row and column relationships based on graphs, e.g., FLAG-NET (Liu et al., 2021a) and Hetero-TSR (Liu et al., 2022). Recent researchers have also started to leverage image-to-text generation for table structure prediction. This method treats the table structure as a sequence and adopts an end-to-end image-to-text paradigm. Deng, et al. (Deng et al., 2019) employed a hybrid CNN-LSTM architecture to generate the LaTeX code of the table. Zhong, et al. (Zhong et al., 2020) introduced an encoder-dual-decoder (EDD) architecture in which two RNN-based decoders were responsible for logical and cell content, respectively. Both TableFormer (Nassar et al., 2022) and TableMaster (Ye et al., 2021) enhanced the EDD decoder with a transformer decoder and included a regression decoder to predict the bounding box instead of the content. VAST (Huang et al., 2023) proposed an auxiliary visual alignment loss to ensure that the logical representation of the non-empty cells contains more local visual details. Our goal differs from existing approaches as we focus on providing a training framework that unifies both the training paradigm and the training objective of TSR.
7 Conclusion
We present UniTable, a training framework that unifies both the training paradigm and training objective of TSR. Its training paradigm combines the simplicity of purely pixel-level inputs with the effectiveness and scalability empowered by SSP from diverse unannotated tabular images. Our framework unifies the training objectives of all three TSR tasks, extracting table structure, cell content, and cell bbox, into a unified task-agnostic training objective: language modeling. Extensive quantitative and qualitative analyses highlights UniTable’s SOTA performance on four of the largest TSR datasets To promote reproducible research, enhance transparency, and SOTA innovations, we open-source our code and release the first-of-its-kind Jupyter Notebook of the whole inference pipeline, fine-tuned across multiple TSR datasets, supporting all three TSR tasks.
Impact Statements
This paper presents work whose goal is to advance the field of Machine Learning, especially TSR. To enable users to easily try UniTable on their own tabular images and obtain fully digitized HTML tables, we release the first-of-its-kind Jupyter Notebook of the whole inference pipeline, fine-tuned across multiple TSR datasets, supporting all three TSR tasks.
References
- Achiam et al. (2023) Achiam, J., Adler, S., Agarwal, S., Ahmad, L., Akkaya, I., Aleman, F. L., Almeida, D., Altenschmidt, J., Altman, S., Anadkat, S., et al. Gpt-4 technical report. arXiv preprint arXiv:2303.08774, 2023.
- Bao et al. (2021) Bao, H., Dong, L., Piao, S., and Wei, F. Beit: Bert pre-training of image transformers. arXiv preprint arXiv:2106.08254, 2021.
- Brown et al. (2020) Brown, T., Mann, B., Ryder, N., Subbiah, M., Kaplan, J. D., Dhariwal, P., Neelakantan, A., Shyam, P., Sastry, G., Askell, A., et al. Language models are few-shot learners. Advances in neural information processing systems, 33:1877–1901, 2020.
- Chen et al. (2021) Chen, T., Saxena, S., Li, L., Fleet, D. J., and Hinton, G. Pix2seq: A language modeling framework for object detection. arXiv preprint arXiv:2109.10852, 2021.
- Chen et al. (2022) Chen, T., Saxena, S., Li, L., Lin, T.-Y., Fleet, D. J., and Hinton, G. E. A unified sequence interface for vision tasks. Advances in Neural Information Processing Systems, 35:31333–31346, 2022.
- Cui et al. (2023) Cui, C., Zhou, Y., Yang, X., Wu, S., Zhang, L., Zou, J., and Yao, H. Holistic analysis of hallucination in gpt-4v (ision): Bias and interference challenges. arXiv preprint arXiv:2311.03287, 2023.
- Deng et al. (2019) Deng, Y., Rosenberg, D., and Mann, G. Challenges in end-to-end neural scientific table recognition. In 2019 International Conference on Document Analysis and Recognition (ICDAR), pp. 894–901. IEEE, 2019.
- Devlin et al. (2018) Devlin, J., Chang, M.-W., Lee, K., and Toutanova, K. Bert: Pre-training of deep bidirectional transformers for language understanding. arXiv preprint arXiv:1810.04805, 2018.
- Dosovitskiy et al. (2020) Dosovitskiy, A., Beyer, L., Kolesnikov, A., Weissenborn, D., Zhai, X., Unterthiner, T., Dehghani, M., Minderer, M., Heigold, G., Gelly, S., et al. An image is worth 16x16 words: Transformers for image recognition at scale. arXiv preprint arXiv:2010.11929, 2020.
- Gao et al. (2019) Gao, L., Huang, Y., Déjean, H., Meunier, J.-L., Yan, Q., Fang, Y., Kleber, F., and Lang, E. Icdar 2019 competition on table detection and recognition (ctdar). In 2019 International Conference on Document Analysis and Recognition (ICDAR), pp. 1510–1515. IEEE, 2019.
- Gao et al. (2022) Gao, P., Ma, T., Li, H., Lin, Z., Dai, J., and Qiao, Y. Convmae: Masked convolution meets masked autoencoders. arXiv preprint arXiv:2205.03892, 2022.
- Göbel et al. (2013) Göbel, M., Hassan, T., Oro, E., and Orsi, G. Icdar 2013 table competition. In 2013 12th International Conference on Document Analysis and Recognition, pp. 1449–1453. IEEE, 2013.
- He et al. (2016) He, K., Zhang, X., Ren, S., and Sun, J. Deep residual learning for image recognition. In Proceedings of the IEEE conference on computer vision and pattern recognition, pp. 770–778, 2016.
- Huang et al. (2023) Huang, Y., Lu, N., Chen, D., Li, Y., Xie, Z., Zhu, S., Gao, L., and Peng, W. Improving table structure recognition with visual-alignment sequential coordinate modeling. In Proceedings of the IEEE/CVF Conference on Computer Vision and Pattern Recognition, pp. 11134–11143, 2023.
- Jang et al. (2016) Jang, E., Gu, S., and Poole, B. Categorical reparameterization with gumbel-softmax. arXiv preprint arXiv:1611.01144, 2016.
- Kim et al. (2022) Kim, G., Hong, T., Yim, M., Nam, J., Park, J., Yim, J., Hwang, W., Yun, S., Han, D., and Park, S. Ocr-free document understanding transformer. In European Conference on Computer Vision, pp. 498–517. Springer, 2022.
- Lee et al. (2023) Lee, K., Joshi, M., Turc, I. R., Hu, H., Liu, F., Eisenschlos, J. M., Khandelwal, U., Shaw, P., Chang, M.-W., and Toutanova, K. Pix2struct: Screenshot parsing as pretraining for visual language understanding. In International Conference on Machine Learning, pp. 18893–18912. PMLR, 2023.
- Li et al. (2022) Li, J., Li, D., Xiong, C., and Hoi, S. Blip: Bootstrapping language-image pre-training for unified vision-language understanding and generation. In International Conference on Machine Learning, pp. 12888–12900. PMLR, 2022.
- Li et al. (2023) Li, J., Li, D., Savarese, S., and Hoi, S. Blip-2: Bootstrapping language-image pre-training with frozen image encoders and large language models. arXiv preprint arXiv:2301.12597, 2023.
- Li et al. (2020) Li, M., Cui, L., Huang, S., Wei, F., Zhou, M., and Li, Z. Tablebank: Table benchmark for image-based table detection and recognition. In Proceedings of the Twelfth Language Resources and Evaluation Conference, pp. 1918–1925, 2020.
- Lin et al. (2014) Lin, T.-Y., Maire, M., Belongie, S., Hays, J., Perona, P., Ramanan, D., Dollár, P., and Zitnick, C. L. Microsoft coco: Common objects in context. In Computer Vision–ECCV 2014: 13th European Conference, Zurich, Switzerland, September 6-12, 2014, Proceedings, Part V 13, pp. 740–755. Springer, 2014.
- Liu et al. (2021a) Liu, H., Li, X., Liu, B., Jiang, D., Liu, Y., Ren, B., and Ji, R. Show, read and reason: Table structure recognition with flexible context aggregator. In Proceedings of the 29th ACM International Conference on Multimedia, pp. 1084–1092, 2021a.
- Liu et al. (2022) Liu, H., Li, X., Liu, B., Jiang, D., Liu, Y., and Ren, B. Neural collaborative graph machines for table structure recognition. In Proceedings of the IEEE/CVF Conference on Computer Vision and Pattern Recognition, pp. 4533–4542, 2022.
- Liu et al. (2023) Liu, H., Li, C., Wu, Q., and Lee, Y. J. Visual instruction tuning. arXiv preprint arXiv:2304.08485, 2023.
- Liu et al. (2021b) Liu, Z., Lin, Y., Cao, Y., Hu, H., Wei, Y., Zhang, Z., Lin, S., and Guo, B. Swin transformer: Hierarchical vision transformer using shifted windows. In Proceedings of the IEEE/CVF international conference on computer vision, pp. 10012–10022, 2021b.
- Loshchilov & Hutter (2017) Loshchilov, I. and Hutter, F. Decoupled weight decay regularization. arXiv preprint arXiv:1711.05101, 2017.
- Lu et al. (2021) Lu, N., Yu, W., Qi, X., Chen, Y., Gong, P., Xiao, R., and Bai, X. Master: Multi-aspect non-local network for scene text recognition. Pattern Recognition, 117:107980, 2021.
- Ma et al. (2023) Ma, C., Lin, W., Sun, L., and Huo, Q. Robust table detection and structure recognition from heterogeneous document images. Pattern Recognition, 133:109006, 2023.
- Mizrahi et al. (2023) Mizrahi, D., Bachmann, R., Kar, O. F., Yeo, T., Gao, M., Dehghan, A., and Zamir, A. 4m: Massively multimodal masked modeling. arXiv preprint arXiv:2312.06647, 2023.
- Nassar et al. (2022) Nassar, A., Livathinos, N., Lysak, M., and Staar, P. Tableformer: Table structure understanding with transformers. In Proceedings of the IEEE/CVF Conference on Computer Vision and Pattern Recognition, pp. 4614–4623, 2022.
- Paliwal et al. (2019) Paliwal, S. S., Vishwanath, D., Rahul, R., Sharma, M., and Vig, L. Tablenet: Deep learning model for end-to-end table detection and tabular data extraction from scanned document images. In 2019 International Conference on Document Analysis and Recognition (ICDAR), pp. 128–133. IEEE, 2019.
- Peng et al. (2023) Peng, A., Lee, S., Wang, X., Balasubramaniyan, R. R., and Chau, D. H. High-performance transformers for table structure recognition need early convolutions. In NeurIPS 2023 Second Table Representation Learning Workshop, 2023.
- Radford et al. (2019) Radford, A., Wu, J., Child, R., Luan, D., Amodei, D., Sutskever, I., et al. Language models are unsupervised multitask learners. OpenAI blog, 1(8):9, 2019.
- Ramesh et al. (2021) Ramesh, A., Pavlov, M., Goh, G., Gray, S., Voss, C., Radford, A., Chen, M., and Sutskever, I. Zero-shot text-to-image generation. In International Conference on Machine Learning, pp. 8821–8831. PMLR, 2021.
- Schreiber et al. (2017) Schreiber, S., Agne, S., Wolf, I., Dengel, A., and Ahmed, S. Deepdesrt: Deep learning for detection and structure recognition of tables in document images. In 2017 14th IAPR international conference on document analysis and recognition (ICDAR), volume 1, pp. 1162–1167. IEEE, 2017.
- Shi et al. (2023) Shi, Y., Peng, D., Liao, W., Lin, Z., Chen, X., Liu, C., Zhang, Y., and Jin, L. Exploring ocr capabilities of gpt-4v (ision): A quantitative and in-depth evaluation. arXiv preprint arXiv:2310.16809, 2023.
- Smock et al. (2022) Smock, B., Pesala, R., and Abraham, R. Pubtables-1m: Towards comprehensive table extraction from unstructured documents. In Proceedings of the IEEE/CVF Conference on Computer Vision and Pattern Recognition, pp. 4634–4642, 2022.
- Van Den Oord et al. (2017) Van Den Oord, A., Vinyals, O., et al. Neural discrete representation learning. Advances in neural information processing systems, 30, 2017.
- Wu et al. (2016) Wu, Y., Schuster, M., Chen, Z., Le, Q. V., Norouzi, M., Macherey, W., Krikun, M., Cao, Y., Gao, Q., Macherey, K., et al. Google’s neural machine translation system: Bridging the gap between human and machine translation. arXiv preprint arXiv:1609.08144, 2016.
- Yang et al. (2023) Yang, Z., Li, L., Lin, K., Wang, J., Lin, C.-C., Liu, Z., and Wang, L. The dawn of lmms: Preliminary explorations with gpt-4v (ision). arXiv preprint arXiv:2309.17421, 9(1):1, 2023.
- Ye et al. (2021) Ye, J., Qi, X., He, Y., Chen, Y., Gu, D., Gao, P., and Xiao, R. Pingan-vcgroup’s solution for icdar 2021 competition on scientific literature parsing task b: table recognition to html. arXiv preprint arXiv:2105.01848, 2021.
- Zheng et al. (2021) Zheng, X., Burdick, D., Popa, L., Zhong, X., and Wang, N. X. R. Global table extractor (gte): A framework for joint table identification and cell structure recognition using visual context. In Proceedings of the IEEE/CVF winter conference on applications of computer vision, pp. 697–706, 2021.
- Zhong et al. (2020) Zhong, X., ShafieiBavani, E., and Jimeno Yepes, A. Image-based table recognition: data, model, and evaluation. In European conference on computer vision, pp. 564–580. Springer, 2020.
Appendix A Using UniTable in Practice
A user can simply pass a table screenshot through our notebook and obtain a fully digitalized HTML table. We visualize different types of table cell bbox detection results of UniTable in Fig. 3, and an example of a digitalized HTML table can be found in https://anonymous.4open.science/r/icml-review/notebooks/full_pipeline.ipynb.
Appendix B Effectiveness and Scalability of SSP
Table 4 demonstrates the effectiveness and scalability of SSP on all four subsets of SynthTabNet. Without SSP, the model performance suffers, and increasing the model complexity from base to large barely improves the performance. Pretraining the visual encoder on 1M tabular images provides a significant improvement, and pretraining on 2M images continues to increase the performance on all TSR tasks.
Appendix C Generalization of the Unified Training Objective
UniTable’s unified training objective applies to both linear projection Transformer and hybrid CNN-Transformer architectures conventionally used in TSR. Table 5 shows results on all four subsets of the SynthTabNet for table structure prediction evaluated with S-TEDS and table cell bbox detection evaluated with mAP.
Appendix D Visualization of the Visual Codebook
Fig. 4 and 5 present the original table overlaid by the selected token indices from the 2M VQ-VAE codebook. We highlight the token indices under investigation in red and use blue for the others. The input image size is and the patch size is , so each image has tokens chosen from the 16384 entries in the codebook. First, we highlight the tokens representing the blank white background. Comparing the red and blue indices, we observe that the red region has covered most of the blank space inside the table, and the blue region has formulated a convex hull tightly surrounding either the texts or separation lines. Next, we highlight the tokens representing the separation lines. Comparing the red and blue regions, we observe that the red regions align with all the separations within the table, e.g., line separations and color shading separations. Taking a closer look at the indices, we find the codebook has learned to represent an abstract concept by assigning multiple tokens, where each reflects a different scenario. For example, token “111” represents the separation above the gray color shading and token “964” represents the one below, and token “15282” represents the separation above a bold horizontal line and “10807” represents the one below. A certain type of separation also has multiple choices depending on the portion of the line within the patch, e.g., token “14181”, “8714”, and “10807” all representing the “below a bold horizontal line”, but the differences lie in the line thickness and amount of black inside the image patch. Such a fine-grained categorization also explains why the codebook needs so many tokens to represent the implicit conventions created by humans in the table.
| Finance | PubTabNet | Marketing | Sparse | |||||
|---|---|---|---|---|---|---|---|---|
| Base | Large | Base | Large | Base | Large | Base | Large | |
| Table structure - S-TEDS | ||||||||
| No SSP | 88.95 | 90.75 | 89.10 | 91.67 | 68.05 | 70.60 | 85.50 | 87.72 |
| SSP 1M | 98.73 | 99.56 | 99.02 | 99.55 | 95.14 | 99.05 | 97.20 | 99.29 |
| SSP 2M | 99.41 | 99.58 | 99.44 | 99.56 | 98.35 | 99.08 | 98.69 | 99.34 |
| Table cell bbox - COCO mAP | ||||||||
| No SSP | 83.30 | 85.46 | 87.67 | 88.88 | 72.00 | 75.21 | 88.84 | 90.01 |
| SSP 1M | 96.13 | 97.07 | 95.93 | 96.95 | 94.63 | 95.91 | 97.07 | 97.84 |
| SSP 2M | 96.54 | 97.37 | 96.50 | 97.44 | 95.21 | 96.25 | 97.46 | 97.96 |
| Model | Finance | PubTabNet | Marketing | Sparse |
|---|---|---|---|---|
| Table structure - S-TEDS | ||||
| Base | 98.63 | 98.80 | 97.16 | 95.30 |
| Large | 99.44 | 99.44 | 98.71 | 98.64 |
| Table cell bbox - COCO mAP | ||||
| Base | 94.61 | 94.39 | 91.42 | 95.38 |
| Large | 95.90 | 96.50 | 94.96 | 97.55 |