Enhanced near-complete absorption of electromagnetic waves by dual resonance in a magnetized plasma
Abstract
There has been significant interest lately in the study of Electromagnetic (EM) waves interacting with magnetized plasmas. The variety of resonances and the existence of several pass and stop bands in the dispersion curve for different orientations of the magnetic field offer new mechanisms of EM wave energy absorption Maity et al. (2022); Juneja et al. (2023); Vashistha et al. (2022, 2020). By an appropriate choice of inhomogeneous magnetic field, one can construct a configuration wherein the same EM wave pulse encounters more than one resonance in the plasma. A 2-D Particle - In - Cell (PIC) simulation using the OSIRIS4.0 platform has been carried out for the case of dual resonance. It is observed that in the presence of dual resonance, there is a significant enhancement in leading to almost complete absorption of laser energy by the plasma in certain cases. A detailed study of the influence of the relative location of the resonances, the effect of high input EM wave intensity, etc., has also been carried out.
I Introduction
Collision-less Electromagnetic (EM) wave energy absorption in plasma medium has attracted interest due to a variety of applications in various contexts. For instance, applications like fusion plasma, ion acceleration, plasma heating, and direct laser acceleration (DLA) (Kaw, 2017; Das, 2020; Nishida et al., 1987; Ganguli et al., 2016, 2019; Gibbon and Förster, 1996; Pukhov et al., 1999; Khan and Saxena, 2023) employ EM wave energy absorption to achieve their objectives. Thus theoreticians and experimentalists are always looking for new methods of enhancing the energy absorption of EM waves in plasma. The known methods in the context of un-magnetized plasma rely on collisional schemes. Non-collisional mechanisms like resonant, vacuum heating, processes, etc. are also employed, especially at high energies where the collisional transfer turns out to be inefficient. The resonant absorption occurs when the frequency of the EM wave matches the local plasma frequency and hence the absorption is confined only to the resonant layer in an inhomogeneous plasma. The other two mechanisms (vacuum and ) rely on the randomization of electron trajectories as they get pulled out and pushed inside the plasma at the vacuum plasma interface Brunel (1987); Kruer (1988). The mode conversion from EM to electrostatic plasma wave at resonance has been extensively studied theoretically Ginzburg (1961) and demonstrated experimentally by Kim et al. (1974) in the context of microwaves interacting with plasma. The nonlinear effects in the context of microwave plasma interaction have not been of much relevance so far, as microwave sources have only been available at low powers. For lasers, the availability of high-power sources (e.g. up to 10 PW now) makes nonlinear phenomena inevitable. Thus features like High harmonic generation, parametric instability, wakefield generation, wave-breaking, etc., are routinely observed in the context of laser-plasma interaction. Some of the nonlinear processes often influence the process of energy absorption.
Newer ways and means to enhance energy absorption of EM waves in plasma have always been of paramount interest. For unmagnetized plasma one merely has the plasma resonance at the critical density layer. The magnetized plasma offers a larger variety of normal modes compared to the unmagnetized case. It also permits the propagation of EM waves inside the overdense plasma medium. The laser-plasma interaction studies, however, have remained restricted to the un-magnetized regime. The laser frequency is very high, even eliciting a magnetized response from a lighter electron species in this case requires a magnetic field of the order of of kilo Tesla. This was out of the realm until recently. Recent technological advancements have produced magnetic fields in the range of kilo Tesla in the laboratory Nakamura et al. (2018) and there are proposals for attaining fields as high as that of Mega Tesla level Korneev et al. (2015). This development, therefore, also opens up the possibility of exploring the nonlinear regime of laser interacting with magnetized plasma.
Microwave frequency being low, its interaction with plasma threaded with external magnetic fields often elicits a magnetized response from plasma for which the gyrofrequency of one or both the species can be made higher than the microwave radiation frequency rather easily. However, as discussed above the low power of microwaves has restricted these studies only to the linear domain. Recently, pulsed High-powered Microwave sources of and frequency have been achieved in experiments using relativistic backward wave oscillators (Xiao et al., 2016, 2020). This recent development of pulsed high-powered microwaves thus opens up an uncharted territory of nonlinear physics in the context of microwave plasma interaction in the magnetized plasma domain.
Thus the regime of EM wave interaction with magnetized plasma has attracted significant interest lately both for lasers as well as Microwave fields. Theoretical and simulation studies carried out recently in this direction have already spelled out several interesting effects. New mechanisms of laser energy absorption, higher harmonic generation, parametric processes, etc., have been observed in these simulations (Das, 2020; Vashistha et al., 2021; Mandal et al., 2020, 2021; Kumar et al., 2019; Goswami et al., 2022; Maity et al., 2021; Dhalia et al., 2023).
Most of these studies have, however, been confined to very idealized and specific geometries. The externally applied magnetic field is chosen to be constant in these earlier studies and its orientation is either along the or mode configurations, which correspond to the applied magnetic field either along the oscillating magnetic field direction or along the propagation direction respectively. We explore through 2-D Particle - In - Cell (PIC) studies using OSIRIS4.0 platform the interaction of EM waves with an obliquely oriented inhomogeneous magnetic field. We observe that such a choice provides the possibility of greater efficiency in the process of energy absorption. This essentially happens when the spatial profile of the external magnetic field permits two resonances with the EM pulse. The condition for such a dual resonance to form, the effect of the relative position amidst the two resonances, and the EM wave intensity dependence on the energy absorption process have been investigated in detail in this manuscript.
The paper is organized as follows. Section II describes the simulation geometry and the choice of parameters. In section III we carry out a comparative study of the energy absorption of EM waves in the presence and absence of dual resonance by considering various polarizations. In section IV, other detailed characteristics of the dual resonance are studied. For instance, the influence of the relative position of dual resonance in energy absorption, the underlying nonlinear features, and phase mixing processes are discussed. The intensity dependence on the efficiency of energy absorption is also studied. In section V we summarize our findings.
II Simulation Details
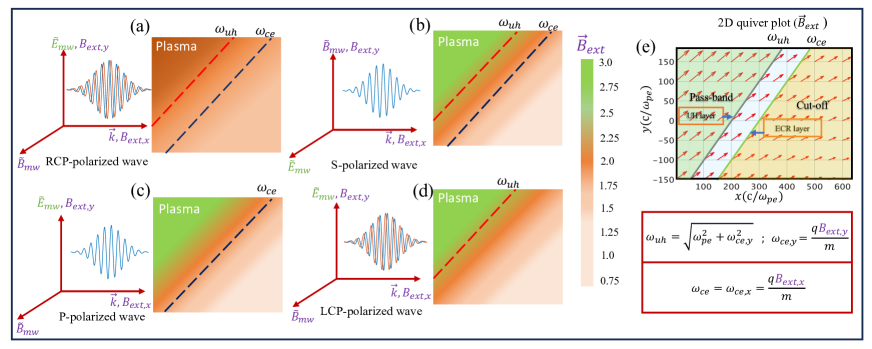
The simulation geometry is depicted in Fig.(1). The laser is incident normal to the plasma slab of constant density as it propagates along the axis. The plasma is underdense (). The externally applied magnetic field lies in the plane and is given by the expression:
| (1) |
Here is the normalizing magnetic field described later. The choice of various polarizations of the incident Electromagnetic wave pulse along with the respective resonance layers that they would encounter in the plasma for the above choice of the external magnetic field has been shown in the four subplots (a) to (d) of the figure. A fully relativistic, massively parallel PIC code, OSIRIS 4.0 (Hemker, 2000; Fonseca et al., 2002, 2008), has been used for simulation. OSIRIS uses normalized parameters, where the time and length scales are normalized by and , respectively. The simulation box has a longitudinal extent of and, along the transverse direction, runs from to . Here denotes the plasma skin depth , where and represent the speed of light and electron plasma frequency. We have a Plasma boundary that starts from to along the longitudinal direction, while in the transverse direction, it extends from to . For this study, fully ionized electron-ion plasma is considered. Where the ion-electron mass ratio is 1837, the grid sizes are taken to be . The time step for the simulation has been chosen The number of macro-particles is chosen per cell. The incident EM pulse profile has been chosen to be of polynomial form in the longitudinal direction while it has a Gaussian profile along the transverse direction. The EM wave enters from the wall on the left side, with a pulse duration of longitudinally and transverse width of . Traveling in a forward direction it has a focus at on the vacuum plasma interface. The electric and magnetic fields are normalized by where and are electronic mass and charge, respectively. The choice of normalized parameters has been shown in the Table 1. The corresponding values for the microwave as well as the laser system have also been depicted.
| Parameters | Normalized values | Microwave System | Laser System |
| Frequency() | 1.2 | ||
| Wavelength() | 5.23 | 44.88 | |
| Intensity () | |||
| Plasma Parameters | |||
| Density | 1 | ||
| Electron Plasma frequency( | 1 | ||
| Electron skin depth( | 1 | 8.57 mm | |
The applied external magnetic field’s spatial profile ensures that RCP and the S-polarized EM waves encounter two resonances along their path. These correspond to the X and R-L mode dispersion relations. The location of these resonances has been displayed by red and black dashed lines in Subplot(a,b) of fig.(1). While the red dashed line at corresponds to the upper hybrid resonance , the black dashed line in these subplots at layer corresponds to electron cyclotron resonance . The choice of parameters for the simulation is such that for the p-polarised electron cyclotron resonance and LCP waves, only the upper hybrid resonance is encountered. The resonance layer for these cases is shown by the black and red dashed line in the subplots (c,d) of Fig(1).
III Energy Absorption
The Electric field vector of the EM wave pulse for four different polarizations is considered in our simulation geometry here. They can be can be represented as:
| (2) |
For RCP (the right-hand circular polarization) and LCP (the left-hand circular polarization), we have and respectively. The S -polarization corresponds to and (the electric field of EM wave lies out of the 2-D plane considered for simulation), for P - polarization (electric field of EM wave lies on the 2-D simulation plane) for which we have and . It should be noted that the external magnetic field (1) has both and components which vary in space. Thus for P - polarization, which has only the component of the electric field, only the resonances of and mode dispersion can be encountered. Since the plasma is underdense by choice, the P-polarised EM pulse in our simulations will encounter only the ECR resonance corresponding to mode . We have, however, chosen the parameters in such a fashion that the half of LCP wave only encounters the mode dispersion resonance . The ion cyclotron resonance corresponding to mode dispersion curve does not lie in the simulation geometry. The RCP and the S wave, however, encounter two resonances corresponding to both (UH resonance) and (electron cyclotron resonance). The parameters are thus specifically chosen to have and polarized waves encounter two resonances, whereas the and waves encounter only one resonance. With all other parameters being the same the comparison will elucidate the effect of dual resonance.
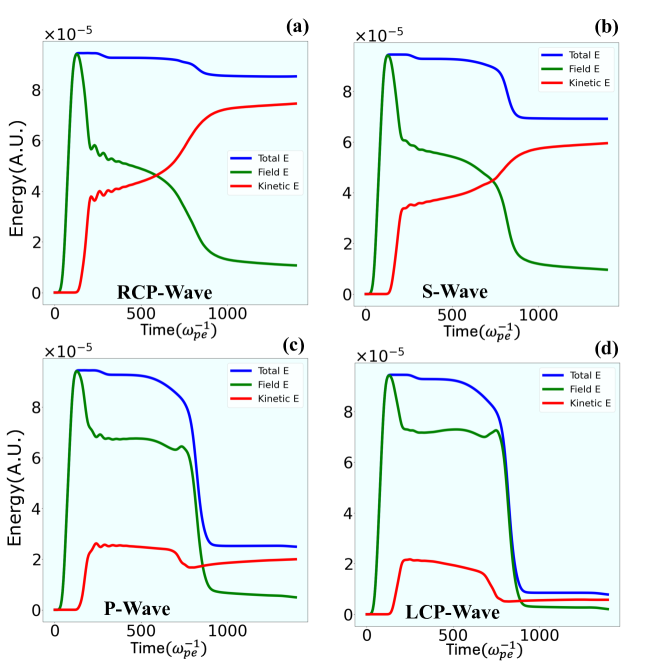
Figure 2 depicts the evolution of total energy, the electromagnetic field energy, and the kinetic energy of electrons for the four different cases of polarization that we have considered. The two dips in the total energy essentially occur when the EM wave pulse leaves the simulation box. The first dip corresponds to a small reflected wave leaving the simulation box whereas the second one occurs when the propagating EM pulse leaves the simulation box from the other side. It should be noted that we are considering an underdense plasma.
In all four subplots of the figure, wherever the electromagnetic energy dips there is a concomitant increase in the value of electron kinetic energy. This shows that there is an energy transfer from the field energy to the electron kinetic energy. Since the parameters have been tailored so that the EM wave encounters only electron-related resonances the energy transfer occurs only in the electron species here.
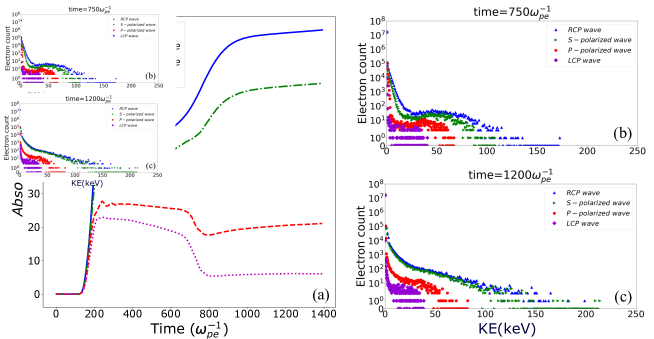
This comparison between the four chosen polarized cases elucidates that for RCP and S-Polarized wave Field energy gradually decreases in time while kinetic energy surges. Which indicates a direct transfer of electromagnetic field energy into kinetic energy of electrons. On the other hand, for P-polarized and LCP waves only a very small portion has been converted into kinetic energy of electrons. It is also worth noting that the RCP and the S wave encounter dual resonance and the energy transfer process from the field energy to the particle kinetic energy is high. Whereas for the LCP wave and the P wave which only encounter one resonance, and most of the energy leaves the simulation box. The of energy absorption (as kinetic energy of electrons) for the four different cases are compared in figure 3. The plot clearly shows that for the cases of RCP and S wave the absorption is high. The absorption percentage in the case of RCP is as high as about However, for LCP and P polarization the absorption efficiency is quite low.
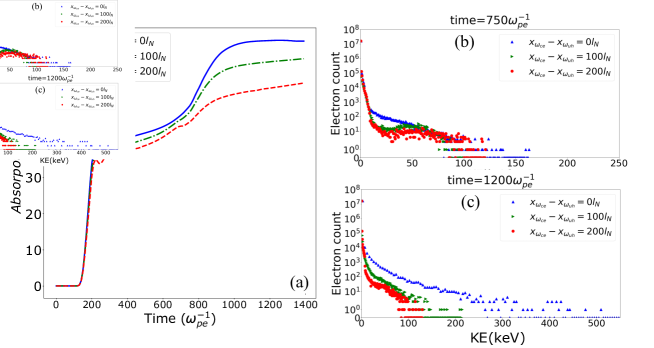
One can see that there are about four distinct phases of energy evolution. These phases occur as the EM wave is found to split into fast and slow-moving components. Even higher harmonic generation and phase mixing processes take place which we will discuss in a subsequent section. The first phase starts a little ahead of when the EM wave hits the plasma boundary. There is a steep rise in the energy absorption here as the electrons quiver with the incident EM wave field. After this, there is a slow phase of increased energy absorption till about or so for RCP and S -polarised waves. On the other hand, absorption gradually decreases in the case of P-polarized and LCP waves during this interval. At around fast wave component crosses the plasma boundary at . Thereafter, only the slow wave component is left in the simulation plasma box. This slow wave is responsible for the second phase of slope change in the energy absorption plot. We have shown the electron energy distribution for all four cases at figure 3. One can observe two clear humps in the distribution function indicating a two-temperature behavior that the distribution function acquires. The cut-off of the electron kinetic energy is also higher for RCP and S - polarized incident waves, as expected. The maximum cut-off energy of electrons is and for the RCP and S-polarized EM wave respectively at this time. At a later time after when the absorption for all four cases nearly saturates absorption is achieved for RCP wave, absorption of S-polarized EM wave, for P-polarized EM wave and just absorption for LCP wave. This shows that the presence of dual resonance polarization plays a major role in energy absorption. Figure 3 shows the distribution of electrons at this time. The hump seems to have almost disappeared indicating that the process of thermalization occurs during this interval. The maximum cut-off energy of electrons reaches about for RCP waves. For LCP and P-polarized wave, the maximum cut-off is a meager and respectively for the choice of our laser parameters.
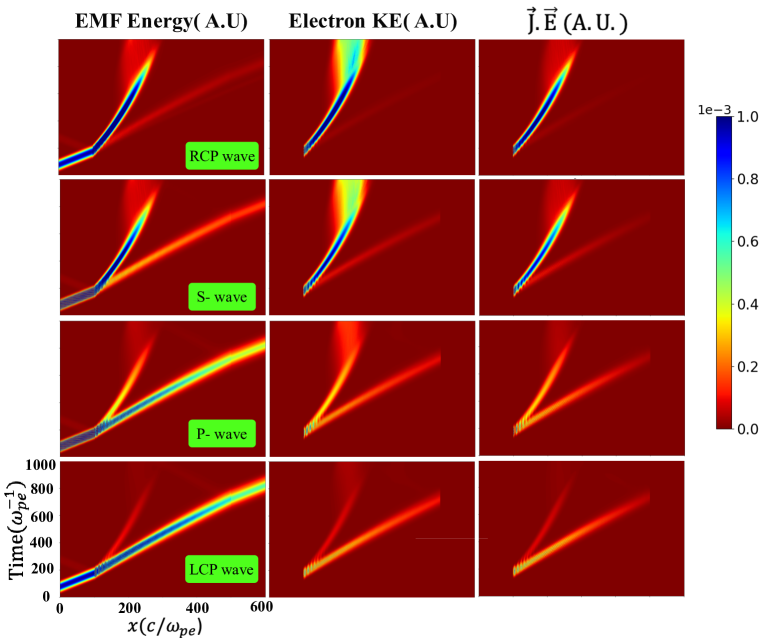
The splitting of the EM wave in the fast and slow propagating waves can be observed from Fig.(4). The first column of the subplots in this figure shows the evolution of the EM wave energy as a function of coordinate for the four cases of distinct polarizations of the incident wave chosen by us. The dependence has been averaged over. It can be seen that for all these cases the EM wave splits into fast and slow components. The coordinate being time, the slow wave has a steeper slope. It can be observed that for the RCP and the S-polarization most of the wave energy goes into the slow wave component. The electron kinetic energy shown in the middle column maximizes at the location of the slow wave component. The plot of the averaged indicating the energy transfer process is shown in the last column. Its intensity is high at the same space-time location where the electron kinetic energy is found to be high. Unlike RCP and S-polarization we observe that for the LCP and P - polarized wave, the fast wave component carries the major content of energy. However, Fig.(4) clearly shows that this energy does not get absorbed and ultimately gets carried away by the wave outside from the right-hand side of the plasma boundary.
In the next section, we study the characteristic behavior of the dual resonance and the factors influencing the process of energy absorption.
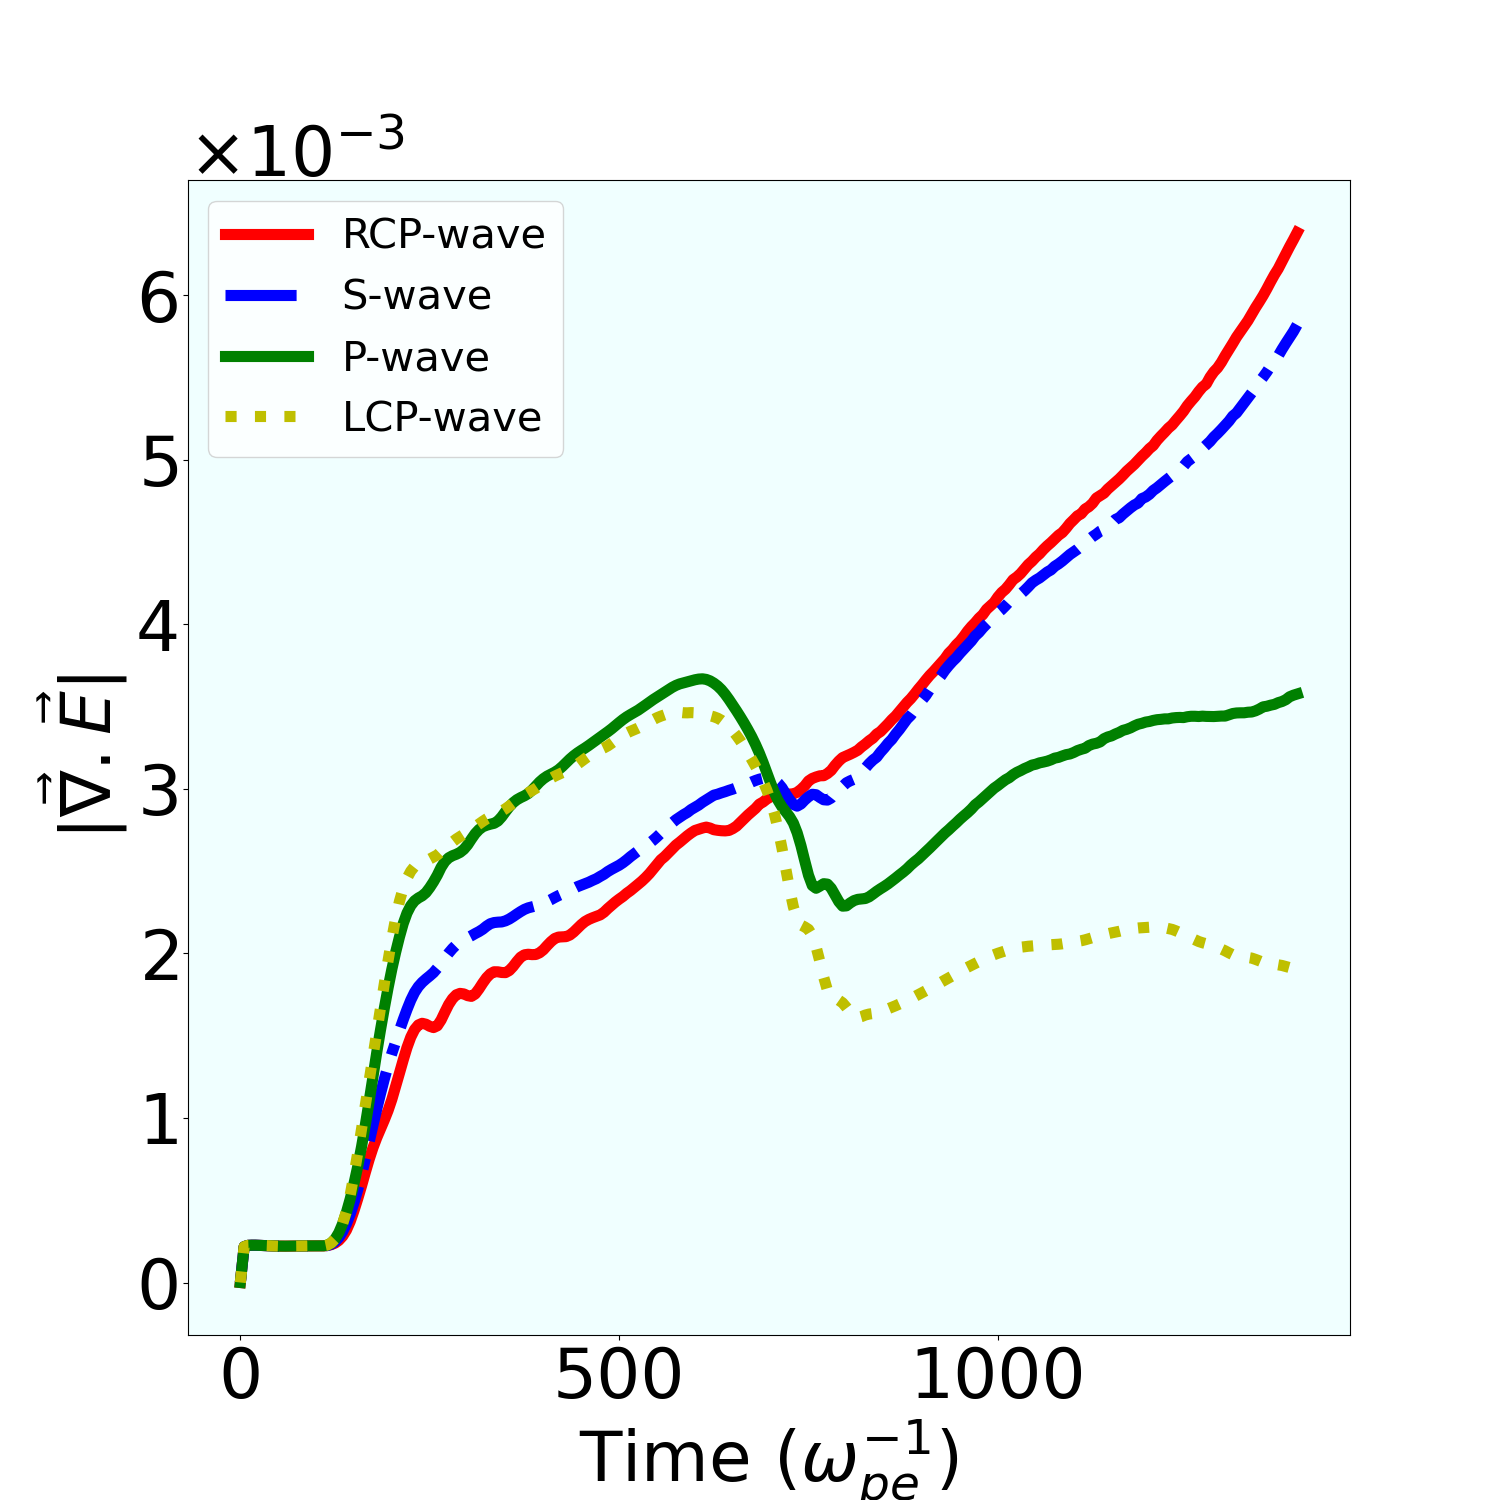
It was shown in one of our earlier works (Juneja et al., 2023) that when the EM wave encounters a cyclotron resonance there is a direct transfer of EM wave energy to the kinetic energy of the species. However, at plasma wave resonance and hybrid resonances such as (Lower Hybrid and upper hybrid), it is always mediated by an electrostatic field generation. We have plotted an evolution of the average of in Fig.(5) for all four cases to understand the generation of electrostatic fluctuation in the plasma medium as these waves propagate. It should be noted that the value of shows a very rapid rise initially for both the LCP and the P-polarised waves. However, this is only during the process while the fast EM wave component remains in the simulation box. It primarily seems to be associated with the reversible energy exchange between the fast EM wave field and the quiver velocity of electrons. As soon as this component leaves the simulation box the value of diminishes. This time also corresponds to the electron kinetic energy dip in the energy plot of Fig.(3) for LCP and the P-polarised waves. On the other hand, the RCP wave and S-polarised waves which encounter the electron cyclotron resonance as well as the upper hybrid resonance both, the increase in is comparatively at a slower pace but continues till the very end. Even though the energy absorption is higher right from the very beginning for this case, it seems the cyclotron resonance transfer which is direct and not through the intermediary electrostatic field generation plays a significant role.
IV Other characteristic features
In this section, we discuss some other characteristic features of the absorption process that have been observed in the context of the present studies on dual resonance. In particular, we address three distinct features in the three subsections below. The first concerns the influence of the relative location of the dual resonance and its impact on energy absorption. The second relates to the underlying nonlinear and phase mixing processes which in general occur along with the absorption of EM wave energy. Lastly, the impact of nonlinear processes on absorption has also been studied.
IV.1 Relative location of resonance points
Our simulations have demonstrated that the appearance of dual resonance in the case of RCP and S - polarized incidence EM waves leads to better absorption. Here, we investigate the possibility of shifting the relative location of the resonance points to see how the energy absorption changes. For this purpose, we consider the S-polarized incident EM wave.
Apart from the case studied earlier where the two resonance layers of upper hybrid () and the electron cyclotron resonance () were about we have also studied now two more cases. In the first case, we choose both the two resonances to lie at the same layer, and in the second case, they are about apart. This is achieved by choosing the following form of the applied magnetic field.
| (3) |
| (4) |
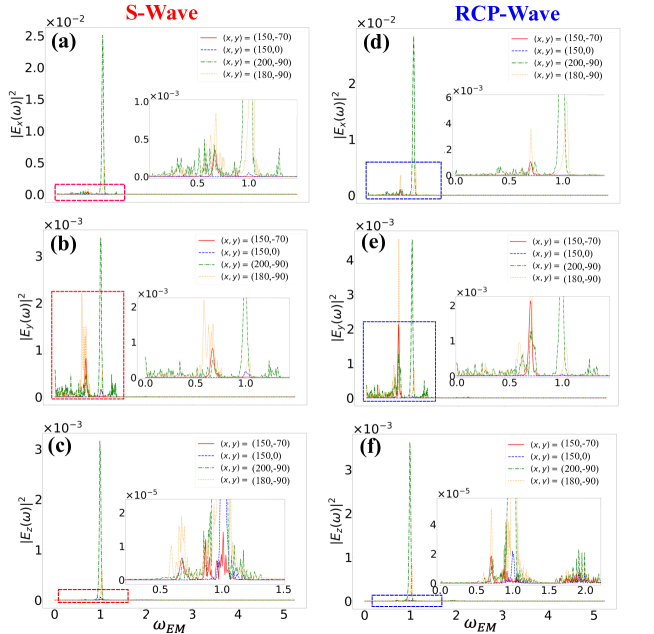
Figure 6(a) a comparison of the energy absorption has been made for the three distinct cases of the resonance layer separation. It can be observed that the absorption efficiency is highest when the two resonance layers overlap. Thus the absorption efficiency decreases as one increases the distance between the two resonances. The kinetic energy acquired by the electron species for all three cases at two different times has also been shown in other subplots of this figure 6 . They also illustrate that the cut-off energy of electrons is higher when the distance is smaller.
This can be understood by realizing that the presence of the first resonance that the wave encounters slows down the group speed of the EM wave. Thus when it encounters the second resonance the wave spends more time around the resonance layer leading to greater absorption. The closer the location of the two resonances is, the better it works for each of them.
IV.2 Nonlinear processes
At high intensity of EM waves, nonlinear processes may also occur. Furthermore, the choice of an inhomogeneous magnetic field makes the gyrofrequency a function of position. This can trigger the phase mixing processes to be operative inside the plasma making the spectrum broader. We identify some of these processes in this section. We focus on the RCP and the S-polarized EM wave, which have shown efficient absorption of EM wave energy by the plasma due to the presence of dual resonance in our studies.
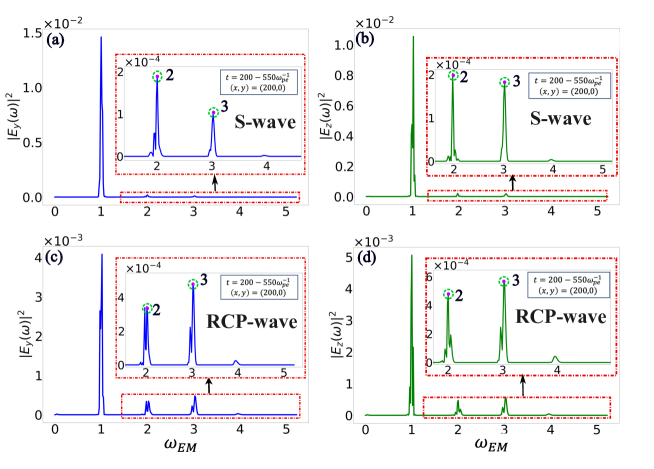
The nonlinearity of the plasma medium will generate additional frequencies in the system. To observe the generation of other frequencies we have carried out the Fourier transform of the electric field signal observed inside the plasma medium. We specifically chose the time interval where the absorption was high. Thus, the time interval of and was chosen to collect the signal which was then Fourier analyzed to ascertain the frequency spectrum.
For Figure 7 the data was collected from the spatial location of . It clearly shows that both the second and the third harmonic have gotten excited near the vacuum-plasma interface. Since these higher harmonics have frequencies much greater than gyro-frequency , they do not follow the magnetized plasma dispersion curve and propagate undeflected exiting from the right boundary. A detailed study of the higher harmonics generation at the vacuum plasma interface in the context of magnetized plasma has been carried out earlier in Maity et al. (2021); Dhalia et al. (2023). Our simulations also support this. It is thus clear that at a higher intensity (when the nonlinear effects will be more pronounced) a significant portion of the energy will get lost through the process of harmonic generation. This is illustrated in the next subsection.
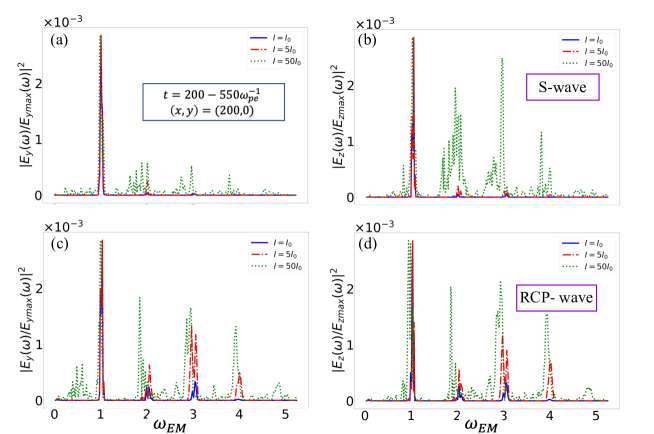
The simulation data also identifies the occurrence of the phenomena of phase mixing Maity et al. (2012).The frequency spectra of , , and were analyzed at four distinct spacetime locations and have been shown in Fig.(8). The Fourier analysis has been carried out for the time interval to for both Right Circularly Polarized (RCP) waves and S-polarized waves. It is clear from the figure that the frequency spectrum gets broadened with time at a later stage. We feel this occurs due to phase mixing processes.

IV.3 Energy absorption at higher Intensity
When the intensity of the incident EM wave pulse is increased, though the available energy is high the nonlinear processes described in subsection(IV.2) would keep becoming dominant. A significant portion of energy would then get transferred into the higher harmonics. This would simply result in the EM wave leaking out from the boundary. We carried out some studies with different intensities of the incident pulse. We observe that the energy gets converted predominantly to higher harmonics at higher intensity of the incident EM wave, thereby reducing the efficiency of the energy absorption process.
In Figure 9 and , the temporal evolution of the percentage of energy absorbed by electrons in the plasma is illustrated for three different intensities of S-polarized and Right Circularly Polarized (RCP) waves, respectively. There is a notable decrease in the energy absorption with increasing intensity for both S-polarized and RCP waves. For the S-polarized EM wave, the percentage absorption decreases from , to , and further to . Similarly, for the RCP wave, absorption decreases from , to , and further to . At , absorption becomes almost the same for both RCP and S-polarized EM waves. The reason behind this is that, with increasing intensity, surface phenomena become more active, leading to an increase in the efficiency of higher harmonics Dhalia et al. (2023). Since higher harmonics generated at the interface do not contribute to energy transfer and pass through the plasma unhindered, less energy gets absorbed by the bulk plasma. The increased intensity of harmonic generation can be observed from the plots of time FFT’s of and in figure 10 ,, and . Here, and are amplitude of incident EM wave at in vacuum.
V Summary
In this paper, a comprehensive study of EM wave interaction with magnetized plasma in the presence of an inhomogeneous external magnetic field has been studied. Two-dimensional PIC simulations using the OSIRIS 4.0 platform have been carried out for this purpose. Our analysis reveals that the presence of dual resonance can enhance the bulk energy absorption process with appropriate polarization of wave pulse. This has been illustrated using the resonance layers of the upper hybrid and the electron cyclotron resonances. The efficiency of absorption can be improved if the resonance layers happen to be close to each other. At higher intensities of the incident wave nonlinear processes like harmonic generation keeps draining out the energy. It is shown that the efficiency of the absorption process reduces with the increased EM wave intensity as most of the energy gets converted into higher harmonics at the plasma vacuum interface. As the higher harmonics observe an unmagnetized dispersion relation the energy simply leaks out with the wave as they propagate out of the plasma from the other end.
Acknowledgements
The authors would like to acknowledge the OSIRIS Consortium, consisting of UCLA and IST (Lisbon, Portugal), for providing access to the OSIRIS-4.0 framework, which is the work supported by the NSF ACI-1339893. AD would like to acknowledge her J.C. bose fellowship grant of AD(JCB/2017/000055) as well as CRG/2022/002782, grant of Department of Science and Technology (DST) Government of India. The authors would like to thank IIT Delhi HPC facility for computational resources. T.D. would also wishes to thank Council for Scientific and Industrial Research (Grant no- 09/086/(1489)/2021-EMR-I) for funding the research.
Conflict of Interest
Authors report no conflict of interest
References
- Maity et al. (2022) S. Maity, L. P. Goswami, A. Vashistha, D. Mandal, and A. Das, Phys. Rev. E 105, 055209 (2022).
- Juneja et al. (2023) R. Juneja, T. Dhalia, L. P. Goswami, S. Maity, D. Mandal, and A. Das, Plasma Physics and Controlled Fusion 65, 095005 (2023).
- Vashistha et al. (2022) A. Vashistha, D. Mandal, S. Maity, and A. Das, Plasma Physics and Controlled Fusion (2022).
- Vashistha et al. (2020) A. Vashistha, D. Mandal, A. Kumar, C. Shukla, and A. Das, New Journal of Physics 22, 063023 (2020).
- Kaw (2017) P. Kaw, Reviews of Modern Plasma Physics 1, 1 (2017).
- Das (2020) A. Das, Reviews of Modern Plasma Physics 4, 10 (2020).
- Nishida et al. (1987) Y. Nishida, N. Sato, and T. Nagasawa, IEEE transactions on plasma science 15, 243 (1987).
- Ganguli et al. (2016) A. Ganguli, R. Tarey, N. Arora, and R. Narayanan, Plasma Sources Science and Technology 25, 025026 (2016).
- Ganguli et al. (2019) A. Ganguli, R. Tarey, R. Narayanan, and A. Verma, Plasma Sources Science and Technology 28, 035014 (2019).
- Gibbon and Förster (1996) P. Gibbon and E. Förster, Plasma physics and controlled fusion 38, 769 (1996).
- Pukhov et al. (1999) A. Pukhov, Z.-M. Sheng, and J. Meyer-ter Vehn, Physics of Plasmas 6, 2847 (1999).
- Khan and Saxena (2023) I. Khan and V. Saxena, Physics of Plasmas 30 (2023).
- Brunel (1987) F. Brunel, Physical review letters 59, 52 (1987).
- Kruer (1988) W. L. Kruer, “The physics of laser plasma interaction,” (1988).
- Ginzburg (1961) V. Ginzburg, Science, Publishers, Inc. New York, NY (1961).
- Kim et al. (1974) H. Kim, R. Stenzel, and A. Wong, Physical Review Letters 33, 886 (1974).
- Nakamura et al. (2018) D. Nakamura, A. Ikeda, H. Sawabe, Y. Matsuda, and S. Takeyama, Review of Scientific Instruments 89, 095106 (2018).
- Korneev et al. (2015) P. Korneev, E. d’Humières, and V. Tikhonchuk, Physical Review E 91, 043107 (2015).
- Xiao et al. (2016) R. Xiao, C. Chen, Y. Deng, Y. Cao, J. Sun, and J. Li, Physics of Plasmas 23, 063114 (2016).
- Xiao et al. (2020) R. Xiao, Y. Shi, H. Wang, G. Zhang, Y. Gui, Z. Song, X. Bai, Y. Zhang, and J. Sun, Physics of Plasmas 27, 043102 (2020).
- Vashistha et al. (2021) A. Vashistha, D. Mandal, and A. Das, Nuclear Fusion 61, 026016 (2021).
- Mandal et al. (2020) D. Mandal, A. Vashistha, and A. Das, Journal of Plasma Physics 86, 905860606 (2020).
- Mandal et al. (2021) D. Mandal, A. Vashistha, and A. Das, Scientific Reports 11, 1 (2021).
- Kumar et al. (2019) A. Kumar, C. Shukla, D. Verma, A. Das, and P. Kaw, Plasma Physics and Controlled Fusion 61, 065009 (2019).
- Goswami et al. (2022) L. P. Goswami, T. Dhalia, R. Juneja, S. Maity, S. Das, and A. Das, Physica Scripta 98, 015602 (2022).
- Maity et al. (2021) S. Maity, D. Mandal, A. Vashistha, L. P. Goswami, and A. Das, Journal of Plasma Physics 87 (2021).
- Dhalia et al. (2023) T. Dhalia, R. Juneja, L. P. Goswami, S. Maity, and A. Das, Journal of Physics D: Applied Physics (2023).
- Hemker (2000) R. G. Hemker, Particle-in-cell modeling of plasma-based accelerators in two and three dimensions (University of California, Los Angeles, 2000).
- Fonseca et al. (2002) R. A. Fonseca, L. O. Silva, F. S. Tsung, V. K. Decyk, W. Lu, C. Ren, W. B. Mori, S. Deng, S. Lee, T. Katsouleas, et al., in International Conference on Computational Science (Springer, 2002) pp. 342–351.
- Fonseca et al. (2008) R. Fonseca, S. Martins, L. Silva, J. Tonge, F. Tsung, and W. Mori, Plasma Physics and Controlled Fusion 50, 124034 (2008).
- Maity et al. (2012) C. Maity, N. Chakrabarti, and S. Sengupta, Physical Review E 86, 016408 (2012).