11institutetext: Department of Computer Science, Aalto University, Helsinki, Finland 22institutetext: Hamburg University of Technology, Hamburg, Germany 33institutetext: Department of Computer Science, University of Manchester, Manchester, UK
33email: {firstname.lastname}@aalto.fi

Supplementary Material for
Cooperative Bayesian optimization for imperfect agents

Ali Khoshvishkaie 11    Petrus Mikkola 11    Pierre-Alexandre Murena 1122    Samuel Kaski 1133

1 Experiment 1: Impact of a known user model

Table 1 compares our strategic planning performance scores to an unrealistic case when having a perfect user model for all prior initialization conditions. Surprisingly, our method is performing comparably well, showing that the user model is able to capture essential characteristics of the user eventually.

Table 1: Impact of the knowing the user’s prior knowledge and parameters onto the optimization score. The tested priors are: knowledge around the global optimum (G), knowledge around a local optimum (L) and no prior knowledge (N). Each prior condition is indicated with a subscript: AI for the AI agent, u for the user.
Prior StrategicAI (ours) StrategicAI+U
GAI & Gu 76.3±23.3plus-or-minus76.323.3\mathbf{76.3\pm 23.3} 72.0±22.2plus-or-minus72.022.272.0\pm 22.2
GAI & Lu 75.4±23.7plus-or-minus75.423.7\mathbf{75.4\pm 23.7} 73.9±25.0plus-or-minus73.925.073.9\pm 25.0
GAI & Nu 74.0±25.1plus-or-minus74.025.1\mathbf{74.0\pm 25.1} 70.8±24.7plus-or-minus70.824.770.8\pm 24.7
LAI & Gu 79.0±23.0plus-or-minus79.023.0{79.0\pm 23.0} 81.7±22.4plus-or-minus81.722.4\mathbf{81.7\pm 22.4}
LAI & Lu 82.1±23.8plus-or-minus82.123.8{82.1\pm 23.8} 83.7±23.9plus-or-minus83.723.9\mathbf{83.7\pm 23.9}
LAI & Nu 80.0±23.5plus-or-minus80.023.5{80.0\pm 23.5} 80.7±23.9plus-or-minus80.723.9\mathbf{80.7\pm 23.9}
NAI & Nu 69.5±23.3plus-or-minus69.523.369.5\pm 23.3 71.2±24.7plus-or-minus71.224.7\mathbf{71.2\pm 24.7}

2 Experiment 2: Full Variability Study

Table 2 presents the performance scores for all prior initialization conditions, and for all values of the parameters of the user model.

Table 2: Impact of the agents’ prior knowledge onto the optimization score. The tested priors are: knowledge around the global optimum (G), knowledge around a local optimum (L) and no prior knowledge (N). Each prior condition is indicated with a subscript: AI for the AI agent, u for the user.
β=0.2𝛽0.2\beta=0.2 β=0.7𝛽0.7\beta=0.7
Prior Method α=0.1𝛼0.1\alpha=0.1 α=0.6𝛼0.6\alpha=0.6 α=0.1𝛼0.1\alpha=0.1 α=0.6𝛼0.6\alpha=0.6
GAI & Gu StrategicAI 77.2 ± 21.4 72.6 ± 20.4 80.8 ± 19.1 74.6 ± 18.6
GreedyAI 63.0 ± 15.5 64.2 ± 17.3 63.3 ± 13.9 64.0 ± 15.4
GAI & Lu StrategicAI 68.3 ± 21.5 76.4 ± 21.4 79.3 ± 21.4 77.8 ± 17.2
GreedyAI 66.9 ± 21.3 67.3 ± 20.5 68.4 ± 20.1 67.1 ± 20.4
GAI & Nu StrategicAI 80.1 ± 21.3 69.7 ± 21.8 72.9 ± 24.3 73.2 ± 21.4
GreedyAI 63.0 ± 15.5 57.9 ± 16.6 64.0 ± 17.4 60.3 ± 13.9
LAI & Gu StrategicAI 80.8 ± 19.9 78.1 ± 18.5 81.8 ± 19.3 75.3 ± 19.5
GreedyAI 77.2 ± 19.3 75.1 ± 20.4 76.8 ± 19.1 73.9 ± 18.3
LAI & Lu StrategicAI 83.5 ± 20.0 84.0 ± 20.3 85.8 ± 18.8 75.2 ± 20.6
GreedyAI 71.2 ± 23.5 69.3 ± 22.2 70.9 ± 23.5 69.2 ± 22.5
LAI & Nu StrategicAI 80.2 ± 20.8 79.7 ± 17.4 80.4 ± 20.3 79.8 ± 20.6
GreedyAI 76.2 ± 20.7 72.2 ± 19.0 77.0 ± 21.3 75.1 ± 20.3
NAI & Nu StrategicAI 72.6 ± 22.7 73.2 ± 18.2 74.0 ± 21.7 58.2 ± 18.9
GreedyAI 79.6 ± 16.6 79.6 ± 17.0 66.2 ± 17.9 63.1 ± 16.0

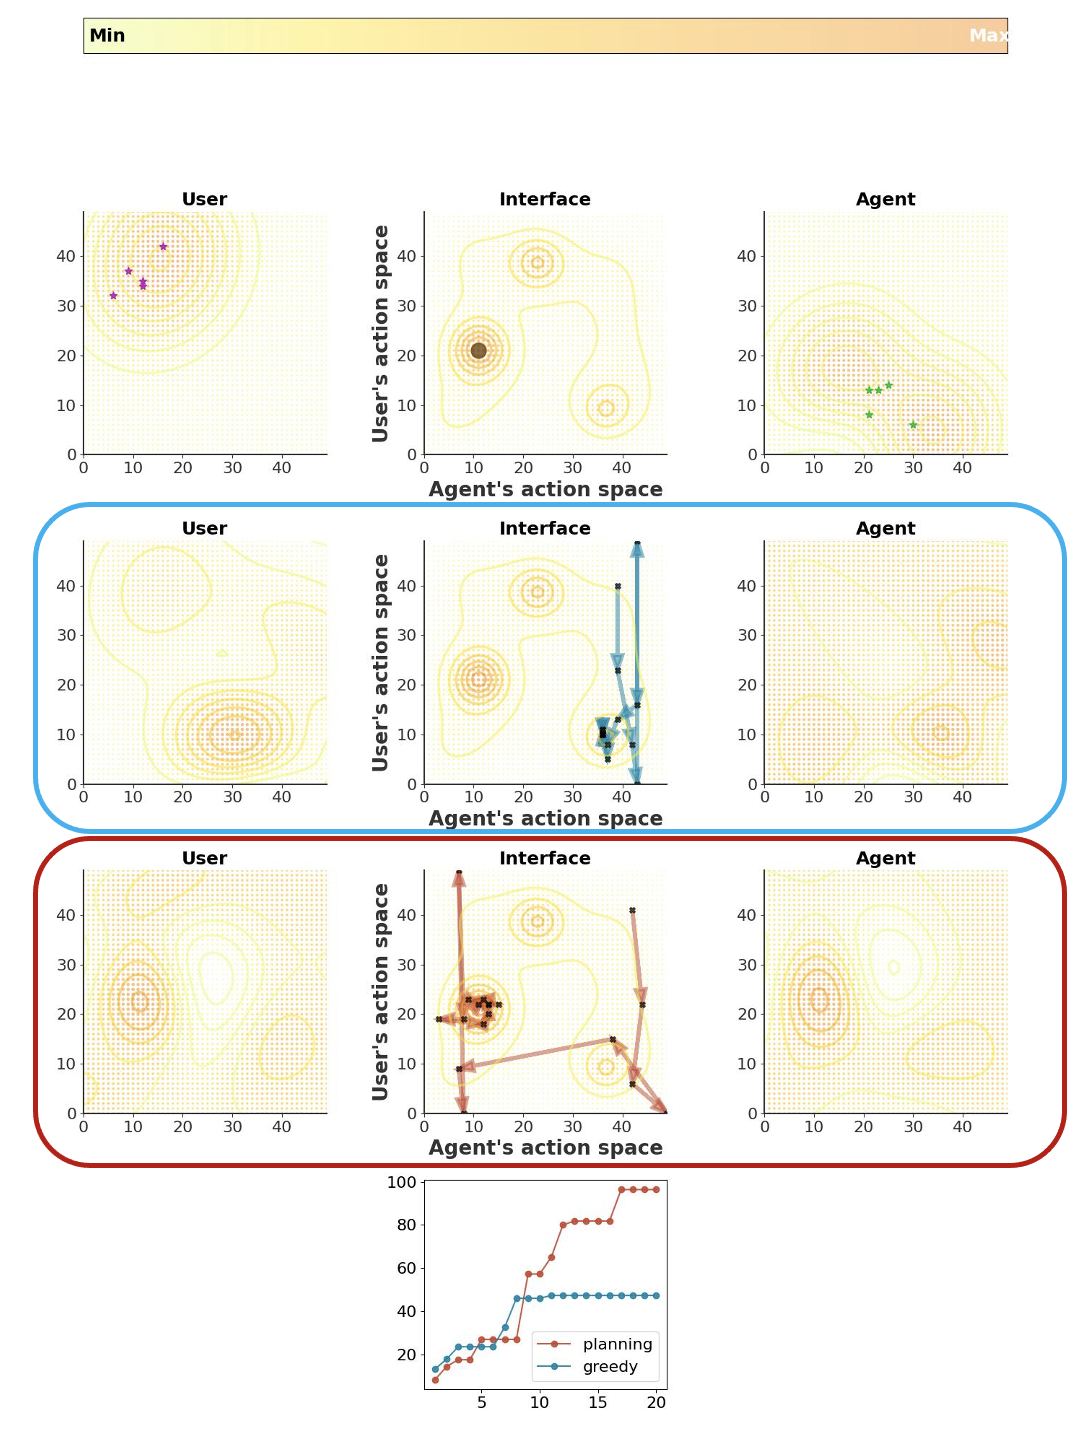
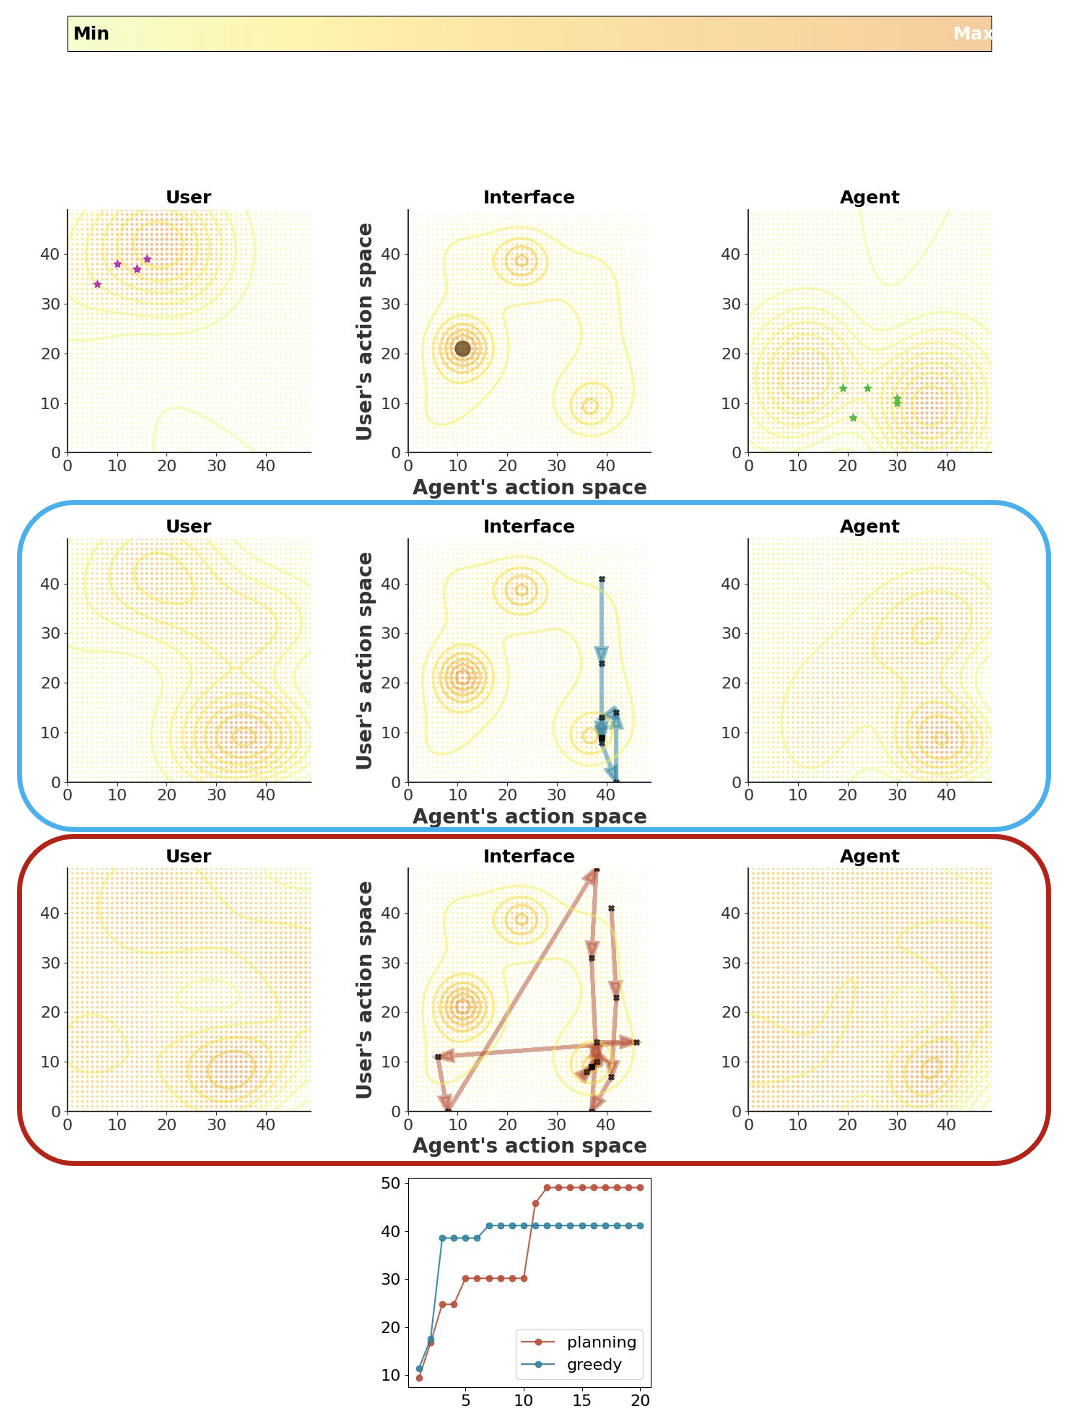
3 Acquisition trajectories

In order to illustrate our method, we display here two acquisition trajectories, i.e. trajectories {(xt,yt)}subscript𝑥𝑡subscript𝑦𝑡\{(x_{t},y_{t})\} in the domain 𝒳×𝒴𝒳𝒴\mathcal{X}\times\mathcal{Y} of function f𝑓f.

Refer to caption
Figure 1: Trajectory of query points during an interaction. The first column shows the user’s knowledge of the function (row 1: initial knowledge, gained from prior observations marked in purple; row 2 and 3: final knowledge), and third column the AI agent’s knowledge of the function. The second column displays real values of the function. The second and third rows demonstrate the scenarios of interaction between a specific user with GreedyAI and StrategicAI, respectively. The final subplot compares the optimization scores during the interaction. The strategic AI obviously outperforms the GreedyAI, helping the user explore the environment better and find the global optima. However, the the optimization performed with GreedyAI gets stuck at local optima and get a significantly lower score.
Refer to caption
Figure 2: Trajectory of query points during an interaction. The first column shows the user’s knowledge of the function (row 1: initial knowledge, gained from prior observations marked in purple; row 2 and 3: final knowledge), and third column the AI agent’s knowledge of the function. The second column displays real values of the function. The second and third rows demonstrate the scenarios of interaction between a specific user with GreedyAI and StrategicAI, respectively. The final subplot compares the optimization scores during the interaction. The StrategicAI explores the function better and outperforms the GreedyAI. However, both fail to find the global optimum.